Construction of a Flash Photolysis System for Excited State
34
Construction of a Flash Photolysis System for Excited State Analysis A Major Qualifying Project Report submitted to the Faculty of the WORCESTER POLYTECHNIC INSTITUTE in partial fulfillment of the requirements for the Degree of Bachelor of Science by ____________________________________________ Zachary E. Blais on April 26, 2012 Approved by: ____________________________________________ Professor Robert E. Connors, Project Advisor ____________________________________________ Professor Christopher R. Lambert, Project Advisor
Transcript of Construction of a Flash Photolysis System for Excited State

Construction of a
Flash Photolysis System for Excited State Analysis
A Major Qualifying Project Report
submitted to the Faculty
of the
WORCESTER POLYTECHNIC INSTITUTE
in partial fulfillment of the requirements for the
Degree of Bachelor of Science
by
____________________________________________
Zachary E. Blais
on
April 26, 2012
Approved by:
____________________________________________
Professor Robert E. Connors, Project Advisor
____________________________________________
Professor Christopher R. Lambert, Project Advisor

Table of Contents Abstract ................................................................................................................................................................................... 3
Introduction ............................................................................................................................................................................ 4
Apparatus ................................................................................................................................................................................ 6
Optics .................................................................................................................................................................................. 6
Layout .............................................................................................................................................................................. 6
Hardware ............................................................................................................................................................................ 7
Laser ................................................................................................................................................................................ 9
High Voltage Supply ...................................................................................................................................................... 10
Lamp .............................................................................................................................................................................. 10
Shutters ......................................................................................................................................................................... 10
Oscilloscope .................................................................................................................................................................. 11
Monochromator ............................................................................................................................................................ 11
Photomultiplier Tube .................................................................................................................................................... 11
Monochromator Controller .......................................................................................................................................... 12
Backoff Generator ......................................................................................................................................................... 12
Pulse Generators ........................................................................................................................................................... 13
Logical NAND Gates ...................................................................................................................................................... 13
Timing Requirements .................................................................................................................................................... 14
Software ............................................................................................................................................................................ 16
Summary of Program Flow ........................................................................................................................................... 16
Experimental Setup ....................................................................................................................................................... 18
Experimental Processing ............................................................................................................................................... 20
Firing Routine ................................................................................................................................................................ 22
Completion of Experiment ............................................................................................................................................ 24
Testing & Verification............................................................................................................................................................ 25
Conclusions & Recommendations ........................................................................................................................................ 27
Summary ........................................................................................................................................................................... 27
Surface Flash Photolysis .................................................................................................................................................... 27
Recommendations for Future Improvement .................................................................................................................... 28
Hardware....................................................................................................................................................................... 28
Software ........................................................................................................................................................................ 29
Optics ............................................................................................................................................................................ 30
Acknowledgements ............................................................................................................................................................... 31
References ............................................................................................................................................................................ 32
Appendix I. Items Requiring Urgent Attention ..................................................................................................................... 33
Hardware .......................................................................................................................................................................... 33
Software ............................................................................................................................................................................ 33
Optics ................................................................................................................................................................................ 34

Abstract
A laser flash photolysis system was designed, programmed, and assembled at Gateway Park. The instrument uses a
Nd:YAG laser operating at 532 nm in 8 ns pulses and is capable of measuring transients from 100 ns to milliseconds in
width at wavelengths of 250-900 nm. Each experimental run produces a set of 500 data points, each representing the
difference in optical density between the non-lased and lased states. The instrument can monitor any process in which
the absorption of the sample changes upon excitation.

Introduction
Flash photolysis is a time-resolved technique in which a change in absorption is measured in response to an intense
pulse of light. It is a useful technique because the transients it produces can be thousands or millions of times longer
than those produced by fluorescence alone, allowing the monitoring of much longer-scale reactions and processes. The
procedure was first developed in 1945 by Lord George Porter, a physical chemist. Lord Porter’s seminal work in the field
earned him the Nobel Prize in Chemistry in 1967 along with Manfred Eigen and Ronald G. W. Norrish “for their studies of
extremely fast chemical reactions, effected by disturbing the equilibrium by means of very short pulses of energy”
(Nobel Foundation, 1972). In their apparatus a 7.5 kW mercury arc searchlight was used to create a flash that lasted a
full 2 ms, producing CH2 radicals from ketene or diazomethane (Norrish and Porter, 1947; Thrush, 2003). In 1999, only
54 years after this first photolysis apparatus was developed, Ahmed Zewail was awarded the Nobel Prize in Chemistry
for the development of femtosecond-laser pulsing in photolysis (Smith, 1999).
Figure 1. A modified Jabłoński diagram describing the processes undergone during flash photolysis.
Molecules are predominantly in the ground state to begin, as follows from the Boltzmann distribution (Seddon et al.,
2001)

�� = ��� = exp −��� ��∑ exp �−��� ���
where �� = ��� is the number density of molecules in energy state �, �� is the internal energy of � in joules,
� = 1.38065 ∗ 10!"# $% is the Boltzmann constant, and � is the temperature in kelvins. Based on this distribution, at a
temperature of 300 K the ground state population contains 98% of the total population (Atkins and de Paula, 2001).
In flash photolysis, a monitoring light is shone through a sample into a monochromator and photomultiplier tube. A
laser is pulsed that excites a significant population of ground (S0) state molecules into an excited singlet (S1) state. Some
of the molecules reaching the S1 state are converted via intersystem crossing to the lowest excited triplet state, T1. By
using a concentrated laser pulse to excite the molecules, an observable number of molecules is excited into the S1 and T1
states and the changes in absorption caused by these excitations can be detected by the photomultiplier tube. The laser
in this apparatus is equipped to provide up to 200 mJ over 8 ns, although in practical use energies of 10 mJ or less will
commonly suffice.
The triplet state is typically much longer lived than the singlet state. The process of fluorescence (i.e. S1 to S0) is
quantum-mechanically allowed, and so it occurs very quickly on the order of nanoseconds. The process of
phosphorescence, however, is quantum-mechanically forbidden. While this doesn’t disallow the process outright for
large molecules, it makes the conversion statistically much rarer, and so the overall process tends to occur over the
course of microseconds, milliseconds, or even longer. Because of this triplet state longevity, many excited state
processes proceed through the triplet state rather than the singlet state. It is also possible to use the triplet state to
monitor dynamic systems that occur on microsecond timescales where nanosecond fluorescence would simply occur
too quickly to provide useful data. In general, flash photolysis can be used to observe any process that effects a change
in absorption.
For 5,10,15,20-tetraphenylporphyrin (TPP), the porphyrin molecule used as an example in building this apparatus,
roughly 67% of the excited S1 population is converted to the excited T1 state by the laser pulse (Bonnett et al., 1988).
The triplet state may then be monitored with the spectrophotometer by its absorption from the T1 state to the higher T2
state. This absorption is observed as the difference in the absorptions of the ground (S0) state and excited (T1) state.

The porphyrin triplet state observed during the testing of this apparatus has been used to monitor low oxygen
concentrations (Dědic et al., 2006), as a photoactivated therapeutic (Bakar et al., 2009), and for label-free imaging
(Girgenti et al., 2004).
Figure 2. The molecular structure of 5,10,15,20-tetraphenylporphyrin (TPP).
Apparatus
The apparatus comprises three distinct components, all of which work in a cohesive fashion to produce usable data. The
optical layout of the instrument includes equipment used to control or produce light. The hardware configuration
includes equipment used to monitor conditions, record data points, and communicate with the computer. The software
includes all computer-run routines which control the hardware and send instructions to various parts of the apparatus.
Optics
Layout
Two separate paths are followed by light in a given experiment, as shown in Figure 3.
HN
N
NH
N

Figure 3. The optical layout of the apparatus.
White light is emitted from a monitoring lamp operating at 75 W and is initially blocked by a shutter capable of opening
within 5 ms. When the shutter is opened by the software routine, light is allowed to travel through a series of filters
toward the sample. A lens concentrates the light on a point inside the sample holder. Meanwhile, an 8 ns pulse is shot
from the laser into the same point in the sample. The laser pulse generates a high concentration of excited state
molecules, which effects a change in absorbance of the sample that can be detected by the photomultiplier tube.
At this point, light that is not absorbed by the compound is separated by a monochromator and directed into a
photomultiplier tube. The tube produces an analog voltage signal proportional to the intensity of the monochromatic
light exiting the monochromator.
Hardware
A large array of electronics is used in the instrument to properly measure the intensity of light allowed through the
sample. Figure 4 depicts the various instruments used and their connections.

Figure 4. A wiring diagram of the hardware used in the apparatus.
A GPIB chain, illustrated in green, connects the computer, backoff generator, oscilloscope, and pulse generators. The
computer is also linked to the monochromator by a serial connection and to the analog-to-digital board by PCI. The
majority of the electronics used in the experimental process are connected by BNC to the pulse generators, which form
the foundation of the timing scheme used by the instrument. The voltage control and the slow shutter, whose timing
precisions are not critical, are connected to the analog-to-digital board directly.
The laser-controlling pulse generator, labeled Pulse Generator #3 above, is also connected to the triggers of the other
two pulse generators by way of a NAND gate. This gate accepts a T0 pulse and an input from the computer, and returns
a logical low output if and only if both of these inputs are logical high pulses. Pulse Generator #1 is triggered upon
receiving a low input, and will in turn trigger Pulse Generator #2 using its own T0 output.

An analogous process occurs with the connection from Pulse Generator #3 to the laser’s Q-switch. The laser will receive
a low input from the other NAND gate if and only if Pulse Generator #3 sends a firing pulse while the computer is
broadcasting a high voltage.
Laser
A 532 nm neodymium-doped yttrium aluminum garnet (Nd:YAG) laser (Continuum, Santa Clara, CA) is used for this
apparatus. The fundamental wavelength of the laser is 1064 nm (infrared); the wavelength used here is the frequency-
doubled wavelength of 532 nm (visible, green). Tripled and quadrupled frequencies can also produce wavelengths of
355 nm (UV B) and 266 nm (UV C) respectively. The laser is configured to fire an 8 ns pulse, over which time 200 mJ of
energy are released.
The laser also contains, as a fail-safe function, an internal shutter that will close if the laser does not receive a signal to
fire its flash lamps for more than half a second. If the shutter closes, it cannot be overridden and the user must wait
thirty seconds before it will open again. Thus, in order to conduct tests, the laser must flash its lamps constantly at
about 10 Hz, with the Q-switch only being triggered when a pulse is actually desired. Otherwise, the internal shutter will
close before the firing pulses can be broadcast.
The laser operates by use of a Pockels cell, which acts to magnify the intensity of the laser’s beam. The energy of the
laser pulse is maximized when the Q-switch is triggered 180 μs after the flash lamp is fired. Both the lamp trigger and
the Q-switch trigger fire upon receiving an inverted pulse (i.e. high-low-high) of at least 30 μs in width.
These controlling pulses are provide by a dedicated pulse generator which uses an internal clock of 10 Hz to broadcast a
pulse to the flash lamp, followed by a pulse 180 μs later to a NAND gate leading to the Q-switch. If the software is
sending a request to fire while the Q-switch pulse is broadcast, the inverted output will proceed to the Q-switch and fire
the laser. Otherwise the output voltage will remain high and the laser will not fire.

High Voltage Supply
A high voltage power supply is used to control the amplification of the photomultiplier tube. The supply is controlled by
an analog signal no larger than 5 V. The supply voltage is inversely proportional to the amplitude of the control voltage,
following the function
&'())*+ = −241.06 ∗ &./�01/* + 280.44
Lamp
A monitoring lamp (Photon Technology Incorporated, Birmingham, NJ) is used to provide light to the optical setup,
which excites the sample during lasing. The lamp is a 75 W Xe arc lamp and has a focal length of approximately 28 cm.
Exiting light is restricted by an adjustable aperture and focused into the sample cuvette by a lens of focal length 7 cm.
Light exiting the cuvette is imaged by a second lens of focal length 12 cm onto the monochromator and subsequently
into the photomultiplier tube.
Shutters
Two shutters (Vincent Associates, Rochester, NY) are utilized in the apparatus. The slow shutter, which requires up to a
quarter-second to open fully, was not used in the precise timing sequence. Instead, it is used simply to protect the more
delicate fast shutter. For this reason, the slow shutter can be opened outside of the timed sequence and is controlled
directly from the computer.
The fast shutter, capable of opening in 5 ms, is used in the timed sequence to allow light to shine on the sample. Unlike
the slow shutter, its timing is crucial to experimental reproducibility. For this reason it is controlled by the pulse
generators described below.
Both shutters are controlled by respective control boxes. The slow shutter control (Douglas White, WPI CHE/CBC)
provides a 5 V analog signal to the shutter, causing it to open. It also allows for a manual override via a switch on the
box.
The fast shutter control is powered by a standard AC supply and is controlled by a digital logic pulse. When the voltage
is high the shutter opens; when the voltage is low the shutter closes.

Oscilloscope
A TDS-520D oscilloscope (Tektronix, Beaverton, OR) was used to measure and display the data collected from the
monochromator. Analog data from the photomultiplier tube was transmitted to the oscilloscope’s Channel 1 input. A
trigger pulse was sent to the oscilloscope’s Auxiliary 1 input during the timed sequence.
Monochromator
1: Entrance slit
2: Curved mirror
3: Diffraction grating
4: Curved mirror
5: Exit slit
Figure 5. A schematic of a Czerny-Turner monochromator with components labeled. Adapted from (Schmidt 2004).
The monochromator (Spex, Edison, NJ) separates light into its component wavelengths and allows only the desired
wavelength to pass. In a Czerny-Turner monochromator, used in this apparatus, light enters the device through an
entrance slit (1) to exclude ambient light. The entering beam of light is reflected inside the device onto a curved mirror
(2). The light is diffracted (3) and bounced onto another curved mirror (4), which focuses each wavelength of light into a
linear spectrum. This spectrum is directed at an exit slit (5) such that only one wavelength of light can leave. By rotating
the diffraction plate, the wavelength that leaves via the exit slit can be selected as needed.
Photomultiplier Tube
The photomultiplier tube (Kinetic Instruments, Bethel, CT) is used to convert information in the form of light intensity to
an analog voltage signal, which is subsequently passed on to the oscilloscope and backoff generator. A high voltage

generator provides a voltage of up to 1200 V, which proportionally increases the amplification caused by the
photomultiplier tube.
Monochromator Controller
A CD2A monochromator controller (Spex, Edison, NJ) is used to control the monochromator wavelength and
parameters. While the monochromator cannot be manipulated directly, a serial connection is made from the computer
to the controller and from the controller to the monochromator. This allows the computer to indirectly manipulate the
monitored wavelength.
Backoff Generator
A backoff voltage generator (Kinetic Instruments, Bethel, CT) is used to negate the background voltage of each trial run.
An analog signal of no more than two volts is forked from the oscilloscope and photomultiplier tube. A digital pulse to
the backoff generator’s Enable port beings polling, and a digital pulse to its Trigger port causes the generator to produce
a constant and opposite voltage to the one being input at that moment.
Figure 6. A generic transient with the backoff generator inactive. The rectangle represents the oscilloscope window and the portion of the
voltage function that is captured. (N.B. The transient is exaggerated for the sake of visibility.)

With the backoff generator inactive, as in Figure 6, the acquired transient cannot be measured with precision. The
amplitude of the transient is typically from 1 to 10 mV, with an I0 value of 1.0 V. The backoff generator produces an
equal and opposite voltage before the transient is generated to cause the transient to appear at 0 V.
By setting the baseline voltage to zero with the backoff generator, it is also possible to more reliably configure the
oscilloscope to read the transient being produced. Without baseline correction, the operator must essentially guess
what the voltage applied by the shutter will be and set the oscilloscope accordingly. However, the variation in voltage
between tests is great enough that this sort of estimation is not practical. By ensuring that the baseline lies at zero volts,
the oscilloscope can be automatically set to reliably capture the transient at the greatest sensitivity.
Pulse Generators
Three DG-535 pulse generators (Stanford Research Systems, Sunnyvale, CA) are used to precisely control the timed
sequence. Each generator has a jitter of less than 100 ps, making high precision timing possible. A generator has four
channels labeled A through D. Two outputs, AB and CD, produce digital pulses with edges defined by the four channels:
AB has edges A and B, and CD has edges C and D. In addition, each generator has a T0 output that broadcasts a pulse
each time its cycle begins and an analogous trigger input which signals the beginning of a cycle; these two ports are
critical for synchronizing multiple generators.
Logical NAND Gates
A specialized set of NAND gates (Douglas White, WPI CHE/CBC) was created to control equipment with functions that
can only occur during the timed sequence. Namely, both the laser Q-switch and the timed sequence must be triggered
only when a pulse is broadcast from the computer at the appropriate time.

A B C A|C B|C
F F F T T
F F T T T
F T F T T
F T T T F
T F F T T
T F T F T
T T F T T
T T T F F
Figure 7. A schematic of the NAND box used in the apparatus and its truth table. A vertical bar represents the NAND operation.
The shared pulse C is sent from the computer while the pulses A and B are sent from the sequence-controlling pulse
generator and laser Q-switch, respectively. A high input to both A and C (B and C) will produce a low output to A|C
(B|C) which triggers the Q-switch and sequence. All other combinations of inputs will produce a non-triggering high
output.
Timing Requirements
One of the major obstacles in creating a flash photolysis instrument is the precision of timing that is required to obtain a
proper transient. Several pieces of hardware must be coordinated:
1. The slow shutter must be opened to allow light through.
2. The backoff generator must be given an Enable pulse to begin polling the voltage level produced by the
photomultiplier tube.
3. The fast shutter must be opened to allow light through to the sample.
4. The oscilloscope must be triggered at the correct time to capture the transient.
5. The laser lamp must be flashed at the correct time in the sequence.
6. The laser Q-switch must be triggered at the correct time in relation to the lamp.
7. The fast shutter must be closed again as soon as possible to avoid degrading the chemical sample.

In order to return consistent results, timing must be both precise and accurate to the nearest hundred-nanosecond
interval; if any component activates inaccurately, the resulting transient is not useful.
The problem of timing manifested itself repeatedly throughout the assembly of this system. Initially, sections of code
were written to send trigger pulses via a USB analog-to-digital card (National Instruments, Austin, TX) to the rest of the
equipment. However, the USB card was found to have a large amount of jitter, sometimes being inaccurate by more
than a millisecond.
As a first improvement, a dedicated PCI analog-to-digital card (National Instruments, Austin, TX) with an internal clock of
1 MHz was used to replace the USB card. While this did solve the problem of imprecise hardware timing, it was then
determined that the LabVIEW software itself could only ensure accuracy to the nearest millisecond. As a result, it was
decided that only one pulse could come from the program to start the timed sequence and that all other
communications would have to come from a more precise controller.
A set of three DG-535 pulse generators was chosen to control the timed process. One generator was used to control the
laser, switching via GPIB from an internal 10 Hz pattern to flash the laser lamps to an external pulse to flash the lamp
followed by triggering the Q-switch 180 μs later. The other two generators were configured to trigger the other
components, with a shared T0 pulse synchronizing the three generators.
While the timing was correct at this point, the problem of the fail-safe shutter on the laser made firing impossible. GPIB
reconfiguration caused the pulse generator controlling the laser to become inactive for a second, which is far too long
for the laser to wait before closing its shutter. In order to keep the laser shutter from closing, the generator had to
continue firing the lamp internally without halting to switch modes.
The solution, which successfully allowed firing the laser, was to make use of two logical NAND gates to select periods
over which to fire the laser. Because lamp pulses occur 100 ms apart (i.e. 10 Hz), a digital pulse can be sent from the
computer with no regard for jitter to request that the next Q-switch pulse fire the laser. In this way, the laser will
receive the necessary low input if and only if the pulse generator pulses the Q-switch output while the computer is also
sending a pulse requesting a shot. Otherwise, the pulse generator will be ignored and only the unimpeded flash trigger
pulse will be allowed through.

A similar process is used for controlling the other hardware in the apparatus. The pulse generator controlling the
remaining hardware is triggered on a negative pulse, and a NAND gate is wired to its trigger input with inputs coming
from the computer and from T0 on the laser pulse generator. So, the remainder of the timed sequence will fire if and
only if the laser pulses while the computer is requesting that the sequence begin.
Software
The LabVIEW code used to control the apparatus comprises a number of primary routines, or “virtual instruments” (VIs).
These routines are run in sequence, each with a varying number of subroutines performing increasingly primitive
functions.
Summary of Program Flow
Figure 8. A flow diagram detailing the program logic and timing sequence for the instrument software.
The sequence illustrated in Figure 8 is conducted each time the overall experimental program is run. A summary of the
program logic is as follows:

1. The user inputs hardware and experimental parameters for the experiment.
2. The program distributes these parameters to the appropriate hardware and begins the experiment.
3. The experiment is conducted, data is acquired, and results are sent to the software.
4. The user chooses the method of saving the data or decides to discard it.
5. The computer saves or discards the data as requested and terminates.
Figure 9. The LabVIEW block diagram for the main experimental routine (Kin acq 9400).
The main routine, Kin acq 9400.vi, consumes a cluster of hardware addresses from the user. These addresses describe
the oscilloscope, the monochromator controller, the three pulse generators, and the backoff generator. The
appropriate addresses are passed on to subroutines in which the corresponding instruments are used.
The main routine executes four distinct steps, which are numbered 1 through 4 in Figure 9. These are summarized as:
1. Initial Setup: VISA addresses for the equipment used are obtained from the user.
2. Experimental Setup: Experimental parameters are obtained from the user. Parameters are passed to the
oscilloscope, the pulse generators, and the monochromator. The user is asked at this time to confirm firing of
the laser.
3. Experimental Processing: The experiment is carried out. During the time-sensitive firing routine the sample is
exposed to light and lased, and data acquired from the experimental procedure is collected from the
oscilloscope. This process is repeated until the desired number of shots has been fired.

4. Completion of Experiment: Data is either saved to file by the user or discarded, and the program terminates.
The main routine begins by sending a low digital pulse to the NAND gates, guaranteeing that no equipment will be
triggered until explicitly requested. If a voltage is not expressly given, the NAND box input has a tendency to “float”
toward a high voltage that will trigger the laser and timed sequence repeatedly. By assigning a low value here before
turning on the NAND box, both the equipment and the user are protected from a severe safety hazard.
Experimental Setup
Figure 10. The LabVIEW documentation and block diagram for the experimental setup routine (Kinetic Acquire Setup 9400).
The routine next calls Kinetic Acquire Setup 9400, which communicates with hardware to configure for the current
experiment. The user is prompted to enter the wavelength of light to be observed, the number of shots to be averaged
in the final transient, the resolution of the trace, the time base for the transient, the voltage sensitivity of the
oscilloscope, the electric coupling being used, the target backoff voltage, and the bandwidth of data recorded by the
oscilloscope. Once the user submits this information, it is broadcast to the necessary equipment:

1. The monochromator is set to the wavelength of interest.
2. The power supply control voltage is set, altering the power supply to the photomultiplier tube.
3. The timings for each component of the timed sequence are calculated and broadcast to the pulse generators.
Figure 11. The window requesting confirmation from the user to begin firing.
Other information is returned to the main routine by this program and used in the software. At this point, the user is
prompted to confirm commencement of the experiment. Once the FIRE button is pressed, the laser will fire multiple
times and is a severe hazard to those not wearing adequate protection.

Experimental Processing
Figure 12. The LabVIEW documentation and block diagram for the experimental processing routine (NO CORR CASE 9400).
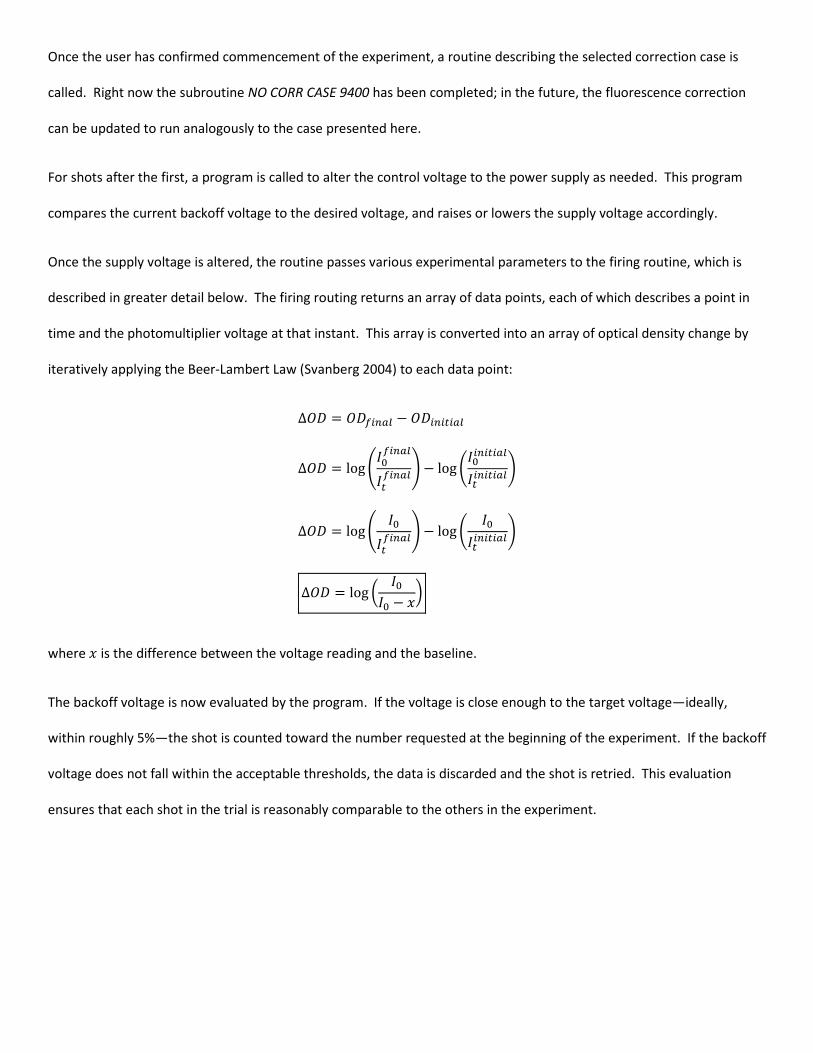
Once the user has confirmed commencement of the experiment, a routine describing the selected correction case is
called. Right now the subroutine NO CORR CASE 9400 has been completed; in the future, the fluorescence correction
can be updated to run analogously to the case presented here.
For shots after the first, a program is called to alter the control voltage to the power supply as needed. This program
compares the current backoff voltage to the desired voltage, and raises or lowers the supply voltage accordingly.
Once the supply voltage is altered, the routine passes various experimental parameters to the firing routine, which is
described in greater detail below. The firing routing returns an array of data points, each of which describes a point in
time and the photomultiplier voltage at that instant. This array is converted into an array of optical density change by
iteratively applying the Beer-Lambert Law (Svanberg 2004) to each data point:
Δ45 = 456��7* − 45���0�7*Δ45 = log;<=6��7*<06��7*> − log?<=���0�7*<0���0�7*@
Δ45 = log; <=<06��7*> − log? <=<0���0�7*@
Δ45 = log � <=<= − A�
where A is the difference between the voltage reading and the baseline.
The backoff voltage is now evaluated by the program. If the voltage is close enough to the target voltage—ideally,
within roughly 5%—the shot is counted toward the number requested at the beginning of the experiment. If the backoff
voltage does not fall within the acceptable thresholds, the data is discarded and the shot is retried. This evaluation
ensures that each shot in the trial is reasonably comparable to the others in the experiment.

Firing Routine
Figure 13. The LabVIEW documentation and block diagram for the firing routine (Kinetic Signal 9400).
The firing routine is responsible for initializing the timed firing sequence and collecting experimental data after each
shot. The routine performs five distinct actions:
1. Open the slow shutter to allow light onto the fast shutter.
2. Send a 90 ms high digital pulse to the shared NAND input, requesting that the next pulse generator cycle trigger
the laser Q-switch and the timed sequence.
3. Close the slow shutter to protect the fast shutter.
4. Read the voltage from the backoff generator via GPIB.
5. Wait a predetermined amount of time before firing again, if more shots are required.

The timed sequence, which itself takes several milliseconds to complete, is measured to a microsecond level to ensure
that there is no significant variation between tests.
Figure 14. A timeline of the timed firing sequence. The parameter (tdiv) represents the time per division on the oscilloscope and is passed to the
program as an experimental parameter.
All timings are based off of the laser Q-switch being triggered, which is assigned T+0. At T-5000 μs, the fast shutter is
opened to allow the monitor light to shine on the sample. The backoff generator is also enabled at this time. At T-180
μs, the laser lamp is flashed to prepare for lasing. Two time divisions before the sample is lased, the backoff generator is
triggered to set the experimental baseline to zero volts. One time division before the sample is lased, the oscilloscope is
triggered, capturing a division of baseline voltage before the transient is generated. At T+0, the Q-switch is triggered
and the laser fires into the sample. Two milliseconds later, the fast shutter is closed and the timed sequence is
completed.

Completion of Experiment
Figure 15. The LabVIEW documentation and front panel for the data display and saving routine (final graph).
After all tests have been completed, the final average data array is passed to final graph, which displays the final results
and prompts the user to choose the method of saving. The user may save the data to a text file or decline to save the
data; with additional programming, generating and printing a LabVIEW report containing the data is also possible.
If the data is saved, the two routines file header and file write are called. The file header routine consumes experimental
data and formats it into a human readable header, passing the header to file write. This routine concatenates the
experimental data to the header and prompts the user for a save location on the computer. Once the save location is
provided, the data is written to the hard disk and the program terminates. If the data is not saved, no further action is
taken and the program terminates.

Testing & Verification
Figure 16. A ground state UV-visible spectrum of TPP in acetone.
Two transients were reliably and reproducibly collected from a solution of TPP in acetone through which nitrogen was
bubbled for 20 minutes to remove dissolved oxygen. These transients were acquired at monochromator wavelengths of
450 nm and 513 nm and can be seen in Figures 17 and 18, respectively.
450 nm
(q.v. Fig. 17)
513 nm
(q.v. Fig. 18)

Figure 17. An acquired TPP transient in acetone at 450 nm wavelength and 50 mV/div sensitivity.
Figure 18. An acquired TPP transient in acetone at 513 nm wavelength and 50 mV/div sensitivity.
-0.005
0.000
0.005
0.010
0.015
0.020
0.025
0.030
0 15 30 45 60 75 90 105 120 135 150
∆O
D
Elapsed Time (μs)
-0.0100
-0.0075
-0.0050
-0.0025
0.0000
0.0025
0.0050
0 10 20 30 40 50 60 70 80 90 100
∆O
D
Elapsed Time (μs)

Because the final transient is directly dependent on the amount of light received by the photomultiplier tube, the shape
of the transient depends on the relative amounts of singlet state absorption (S0 → S1) and triplet state absorption
(T1 → T2) occurring in the sample. At 450 nm, where triplet state absorption is more prevalent, a net absorption of light
occurs and the optical density change of the sample is positive. However, at 513 nm, singlet state absorption is more
prevalent, a net emission of light occurs and the optical density change of the sample is negative. For this reason, a
positively-oriented transient is observed at 450 nm while a negatively-oriented transient is observed at 513 nm.
Conclusions & Recommendations
Summary
As designed, the instrument can be used to measure absorption of light from 250 to 900 nm with transients from 100 ns
to milliseconds in length. Each trace produces a data set of 500 points. In its current state the instrument has several
major uses including molecular characterization (Liu et al., 2012), monitoring of excited state processes (Sadhiya Banu et
al., 2011), and monitoring of radical formation and reaction (Mortensen et al., 1998).
Surface Flash Photolysis
The apparatus is currently configured to measure homogeneous solution chemistry. With slight modification, it could
also be used to analyze surface chemistry in which the sample is not entirely homogenized. One such modification
would utilize diffuse reflection from a solid sample:

Figure 19. A possible configuration of equipment to perform solid surface flash photolysis (Wilkinson et al., 1989).
The monitoring lamp would be faced perpendicularly to the sample, with the laser pointed “at an angle of just under 45°
to the sample” (Wilkinson et al., 1989). As in the current assembly, the laser would excite a large concentration of
molecules into excited states. However, instead of light passing through the sample, it would reflect diffusely off of the
sample, with some light being magnified through the lens and passing to the monochromator. This could theoretically
be performed with the same software and hardware as is currently being used, though certainly a separate optical setup
would be required.
Recommendations for Future Improvement
Due to limited time and resources over the course of this project, several features were not fully developed that were
not essential to the correct operation of the instrument.
Hardware
Laser energy is not currently monitored by the software during testing, and so only a rough estimate of the laser energy
can be made. However, a framework for monitoring exists within the program that should be functional with the
addition of an energy monitor to the apparatus. The routine to read the energy level is configured to utilize the VISA
standard, which will minimize the effort needed to add the energy monitor at a later date.

The NAND box is currently fail-dangerous; when no external signal is provided from the computer, the shared input
effectively defaults to a logical high signal and signals the laser to fire. The software was designed to counteract this
behavior by explicitly sending a low signal, then instructing the user to turn on the gate’s power. However, the box itself
should be redesigned as soon as possible to default to a safe behavior.
The NAND box can also be improved by separating the common input into two distinct inputs, one per logical gate.
While combining the inputs simplifies the wiring required, the current design does not allow for the laser to be fired
separately from the timed sequence or vice versa. Allowing these processes to occur separately would mean that base
cases (e.g. monitoring lamp with laser, or laser without monitoring lamp) could be established, allowing for the
fluorescence correction case to be implemented more easily.
Software
During this project, the “no correction” and “baseline correction” cases were blended into one default case. The
fluorescence correction case was not developed in favor of this default case, but development can be completed
analogously. In the fluorescence correction case, an initial laser pulse is fired without the lamp shining on the sample so
as to capture solely the emission of light via fluorescence from the sample. A standard test is then conducted with the
fluorescence spectrum being subtracted from the standard spectrum. The result is, ideally, a transient that only
describes those processes related to phosphorescence and other triplet state conversions.
A configuration routine is used to dynamically set the timed sequence such that the oscilloscope begins recording data
one time division prior to lasing of the sample. However, because other equipment is statically-timed and does not
depend on the timing of the oscilloscope trigger, it is possible to see deviations from a one division delay at longer time
bases. A potential solution is to calculate each timing value from the derived oscilloscope trigger time, which would
ensure that each piece of equipment translates properly along the timeline.
This program was intended to allow additional shots to be averaged into the current experimental set after the initial
number of shots requested was completed. This feature has not been implemented, and so such dynamic addition
cannot be performed manually. Data can still be manually averaged by defining a separate set of shots to be performed
and averaging the two data sets outside of the experimental program. Alternatively, a full run of the correct number of

shots may be performed. However, the latter may not be desirable for samples especially prone to photodegradation as
the process of flashing the lamp will be a destructive one.
In the future, a similar program could be written to generate a transient absorption spectrum comparing the
absorptions at various time points over a spectrum of wavelengths. A program purporting to do this was translated
from LabVIEW 4 to LabVIEW 2010 during this project, but it could not be fully developed to the point of usability or
testing.
Optics
The slow shutter has jammed due to wear during use, and must be replaced. It is most likely easier and cheaper for the
shutter to be replaced entirely than for it to be repaired. Because the type of shutter used is not significant to the
precision of the apparatus—it is simply intended to protect the more delicate fast shutter—the replacement shutter
should be chosen based on ease of implementation into the current apparatus. Ideally, the replacement will be
operable using the same shutter control as is currently in use.
The mirror being used to reflect the laser pulse through the sample was slightly damaged when first added, and could
not be fully cleaned before use. This has led to etching of the reflective surface which will ultimately reduce the
intensity of the laser beam. Such etching will reduce the apparent intensity of the laser beam and lead to inaccurate
experimental data. A clean, undamaged mirror should replace the current one before any precision data is collected
using the apparatus.
When first turned on in November 2011, the laser control did not function and produced a foul odor. It is believed that
this was a result of long-term storage, as the laser now functions correctly. However, to ensure that there is no hazard
to operators, the laser should be serviced and have any suspect components replaced.
Furthermore, the laser’s internal shutter should be replaced with an externally-controlled shutter if possible. Currently,
the internal shutter will not open for 30 seconds after starting, which is inconvenient and unnecessary. Furthermore,
the apparatus is designed to be fail-safe and cannot send a firing pulse to the laser before confirmed by the user. An
external shutter would be much more convenient for the user and would make the instrument no less safe.

Acknowledgements
I wish to thank Zhen Chen (Chemistry) for his time and expertise in organic chemistry during the course of this project. I
also wish to thank Douglas White (Chemical Engineering, Chemistry) for his aid in developing and constructing several
circuits needed in completing the instrument.

References
Atkins, Peter William and de Paula, Julio. Physical Chemistry, 7th ed. New York City: W.H. Freeman, 2001.
Bakar, Mohd Bakri, Michael Oelgemöller, and Mathias O. Senge. "Lead structures for applications in photodynamic
therapy. Part 2: Synthetic studies for photo-triggered release systems of bioconjugate porphyrin
photosensitizers." Tetrahedron, 2009: 7064-7078.
Bonnett, R., D.J. McGarvey, A. Harriman, E.J. Land, T.G. Truscott, and U-J. Winfield. "Photophysical properties of meso-
tetraphenylporphyrin and some meso-tetra(hydroxyphenyl)porphyrins." Photochem. Photobiol., 1988: 271.
Dědic, Roman, Miloslav Kořínek, Alexander Molnár, Antonín Svoboda, and Jan Hála. "Singlet oxygen quenching by
oxygen in tetraphenyl-porphyrin solutions." J. Lumin., 2006: 209-213.
Girgenti, Elodie, Rémy Ricoux, and Jean-Pierre Mahy. "Design and synthesis of a Mn(III)-porphyrin steroid conjugate
used as a new cleavable affinity label: on the road to semi-synthetic catalytic antibodies." Tetrahedron, 2004:
10049-10058.
Liu, Xu-Guang, and Wenfang Sun. "Synthesis and photophysics of platinum(II) complexes bearing 2-(7-(4-R-
phenylethynyl)-9,9-dihexadecyl-fluoren-2-yl)-1,10-phenanthroline ligand." Inorg. Chim. Acta, 2012: 140-147.
Mortensen, Alan, and Leif H. Skibsted. "Reactivity of β-carotene towards peroxyl radicals studied by laserflash and
steady-state photolysis." FEBS Letters, 1998: 392-396.
Nobel Foundation. Nobel Lectures: Chemistry (1963-1970). Amsterdam: Elsevier Publishing Co., 1972.
Norrish, R.G.W. and Porter, G. “The Structure of Methylene.” Spectrochim. Acta, 1947: 97-104.
Sadhiya Banu, I., H. Prakash, and P. Natarajan. "Laser flash photolysis studies of tris(2,2′-bipyridine)nickel(II) ion in
aqueous solution." Inorg. Chim. Acta, 2011: 429-435.
Schmidt, Werner. "A mini-rapid-scan-spectrophotometer." J. Biochem. Biophys. Methods, 2004: 125-137.
Seddon, John M., and Julian D. Gale. Thermodynamics and Statistical Mechanics. Vol. 10. London: Royal Society of
Chemistry, 2001.
Smith, Douglas L. "Coherent Thinking." Engineering & Science (California Institute of Technology) 62, no. 4 (1999): 6-17.
Svanberg, Sune. Atomic and Molecular Spectroscopy: Basic Aspects and Practical Applications. Electronic: Springer,
2004.
Thrush, Brian A. "The genesis of flash photolysis." Photochem. Photobiol. Sci., 2003: 453-454.
Wilkinson, F., and G.P. Kelly. "Laser Flash Photolysis on Solid Surfaces." Stud. Surf. Sci. Catal., 1989: 30-47.

Appendix I. Items Requiring Urgent Attention
Several items require attention to improve the quality of the instrument. These items are listed below; those items
pertaining to the apparatus proper are also detailed more fully in Recommendations for Future above.
Hardware
• A DG-535 pulse generator, not used in the current apparatus, has failed and requires replacement.
• The DG-535 pulse generator labeled #1 rings with a period of 30 μs through its T0 output, causing incorrect
triggering from that port. The pulse generator has been positioned in the apparatus such that its T0 output is
not required, but the instrument should be serviced when possible.
• An energy monitor should be added to the apparatus to capture the energy of the laser emission.
• For safety, the NAND box should be reconfigured to produce a low voltage signal when no external computer
signal is provided. Currently the box defaults to a high signal, which could prematurely fire the laser and is a
significant hazard to operators.
• The mechanisms for firing the laser and starting the timed sequence should be reconsidered so that each can
happen independently of the other. This is likely possible by splitting the NAND box’s common input into two
separate inputs from the computer, each controlling one of the processes.
Software
• The timing sequence should ideally calculate all timing based on the time base of the test. This will allow for
accurate triggering of hardware components over a larger range of time bases.
• The program cannot currently append shots to a test; either another test must be run and data from both tests
must be averaged manually, or another test must be conducted with the desired number of shots changed.
• The energy level of the laser is not currently obtained by the routine, but it is believed that the current routine
will support the energy monitor as is.
• The fluorescence correction case has not been completed. A previous LabVIEW program exists for this case, but
it must be updated to support current instrumentation.

Optics
• The slow shutter has been damaged through use and must be replaced.
• The mirror reflecting the laser beam through the sample was lased while dirty and has been damaged. This
mirror should be replaced before collecting precision data.
• The laser should be refitted with an external shutter replacing the internal fail-safe shutter. The software
routine for firing the laser is fail-safe, and so a physical component is not necessary.
• The laser, while currently operating correctly, was not operational and was observed to produce a foul odor
when first started in November 2011. To ensure that this is not a hazard the laser should be serviced.