Construction and Evaluation of Gas Feed-in System ...
132
Construction and Evaluation of Gas Feed-in System, Electrodes and Gas Exhaustion System applied to Low Pressure Plasma Coating Processes Dissertation approved for the degree of Doctor in Engineering – Dr.-Ing – Faculty of Production Engineering Department of Production Engineering University of Bremen by Gustavo Simiema de Freitas Barbosa Bremen, June 2018
Transcript of Construction and Evaluation of Gas Feed-in System ...

Construction and Evaluation of Gas Feed-in
System, Electrodes and Gas Exhaustion
System applied to Low Pressure Plasma
Coating Processes
Dissertation
approved for the degree of
Doctor in Engineering
– Dr.-Ing –
Faculty of Production Engineering
Department of Production Engineering
University of Bremen
by
Gustavo Simiema de Freitas Barbosa
Bremen, June 2018

Konstruktion und Evaluierung von
Gaszuführungsystemen, Elektroden und
Gasabsaugungssystemen für
Niederdruckplasmabeschichtungsanlagen
Vom Fachbereich Produktionstechnik
der
Universität Bremen
zur Erlangung des Grades
Doktor-Ingenieur
Genehmigte
Dissertation
von
Gustavo Simiema de Freitas Barbosa
Bremen, Juni 2018

III
1. Referee
Prof. Dr. rer. nat. Bernd Mayer
Universität Bremen - Faculty of Production Engineering (FB4)
Wiener Straße 12 | 28359 Bremen - Germany
2. Referee
Prof. Dr. Jürgen Meichsner
Institute of Physics of the University of Greifswald
Felix-Hausdorff-Str- 6| 17489 Greifswald – Germany
Dissertation Defense Date: 25.06.2018

IV
Eidesstattliche Versicherung Hiermit versichere ich, Gustavo Simiema de Freitas Barbosa, dass ich diese Arbeit ohne
unerlaubte fremde Hilfe angefertigt habe, keine anderen als die von mir angegebenen
Quellen und Hilfsmittel benutzt habe und die den benutzten Werken wörtlich oder inhaltlich
entnommenen Stellen als solche kenntlich gemacht habe.
___________________________ ____________________________
Ort, Datum Unterschrift

Abstract
V
Abstract
Plasma polymerization is a technique used to deposit functional thin film coatings
(nanometer until some micrometer thickness) on different materials surface. The thin film
coating is deposited directly from a partially ionized precursor gas subjected to the effect of
the plasma onto the surface of the substrate, which is placed in a low-pressure plasma
chamber. This coating process regarding the achievement of the desired properties is in
general well developed. The challenge is based on the scaling up process in respect to a large
volume coater. Concerning this aspect only very few and rough information are available for
constructors in respect to lay out of low-pressure plasma coater with the aim to achieve
homogeneous coating deposition rate as well as homogeneous coating properties over all
the products surfaces in contact with the plasma.
The aim of the present research work is mainly to investigate the potential of guiding
the gas flow inside a large volume plasma polymerization-system and to investigate how this
gas guiding directly influences the coating homogeneity as well as the coating properties.
Thereby the creation of construction guidelines to support future developments under the
frame of low-pressure plasma technology is part of the task.
To achieve this purpose, gas feed-in system, gas exhaustion system and electrode
geometry were investigated. Taking into consideration that experimentally the local gas flow
behavior cannot be directly measured inside a PECVD system computational fluid dynamics
(CFD) simulations were carried out using the commercial software Ansys Fluent 16.0® to
investigate the gas flow behavior. Additionally, to get more knowledge about the electric
field created by the RF-electrode in combination with the powered electrode, electrostatic
simulations were done using the commercial software Ansys Maxwell 16.0®.
Gas flow simulations showed clearly that the gas exhaustion system influences the
local gas flow much more (in intensity and range) in comparison to the gas feed-in system. In
this regard, a perforated polymeric plate was developed to reduce the influence of the gas
exhaustion system and it was named under the frame of this work as “Baffle Plate”. Coating
experiments exhibited a clear improvement in the coating deposition homogeneity due to
the installation of the Baffle Plate.

Abstract
VI
The construction guidelines for gas feed-in systems and gas exhaustion systems were
defined using gas flow simulations. To evaluate the simulation results, a non-uniformity
coefficient was defined to define a construction border. For this work, the construction
border was established at non-uniformity coefficient equals 5%. It means that construction
layout which leads to non-uniformity coefficient higher than 5% will be not recommended
for this application. From the analyzed parameters of the gas feed-in system, the pipe
section area was the most relevant influencing the homogeneity of gas distribution.
Regarding the gas exhaustion system, the simulation results showed that the distance
between the Baffle Plate and the top of the chamber has a huge influence in the
homogeneity of the gas exhaustion.
Coating experiments were performed to correlate the distribution of the coating
deposition rate in addition to the coating properties with the local gas velocity and the local
electric field. Therefore, the construction guidelines must be supplemented with hints how
to handle the influence of the walls (chamber, electrodes and product holder systems).
The selected construction guidelines revealed to be useful for the development and
construction of a new low-pressure plasma chamber of about 3 m³. Following the knowledge
acquired from this research work the realized coating showed on an area of 2 m² a standard
deviation of the deposition rate less than 17%. With this it had been demonstrated, that
especially for large volume PECVD-systems following the rules of the construction guidelines
is essential.
Keywords: Low-pressure plasma; Plasma polymerization; Scale-up; Coating
homogeneity; Construction guideline; Gas velocity; Computation fluid dynamics; Deposition
rate;

Zusammenfassung
VII
Zusammenfassung
Die Plasmapolymerisation ist eine Verfahrenstechnik, die verwendet wird, um
funktionelle Dünnfilmbeschichtungen (wenige Nanometer bis hin zu einigen Mikrometern
Dicke) auf verschiedenen Materialoberflächen aufzubringen. Dabei wird die Beschichtung
direkt aus der Gasphase, einem teilweise ionisierten Precursorgas, auf der Oberfläche des
Substrats, dass in einer Niederdruckplasmakammer angeordnet ist, abgeschieden. Derartige
Beschichtungsprozesse sind gut entwickelt und erlauben es bestimmte Schichteigenschaften
gezielt zu erreichen. Die Herausforderung besteht in der Aufskalierung des Beschichtungs-
prozesses für großvolumige bzw. großflächige Anlagen. Für die Konstruktion von derartigen
Niederdruck-Plasmabeschichtungsanlagen gibt es nur wenige, allgemeine Informationen für
den Konstrukteur, wie er vorzugehen hat, um eine homogene Schichtabscheidungsrate
sowie homogene Schichteigenschaften über alle Produktoberflächen zu erreichen.
Primäres Ziel der vorliegenden Forschungsarbeiten ist es, dass Potential von
technischen Systemen zur Beeinflussung des Gasflusses in großvolumigen
Plasma¬polymerisations¬anlagen zu untersuchen. Dabei liegt der Fokus auf deren Einfluss
auf die Schichtabscheidehomogenität und der Homogenität der Schichteigenschaften.
Hieraus sind Konstruktionsrichtlinien für zukünftige Entwicklungen im Rahmen der
Niederdruckplasma¬technologie abzuleiten.
Um das Ziel zu erreichen, wurden das Gaszufuhrsystem, die Gasabsaugung und die
Elektrodengeometrie untersucht. Dabei ist zu berücksichtigen, dass das lokale
Gasströmungsverhalten in einem PECVD-System experimentell nicht direkt gemessen
werden kann. Aus diesem Grund zur Untersuchung des Gasströmungsverhaltens CFD-
Simulationen (Computational Fluid Dynamics) mit der kommerziellen Software Ansys Fluent
16.0® durchgeführt. Um ergänzende Informationen über das elektrische
Gleichspannungsfeld der HF-Elektrode zu erhalten wurden Elektrostatiksimulationen mit der
kommerziellen Software Ansys Maxwell 16.0® durchgeführt.
Die Gasflusssimulationen zeigten deutlich, dass das Gasabsaugungssystem den
lokalen Gasfluss in einem großvolumigen Reaktor viel stärker (in der Intensität und der
Reichweite) beeinflusst, als dass Gaszuführungssystem. Daher wurde ein neuartiges
Absaugsystem in Form einer perforierte Polymerplatte entwickelt, um den Einfluss der
Gasabsaugung zu homogenisieren. Sie wird im Rahmen dieser Arbeit als "Baffle-Plate"
Zusammenfassung
VIII
bezeichnet. Beschichtungsexperimente zeigen mit dieser Vorrichtung eine deutliche
Verbesserung der Beschichtungshomogenität.
Die Konstruktionsrichtlinien für das Gaszuführungssystem und das
Gasabsaugungssystem wurden mit Hilfe von Gasfluss-Simulationen vorgenommen. Um eine
Konstruktion bewerten zu können, wurde ein Uneinheitlichkeitskoeffizient definiert. Für
diesen Koeffizienten wurde für diese Arbeit eine Konstruktionsgrenze (hier 5%) festgelegt.
Dies bedeutet, dass das Konstruktionslayout, dass zu einem
Ungleichförmigkeitskoeffizienten von mehr als 5% führt, für diese Anwendung nicht
empfohlen wird. Für das Gaseinspeisungssystem war von den analysierten Parametern die
Rohrquerschnittsfläche die relevanteste Größe, die die Homogenität der Gasverteilung
beeinflusste. In Bezug auf die Gasabsaugung zeigten die Simulationsergebnisse, dass der
Abstand zwischen dem Baffle-Plate und dem oberen Teil der Kammer einen großen Einfluss
auf die Homogenität der Gasabsaugungsvorrichtung hat.
Um die Verteilung der lokale Abscheidungsrate sowie der
Beschichtungseigenschaften mit der lokalen Gasgeschwindigkeit und dem lokalen
elektrischen Feld zu korrelieren wurden Beschichtungsexperimente durchgeführt. Daraufhin
wurden die Konstruktionshinweise um Angaben zum Umgang mit den Wänden
(Kammerwänden, Elektroden und Warenhaltesysteme) ergänzt.
Die erstellten Konstruktionsrichtlinien erwiesen sich bereits als Nützlich bei der
Entwicklung und Auslegung einer neuen Niederdruck-Plasmaanlage mit Volumen von ca. 3
m³. Durch die Anwendung der Erkenntnisse aus dieser Forschungsarbeit konnte die
Beschichtung nicht nur übertragen werden, sondern es wurde auf einer Fläche von ca. 2 m²
eine Standardabweichung der Abscheidungsrate von weniger als 17% realisiert. Damit
konnte demonstriert werden, dass insbesondere für großvolumige PE-CVD – Anlagen die
Befolgung der Konstruktionsrichtlinien von hoher Bedeutung ist.
Stichwörter: Niederdruckplasma; Plasmapolymerisation; Aufskalierung;
Beschichtungshomogenität; Konstruktionsrichtlinien; Gasgeschwindigkeit; Gasfluss-
Simulation; Abscheiderate

Publication List
IX
Publication List
Published
(a) Barbosa, Gustavo Simiema de Freitas, Vissing K., Mayer B. (2016) Creation and
Evaluation of Construction Guidelines Using CFD for Low Pressure Plasma Gas Feed-in
Systems to Homogenize the Precursor Gas Flow. OJFD;06(04):391–405
(b) Barbosa, Gustavo Simiema de Freitas, Vissing K., Mayer B. (2018) Introduction of a
New Baffle-Plate Concept to Control the Gas Flow Behavior in a Large Volume PECVD
Chamber. OJFD;08, 141-160
Table of Contents
X
Table of Contents
Abstract ................................................................................................................................. V
Zusammenfassung ............................................................................................................... VII
Publication List ..................................................................................................................... IX
Table of Contents................................................................................................................... X
List of Abbreviations ............................................................................................................ XII
List of Figures ...................................................................................................................... XIII
List of Tables ...................................................................................................................... XVII
1. Motivation and Objective ...................................................................................................1
1.1. Motivation .......................................................................................................................... 1
1.2. Objective ............................................................................................................................ 3
2. Theoretical part ..................................................................................................................4
2.1. Plasma Polymerization ....................................................................................................... 4
2.1.1. Organosilicon plasma coating ............................................................................. 5
2.2. Capacitive coupled radio frequency (CCRF) plasmas ......................................................... 7
2.2.1. Sheath formation ................................................................................................. 8
2.2.2. Geometry of a RF-Discharge device ................................................................... 10
2.3. Coating properties ........................................................................................................... 15
2.4. Coating characterization .................................................................................................. 16
2.4.1. Reflectometry analysis for the measurement of coating thickness ................... 17
2.4.2. Nanoindentation ................................................................................................ 18
2.4.3. Contact angle measurements ............................................................................ 21
2.5. Plasma Modelling ............................................................................................................. 25
2.5.1. Computational fluid dynamics (CFD) ................................................................. 25
2.5.1.1. Governing Equations .................................................................................... 27
2.5.1.2. Knudsen number ........................................................................................... 28

Table of Contents
XI
2.5.2. Electrostatics ...................................................................................................... 29
3. Simulation and Experimental Part .................................................................................... 32
3.1. Gas feed-in system ........................................................................................................... 33
3.1.1. CFD simulation ................................................................................................... 37
3.1.2. Experimental pressure measurements .............................................................. 40
3.1.3. Results and Discussion ....................................................................................... 41
3.2. Gas exhaustion system..................................................................................................... 48
3.2.1. CFD Simulation ................................................................................................... 53
3.2.2. Experiment with installed Baffle Plate............................................................... 67
3.2.3. Electric field Simulation ..................................................................................... 73
3.3. Electrode assembly .......................................................................................................... 76
3.3.1. CFD simulation ................................................................................................... 78
3.3.2. Electric field simulation ...................................................................................... 80
3.3.3. Experiments ....................................................................................................... 81
4. Construction of a new low-pressure plasma chamber ....................................................... 86
4.1.1. CFD simulation ................................................................................................... 90
4.1.2. Electric field simulation ...................................................................................... 92
4.1.3. Experiment ......................................................................................................... 92
5. Conclusions ...................................................................................................................... 96
6. Outlook .......................................................................................................................... 103
7. Acknowledgements ........................................................................................................ 105
8. References ..................................................................................................................... 106

List of Abbreviations
XII
List of Abbreviations
Abbreviation Definition
AFM Atomic Force Microscope
AOES Actinometric optical emission spectroscopy
CALC Calculated
CCP Capacitively Coupled Plasmas
CCRF Capacitive coupled radio frequency
CFD Computational Fluid Dynamics
DC Direct-current
EEDF Electron energy distribution function
EXP Experimentally measured
FTIR Fourier transform infrared spectroscopy
GC-MS Gas chromatography with mass spectrometric detection
HMDSO Hexamethyldisiloxane
PDE Partial Differential Equation
PECVD Plasma Enhanced Chemical Vapor Deposition
RF Radio Frequency
SFE Surface Energy
TEOS Tetraethoxysilane
TMOS Tetramethoxysilane
TMS Trimethylsilane
XPS X-Ray Photoelectron Spectroscopy

List of Figures
XIII
List of Figures
Figure 1 Potential species for thin film coating formation. Reproduced from[17] ................... 4
Figure 2 Deposition mechanism of HMDSO with different O2/HMDSO ratio. Adapted from
[29–31] ....................................................................................................................................... 6
Figure 3 Maxwellian Electron Energy Distribution Functions (EEDF) for plasmas of different
average electron energy. Reproduced from [16] ....................................................................... 7
Figure 4 Schematic of the sheath and pre-sheath adjacent to a surface in contact with a
plasma phase. Adapted from [16] ............................................................................................ 10
Figure 5 Illustrative averaged potentials and instantaneous plasma potentials Vp(t) (solid
curves) and excitation electrode voltages V(t) (dashed curves), assuming purely capacitive RF
sheath behavior, for three different capacitively coupled excitation electrodes geometries.
Adapted from [41,42]. .............................................................................................................. 12
Figure 6 Illustration of the different sheath length for the case with asymmetric electrode,
which the powered electrode has the smallest area in comparison to the grounded electrode
.................................................................................................................................................. 13
Figure 7 Sketch of the low-pressure plasma chamber used for this thesis ............................. 14
Figure 8 Ocean Optics NanoCalc 2000. Reproduced from [58] ............................................... 18
Figure 9 Typical load–displacement curve. Reproduced from [60]. ........................................ 19
Figure 10 Deformation pattern of an elastic–plastic material during and after indentation.
Reproduced from [60] .............................................................................................................. 20
Figure 11 Measuring head used for the hardness measurements .......................................... 21
Figure 12 Illustration of contact angles formed by sessile liquid drops on a smooth
homogeneous: Reproduced from [64] ..................................................................................... 22
Figure 13 Representation of the surface tension caused by the unbalanced forces of liquid
molecules at the surface. Reproduced from [64] .................................................................... 23
Figure 14 Gas flow regime based on the Knudsen number ..................................................... 28
Figure 15 Examples of electric fields in different situations. Reproduced from [90]. ............. 30
Figure 16 Small chamber used for LPCVD (Low Pressure Chemical Vapor Deposition)
developed by Applied Mateirals,Inc. Reproduced from [96] ................................................... 33
Figure 17 Spargers for bubble column reactor: (A) sieve plate sparger; (B) multiple ring
sparger; (C) spider; (D) pipe sparger. Adapted from [97,98] ................................................... 34
Figure 18 Eligible gas feed-in configurations and desired requirements ................................ 35

List of Figures
XIV
Figure 19 a) Gas feed-in distributor model under analysis, b) Gas feed-in distributor position
inside the PECVD chamber. ...................................................................................................... 36
Figure 20 Pipe profiles under analysis (front view) ................................................................. 38
Figure 21 System model with XY symmetry plane ................................................................... 39
Figure 22 Pressure measurement details: (a) Sketch of the pipe with measurement position
(b) Pipe connection with vacuum gauge (view from inside the chamber)
(c) Handheld vacuum gauge ..................................................................................................... 41
Figure 23 Influence of the pipe section area in the distribution homogeneity (a) Gas flow
distribution through holes and (b) Non-uniformity coefficient obtained for the different pipe
section values considered. The results are shown via the points; the lines connecting the
points in the plot are only to support guiding the eyes and are not modelled fits. ................ 42
Figure 24 Pressure contour and velocity contour a) 10 mm x 10 mm b) 30 mm x 30 mm.. 44
Figure 25 Influence of different parameters on the homogeneity of gas flow distribution ... 45
Figure 26 Comparison of pressure values obtained through experiments and simulations (a)
& (b) Pipe section 10 mm x 10 mm; (c) & (d) Pipe section 30 mm x 30 mm .......................... 47
Figure 27 Gas simulation result showing the two dissimilar influence zones of the gas feed-in
and of the gas exhaustion ........................................................................................................ 49
Figure 28 (a) Samples used in the experiment (b) Experimental setup .................................. 50
Figure 29 Coating deposition rate distribution (a) top plane (b) middle plane (c) bottom
plane ......................................................................................................................................... 52
Figure 30 Average of deposition rate - Experiment current setup .......................................... 53
Figure 31 Model of the experiment setup (a) Isometric view (b) Front view (c) isometric
view of a quarter of the model ................................................................................................ 54
Figure 32 Gas simulation results of the experiment- Current setup ....................................... 56
Figure 33 Eligible gas exhaustion configurations and desired requirements .......................... 58
Figure 34 Baffle plate model a) radial distribution b) linear distribution ................................ 59
Figure 35 Gas flow simulation results for two different baffle plates assembled (a) radial
distribution of the holes (b) linear distribution of the holes .................................................. 60
Figure 36 (a) Pressure contour [simulation] (b) Scheme of the low-pressure chamber
showing the positions where the pressure was measured ..................................................... 61

List of Figures
XV
Figure 37 Comparative of calculated and measured pressure values (a) Pressure inside the
low-pressure chamber (b) Pressure in the gas exhaustion (c) Pressure difference between
the inside chamber and the gas exhaustion ............................................................................ 62
Figure 38 Representation of the low-pressure plasma chamber with different distances
between the Baffle Plate and the top chamber ....................................................................... 63
Figure 39 Influence of the distance from the Baffle Plate to the top of the chamber on the
non-uniformity coefficient. The results are shown via the points; the lines connecting the
points in the plot are only to support guiding the eyes and are not modelled fits. ................ 64
Figure 40 Gas flow simulation results showing pressure contour and velocity contour for two
different distances between Baffle Plate and top of the chamber ......................................... 65
Figure 41 Influence of different parameters in the homogeneity of the gas exhaustion
through the holes of Baffle Plate The results are shown via the points; the lines connecting
the points in the plot are only to support guiding the eyes and are not modelled fits. ......... 66
Figure 42 Scheme of the experiment setup with the baffle plate installed ............................ 68
Figure 43 Detail of one hole of the Baffle Plate a) just the Baffle Plate b) Baffle Plate direct in
contact with the perforated grid .............................................................................................. 68
Figure 44 Gas simulation results of the experiment- Current setup with Baffle Plate installed
.................................................................................................................................................. 69
Figure 45 Comparative of coating deposition rate with and without the Baffle Plate installed
.................................................................................................................................................. 71
Figure 46 Comparative of the average of deposition rate - Experiment current setup and with
Baffle Plate installed ................................................................................................................. 72
Figure 47 Comparative average of the surface energy [Wu method] – With and without
Baffle Plate ............................................................................................................................... 72
Figure 48 Electric field calculation results for the current setup ............................................. 75
Figure 49 Scheme of the experiment with one additional electrode (sides open) ................. 76
Figure 50 Scheme of the experiment with one additional electrode (sides closed) ............... 77
Figure 51 Gas flow simulation results – Experiment Metallic Plate open sides (a) XY plane
(b) ZY plane ............................................................................................................................... 78
Figure 52 Gas flow simulation results – Experiment Metallic Plate closed sides (a) XY plane
(b) ZY plane ............................................................................................................................... 79

List of Figures
XVI
Figure 53 Electric field calculation results for the Experiment - Metallic Plate (a) Plane XZ
(side view) (b) Plane YZ (front view) (c) Plane XY (top view) ................................................... 80
Figure 54 Setup of the experiment - Metallic Plate (a) open sides (b) closed sides ................ 82
Figure 55 Coating deposition rate distribution (a) open sides (b) closed sides ....................... 83
Figure 56 Image of the coating process – Metallic plate with closed sides, showing local
plasma concentration on the top corners................................................................................ 84
Figure 57 Comparative average (a) deposition rate (b) surface energy .................................. 85
Figure 58 Plain metallic product placed on a Polycarbonate-holder....................................... 86
Figure 59 Model of the gas feed-in system .............................................................................. 87
Figure 60 (a) Model of the low-pressure plasma chamber with triangular shape RF-Electrode
(b) Electric field simulation for the triangular shape RF-electrode .......................................... 88
Figure 61 Model of the trapeze RF-electrode .......................................................................... 88
Figure 62 Model of the Baffle Plate ........................................................................................ 89
Figure 63 Model of the complete low-pressure plasma chamber .......................................... 90
Figure 64 Gas flow simulation – New low-pressure plasma chamber (a) gas streamlines b)
velocity contour (middle plane) (c) velocity contour on product plane .................................. 91
Figure 65 Electric field simulation results for the new low-pressure plasma chamber model 92
Figure 66 Setup of the experiment – One product for each side of the trapeze electrode .... 93
Figure 67 Coating deposition rate distribution (a) left side (b) right side ............................... 93
Figure 68 Coating thickness results for both plain products ................................................... 94
Figure 69 Surface energy results for both plain products ....................................................... 95
Figure 70 Elastic modulus results for both plain products ...................................................... 95

List of Tables
XVII
List of Tables
Table 1 Coating process used ................................................................................................... 16
Table 2 Pressure range values in vacuum technology [88]...................................................... 29
Table 3 Pipe technical layout under simulation analysis ......................................................... 38
Table 4 Parameters used for experimental and simulation approach .................................... 39
Table 5 Boundary conditions ................................................................................................... 40
Table 6 Knudsen number using 200 sccm of N2 for two different pipe section areas:
6 mm x 6 mm and 30 mm x 30 mm .......................................................................................... 46
Table 7 Boundary conditions for the gas flow simulation of the experiment ......................... 55
Table 8 Baffle Plate technical layout under simulation analysis.............................................. 64

Motivation and Objective
1
1. Motivation and Objective
1.1. Motivation
Plasma polymerization is a thin film coating technique used for the modification of
surface properties of different materials, e.g. metals, polymers and composites [1]. For
instance, tailored coatings permit the enhance of mechanical, chemical, electrical and optical
properties of surfaces [2–6]. Therefore, this technique is very useful for different range of
industrial fields, such as aircraft, aerospace, automotive, packaging, food, textile and medical
devices.
The formation of the functional thin film coatings can be achieved through different
processes, such as chemical vapor deposition, sputtering and plasma enhanced chemical
vapor deposition (PECVD) [7]. Concentrating on the PECVD processes, the substrate is placed
in a low-pressure chamber supplied with precursor gases and subjected to the effects of the
plasma discharge. Due to the plasma, the precursor gases are fragmented. Those fragments
are able to react and form a thin film coating onto the surface of the substrate as well as on
every surface positioned inside or near the plasma region [8]. Plasma parameters like
pressure, precursor gas flow, discharge power, self-bias and at least reaction time are
responsible for these film formations. Therefore, it is very important to control the gas
velocity inside the plasma chamber, especially for processes with a low self-bias, to ensure a
high deposition rate as well as good coating properties all over the products surface. The
management of the gas flow inside the chamber is possible through the control of the gas
feed-in and at least the gas exhaustion system. Especially for small plasma coaters (in
semiconductor industry), some patents about this topic can be found [9–14]. They created
different gas feed-in systems integrated to the electrode (called showerhead) for different
applications. The opening area ratio and/or the hole density distribution over the plate area
can be tailored to reach the desired coating properties. Furthermore, some gas feed-in
solutions are established where tubes or perforated pipes are applied or even perforated
rings [15]. Regarding the gas exhaustion, normally the gas is pumped out in most of the
cases in a radial way.
Additionally, the local gas flow behavior and the local electric fields are also
important parameters concerning deposition rate and coating performance. For instance, in

Motivation and Objective
2
capacitive coupled plasmas (CCP) powered by radio frequency (RF) generator, lighter
electrons will be accelerated much faster than heavy ions, gaining energy and heating up.
Nevertheless, the ions and neutrals will remain close to ambient temperature. When the
electrons are not in thermal equilibrium with the ions and neutral is called “Nonthermal
plasma”. The electrons with high energy can ionize and fragmentize the precursor gas
producing ions, free electrons and radicals [16]. Since the electrons are much lighter than
the ions, every surface in contact with the plasma will start to charge up negatively with
respect to the plasma. The surfaces will continue to charge negatively until the electron flux
is reduced by repulsion balancing the ions flux. It is important to keep in mind that, due to
the potential difference between the plasma and the surface, an electric field accelerating
the ions toward the surface is generated. Thus, the ions play an important role in the film
coating formation [17,18]. Therefore, it is very important to control the electric field
distribution inside the chamber to know how and where to place the products to be coated
and also to understand how to build the electrodes in order to achieve high and
homogeneous deposition rates as well as good coating properties.
The domain over the gas flow behavior and over the electric field distribution is even
more challenging when the scaling up is desired either to process many products in one
batch or to coat one part with larger dimensions. In this perspective, the design of the
plasma chamber is crucial to achieve high and homogeneous deposition rates as well as
good quality of the formed thin film. Hence, the gas exhaustion system, gas feed-in system
and the electrodes must be carefully designed. From the state of the art, there are some
patents issued regarding gas distribution systems for small plasma chambers for
semiconductor applications [9,10,19,20]. However, concerning large volume plasma
chambers, normally interesting in other industries, there is limited information either due to
lack of knowledge or due to confidential issues. Especially for these cases, the improvement
of the cost effectiveness is very important. It is expected that all products processed in one
batch show the same surface properties and often also a homogeneous coating thickness
distribution as well. Hence, the local gas flow behavior and the local electric field are key
factors to enable the scaling up of plasma polymerization processes. Apart from the product
geometry and the electrode design, there are two main influences on the gas flow
distribution inside a large volume chamber: (i) gas feed-in system and (ii) gas exhaustion

Motivation and Objective
3
system. They must be carefully designed to guarantee an evenly gas flow through the
products and consequently accomplish reasonable coating properties.
As pointed out above the prediction of the gas flow behavior and the prediction of
the electric field distribution inside the plasma chamber are of industrial and economic
interests. Thus, a better understanding of the plasma chamber construction and its influence
on the coating deposition rate is very important for future developments of new plasma
polymerization systems. Therefore, the use of simulation tools in response to the gas flow
and the electric field was planned. The simulation results were matched with the coating
validation, e.g. surface energy, reflectometry and nanoindentation.
Taking into consideration all these aspects, my research guiding to this thesis focuses
on the investigation of the influence of the gas feed-in system, gas exhaustion system and
electric field distribution on the local deposition rate through simulations and practical
experiments. Based on the knowledge acquired, general guidelines are presented. These can
be useful for constructors and scientists, showing how to move forward by building gas feed-
in, gas exhaustion systems and electrodes in respect to them.
1.2. Objective
This thesis focuses on the prediction of the gas flow behavior and the electric field
distribution inside a low-pressure plasma chamber using simulation tools in agreement with
coating experiments. The knowledge developed intends to support the construction of
specific electrode configurations in combination with gas feed-in and gas exhaustion systems
for low-pressure plasma polymerization applications. The following objectives were
determined:
• Improve the scientific understanding of a large (~1m3) low-pressure plasma
chamber taking into consideration the gas flow along with the electric field to
achieve homogeneous coating deposition rate as well as homogeneous
coating properties
• Create guidelines for the construction of gas feed-in systems, gas exhaustion
systems and electrodes systems to support future developments of large
volume plasma coaters

Theoretical part
4
2. Theoretical part
In section 2.1 a brief explanation about plasma polymerization showing the influence
of the gas mixing ratio (O2/HMDSO) on the properties of the deposited thin film coating was
depicted. Section 2.2 describes the generation and sustenance of the plasma with focus on
the applied method (Capacitive Coupled Radiofrequency), explaining the formation of the
sheath region and the influence of the ratio of the powered electrode on the grounded
electrode area on the formation of the self-bias. Section 2.3 describes the properties of the
coating used in this thesis. Section 2.4 introduces different methods used in this thesis to
characterize thin film coatings. Finally, section 2.5 describes the methods used for the
performed simulations: Computational Fluid Dynamics (CFD) and Electrostatics.
2.1. Plasma Polymerization
Plasma polymerization is a useful technique to deposit polymeric thin films onto
surfaces of different substrates, e.g. metals, polymers and composites, in order to enhance
the surface properties under the stimulus of a plasma [18,21]. The plasma forms different
species with unlike masses, kinetic energies and charges. Due to these differences, different
thin film properties are generated due to different energies delivered to the surface.
Michelmore and coauthors showed a very visible sketch of the potential species inside a
plasma correlating with the electron energy, as depicted in Figure 1 [17]:
Figure 1 Potential species for thin film coating formation. Reproduced from[17]

Theoretical part
5
Figure 1 shows that the ions play a main role in the formation of the thin film coating
illustrated by the larger red box (cations) in comparison to the blue and green boxes (intact
precursor and radicals respectively). This can be explained by the electric field constituted
between the borders of the plasma and the surface. This electric field will accelerate the
positive ions toward the surface with enough energy to start chemical reactions and thus
grow the film coating. The region where the electric field forms the so-called sheath will be
explained in more detail in chapter 2.2.
2.1.1. Organosilicon plasma coating
Currently, many organosilicon compounds are used as PE-CVD precursors instead of
the hazardous silane (SiH4), which is gaseous at room temperature. There is a variety of
organosilicon precursors such as hexamethyldisiloxane (HMDSO), tetraethoxysilane (TEOS)
and tetramethoxysilane (TMOS) [22–24]. Among them, HMDSO is most commonly used due
to its high vapor pressure, low toxicity and low cost [25].
With the help of those precursors it is possible to create a lot of different coating
properties (e.g. barrier coatings, corrosion protection coatings, primer coatings, easy-to-
clean and release coatings) [8,26,27]. Noborisaka and coauthors [28] reported for example
on the importance of the selection of the right precursor gas mixture for the coating
formation. The appropriate mixture ratio of the precursor gases trimethylsilane and oxygen
(TMS and O2) was investigated to obtain polycarbonate films as alternative to conventional
windows glasses. The results revealed that hardness and transparency properties could be
tailored by changing the gas mixture ratio.
There are different diagnostic techniques already used to study organosilicon
containing plasmas, such as Fourier transform infrared spectroscopy (FTIR), actinometric
optical emission spectroscopy (AOES) and X-Ray Photoelectron Spectroscopy (XPS) showed
in the work of Lamendola and coworkers [29]. Fracassi and coauthors applied a cold trap in
the gas effluent and analyzed the by-products formed in plasmas fed with HMDSO, oxygen
and argon using gas chromatography-mass spectrometry (GC-MS). Their findings, under the
experimental conditions employed, indicated that the activation of HMDSO is mainly due to
electron collisions instead of by reaction of oxygen. Nevertheless, the oxygen is responsible

Theoretical part
6
for the control over the chemistry of the plasma [30]. The main conclusions of these works
were schematized in Figure 2.
Figure 2 Deposition mechanism of HMDSO with different O2/HMDSO ratio. Adapted from [29–31]
The fragmentation of the HMDSO molecule does not occur completely. The
electrons gain energy from the RF electric field and, due to the collisions, they distribute this
energy with other species in the plasma. Eventually, highly depending on the working
pressure, powder can be formed because of the gas phase polymerization reactions.
Considering the electron-molecule collision frequency constant, commonly named
Maxwellian distribution, typical from the electron energy distribution function (EEDF) plots
can be seen in literature, as depicted in Figure 3:
Theoretical part
7
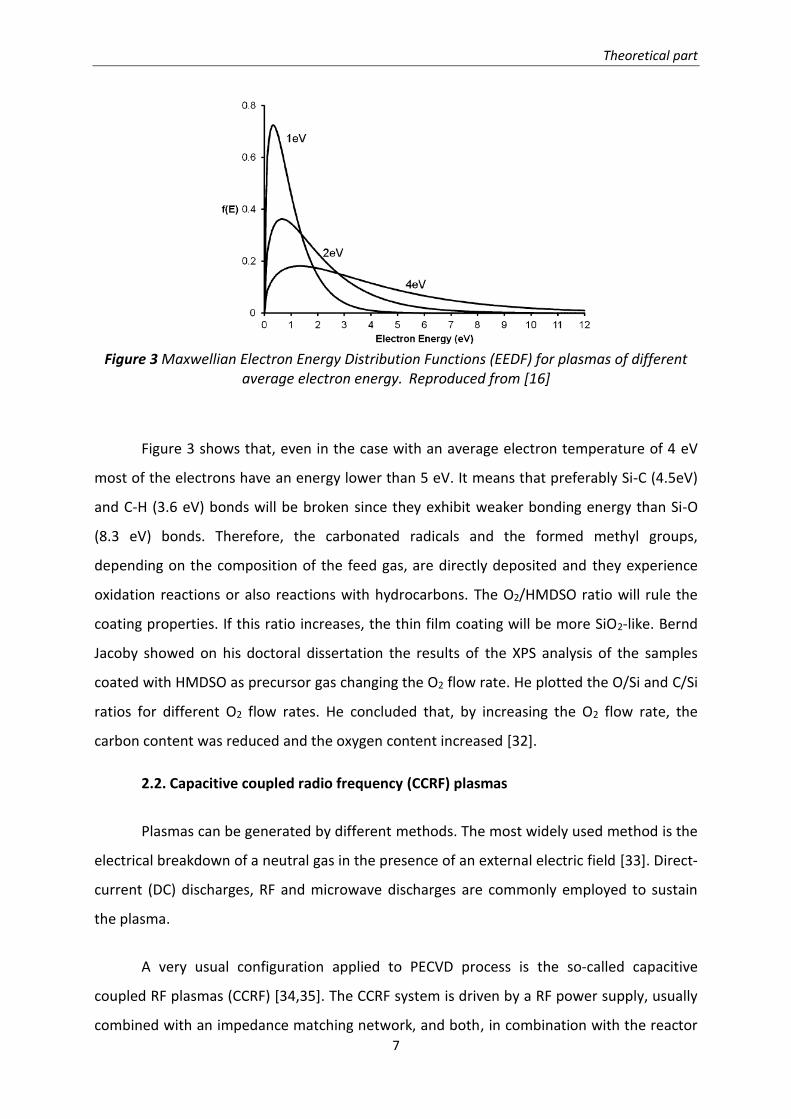
Figure 3 Maxwellian Electron Energy Distribution Functions (EEDF) for plasmas of different
average electron energy. Reproduced from [16]
Figure 3 shows that, even in the case with an average electron temperature of 4 eV
most of the electrons have an energy lower than 5 eV. It means that preferably Si-C (4.5eV)
and C-H (3.6 eV) bonds will be broken since they exhibit weaker bonding energy than Si-O
(8.3 eV) bonds. Therefore, the carbonated radicals and the formed methyl groups,
depending on the composition of the feed gas, are directly deposited and they experience
oxidation reactions or also reactions with hydrocarbons. The O2/HMDSO ratio will rule the
coating properties. If this ratio increases, the thin film coating will be more SiO2-like. Bernd
Jacoby showed on his doctoral dissertation the results of the XPS analysis of the samples
coated with HMDSO as precursor gas changing the O2 flow rate. He plotted the O/Si and C/Si
ratios for different O2 flow rates. He concluded that, by increasing the O2 flow rate, the
carbon content was reduced and the oxygen content increased [32].
2.2. Capacitive coupled radio frequency (CCRF) plasmas
Plasmas can be generated by different methods. The most widely used method is the
electrical breakdown of a neutral gas in the presence of an external electric field [33]. Direct-
current (DC) discharges, RF and microwave discharges are commonly employed to sustain
the plasma.
A very usual configuration applied to PECVD process is the so-called capacitive
coupled RF plasmas (CCRF) [34,35]. The CCRF system is driven by a RF power supply, usually
combined with an impedance matching network, and both, in combination with the reactor

Theoretical part
8
and electrodes, sustain the discharge. A range of frequencies can be used. The most often
used frequency is 13.56 MHz, which is a fixed value in international standards. Normally the
CCRF discharges operate at low pressure between 1 and 104 Pa; nevertheless it can also be
applied at atmospheric pressure [36]. The main advantage of this system is the possibility to
coat temperature sensitive materials and to build large and individual electrode systems.
2.2.1. Sheath formation
As already introduced in chapter 2.1, in the case of a surface in contact with the
plasma, it will be bombarded with ions and electrons as described by David Bohm in 1949
[37]. The flux of each species will be unequal since electrons are lighter and hotter than
positively charged ions. In this scenario, the flux of electrons to the surface is initially much
higher than the flux of the ions. Therefore, the surface charges up to negative potential
relative to the bulk plasma until a certain value, the electrical charge equilibrium is reached.
At this point the surface will held a potential called “floating potential”, since the potential
floats to a value enough to maintain an equal flux of positive and negative species. This value
is usually about 10 Volts negative in comparison with the plasma [37]. The bulk plasma is
normally at equipotential and is named “plasma potential”. The potential difference
between the floating potential and the plasma potential is called “sheath potential”. This is
the magnitude of the energy barrier which an electron must overcome to reach the surface.
It is also the potential through which a positive ion is accelerated onto the surface.
Bohm showed that the presence of the surface in the plasma results in the formation
of a sheath region adjacent to the surface where the density of charged particles decreases
[37]. In fact, there are two distinct regions; the sheath, where the density of the positive ions
(ni) is higher than the density of electrons (ne), and a pre-sheath, where the densities are the
same but decrease slightly compared to the bulk plasma [17]. In this pre-sheath region, ions
are accelerated. They enter the sheath at the Bohm velocity, ub
𝑢𝑏 = √𝑘𝑇𝑒
𝑚
where Te is the electron temperature, k is Boltzmann’s constant and m is the particle mass.

Theoretical part
9
The flux of ions, Ji, is given by:
𝐽𝑖 = 𝑒𝑥𝑝 (−1
2)𝑛𝑖√
𝑘𝑇𝑒
𝑚
where ni is the ion density in the plasma phase and the exp (−1/2) term describes the ion
density decrease in the pre-sheath.
Therefore, the surface has the effect of increasing the flux of positive ions through
the pre-sheath/sheath regions to the surface. The increase in flux above the normal thermal
flux, Jt, can be mathematically described by:
𝐽𝑖𝐽𝑡
= √2𝜋𝑒𝑥𝑝 (−1
2)√
𝑇𝑒
𝑇𝑖
where Ti is the temperature of the ions in the plasma phase, usually close to ambient
temperature. Therefore, for a typical electron temperature of ∼3 eV, the flux of ions is
increased by a factor of ∼15 [16].
Michelmore and coauthors [16] summarized very well in a scheme the concentration
variation of ions and electrons, as well as the increase in the ion velocity inside the plasma
bulk, pre-sheath and sheath regions, as showed in Figure 4. Right side of Figure 4 shows
potential in y-axis and distance in x-axis. This distance can range from millimeters to
centimeters and in this specific case the x-axis represents 0 V.

Theoretical part
10
Figure 4 Schematic of the sheath and pre-sheath adjacent to a surface in contact with a plasma phase. Adapted from [16]
Because the sheath is a region over which a negative potential is dropped, electrons
are quickly expelled from the sheath. This electron density loss results in a reduction of
electron impact excitation reactions in that region, since the electrons are active species in
these excitation/fragmentation/ionization processes. Since such reactions lead to
fluorescent emission from excited species, the sheath region does not glow as much as the
plasma bulk. So the substrate is surrounded by a comparatively dark space, which may be a
few µm to a few mm in size depending on the plasma conditions [38].
2.2.2. Geometry of a RF-Discharge device
The RF generator supplies a sinusoidal waveform to the powered electrode, and the
plasma potential rises and falls in phase with it. Normally the RF systems have a variable
capacitor between the RF generator and the plasma. In order to guarantee maximum power
transfer into the plasma, the input impedance of the plasma must be equal to the output
impedance of the generator, normally 50 Ω, which is the standard the industry has settled
on for measuring and transferring high-frequency electrical power [39]. Varying the value of
this capacitor the effective impedance of the load (plasma + capacitor) can be made equal to
50 Ω. However, the presence of this blocking capacitor introduces the constraint that no net
Sheath Pre-Sheath Bulk Plasma ni = ne ni = ne ni > ne
Sheath Pre-Sheath Bulk Plasma
Electrons
Low energy
Electrons
ni
ne
Ion velocity Ion velocity increases
V
x
Plasma
Potential
Floating
Potential
Surface
Surface

Theoretical part
11
current can flow during one RF cycle. It means that the total net charge flow per RF cycle to
both electrodes must be zero [40]. In other words, to keep a steady state, ions and electrons
must reach the surfaces in the same rate at which they are formed.
In the case of capacitive coupled plasma systems, the geometry of the electrodes,
especially the area ratio of the powered electrode to grounded electrode strong influence on
the potential distribution inside the plasma chamber. To realize a specific coating for
determined application is very important to keep in mind those influences. Figure 5 shows
different construction situations that can be performed regarding electrode areas, the time
average plasma potential (Vp) and excitation voltage for capacitive coupled radio frequency
plasma, respectively.

Theoretical part
12
Figure 5 Illustrative averaged potentials and instantaneous plasma potentials Vp(t) (solid curves) and excitation electrode voltages V(t) (dashed curves), assuming purely capacitive RF
sheath behavior, for three different capacitively coupled excitation electrodes geometries. Adapted from [41,42].
The first reactor geometry represented in Figure 5a corresponds to the asymmetric
one with the smallest electrode coupled to the RF generator. During the positive RF half
cycle a high negative charge accumulates on the powered electrode, while during the
negative RF half cycle only a smaller positive ion current flows due to the much lower ion
mobility compared to the electron mobility. Negative charges accumulate on the electrode

Theoretical part
13
during a complete cycle, since the blocking capacitor prevents the flow of current in the
external circuit. In subsequent RF cycles, a steady state is reached, since low energetic
electrons are repelled by the formed potential. Therefore, the RF signal oscillates around a
DC potential, the DC bias potential (Vbias), which is negative with respect to the plasma
potential, Vp. In this case, where ARF < Agrounded, the main potential drop (higher sheath
potential) is obtained at the powered electrode, as depicted in Figure 6. The DC bias
potential, Vbias, can be several hundred volts depending on the ratio of the powered to the
grounded electrode area and on the applied RF. Ions will be accelerated toward the powered
electrode through a maximum potential of Vp+Vbias [43].
Figure 6 Illustration of the different sheath length for the case with asymmetric electrode, which the powered electrode has the smallest area in comparison to the grounded electrode
The highest possible negative Vbias value, which occurs for highly asymmetric systems,
is ½ of the peak-to-peak voltage, and since the plasma cannot be more negative than ground
its mean potential is at least close to ground. With this arrangement, strong ion
bombardment is experienced only by the small electrode. As a function of the substrate
position, therefore, it is possible to conduct contemporaneously in the same plasma
environment, processes with high (on RF electrode) and low (on floating or ground surfaces)
contributions of positively charged particles bombardment. When the area of the electrodes
is the same (Figure 5b), symmetric geometry, RF oscillates around ground and the plasma
potential is about ¼ of the peak-to-peak voltage. This configuration was the starting point for
this research thesis since release coating is desired. It means that the thin film must be
RF
Plasma
Sheath at powered
electrode
Sheath at grounded
electrode

Theoretical part
14
polymer-like (Si, SiCxHy, C, CxHy). As depicted in Figure 2, the kind of ions plays an important
role on the final characteristics of the thin film coating. Thus, it is mandatory to run the
process in a 0 Bias form to avoid high ions bombardment, as shown in Figure 5b, since in this
configuration the sheath potential is much lower than the case showed in Figure 5a with
negative Bias. Consequently the electric field is lower leading to lower ion bombardment
energy. The geometry of Figure 5c is very uncommon among real systems. In this case, if the
positive Bias is very high, it implies in an energy barrier for ions which will certainly lead to
different coating properties.
In the frame of my research, a large volume plasma reactor, about 1m3 volume,
developed by Fraunhofer IFAM with symmetric electrode configurations is used. It is
operated with a capacitive radio-frequency generator (13.56 MHz). In Figure 7 the used
plasma system setup is shown schematically with its most important components. Basically,
it has a “U-form” electrode, represented by the blue geometry, connected to the RF-
Generator. To keep the symmetry, the “U-form” grounded counter electrode is formed by
the door, the back wall and the perforated grid. This grid has also a protection function:
avoid plasma to burn inside the exhaustion system and therefore to preserve the integrity of
the chamber.
Figure 7 Sketch of the low-pressure plasma chamber used for this thesis

Theoretical part
15
To regulate the process pressure, an adjustable butterfly valve is installed in the gas
exhaustion. During the process, gas is continuously introduced via the gas feed-in system
and the butterfly valve ensures a constant process pressure together with the exhaustion
system. The power is generated by the RF-generator, coupled via the Matchbox with the
electrode. The Matchbox works to compensate the unsteady ohmic resistance of the plasma
and at the same time, the RF-generator is protected against backscattered power.
2.3. Coating properties
The coating process used under the frame of this thesis is shown in Table 1 and it will
be the same performed in all experiments. The idea of this coating, commercially known as
“ReleasePLAS©”, is to enhance the processes where a mold is needed or applications where a
barrier (low surface energy) to attachments (i.e. dirty, insects) is desired [44]. Current
industrial applications which use carbon fibers, especially for the aircraft industry, release
agents are applied in the mold surface before the lamination. Due to this release agent
application, additional steps are required in the production process. The mold must be
cleaned before other lamination can be started and also the demolded product must be
cleaned before moving to the next stage. Either the mold or the parts can be damaged
during the demolding process. This is a drawback in a market where the costs must be
minimized. In this context, a coating with “release” properties is very welcome. The
ReleasePLAS© coating shows the following advantages:
• Protect the mold and the molded part
• Facilitate the demolding of the part
• Chemically stable
• Avoid additional processing steps on the mold and on the molded part
The coating process is divided in 4 steps, each one with a defined purpose. The first
one uses oxygen as precursor gas and is denominated “Activation”. In this step the surface
energy is increased to facilitate the deposition of the primer in the step 2. Still in Step 1,
some surface bonds can be broken which allows a better attachment of the next coating.
The second step is the deposition of a hard coating, mainly a SiOx-characteristic, which works
as a barrier coating. This is important to protect the substrate from corrosion and to
Theoretical part
16
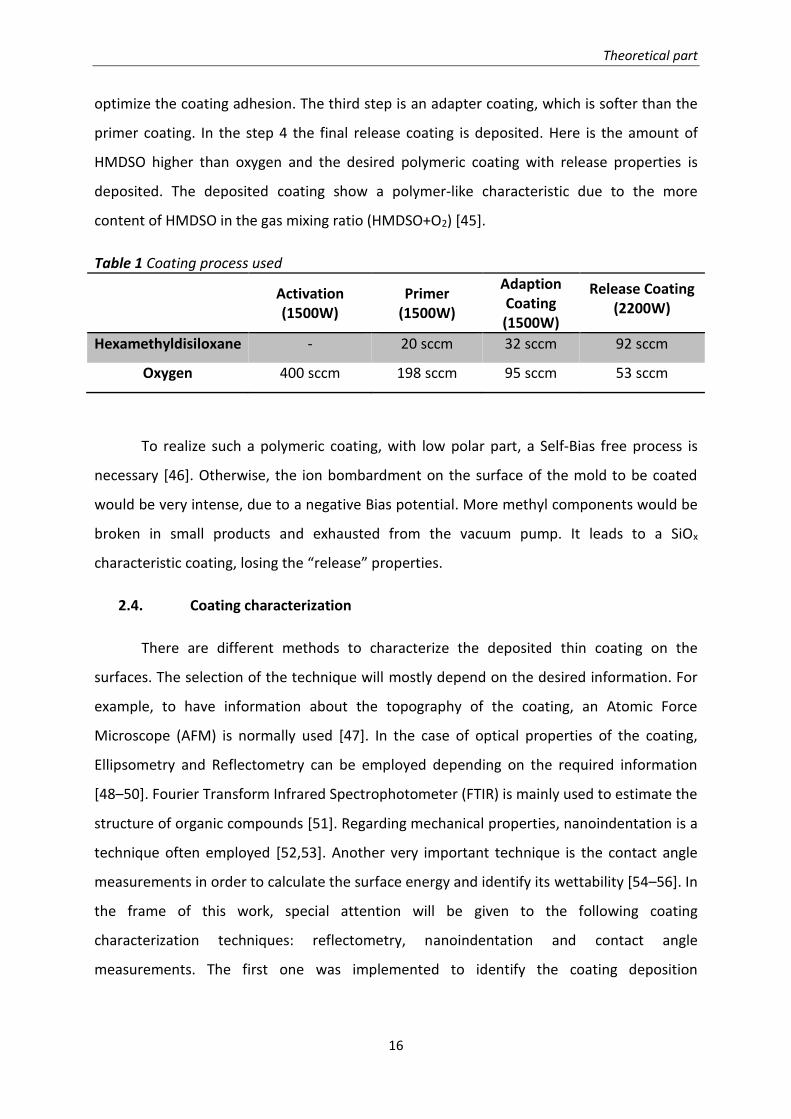
optimize the coating adhesion. The third step is an adapter coating, which is softer than the
primer coating. In the step 4 the final release coating is deposited. Here is the amount of
HMDSO higher than oxygen and the desired polymeric coating with release properties is
deposited. The deposited coating show a polymer-like characteristic due to the more
content of HMDSO in the gas mixing ratio (HMDSO+O2) [45].
Table 1 Coating process used
Activation (1500W)
Primer (1500W)
Adaption Coating (1500W)
Release Coating (2200W)
Hexamethyldisiloxane - 20 sccm 32 sccm 92 sccm
Oxygen 400 sccm 198 sccm 95 sccm 53 sccm
To realize such a polymeric coating, with low polar part, a Self-Bias free process is
necessary [46]. Otherwise, the ion bombardment on the surface of the mold to be coated
would be very intense, due to a negative Bias potential. More methyl components would be
broken in small products and exhausted from the vacuum pump. It leads to a SiOx
characteristic coating, losing the “release” properties.
2.4. Coating characterization
There are different methods to characterize the deposited thin coating on the
surfaces. The selection of the technique will mostly depend on the desired information. For
example, to have information about the topography of the coating, an Atomic Force
Microscope (AFM) is normally used [47]. In the case of optical properties of the coating,
Ellipsometry and Reflectometry can be employed depending on the required information
[48–50]. Fourier Transform Infrared Spectrophotometer (FTIR) is mainly used to estimate the
structure of organic compounds [51]. Regarding mechanical properties, nanoindentation is a
technique often employed [52,53]. Another very important technique is the contact angle
measurements in order to calculate the surface energy and identify its wettability [54–56]. In
the frame of this work, special attention will be given to the following coating
characterization techniques: reflectometry, nanoindentation and contact angle
measurements. The first one was implemented to identify the coating deposition

Theoretical part
17
homogeneity and the last two techniques with the aim of confirm the desired coating
properties (elastic modulus, hardness and surface polarity).
2.4.1. Reflectometry analysis for the measurement of coating thickness
To test the thickness and reflectivity of thin layers, several optical methods are
commonly used due to quickness, precision, and for being a non-destructive testing
technique. The optical reflectometry is a fast and contactless method. It measures thin film
interference (i.e. the amount of light reflected from a thin film over a specified wavelength
range). With this method the thickness is not measured directly but is deduced from the
reflectance spectrum with the help of a mathematical algorithm. For thin layers a regression
analysis (fit algorithm) that allows the determination of the thickness of more than one layer
in a layer stack even with nanometer resolution is used [57].
In the current work, the measurements were done with the Ocean Optics NanoCalc
2000 model as depicted in Figure 8. It is a quick and easy way to measure thickness between
50 and 5000 nanometers for reflective coatings deposited on different substrates.
The NanoCalc series tool is a specialized equipment for measuring thin films. These
are versatile and reconfigurable systems that apply spectroscopic reflectometry to
determine the thickness of thin films in a wide range of substrates [58]. The equipment has a
resolution of up to 0.1 nm and can measure slightly defective and rough surfaces. As a
disadvantage, the use of the equipment presumes that the operator knows the optical
behavior or constants of the substrate and of the coating. Thus, the method is limited to
measuring coatings that are already well known and that have optical constants available in
the software interface.
Figure 8 shows the NanoCalc 2000 along with the sample holder. The sample holder,
located on the bottom right corner of Figure 8, is just a simple metal disc with a support that
holds the tip of the optical measurement device. In order to perform the measurement, the
tip should be at the same distance from the substrate during the measurement as it was in
the reference measurement.

Theoretical part
18
Figure 8 Ocean Optics NanoCalc 2000. Reproduced from [58]
The computer takes the substrate reflectivity measurements for all the specified
wavelengths, usually from 250 nm to 800 nm, and compares them to a previously selected
model of base substrate and coating to fit the thickness.
The equipment has models for many coatings and for many different substrates in its
internal library. For instance, aluminized foil and silicon wafers were used as substrates in
this research. The thickness of the coatings could be measured with good precision and
reliability.
2.4.2. Nanoindentation
Nanoindentation techniques are commonly applied for the characterization of
mechanical properties of thin films at nanoscale. This technique uses indentation load–
displacement data, acquired during one cycle of loading and unloading, to measure hardness
and elastic modulus of a material.
During a typical depth-sensing test, loading initiates both elastic and plastic
deformation under the indenter, while unloading is dominated by recovery of the elastic
deformation. To simplify the modelling, is assumed that deformation during loading is both
elastic and plastic as the permanent hardness impression arises. During unloading, it is
Sample holder

Theoretical part
19
assumed that only the elastic displacement is recovered. The analysis is simplified due to the
elastic nature of the unloading curve [59–61].
Figure 9 Typical load–displacement curve. Reproduced from [60].
Figure 9 shows a typical load–displacement curve, where the parameter 𝑃 defines
the load and ℎ the displacement relative to the initial undeformed surface. Three important
values must be measured from the 𝑃– ℎ curves: the maximum load (𝑃𝑚𝑎𝑥), the maximum
displacement (ℎmax), and the elastic unloading stiffness (𝑆 =𝑑𝑃
𝑑ℎ), defined as the slope of
the upper portion of the unloading curve during the initial stages of unloading (also called
the contact stiffness). Additionally, the permanent depth of penetration after the indenter is
fully unloaded, called final depth (ℎ𝑓), must be also measured.

Theoretical part
20
Figure 10 Deformation pattern of an elastic–plastic material during and after indentation.
Reproduced from [60]
The deformation pattern of an elastic–plastic material during and after indentation is
depicted in Figure 10. It also shows the parameters used in the subsequent equations. Based
on studies from the early 1970s, there is a relationship between the initial unloading contact
stiffness and the reduced modulus (𝐸𝑟) according to the following equation,
𝑆 =2
√𝜋𝐸𝑟√𝐴,
where A is the projected contact area. In order to determine the measured stiffness (S) from
the experiment, the slope (𝑆 = 𝑑𝑃/𝑑ℎ, 𝑃 is the load, and ℎ is the displacement) of the
upper portion of the unloading curve (Figure 9) is used and it depends on the analyzed
material, e.g., within a range of 60–95%.The reduced modulus is given by
1
𝐸𝑟=
(1 − 𝜐2)
𝐸+
(1 − 𝜐𝑖2)
𝐸𝑖,
which includes elastic deformation of the specimen and the indenter. In this context, E and 𝜐
are the elastic modulus and Poisson’s ratio of the specimen, and Ei and 𝜐𝑖 are the same
parameters for the diamond indenter, e.g., a Berkovich indenter (Ei = 1141 GPa and 𝜐𝑖 =
0.07).

Theoretical part
21
The hardness is determined from the measured data by the equation
𝐻 =𝑃𝑚𝑎𝑥
𝐴,
where Pmax is the peak indentation load [60].
The nanoindentation measurements of the plasma polymeric films were carried out
at room temperature using a Tribometer - Universal Material Tester, model UMT3-MT-NH2.
Figure 11 shows an image of the nanoindenter. The thickness of the tested films was about
1 𝜇𝑚, and a Berkovich indenter with a radius of curvature of 200 nm was used.
Figure 11 Measuring head used for the hardness measurements
2.4.3. Contact angle measurements
One of the important properties commonly analyzed within the plasma
polymerization coatings is the wettability of the coated surface. It indicates the degree of
wetting when a solid and liquid interact. Depending on the application, different degree of
wettability can be tailored: from hydrophobic characteristic (low wettability), i.e. large
contact angle (> 90°) to hydrophilic characteristic (high wettability), i.e. small contact
angle(< 90°). Beside that topic, the contact angle for a specific coating gives also an
Theoretical part
22
information about the surface chemistry. So, it can be used to characterize the local
homogeneity of a coating.
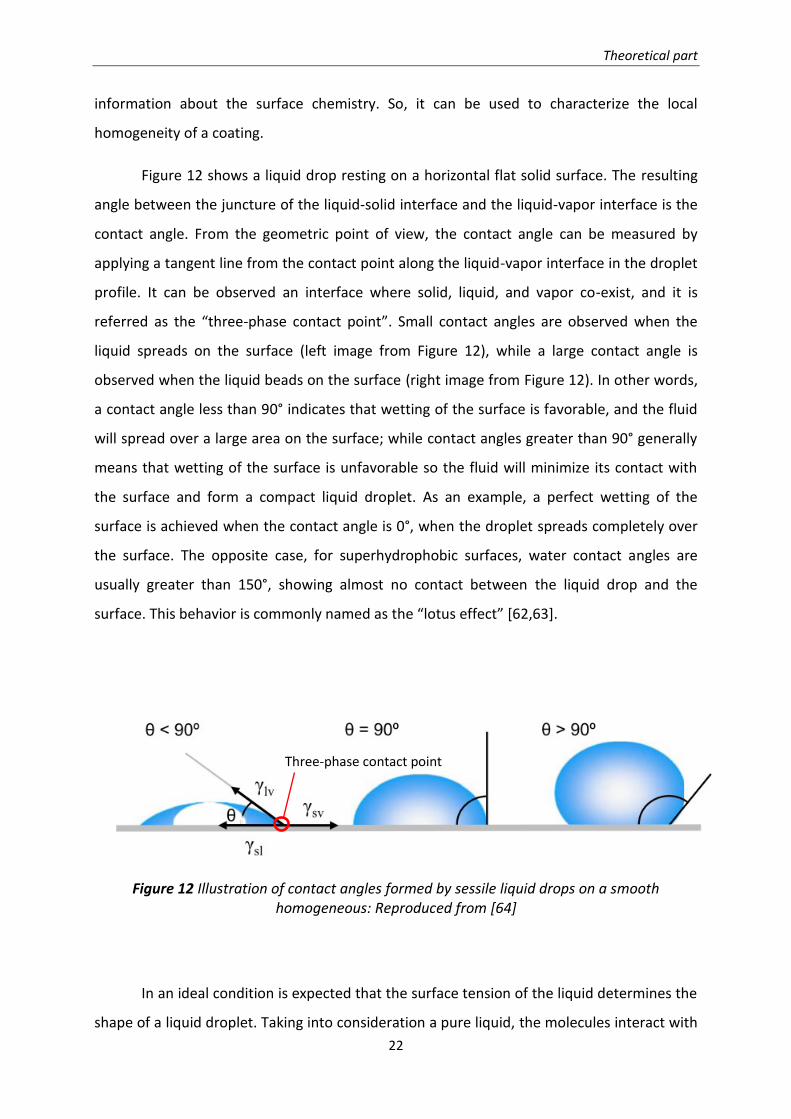
Figure 12 shows a liquid drop resting on a horizontal flat solid surface. The resulting
angle between the juncture of the liquid-solid interface and the liquid-vapor interface is the
contact angle. From the geometric point of view, the contact angle can be measured by
applying a tangent line from the contact point along the liquid-vapor interface in the droplet
profile. It can be observed an interface where solid, liquid, and vapor co-exist, and it is
referred as the “three-phase contact point”. Small contact angles are observed when the
liquid spreads on the surface (left image from Figure 12), while a large contact angle is
observed when the liquid beads on the surface (right image from Figure 12). In other words,
a contact angle less than 90° indicates that wetting of the surface is favorable, and the fluid
will spread over a large area on the surface; while contact angles greater than 90° generally
means that wetting of the surface is unfavorable so the fluid will minimize its contact with
the surface and form a compact liquid droplet. As an example, a perfect wetting of the
surface is achieved when the contact angle is 0°, when the droplet spreads completely over
the surface. The opposite case, for superhydrophobic surfaces, water contact angles are
usually greater than 150°, showing almost no contact between the liquid drop and the
surface. This behavior is commonly named as the “lotus effect” [62,63].
Figure 12 Illustration of contact angles formed by sessile liquid drops on a smooth homogeneous: Reproduced from [64]
In an ideal condition is expected that the surface tension of the liquid determines the
shape of a liquid droplet. Taking into consideration a pure liquid, the molecules interact with
Three-phase contact point

Theoretical part
23
each other in the bulk in a way that each molecule is pulled in the same manner in all
directions by neighboring molecules. These interactions result in a net force of zero.
Nevertheless, the molecules at the surface do not have neighboring molecules in all
directions to provide a balanced net force. As a result, they are pulled inward by the
neighboring molecules (Figure 13) creating an internal pressure. Consequently, the liquid
spontaneously contracts its surface area to maintain the lowest surface free energy, which is
in a spherical format. Spheres have the minimum surface area for a fixed volume. In practice,
external forces such as gravity deform the droplet, thus the contact angle is a compromise
between surface tension and external forces (usually gravity). This intermolecular force to
contract the surface is called the surface tension, and it is responsible for the shape of liquid
droplets. From the theory point of view, the contact angle is expected to be characteristic
for a given solid-liquid system in a certain environment [65].
Figure 13 Representation of the surface tension caused by the unbalanced forces of liquid
molecules at the surface. Reproduced from [64]
The well-known Young´s equation describes the balance at the three phase contact of
solid-liquid and gas [66]. The contact angle of a liquid drop on an ideal solid surface is
defined by the mechanical equilibrium of the drop under the action of three interfacial
tensions:
𝛾𝑙𝑣𝑐𝑜𝑠𝜃𝑌 = 𝛾𝑠𝑣 − 𝛾𝑠𝑙
where 𝛾𝑙𝑣, 𝛾𝑠𝑣, and 𝛾𝑠𝑙 represent the liquid-vapor, solid-vapor, and solid-liquid
interfacial tensions, respectively, and 𝜃𝑌 is the contact angle. The aforementioned equation
is usually referred to as Young’s equation, and 𝜃𝑌 is Young’s contact angle [64].

Theoretical part
24
There are some assumptions for the Young´s equation: the topography should be
smooth and chemically homogenous. With the help of the contact angle measurement it is
possible to determine the surface free energy (SFE) of the solid and identify the polar and
dispersive part. These values are very important to know because they can be used to judge
if the desired properties for a specific application were attended (e.g. a coating with a
function to facilitate the release of the molded part shows a polar part around 1 mN/m).
Surface free energy of the solid corresponds to surface tension of the liquid, thus it has the
same unit “mN/m”.
There are different methods to determine the SFE of a solid surface, for instance:
Owens-Wendt, Kaelble and Wu [67–69]. Under the frame of this work the Wu method was
used. The method according to Wu uses the contact angle with at least two liquids, one
mainly polar and the other dispersive, to calculate the surface free energy of a solid.
Thereupon, the surface free energy is divided into a polar part and a disperse part. In the Wu
calculation a harmonic mean of the disperse part and the polar part is used:
𝛾𝑠𝑙 = 𝛾𝑠𝑣 + 𝛾𝑙𝑣 − 4 [𝛾𝑠𝑣
𝑑 𝛾𝑙𝑣𝑑
(𝛾𝑠𝑣𝑑 + 𝛾𝑙𝑣
𝑑 )+
𝛾𝑠𝑣𝑝 𝛾𝑙𝑣
𝑝
(𝛾𝑠𝑣𝑝 + 𝛾𝑙𝑣
𝑝)]
And if combined with Young´s equation, Wu´s equation can be written as
[𝛾𝑠𝑣
𝑑 𝛾𝑙𝑣𝑑
(𝛾𝑠𝑣𝑑 + 𝛾𝑙𝑣
𝑑 )+
𝛾𝑠𝑣𝑝 𝛾𝑙𝑣
𝑝
(𝛾𝑠𝑣𝑝 + 𝛾𝑙𝑣
𝑝)] = 0.25𝛾𝑙𝑣(1 + 𝑐𝑜𝑠𝜃𝑌)
Wu method for calculating surface energy is mostly used for polymers with low
surface energy (up to 40 mN/m) [70]. Water, diiodomethane and ethylene glycol are often
used for the measurements.
In this work, the contact angle measurements were performed using the equipment
G2 from the company "Krüss". For this purpose, drops in a rate of 0.2 μl/s, with a total
volume of 6 μl, were deposited on the sample surface and the contact angle was measured.
This process was performed at 5 different positions of a sample with three liquids each
(water, ethylene glycol and diiodomethane). The used samples were quartz glasses.
Theoretical part
25
2.5. Plasma Modelling
Plasma process modelling is quite complex due to many reasons. For instance, there
are electrostatic interactions between electrons and ions, the sheath formation and the
influence of the plasma on the thermochemical properties of the material under its
exposure. Besides that, in the case of reactive plasmas, there are countless reactions among
charged particles and neutral species with mostly unknown rate constants. There are some
commercial software packages available in this direction with good achievements, especially
for small plasma chambers applied in the semiconductor industry. However, they are not yet
suitable for large volume chambers and for complex reactive plasma applications [71,72].
Normally, as the reaction information is not complete available, especially regarding the
cross section of the species formed, it is necessary to reduce the number of reactions in the
model which culminates in limited success in the prediction of measured data [73,74]. In
addition, very high computational efforts are still required.
In this work, the modelling effort was therefore restricted to computational fluid
dynamics (CFD) simulations to evaluate the gas flow behavior, i.e. the steady-state condition
before plasma ignition of the existing PECVD chamber and for the suggestion of new
electrodes geometries for different applications. Furthermore, some basic electrostatic
simulations were performed to get more hints over the electric field distribution inside the
plasma chamber.
2.5.1. Computational fluid dynamics (CFD)
For the design of PECVD chambers, fluid dynamic is very significant. Since the process
requires the supply of precursor gases, which through the influence of the plasma will
fragmentize and react with the product surface forming the thin film coating, it is very
helpful to predict and have control over its behavior. Moreover, coating inhomogeneity may
be attributed to adverse gas flow conditions or nonuniform gas velocity close to the
substrates to be coated [31], especially in the case where self-bias does not occur (Vbias=0).
Furthermore, the gas residence time inside the chamber is also one important parameter
because it can lead to different degree of fragmentation, resulting in nonuniform coating
properties [75]. In this scenario, fluid simulation is an important tool, since it gives the

Theoretical part
26
chance to the person in charge of the process to optimize the chamber together with the
constructor, tailoring the project for each application with less risk of rework.
Different authors deal with CFD applied to PECVD processes. Collins et all [76] used
CFD in combination with a one-dimensional simulator to study the deposition of silicon
nitride from an N2-SiH4-NH3 gas composition, through a small single-wafer chamber. Crose
and coauthors developed a multiscale computational fluid dynamics model combining gas
flow simulations (macroscopic level) with Monte Carlo model (microscopic level describing
the thin film growth) for solar cells applications [77]. Da Silva and Morimoto used CFD model
to predict the velocity and temperature curves inside a small plasma chamber for doped and
undoped silicon oxide deposition [78].
Unlike the aforementioned authors, the idea of this thesis is to use CFD simulations
for a large plasma chamber (~1m3) in order to create guidelines for future constructions
regarding gas feed-in systems, gas exhaustion systems and electrode geometry looking
toward to homogeneous deposition rates as well as good coating properties. Effects like the
formation of new gases (e.g. CO2 and H2O through plasma combustion) and the loss through
the deposition process itself are neglected. This is possible because the used plasma process
works with a precursor surplus.
Basically, fluid flows are governed by partial differential equations (PDEs) which
represent conservation laws for the mass, momentum, and energy. Computational Fluid
Dynamics (CFD) is a technique to replace such PDE systems by a set of algebraic equations,
which can be solved using computers. Through mathematical modeling (partial differential
equations), numerical methods (discretization and solution techniques) and the embedded
tools in the software (solvers, pre- and post-processing utilities) the user can have access to
qualitative and quantitative prediction of fluid flows.

Theoretical part
27
2.5.1.1. Governing Equations
In this work Ansys Fluent 16.0® was used for the gas flow simulations. This software
solves the Navier-Stokes equations for transport of mass, momentum, species, and energy
when it calculates laminar flow with heat transfer. Additional transport equations are solved
when the flow is turbulent or when radiative heat transfer is included. Under the frame of
this work, the continuity, energy and momentum equations employed are standard and
therefore will be presented only briefly. For a more detailed description of the flow field
equations, please refer to the Fluent user manual [79].
In a general form, the equation for conservation of mass, or continuity equation, can
be written as follows [80,81]:
𝜕𝜌
𝜕𝑡+ ∇(𝜌�⃗� ) = 0
where 𝜌 represents the gas density and �⃗� the local velocity.
Transport of momentum is calculated by the following form:
𝜕𝜌
𝜕𝑡(𝜌�⃗� ) + ∇(𝜌�⃗� �⃗� ) = −∇p + ∇(𝜏̿) + 𝜌𝑔 + 𝐹
where 𝑝 is the static pressure, 𝜏̿ is the stress tensor, and 𝜌𝑔 and 𝐹 are the
gravitational body force and external body forces, respectively.
Finally, the energy equation can be written as:
𝜕
𝜕𝑡(𝜌ℎ) + ∇(𝜌ℎ�⃗� ) = ∇[(𝑘 + 𝑘𝑡)∇T] + 𝑆ℎ
whereℎ is the sensible enthalpy, 𝑘 is the molecular conductivity, 𝑘𝑡 is the
conductivity due to turbulent transport and the source term 𝑆ℎ includes any volumetric heat
sources defined.
Detailed information about the used boundary conditions and model used under the
frame of this work will be described in chapter 3.

Theoretical part
28
2.5.1.2. Knudsen number
On fluid dynamics the Knudsen (Kn) number is an important parameter to evaluate
and classify the gas flow behavior. The Kn is defined as the ratio between the molecular
mean free path and the characteristic dimension of the flow geometry [82–84]:
Kn=λ
L
where λ is the mean free path and L is the characteristic dimension or characteristic length
of the flow system.
Based on the Kn the degree of rarefaction of the gas and the validity of the
continuum flow assumption can be determined.
According to the Knudsen number the gas flow can be divided in 4 regimes [82–84],
as illustrated in Figure 14. For Kn ≤ 0.001, called continuum flow regime, the continuum
hypothesis is suitable and the flow can be analyzed using the Navier-Stokes equations with
conventional no-slip boundary conditions. For 0.001≤Kn≤0.1, named slip-flow regime,
rarefaction effects start to influence the flow. To use the Navier-Stokes equations tangential
slip-velocity boundary conditions must be provided along the walls of the flow domain.
When the gas becomes more rarefied, 0.1≤Kn≤10, the flow is characterized as transient. For
this regime, as the continuum assumption of the Navier-Stokes equations begins to break
down, alternative simulation techniques such as particle based direct simulation Monte
Carlo (DSMC) approaches must be adopted. For the Kn≥10, the continuum assumption is
completely broken, the regime can then be described as a free molecular flow.
Figure 14 Gas flow regime based on the Knudsen number

Theoretical part
29
The pressure range values in vacuum technology are presented in Table 2. According
to the model configuration, different Kn values can occur for different regions of the PECVD
chamber depending on the variations of the pressure and on the characteristic length
values. For instance, different Kn values can occur when the pressure inside the gas feed-in
distributor is much higher than the pressure inside the chamber. A further reason for
different Kn values is when the characteristic length of the gas feed-in distributor is much
smaller than the characteristic length of the chamber.
Most of all low-pressure PECVD applications work within the medium vacuum range
[85]. For the PECVD chamber condition investigated in this work the Kn value is 0.03. It is in
the range of the slip-flow regime (0.001≤Kn≥0.1), which enable the use of the continuum
hypothesis to simulate the gas flow behavior analyzed using the Navier-Stokes equations
with conventional no-slip boundary conditions [86]. For plasma coating the mean free path
is important regarding the sustaining of the plasma. If the mean free path is much larger
than the sheath or the relevant dimensions of the chamber or of the product, there will be
very few excitation/ionization and the plasma will not sustain [87]. For instance, as a
condition for sustaining plasma, there is a relationship between pressure and distance
between the electrodes:
p.d>0.5(cm.Torr)
where “p” is the pressure and “d” is the distance between the electrodes.
Table 2 Pressure range values in vacuum technology [88]
Vacuum range Pressure in mbar Molecules / cm3 Mean free path
Ambient pressure 1013 2.7 × 10¹⁹ 68 nm
Low vacuum 300 – 1 1019 – 1016 0.1 – 100 µm
Medium vacuum 1 – 10−3 1016 – 1013 0.1 – 100 mm
High vacuum 10−3 – 10−7 1013 – 109 10 cm – 1 km
2.5.2. Electrostatics
For the fragmentation of the precursor gas a radiofrequency generator is used. As
showed in Figure 7, there is a “U form” electrode connected to the RF-generator.
Additionally, the door, perforated grid and back of the chamber build the grounded counter-
electrode. In practice, it means that an electric field is generated inside of the chamber due

Theoretical part
30
to the potential difference between these electrodes. The effect of this electric field is also
investigated on this work through the software Ansys Maxwell®.
Basically, the electrodes of the plasma reactor are considered as a simple capacitor
with a non-usual geometry and therefore the Gauss´s law can be used to determine the
electric field between them. The integral form of Gauss´s law is written as follows:
∮ �⃗� 𝑆
�̂�𝑑𝑎 = 𝑞𝑒𝑛𝑐
𝜀0
The left side of this equation is a mathematical description of the electric flux – the
number of electric field lines – passing through a closed surface “S”, whereas the right side is
the total amount of charge contained within that surface (𝑞𝑒𝑛𝑐) divided by a constant called
the permittivity of free space (𝜀0). The only sources of the electrostatic field are the charges
of the charged particles [89].
The visualization of the electric field of a charged object is very helpful to understand
its influence on the region close to it. The most used visual representations of an electric
field are either field lines that show the direction of the field at each point in space or
arrows. For the first approach, the strength of the field is characterized by the spacing of the
lines, where closer lines represent a strong field. In the case of arrows, the strength of the
field is characterized by the length of the arrow. Some examples of electric field are shown
in Figure 15.
Figure 15 Examples of electric fields in different situations. Reproduced from [90].

Theoretical part
31
Fleish [90] listed on his book some rules of thumb that support the understanding
and also allow to sketch the electric fields produced by charges:
• Electric field lines must originate on positive charge and terminate on negative
charge
• The net electric field at any point is the vector sum of all electric fields present at
that point
• Electric field lines can never cross, since that would indicate that the field points in
two different directions at the same location (if two or more different sources
contribute electric fields pointing in different directions at the same location, the
total electric field is the vector sum of the individual fields, and the electric field
lines always point in the single direction of the total field)
• Electric field lines are always perpendicular to the surface of a conductor in
equilibrium
The boundary conditions and model used for the electric field calculations in this
work will be explained in detail in the section 3.2.3.

Simulation and Experimental Part
32
3. Simulation and Experimental Part
The construction of low-pressure plasma chambers requires special attention for the
development of gas feed-in systems and gas exhaust systems to perform homogenous
coating deposition in all samples surfaces with the same coating properties. Additionally, if it
is desired to use the same chamber for different samples with different geometries and
dimensions, the electrode setup must be well defined to allow the customization of the low-
pressure plasma chamber as well as to attend the desired coating properties and deposition
rates.
In the case of small reactors, for instance applied in the semiconductor industry, as
the flat sample is placed very close and plan parallel to the gas feed-in system, the influence
zone of the supplied gas covers basically all the surface of the material to be coated [91–93].
It means that if the precursor gas flow is not homogeneous over the product surface,
different deposition rates can occur. This kind of application deals with special flat products,
which means high costs, and failure in the process, like inhomogeneous deposition rate, is
highly undesired. One example of such reactor is shown in Figure 16. To homogenize the
precursor gas supply, a perforated plate is used as gas distributor. This plate is perforated in
an organized manner and positioned below the gas feed-in supply system. The idea is to
achieve a homogeneous pressure difference between the upper and the lower region which
allows an even gas distribution over the product to be coated. In this context, Guensuk and
coauthors investigated the influence of the opening area ratio of a showerhead structure
(perforated plate) over the film thickness homogeneity in a small vertical flow coater applied
for Dynamic Random Access Memory (DRAM) manufacturing [94]. They found out that the
optimization of the opening area ratio can change the film deposition profile as well as
improve the film thickness homogeneity. However, the optimization depends also on the
desired coating properties, since a change of the hole opening area leads not just to a
change in the local supply of the precursor gas but also to a change of the local plasma
density and local temperature. Sansonnens and coauthors investigated the film thickness
uniformity likewise for a showerhead-type reactor, used for deposit thin solid films as
amorphous silicon or silicon oxide on photovoltaic solar cells and transistors for flat screen
production. In this case, the gas is supplied from the top electrode (showerhead is integrated

Simulation and Experimental Part
33
to it) and pumped out through the side of the reactor [95]. They showed that the
showerhead-type gas-feed in system improves the coating thickness homogeneity.
Figure 16 Small chamber used for LPCVD (Low Pressure Chemical Vapor Deposition)
developed by Applied Mateirals,Inc. Reproduced from [96]
Regarding the current thesis, the idea is to work with a large plasma-chamber with a
volume order of ~1m3 (Figure 7). It is expected that different gas influence zones are
generated inside the plasma area. One influence zone is created due to the gas feed-in
system and the other one due to the gas exhaustion system. There are naturally other gas
disturbances related to geometric reasons, i.e. geometry of the electrode and the shape and
size of the products to be coated. They also need special attention – but they are not part of
this research work.
3.1. Gas feed-in system
There are different solutions to supply and distribute gas already applied in different
industries. Kulkarni and coauthors investigated different sparger geometries for bubble
column application, as depicted in Figure 17 [97,98]. They compared theoretical models with
experiments and later on with CFD calculations to define layout constructions for straight
and ring pipe spargers. It was found out that the non-uniformity increases with an increase
in the free area and the length of the pipe sparger. Bahroun and coauthors investigated
Perforated plate
(gas feed-in system)
Sample holder
(Si-Wafer)

Simulation and Experimental Part
34
ways to enhance the barrier property of coatings applied inside PET beverage bottles. In this
case, they used CFD tool to develop the gas feed-in system, which consisted of a tube with
diameter smaller than the bottle neck diameter. This tube was installed passing through the
bottle neck until close to the bottom of the bottle where the precursor gas is supplied [99].
Therefore, the gas feed-in system is developed according to each application and depends
also on the process requirements. If the homogeneity of the gas flow is not important like in
activation processes [100], then simple solutions (one tube, one hole) are already suitable.
However, for sensitive process where the homogeneity of the gas flow is highly required,
special attention must be paid to the construction of gas feed-in systems.
Figure 17 Spargers for bubble column reactor: (A) sieve plate sparger; (B) multiple ring sparger; (C) spider; (D) pipe sparger. Adapted from [97,98]
Under the frame of this research thesis, some eligible configurations were listed and
the desired requirements were defined and schematized in Figure 18. The red “x” means out
of requirement, the green mark means that the requirement is satisfied and the circle blue
mark stays for cases where the requirement is partially satisfied. It means that the
construction cannot be applied in plasma processes where coating deposition rate
homogeneity is required but could be applied, for example, to plasma activation process. For

Simulation and Experimental Part
35
the aim of this work, is mandatory a configuration that allows a very homogeneous gas
distribution to the chamber along with applicability in plasma coating process. If these two
requirements can be fulfilled together with versatility, low construction cost and short
construction time then it would be the optimal one. The pipe with open sides, both square
section and circle section, as they present one inlet and one outlet makes the application in
the plasma coating process unfeasible. It will feed the precursor gas just in one position.
Thus a larger volume of the chamber will have poor gas supply. The showerhead
configuration shows a very good homogeneity of gas distribution and applicability to plasma
coating process, but the costs to build it and the time to modify the standard plasma coater
make it unfeasible. The perforated pipe configuration with closed sides and circle section
satisfies almost all the requirements except the plasma applicability. Due to the cylindrical
geometry, its installation is more complicated and this geometry might lead to local plasma
formation. Finally, the perforated pipe with square section satisfies all the established
requirements and therefore was selected to be developed in this research work.
Furthermore, construction guidelines were developed [101] in order to make it easier for
researchers or constructors to take decision in future developments.
Figure 18 Eligible gas feed-in configurations and desired requirements
A perforated pipe (in one surface) with a rectangular section was selected because it
is easier to construct and to install in comparison to a cylindrical one. Different cross-
sections are possible and the pipe itself can be placed easily on an electrode without
creating local plasmas (like tubing may do). The solution with holes distributed in one

Simulation and Experimental Part
36
surface was used since it gives the chance to distribute the gas evenly in the length of the
chamber. Besides that, the perforated pipe is versatile, it can be used even if it is decided to
divide the chamber in small volumes through parts holders or additional electrodes with the
aim for coating more parts. Other solutions as showerhead or perforated plate would
require further work to adapt for new configurations using the same plasma coater.
The selected pipe is closed at both ends. At the bottom of the gas feed-in distributor
the gas inlet is centrally placed. The rectangular pipe contains equally spaced perforations to
provide the gas flow into the PECVD chamber. The sketch of the gas feed-in distributor
model is shown in Figure 19a and the PECVD chamber model is presented in Figure 19b.
Figure 19 a) Gas feed-in distributor model under analysis, b) Gas feed-in distributor position
inside the PECVD chamber.
The objective is to determine and evaluate conditions that influence the gas flow
homogeneity inside the PECVD chambers and therefore also inside the gas feed-in
distributor. Hence, a condition to achieve a homogenous gas flow at every feed-in hole is
related to a constant gas pressure along the whole length of the gas feed-in distributor.
However, the pressure distribution can be mainly influenced by one of the following two
scenarios: (i) due to the gas friction with the internal surface of the pipe the pressure
decreases in the direction of the flow, or (ii) the velocity of the gas is reduced caused by the

Simulation and Experimental Part
37
loss of the gas which is flowing via the holes into the PECVD chamber, i.e. the momentum of
the gas is reduced and the pressure rises in the direction of the flow [15,102].
Consequently, a proper balance between these two influence conditions on the
pressure is crucial to obtain an equal gas feed-in along the length of the distributor. Further
aspects influence the gas flow within this simple construction model as the geometry
parameters. The cross section of the pipe and the number and diameter of the holes, the
length of the pipe, and the flow rate are among the parameters which can strongly cause
changes in the gas flow [103,104]. For this reason, predicting the precursor gas flow inside
the gas feed-in system is very useful for the construction design and consequently to
improve the process performance.
Taking into consideration that the local gas flow behavior cannot be experimentally
directly measured inside a PECVD system, computational fluid dynamics (CFD) simulations
are valuable tools to determine the gas flow behavior inside gas feed-in system in low
pressure environments. The objective was to predict the gas flow behavior inside the gas
feed-in system for achieving a homogeneous gas supply through the investigated pipe holes
and afterwards to compare the calculated pressure with the experimentally measured ones
to validate the simulation results.
3.1.1. CFD simulation
CFD simulations were performed applying the software package Ansys Fluent 16.0®.
First of all, gas flow simulations were performed for five distinct pipe section areas (Figure
20), keeping constant other reference parameters as presented in Table 3, the resulting
curve was named as reference curve. Secondly, the same CFD simulations were performed
varying the values of some parameters as shown in Table 3 under the changed parameters
column. For each simulation one parameter was varied while the others were kept constant.
The pipe was placed on the bottom of the PECVD chamber, as illustrated in Figure 19,
considering a chamber volume of 1 m3.

Simulation and Experimental Part
38
Figure 20 Pipe profiles under analysis (front view)
Table 3 Pipe technical layout under simulation analysis
Changed parameters
Pipe section [mm x mm] Reference parameters
Flow rate
[sccm]
Number of holes
Hole Diameter
[mm]
Pipe length [mm]
*Aspect ratio
6x6 Flow rate [sccm] 200 300 - - - -
10x10 Number of holes 14 - 28 - - -
15x15 Hole diameter [mm] 2 - - 3 - -
20x20 Pipe length [mm] 1000 - - - 2000 -
30x30 Aspect ratio 1 - - - - 2
*Refers to the pipe section aspect ratio keeping constant the equivalent section area
The local gas velocity could not be determined experimentally and in order to
validate the simulations with available experimental data, the pressure values were
calculated via the CFD simulations to obtain a pressure curve. Considering those cases where
experimental and simulation data could be compared, further simulations were performed
varying some of the parameter values to acquire the pressure curve. Hence, for the pipe
section cases of 10mm x 10mm and 30mm x 30mm the simulations were carried out varying
the gas flow rate from 100 to 600 sccm in intervals of 100 sccm, and different number of
pipe holes were considered. These parameters and all the respective values are presented in
Table 4.

Simulation and Experimental Part
39
Table 4 Parameters used for experimental and simulation approach
Pipe section [mm x mm]
Flow rate [sccm]
Number of holes
Hole diameter
[mm]
Pipe length [mm]
10x10 100, 200, 300, 400, 500
and 600
14 2 1000
7 2 1000
30x30 100, 200, 300, 400, 500
and 600
14 2 1000
7 2 1000
The 3D models were created using one symmetry plane (Figure 21) to minimize the
simulation time, keeping a proper mesh resolution. For all carried out CFD simulations
carried out the boundary conditions were defined to reproduce the conditions of the
experiment (Table 5). The number of elements in each model was approximately 2,500,000.
Grid independence tests were performed to determine the greatest mesh refinement. The
mesh was refined inside the pipe, inner holes, gas inlet and gas outlet. The solutions were
converged when all the residuals were smaller than 10-5 for the continuity and momentum
equations and smaller than 10-6 for the energy equation.
Figure 21 System model with XY symmetry plane

Simulation and Experimental Part
40
Table 5 Boundary conditions
Model Boundary conditions Values
Laminar flow with low pressure boundary slip
Ideal gas
Steady state
Gas Temperature 298.15 [K]
Wall Temperature 298.15 [K]
Mass flow rate of N2
(inlet) *variable [kg/s]
Pressure (outlet) 0.03 [hPa]
*Different flow rates were applied according with the objective desired. The unit [sccm] was
converted to [kg/s].
3.1.2. Experimental pressure measurements
Experiments were conducted inside a 1m3 PECVD chamber for two different pipe
section area values and for pipes containing 7 and 14 holes (Table 4), leading a total of four
pipe configurations (i.e. four pressure measurement trials were performed). For all cases
2mm holes were manually drilled using a drilling machine. For each trial the nitrogen gas was
used as working gas. The gas flow rate varied from 100 to 600 sccm and the pressure value
on the gas outlet was kept equal to 0.03 hPa.
The pressure was measured in one of the closed sides of the pipe using a handheld
vacuum gauge (Pfeiffer TPG202) and compared to the previous simulations predictions. The
experiment setup is shown in Figure 22.
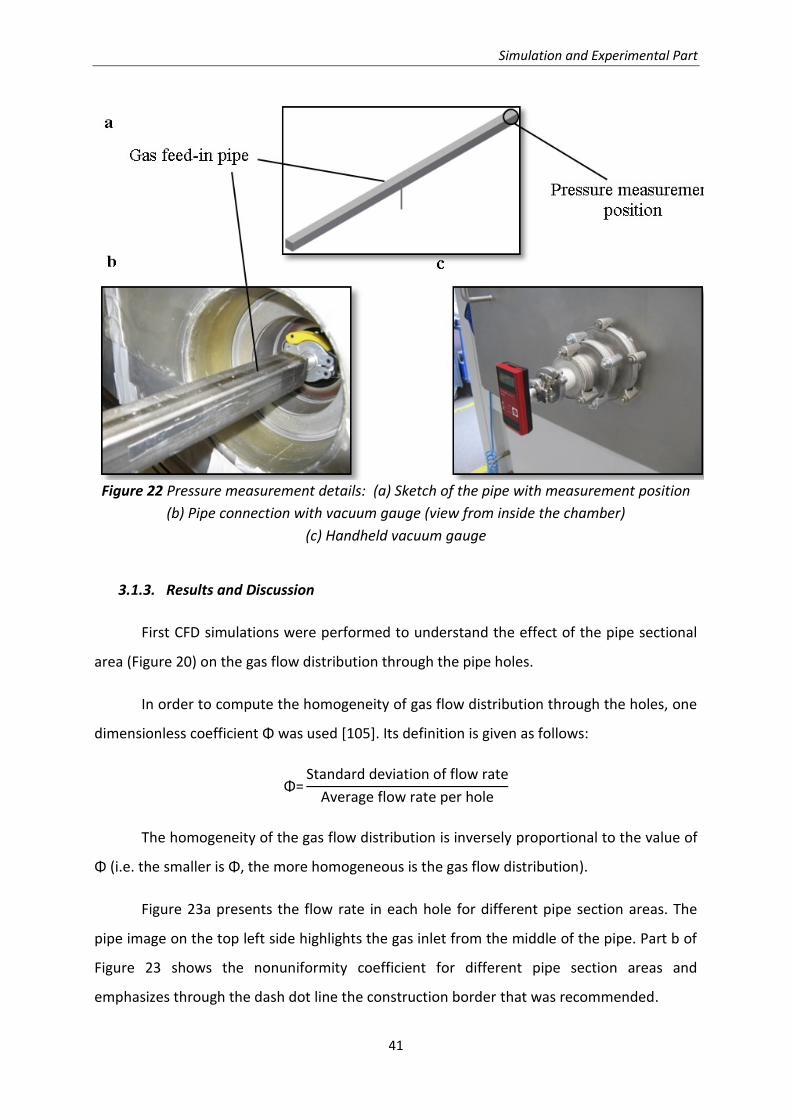
Simulation and Experimental Part
41
Figure 22 Pressure measurement details: (a) Sketch of the pipe with measurement position
(b) Pipe connection with vacuum gauge (view from inside the chamber)
(c) Handheld vacuum gauge
3.1.3. Results and Discussion
First CFD simulations were performed to understand the effect of the pipe sectional
area (Figure 20) on the gas flow distribution through the pipe holes.
In order to compute the homogeneity of gas flow distribution through the holes, one
dimensionless coefficient Φ was used [105]. Its definition is given as follows:
Φ=Standard deviation of flow rate
Average flow rate per hole
The homogeneity of the gas flow distribution is inversely proportional to the value of
Φ (i.e. the smaller is Φ, the more homogeneous is the gas flow distribution).
Figure 23a presents the flow rate in each hole for different pipe section areas. The
pipe image on the top left side highlights the gas inlet from the middle of the pipe. Part b of
Figure 23 shows the nonuniformity coefficient for different pipe section areas and
emphasizes through the dash dot line the construction border that was recommended.

Simulation and Experimental Part
42
The flow rate tends to decrease from the gas inlet to the sides of the pipe, i.e. the
holes closer to the gas inlet discharge more gas, as depicted in Figure 23a. It indicates that
the friction effects may predominate. Further evidence from these effects are displayed in
Figure 24a and Figure 24b, where the pipe with smaller section area, and thus more pressure
drop, presented more pressure gradient than the pipe with larger section area.
Under the frame of this research thesis, the acceptable values of the dimensionless
coefficient Φ was defined in the range Φ < 5%, because within this scale the gas feed-in
inhomogeneity is negligible, i.e. the gas velocity through the holes is still similar. Therefore,
this value is applied in this work as construction border value (Figure 23b).
Figure 23 Influence of the pipe section area in the distribution homogeneity (a) Gas flow
distribution through holes and (b) Non-uniformity coefficient obtained for the different pipe
section values considered. The results are shown via the points; the lines connecting the
points in the plot are only to support guiding the eyes and are not modelled fits.
In the Figure 23a it can also be observed that there is a cross point between holes 10
and 11. Additionally, it is noteworthy that since only the cross-section area was changed, all
plots display the same behavior. Because the difference of flow rate between the holes is a
consequence of the pressure drop, the cross point suggests that the mean pressure inside
the pipe is always achieved in the same distance from the inlet for all the configurations
under analysis.
The results of the pressure contour and velocity contour for two different pipe
section areas and gas flow rate of 200 sccm are depicted in Figure 24. Figure 24a refers to

Simulation and Experimental Part
43
the pipe with 10 mm x 10 mm section area. The left image from Figure 24a show the
pressure contour inside the chamber (blue) and inside the pipe (gradient color). The right
image from Figure 24a shows the velocity contour inside the chamber (blue gradient) and
inside the pipe (gradient color). Likewise, Figure 24b shows the pressure contour (left) and
velocity contour (right) for the pipe with 30 mm x 30 mm section area. For instance,
regarding the pressure, both Figure 24a (left) and Figure 24b (left) present a homogeneous
blue color inside the chamber. Nevertheless Figure 24a (left) shows a gradient color inside
the pipe (10mm x 10mm). The same pattern is not observed inside the 30 mm x 30 mm pipe
in Figure 24b (left). Concerning velocity contour, Figure 24a (right) and Figure 24b (right)
show a blue gradient inside the chamber. This is a hint of how much of the chamber gas
volume is influenced by the gas feed-in system and by the gas outlet (gas exhaust system).
Similarly, Figure 24a (right) presents a gradient color inside the 10 mm x 10 mm pipe. Figure
24b (right) shows also a color gradient inside the 30mm x 30mm pipe but slighter in
comparison with Figure 24a (right). These plots contours are a visual representation of the
nonuniformity coefficient of Figure 23b. For example, for the smaller section area pipe
(10 mm x 10 mm) higher pressure and velocity gradient are found inside the pipe resulting in
a higher nonuniformity coefficient in comparison with the bigger one (30 mm x 30 mm).

Simulation and Experimental Part
44
Figure 24 Pressure contour and velocity contour a) 10 mm x 10 mm b) 30 mm x 30 mm
Aiming at evaluating the influence of further parameters on the homogeneity of the
gas flow distribution, additional simulations were done using the parameters as presented in
Table 3. In Figure 25 is plotted the nonuniformity coefficient in a logarithmic scale for five
different pipe section areas: 6 mm x 6 mm, 10 mm x 10 mm, 15 mm x 15 mm,
20 mm x 20 mm and 30 mm x 30 mm in diverse parameters arrangement. For each case, one
parameter was changed keeping the others constant. The parameters varied were: flow rate,
pipe length, number of holes, hole diameter and aspect ratio of the pipe section. It is
observed that with an increase of the gas flow the homogeneity of the gas distribution
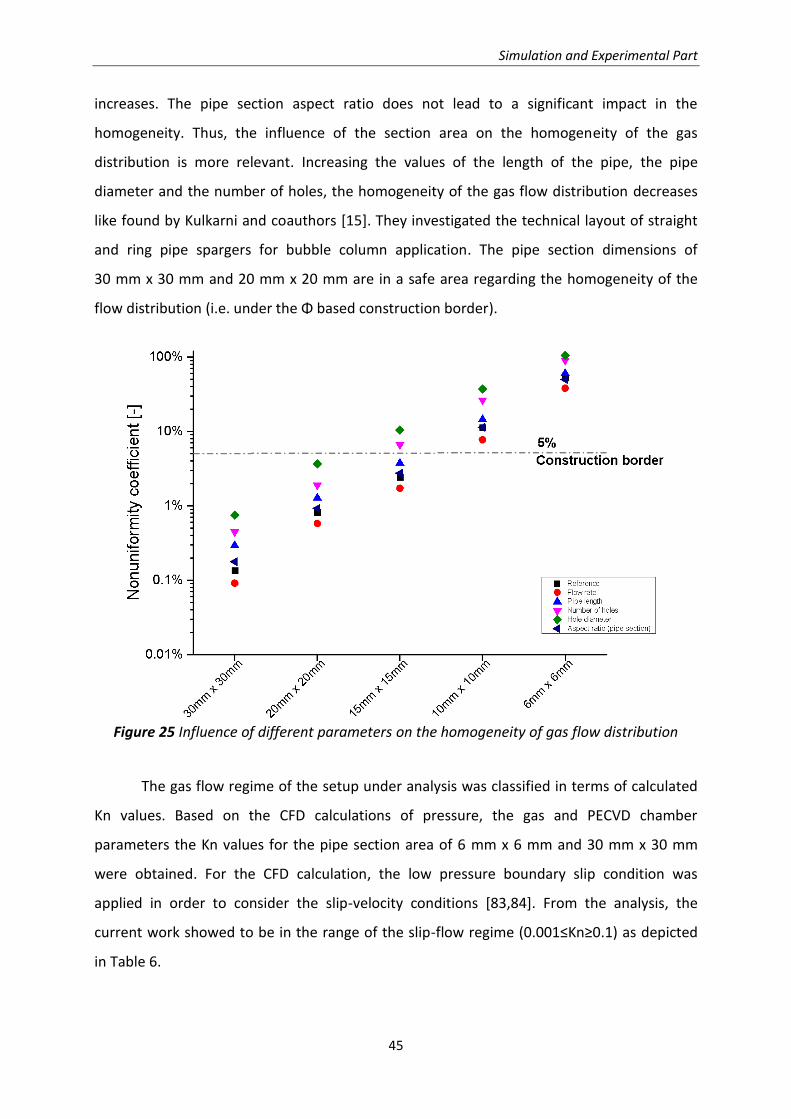
Simulation and Experimental Part
45
increases. The pipe section aspect ratio does not lead to a significant impact in the
homogeneity. Thus, the influence of the section area on the homogeneity of the gas
distribution is more relevant. Increasing the values of the length of the pipe, the pipe
diameter and the number of holes, the homogeneity of the gas flow distribution decreases
like found by Kulkarni and coauthors [15]. They investigated the technical layout of straight
and ring pipe spargers for bubble column application. The pipe section dimensions of
30 mm x 30 mm and 20 mm x 20 mm are in a safe area regarding the homogeneity of the
flow distribution (i.e. under the Φ based construction border).
Figure 25 Influence of different parameters on the homogeneity of gas flow distribution
The gas flow regime of the setup under analysis was classified in terms of calculated
Kn values. Based on the CFD calculations of pressure, the gas and PECVD chamber
parameters the Kn values for the pipe section area of 6 mm x 6 mm and 30 mm x 30 mm
were obtained. For the CFD calculation, the low pressure boundary slip condition was
applied in order to consider the slip-velocity conditions [83,84]. From the analysis, the
current work showed to be in the range of the slip-flow regime (0.001≤Kn≥0.1) as depicted
in Table 6.

Simulation and Experimental Part
46
Table 6 Knudsen number using 200 sccm of N2 for two different pipe section areas:
6 mm x 6 mm and 30 mm x 30 mm
Pipe section area
(mm x mm)
Pressure
(mbar)*
Mean free path
(mm)
Characteristic length
(mm) Kn
6x6 1.42 0.07 6 0.012
30x30 0.78 0.13 30 0.004
*Pressure (mbar) calculated using the CFD software
Considering that the local gas flow behavior inside a PECVD chamber cannot be
experimentally directly measured, the measurement of pressure values is employed to
validate the simulations. The pressure inside the pipe (measured at one side of the pipe) and
the pressure calculated with the CFD software in both cases changing the gas flow rate are
plotted in Figure 26. Figure 26a shows in detail the experimentally measured (Exp) and
calculated (Calc) pressure values for the pipe with 10 mm x 10 mm section area and 7 holes.
Figure 26b, right beside shows the results for a pipe with 14 holes. Likewise, Figure 26c and
Figure 26d display the measured and calculated pressure values for the pipe with 30 mm x
30 mm section area.
The simulations agree with experimental findings leading to a maximum error of 10%.
For instance, concerning the 10 mm x 10 mm pipe section area with 7 holes and flow rate of
200 sccm the internal measured pressure in one side of the pipe was 1.4 hPa and the
calculated one was 1.3 hPa. This variance could be attributed to the fact that the drilled
holes were not perfectly with 2 mm diameter due to the manual preparation process,
especially for the pipe with larger section area. Thus more holes would mean a statistical
average that is closer to the model.

Simulation and Experimental Part
47
Figure 26 Comparison of pressure values obtained through experiments and simulations
(a) & (b) Pipe section 10 mm x 10 mm; (c) & (d) Pipe section 30 mm x 30 mm
The main conclusions extracted from the results are:
a) From the analyzed parameters the pipe section area is the most relevant one
influencing the homogeneity of gas distribution.
b) By decreasing the pipe section area, the pressure gradient increases, resulting
in a nonhomogeneous gas distribution through the holes. For instance, the
nonuniformity coefficient for the 30 mm x 30 mm pipe section area is 0.1% and for
the 6 mm x 6 mm one 45%.
c) Taking the construction border (Φ <5%) into consideration the results show
that the pipe section area above 20 mm x 20 mm are in a safety area regarding the
homogeneity of gas distribution. It means that pipes with section area larger than
20 mm x 20 mm allow more flexibility to change other layout parameters, like hole
diameter and pipe length, keeping the nonuniformity coefficient under 5%.

Simulation and Experimental Part
48
d) The pressure values from the CFD simulations are in good agreement with the
obtained experimental data.
The knowledge acquired with the CFD calculations in agreement with experimental
pressure measurements are very helpful for researchers and constructors to develop new
gas feed-in systems for low-pressure plasma chambers.
3.2. Gas exhaustion system
Figure 27 shows a gas simulation result from the current setup of the low-pressure
plasma chamber used for this research with a smaller scale bar range. The influence zone of
the gas feed-in system is depicted in Figure 27 and it represents a small fraction of the
plasma chamber volume. The gradient color, which means velocity gradient, extends over
approximately 5cm from the pipe holes. Nevertheless, it is very important to have it in mind
before an experiment or a complete construction project of a low-pressure plasma chamber
is done. From the gas exhaustion system point of view, its influence zone is much larger than
the one from the gas feed-in system. The gradient color is much more intense in the region
of the exhaustion system in comparison to the gas supply region. Having this picture in mind,
in a coating process is expected to see a similar pattern which would represent a gradient in
the deposition rate.

Simulation and Experimental Part
49
Figure 27 Gas simulation result showing the two dissimilar influence zones of the gas feed-in and of the gas exhaustion
To verify the current condition of the low-pressure plasma chamber regarding the
deposition rate distribution, an experiment was planned, as showed in Figure 28. The
experiment consisted in coating Si-Wafers equally distributed in the volume of the chamber
and in floating potential (i.e. the samples were not direct in contact with the electrodes). To
perform it, the Si-wafers were fixed on a quartz glass (Figure 28) and this assembly was fixed
to a nylon wire and hanged at the perforated grid. A total of 25 nylon wires were used, each
one with three assemblies of Si-wafers + Glass equally spaced. As shown in Figure 28 there is
a “U” form electrode system, which is connected to the RF-generator and the other “U” is
formed with the grounded electrodes. Hence, the area ratio of powered electrode to
grounded electrode is equal one, which means a Self-Bias free process.
5cm
100cm
Influence zone
– gas feed-in
Influence zone
– gas exhaustion
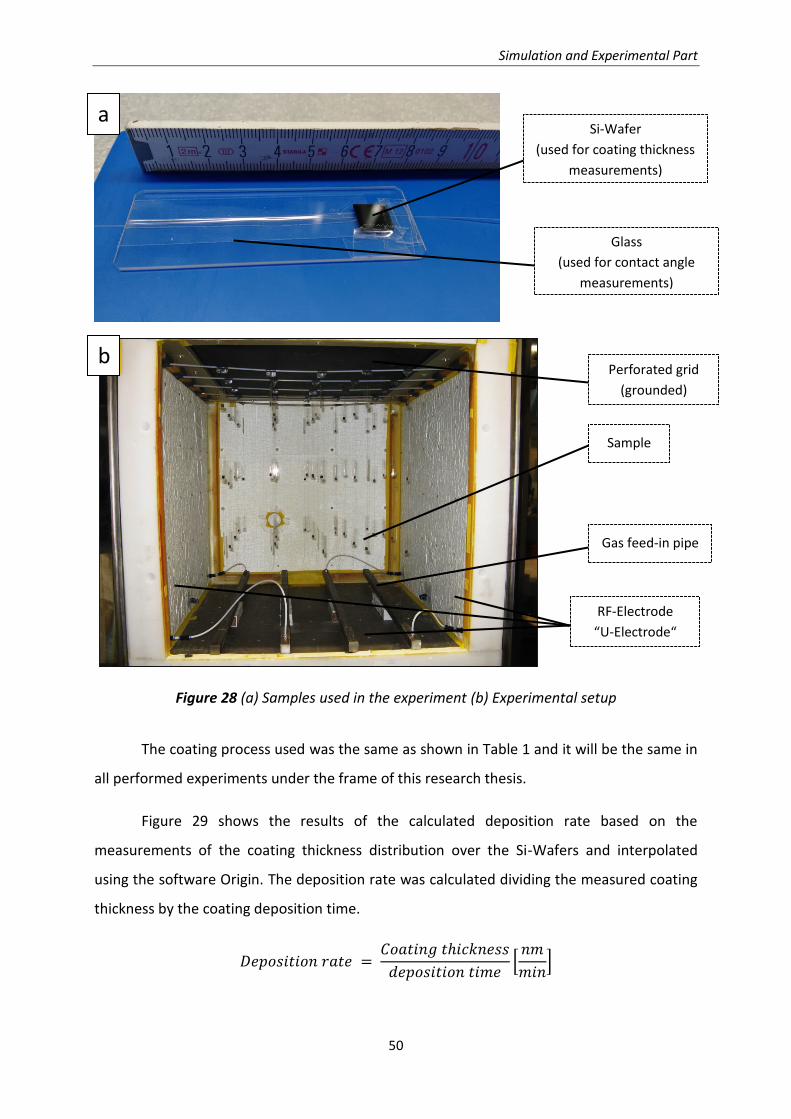
Simulation and Experimental Part
50
Figure 28 (a) Samples used in the experiment (b) Experimental setup
The coating process used was the same as shown in Table 1 and it will be the same in
all performed experiments under the frame of this research thesis.
Figure 29 shows the results of the calculated deposition rate based on the
measurements of the coating thickness distribution over the Si-Wafers and interpolated
using the software Origin. The deposition rate was calculated dividing the measured coating
thickness by the coating deposition time.
𝐷𝑒𝑝𝑜𝑠𝑖𝑡𝑖𝑜𝑛𝑟𝑎𝑡𝑒 = 𝐶𝑜𝑎𝑡𝑖𝑛𝑔𝑡ℎ𝑖𝑐𝑘𝑛𝑒𝑠𝑠
𝑑𝑒𝑝𝑜𝑠𝑖𝑡𝑖𝑜𝑛𝑡𝑖𝑚𝑒[𝑛𝑚
𝑚𝑖𝑛]
Si-Wafer
(used for coating thickness
measurements)
Glass
(used for contact angle
measurements)
Sample
Gas feed-in pipe
a
b Perforated grid
(grounded)
RF-Electrode
“U-Electrode“

Simulation and Experimental Part
51
The calculated deposition rate was plotted using a color contour graphic. This kind of
plot was used to make easier the understanding in a way that a 3D experiment is showed in
a 2D graphic. In this case, low deposition rate and high deposition rate are represented in
blue and red, respectively.
The results are showed in three different planes: top plane (Figure 29a), middle plane
(Figure 29b) and bottom plane (Figure 29c). Each plane contains 25 samples. Their positions
are represented by the black points in each image.

Simulation and Experimental Part
52
Figure 29 Coating deposition rate distribution (a) top plane (b) middle plane (c) bottom plane
In all three planes (bottom, middle and top plane), high deposition rates on the edges
(close to the electrodes) and low deposition rates in the middle were observed. A high
difference can be seen between the middle chamber and in their edges. These results
suggest that there is a not homogeneous gas flow inside the chamber. Additionally, Figure
30 shows clearly that the deposition rate increases from bottom plane to the top plane while
in the bottom and middle plane was practically the same. Furthermore, very high standard
deviations can be observed, especially in the bottom and middle plane. Since there is no
literature available to compare these values, as coating deposition is process and chamber
dependent, the values obtained are the reference starting points for new improvements in
nm/min
b a
c
Perforated grid
(grounded)
RF-Electrode
Gas feed-in
system
Gas exhaustion
system
Bottom plane
Middle plane
Top plane
Reference view
Top plane Middle plane
Bottom plane

Simulation and Experimental Part
53
the standard low-pressure plasma chamber focusing on reducing the inhomogeneity. In this
experiment, the top plane showed the lowest inhomogeneity and it was calculated by the
following equation:
𝐼𝑛ℎ𝑜𝑚𝑜𝑔𝑒𝑛𝑒𝑖𝑡𝑦(%) =𝑆𝑡𝑎𝑛𝑑𝑎𝑟𝑑𝐷𝑒𝑣𝑖𝑎𝑡𝑖𝑜𝑛𝑜𝑓𝑑𝑒𝑝𝑜𝑠𝑖𝑡𝑖𝑜𝑛𝑟𝑎𝑡𝑒
𝐴𝑣𝑒𝑟𝑎𝑔𝑒𝑜𝑓𝑑𝑒𝑝𝑜𝑠𝑖𝑡𝑖𝑜𝑛𝑟𝑎𝑡𝑒
Figure 30 Average of deposition rate - Experiment current setup
To get a better understanding about the reasons why the current setup showed the
aforementioned pattern, gas flow simulations were performed.
3.2.1. CFD Simulation
The CFD simulations were performed applying the software package Ansys Fluent
16.0®. A quarter of the model was used. It allows shorter simulation time and mesh
refinement at important regions (gas feed-in holes and gas exhaustion region). Moreover,
they require relatively less modelling effort (e.g. pre-processing) when compared to a full
model analysis. Figure 31 (part a and b) show the full model of the experiment setup and
part c of Figure 31 shows the quarter of the experiment setup model which was used for the
gas flow simulation. It can also be seen that the metallic perforated grid (grounded) was not
included in the gas simulation due to process limitation of the computer used. As the name
already suggests, perforated grid, is a metallic grid completely perforated with 1 mm
diameter holes in sequence. It means that by adding the perforated plate to the simulation

Simulation and Experimental Part
54
the number of elements to be calculated would jump from less than 106 to more than
20*106 which makes unfeasible the calculation.
Figure 31 Model of the experiment setup (a) Isometric view (b) Front view (c) isometric view of a quarter of the model
For all CFD simulations carried out the boundary conditions were defined to
reproduce the conditions of the experiment (Table 7). The number of elements in each
model was approximately 3,000,000. Grid independence tests were performed to determine
the greatest mesh refinement. The mesh was refined in the gas feed-in pipe, inner holes and
close to the gas exhaustion system. The solutions were converged when all the residuals
a b
c
Gas exhaustion
system
Samples
Gas feed-in
system

Simulation and Experimental Part
55
were smaller than 10-5 for the continuity and momentum equations and smaller than 10-6 for
the energy equation.
Table 7 Boundary conditions for the gas flow simulation of the experiment
Model Boundary conditions Values
Laminar flow with low pressure
boundary slip
Gas Temperature 298.15 [K]
Ideal gas Wall Temperature 298.15 [K]
Steady state
Mass flow rate of N2
(inlet) 2.76E-06 [kg/s]
Pressure (outlet) 0.015 [hPa]
The results from the gas flow simulation of the experiment setup are depicted in
Figure 32, where part a represents the top plane, part b middle plane and part c bottom
plane. To make the results more visual, the simulation result for the quarter model was
mirrored in the two symmetry planes. From Figure 32 is observed that the gas obtains high
velocity in the middle, represented by the red color, and low velocity near to the walls
represented by the dark blue color. It is also showed that the gas velocity increases toward
the gas exhaustion system, from bottom plane to top plane. Additionally, the samples
influenced the gas flow inside the chamber characterized by the lower velocities closed to
them in comparison to the neighbor region.

Simulation and Experimental Part
56
Figure 32 Gas simulation results of the experiment- Current setup
Symmetry
planes
c
b
a

Simulation and Experimental Part
57
Based on the experimental and on the gas simulation results the following
hypotheses are formulated:
• The gas exhaustion system is influencing the coating deposition rate
• Higher velocities (in the chamber middle) lead to lower deposition rates and
lower velocities (near to the walls) lead to higher deposition rates.
Nevertheless, it cannot explain why the top plane showed higher deposition
rates as it showed higher gas velocity average
• The gas flow plays a role in the homogeneity of the coating deposition rate
• The gas feed-in system is apparently not influencing the coating deposition
rate for the current setup
With the aim of verify the previous hypotheses, it was necessary to create new
solutions to modify the gas flow inside the chamber by reducing the influence of the gas
exhaustion system. In this context, three eligible configurations were considered and the
desired requirements were defined and schematized in Figure 33. The red “x” means out of
requirement and the green mark means that the requirement is satisfied. Mandatory is a
configuration that allows very homogeneous gas exhaustion from the chamber along with
applicability in plasma coating process. If these two requirements can be fulfilled together
with versatility, low construction cost and short construction time then it would be the
optimal one. The standard condition of the plasma-coater is a large (260 mm diameter)
central exhaustion flange with a perforated metallic grid installed under it. One idea is to
substitute this single flange for more flanges and distribute them in an organized way on the
top of the plasma chamber. This construction can homogenize the gas exhaustion once the
low pressure inside the plasma chamber is taken into consideration. This is a different
situation from the gas feed-in where inside the pipe a high pressure is generated. It means
that the dimensions of the flanges must be carefully designed so as to reduce the pressure
drop and not to jeopardize the vacuum pump capacity. However this solution offers very low
versatility, high construction cost and high construction time. Other alternative evaluated
was the installation of perforated pipes (without the bottom surface) between the
perforated metallic grid and the central exhaustion flange. These kinds of pipes would be
manufactured in a plate with the aim to let the gas exhaustion just through the pipe holes.
This solution can achieve homogeneous gas exhaustion as well with relative low construction

Simulation and Experimental Part
58
cost. Nevertheless, it requires time to construct and it is not versatile. Any future change
would imply in time and money cost. Lastly, a solution with a thin perforated plate installed
over the perforated metallic grid was evaluated and it satisfies all the defined requirements.
As the plate is thin, the pressure drop will not be significant which allows a larger range of
holes diameter. Therefore, the hole diameter can be tailored taking into consideration the
vacuum pumping capacity to achieve the desired working pressure. Moreover, this
configuration allows quick modifications, has low cost and short construction time.
Therefore, this idea was selected to be developed in this research work.
Through the development of gas feed-in systems, was shown in the previous section
(3.1) that the pressure inside the gas feed-in pipe must be homogeneous and higher than
the chamber pressure to achieve an even gas supply through the pipe holes. The same
principle was applied for the gas exhaustion system with the aim to remove the gas evenly
from the low-pressure chamber and to allow a homogeneous gas flow distribution inside it.
Figure 33 Eligible gas exhaustion configurations and desired requirements
In this context, a perforated plate was developed. It was named Baffle Plate. It is
similar to ideas used in other applications, i.e. control the fluid flow for instrumentation
accuracy requirements [106]. The idea is to create comparable effect, like the installation of
more flanges, but in a simpler manner from the construction point of view. This effect can be
achieved by the Baffle Plate where the holes will act as smaller “exhaustion systems”
without huge modifications in the low-pressure plasma chamber and it avoids high
investments. The challenge is to develop this Baffle Plate in a way that all the holes will show
the same pressure difference between the regions under and above the holes what will

Simulation and Experimental Part
59
imply in homogenous gas exhaustion from each hole. Thereupon, it is very important to
define the influence of the Baffle Plate layout constructions on pressure loss through the
holes. The constructor needs to take into consideration the desired work pressure and the
pump suction capacity by developing the Baffle Plate. This is very important since the control
over the gas residence time, which can be achieved through the control over the working
pressure by installation of the Baffle Plate, can reduce the powder formation.
The first step was to use the support of the simulation tool (Ansys Fluent 16.0®) to
achieve the desired configuration. Figure 34 shows two different configurations of the baffle
plate, which were used in the gas simulation. Part a from Figure 34 shows a baffle plate with
a radial distribution of the holes and part b shows a baffle plate with a linear distribution of
the holes. Both of them have the same number of holes, which is 30, and same hole
diameter (18 mm).
Figure 34 Baffle plate model a) radial distribution b) linear distribution
The simulations with the baffle plate assembled were done in the same way as for
the current setup of the low-pressure plasma chamber. Just a quarter of the model was used
for the simulation and to make the velocity distribution more visual, the results were
mirrored with the symmetry planes. Figure 35 shows the gas simulation results for two
different baffle plate configurations. Figure 35a represents the baffle plate with radial
distribution of the holes and Figure 35b represents the baffle plate with linear distribution of
the holes. For the case where the holes were radially distributed (Figure 35a) it can be seen

Simulation and Experimental Part
60
that in the middle the velocity is still much higher than on the borders, although in reduced
scale in comparison with the Figure 32b where no Baffle Plate is installed. This is
characterized by the color gradient which red means high velocity and dark blue means low
velocity. For the case where the holes were linearly distributed (Figure 35b) no strong
gradient could be observed. There is a large area with a light green and then again dark blue
close to the walls. It means that for the construction of effective baffle plates not just the
amount and diameter of the holes are important but also their distribution. It is essential to
have the holes distributed in a way that all the active area of the low-pressure chamber is
covered. The constructor must also have in mind the desired working pressure to develop
the suitable baffle plate. The working pressure is also one important parameter along to the
gas precursor ratio and the supplied power to achieve the desired coating properties.
Figure 35 Gas flow simulation results for two different baffle plates assembled (a) radial distribution of the holes (b) linear distribution of the holes

Simulation and Experimental Part
61
To validate the calculated values, as it is not possible to measure the gas velocity
inside the low-pressure plasma chamber, pressure measurements were done varying the gas
flow from 100sccm to 600sccm and the measured data were compared to the calculated
ones. For these measurements, the empty chamber was used, i.e. no samples inside.
Figure 36a show the pressure contour for 200sccm gas flow. It can be observed that
the highest pressure is inside the gas feed-in pipe (~50Pa) and the lowest is above the baffle
plate (~1Pa). Moreover, the pressure inside the chamber is very homogeneous (1.4Pa). This
is the reason why the gas flow was more homogenous with the baffle plate installed (Figure
35b). The pressure measurements were done in the two points as depicted in Figure 36b,
one in the gas exhaustion and the other one from a flange in the back of the chamber.
Figure 36 (a) Pressure contour [simulation] (b) Scheme of the low-pressure chamber showing the positions where the pressure was measured
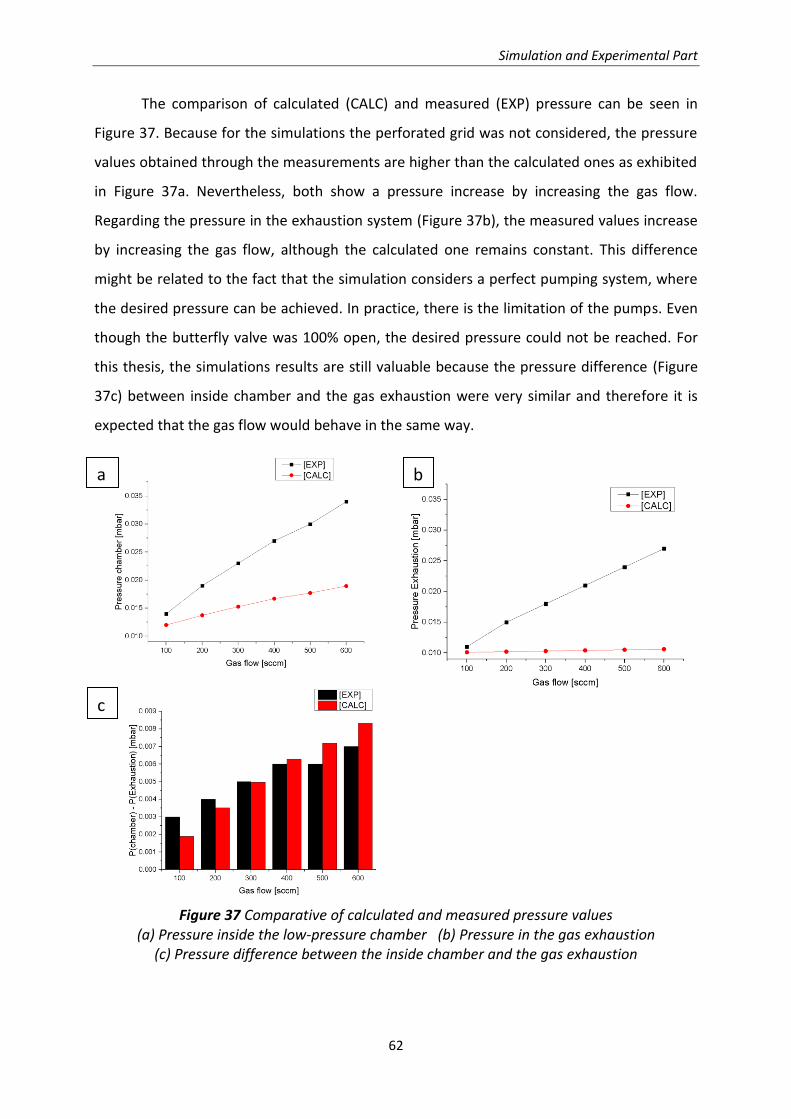
Simulation and Experimental Part
62
The comparison of calculated (CALC) and measured (EXP) pressure can be seen in
Figure 37. Because for the simulations the perforated grid was not considered, the pressure
values obtained through the measurements are higher than the calculated ones as exhibited
in Figure 37a. Nevertheless, both show a pressure increase by increasing the gas flow.
Regarding the pressure in the exhaustion system (Figure 37b), the measured values increase
by increasing the gas flow, although the calculated one remains constant. This difference
might be related to the fact that the simulation considers a perfect pumping system, where
the desired pressure can be achieved. In practice, there is the limitation of the pumps. Even
though the butterfly valve was 100% open, the desired pressure could not be reached. For
this thesis, the simulations results are still valuable because the pressure difference (Figure
37c) between inside chamber and the gas exhaustion were very similar and therefore it is
expected that the gas flow would behave in the same way.
Figure 37 Comparative of calculated and measured pressure values (a) Pressure inside the low-pressure chamber (b) Pressure in the gas exhaustion
(c) Pressure difference between the inside chamber and the gas exhaustion
a b
c

Simulation and Experimental Part
63
The curves generated by the measurement and/or calculation of the pressure inside
the chamber and over the Baffle Plate as showed in Figure 37 are important tools to keep
the working pressure under control and consequently to avoid powder formation during
deposition.
With the aim of create guidelines for the construction of Baffle Plates additional gas
flow simulations were accomplished. Bayazit and coauthors [107] showed that for laminar
flow regime the larger pressure drop occurred for larger plate thickness (𝑡
𝐷= 1), where “t”
is the plate thickness and “D” the hole diameter. Therefore, for this thesis a thin plate
(𝑡 = 3𝑚𝑚,𝑡
𝐷= 0.17)was used to avoid high pressure drop. The starting point was the
simulation for five distinct distances between the Baffle Plate and the top of the chamber
(Figure 38), keeping constant other reference parameters as presented in Table 8, the
resulting curve was named as reference curve. Afterwards, the CFD simulations were
performed varying the values of some parameters as shown in Table 8 under the changed
parameters column. For each simulation one parameter was varied while the others were
kept constant.
Figure 38 Representation of the low-pressure plasma chamber with different distances between the Baffle Plate and the top chamber

Simulation and Experimental Part
64
Table 8 Baffle Plate technical layout under simulation analysis
Changed parameters
*Distance to the top [mm]
Reference parameters Flow rate
[sccm] Number of holes
Hole Diameter
[mm]
**Chamber volume
10 Flow rate [sccm] 145 Number of holes 30 Hole diameter [mm] 18
300 - - -
- 54 - -
- - 30 -
- - - 2/3
30
50
80
100
*Distance from the baffle plate to the top of the low-pressure plasma chamber **Two thirds of the original model volume were used
Figure 39 are the calculated non-uniformity coefficient for the five distinct distances
between the Baffle Plate and the top of the chamber. The non-uniformity coefficient was
calculated in the same way as presented in section 3.1.3. It can be observed that the non-
uniformity coefficient increases slightly from 100 mm to 50 mm distance and from 50 mm
toward 10 mm it increases reasonably. This scenario is quite like the gas feed-in pipe
construction described in section 3.1.1, where lower pipe section area led to higher non-
uniformity coefficient.
Figure 39 Influence of the distance from the Baffle Plate to the top of the chamber on the non-uniformity coefficient. The results are shown via the points; the lines connecting the
points in the plot are only to support guiding the eyes and are not modelled fits.
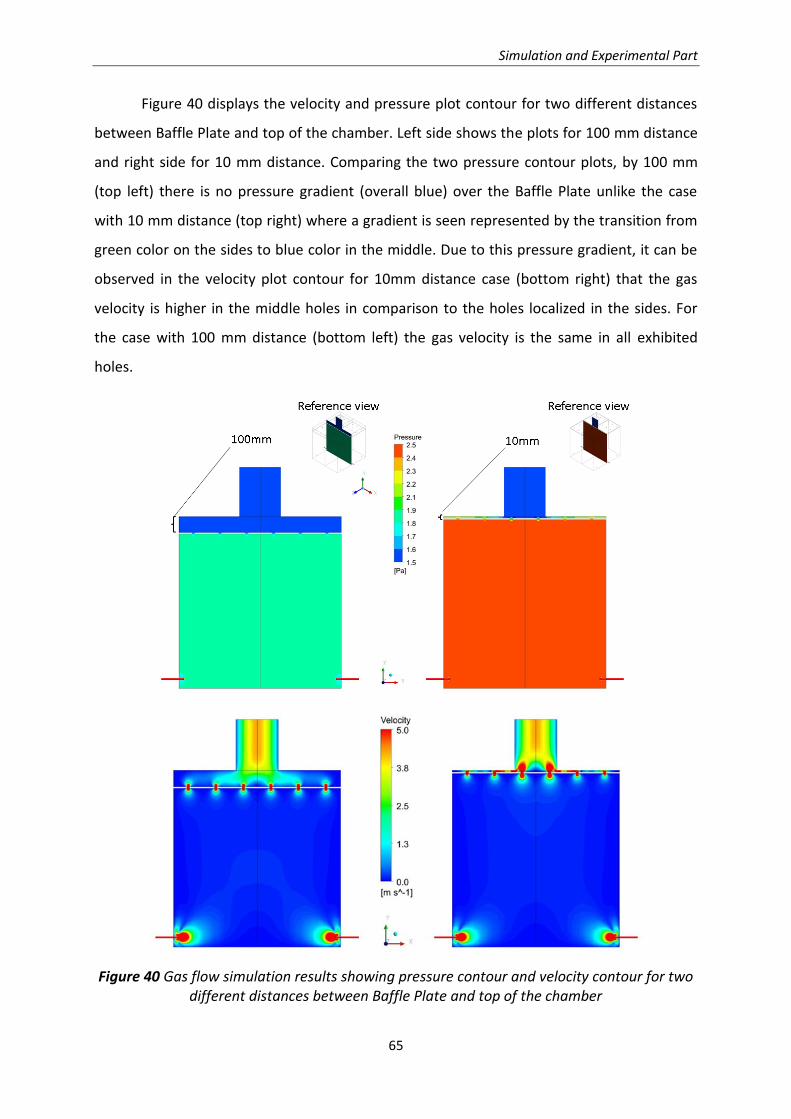
Simulation and Experimental Part
65
Figure 40 displays the velocity and pressure plot contour for two different distances
between Baffle Plate and top of the chamber. Left side shows the plots for 100 mm distance
and right side for 10 mm distance. Comparing the two pressure contour plots, by 100 mm
(top left) there is no pressure gradient (overall blue) over the Baffle Plate unlike the case
with 10 mm distance (top right) where a gradient is seen represented by the transition from
green color on the sides to blue color in the middle. Due to this pressure gradient, it can be
observed in the velocity plot contour for 10mm distance case (bottom right) that the gas
velocity is higher in the middle holes in comparison to the holes localized in the sides. For
the case with 100 mm distance (bottom left) the gas velocity is the same in all exhibited
holes.
Figure 40 Gas flow simulation results showing pressure contour and velocity contour for two different distances between Baffle Plate and top of the chamber

Simulation and Experimental Part
66
Figure 41 shows the nonuniformity coefficient in a logarithmic scale for five different
distances between Baffle Plate and top of chamber: 100 mm, 80 mm, 50 mm, 30 mm and 10
mm in diverse parameters arrangement. In each circumstance one parameter was changed
keeping the others constant. The parameters varied were: flow rate, number of holes, hole
diameter and aspect ratio of the chamber. In all cases the parameter was increased except
the aspect ratio where two thirds of the initial chamber volume was considered. It is
observed with an increase of the gas flow rate and the number of holes did not lead to a
significant impact in the gas exhaustion homogeneity as well as by reducing the volume of
the chamber. Increasing on the holes diameter decreases the homogeneity of the gas
exhaustion. Thus, the influence of the distance between the Baffle Plate and the top
chamber on the homogeneity of the gas exhaustion is more relevant. The installation of the
Baffle Plate must keep a minimum distance of 80 mm from the top of the chamber to be in a
safe area regarding to homogeneous of gas exhaustion, i.e. under the Φ based construction
border.
Figure 41 Influence of different parameters in the homogeneity of the gas exhaustion through the holes of Baffle Plate The results are shown via the points; the lines connecting
the points in the plot are only to support guiding the eyes and are not modelled fits.
The main conclusions extracted from the results are:
a) From the analyzed parameters the distance between Baffle-Plate and top
chamber was the most relevant one influencing the homogeneity of gas exhaustion.

Simulation and Experimental Part
67
b) By decreasing the distance between Baffle-Plate and top chamber, the
pressure gradient in this region increases resulting in nonhomogeneous gas exhaustion
through the holes. For instance, the nonuniformity coefficient for 100 mm distance is 0.5%
and for 10 mm distance is 69%.
c) Taking the construction border (Φ <5%) into consideration the results showed
that the installation of the Baffle-Plate with a distance above 80 mm to the top chamber is in
a safety area regarding the homogeneity of gas exhaustion for low-pressure applica-tion.
d) From the analyzed values, flow rate and number of holes do not have a
consid-erable influence in the homogeneity of gas exhaustion through the holes. However, it
is recommended to start the layout with hole diameter in the order of 15 mm.
e) The hole diameter strongly influences the homogeneity of gas exhaustion
through the holes, especially with high distances between Baffle-Plate and top of the
chamber
f) The chamber volume has an influence in the homogeneity of gas exhaustion,
es-pecially with high distances between Baffle-Plate and the top of the chamber
g) The Baffle-Plate is an effective solution to improve the homogeneity of
coating deposition rate for plasma polymerization processes
3.2.2. Experiment with installed Baffle Plate
With the intention to identify the practical influence of the Baffle Plate in respect to
the homogeneity of the coating deposition rate, the same experiment as shown in Figure 28
was performed. However, now with the Baffle plate installed as depicted in Figure 42.
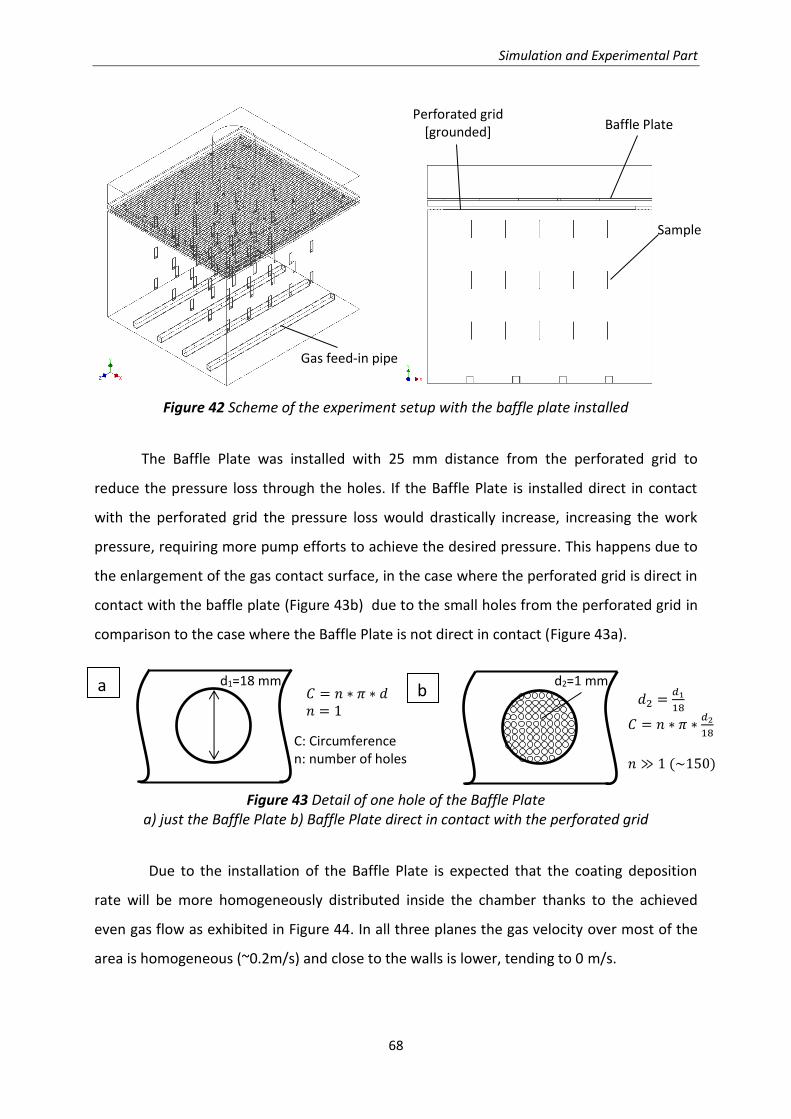
Simulation and Experimental Part
68
Figure 42 Scheme of the experiment setup with the baffle plate installed
The Baffle Plate was installed with 25 mm distance from the perforated grid to
reduce the pressure loss through the holes. If the Baffle Plate is installed direct in contact
with the perforated grid the pressure loss would drastically increase, increasing the work
pressure, requiring more pump efforts to achieve the desired pressure. This happens due to
the enlargement of the gas contact surface, in the case where the perforated grid is direct in
contact with the baffle plate (Figure 43b) due to the small holes from the perforated grid in
comparison to the case where the Baffle Plate is not direct in contact (Figure 43a).
𝐶 = 𝑛 ∗ 𝜋 ∗ 𝑑 𝑛 = 1
𝑑2 =𝑑1
18
𝐶 = 𝑛 ∗ 𝜋 ∗𝑑2
18
𝑛 ≫ 1(~150)
Figure 43 Detail of one hole of the Baffle Plate a) just the Baffle Plate b) Baffle Plate direct in contact with the perforated grid
Due to the installation of the Baffle Plate is expected that the coating deposition
rate will be more homogeneously distributed inside the chamber thanks to the achieved
even gas flow as exhibited in Figure 44. In all three planes the gas velocity over most of the
area is homogeneous (~0.2m/s) and close to the walls is lower, tending to 0 m/s.
Baffle Plate Perforated grid
[grounded]
Sample
Gas feed-in pipe
a b d1=18 mm d2=1 mm
C: Circumference n: number of holes

Simulation and Experimental Part
69
Figure 44 Gas simulation results of the experiment- Current setup with Baffle Plate installed
With the intention of make the comparison of the coating deposition rate
homogeneity, obtained through the experiment with current setup and obtained through

Simulation and Experimental Part
70
the experiment with the Baffle Plate installed, easier, both color contour graphic of the
distribution of the calculated deposition rate are showed in Figure 45. The results are
divided in three planes: top plane (Figure 45a), middle plane (Figure 45b) and bottom plane
(Figure 45c). Each plane contains 25 samples which positions are represented by the black
dot points in each image. The results were organized in two columns where the left one
represents the results without Baffle Plate installed and the right one represents the results
with the Baffle Plate installed. All images were generated using the same scale bar, varying
from 3nm/min to 30nm/min.
Figure 45 shows that the deposition rates are still higher close to the walls in
comparison to the middle. Nevertheless, the color gradient in the right column, which
represents the experiment with the Baffle Plate installed, are weaker than the color gradient
in the left column (without the Baffle Plate). Like in the experiment without the Baffle Plate,
the images from the right column (with Baffle Plate) show also higher deposition rate in
average (dark green) in the top plane in comparison to the bottom and middle plane.
Nonetheless, this difference is not as big as in the case without the Baffle Plate as showed in
Figure 46. The improvement in the coating homogeneity due to the installation of the Baffle
Plate is clearly visible in Figure 46. It shows a reduction in 50% of the standard deviation for
the process with Baffle Plate installed (23%) in comparison to the previous one without
Baffle Plate installed (47%) considering all samples. Moreover, the average of deposition
rates considering all 75 samples in both experiments were the same. It gives a hint that the
Baffle Plate do not influence the deposition rate itself, in fact just work in a way to
homogenize it.

Simulation and Experimental Part
71
Figure 45 Comparative of coating deposition rate with and without the Baffle Plate installed

Simulation and Experimental Part
72
Figure 46 Comparative of the average of deposition rate - Experiment current setup and with Baffle Plate installed
Regarding the properties of the obtained coating, Figure 47 shows that both
experiments exhibited a similar surface energy (low standard deviations) and there are no
big differences among all three planes. As the surface energy is related to the chemical
composition of the coating, it indicates that by the installation of the Baffle Plate no
influence was generated in a way that could lead to different coating chemistry in different
regions, which is an expected and positive signal.
Figure 47 Comparative average of the surface energy [Wu method] – With and without Baffle Plate
5%

Simulation and Experimental Part
73
The results suggest that the use of a Baffle-Plate do not influence the properties of
the coating (surface energy), but it increase the homogeneity of the coating deposition rate
since the only difference between both experiments was the change in the gas flow behavior
due to its installation. Nevertheless, the deposition rate pattern does not match exactly with
the gas flow pattern calculated through simulation and showed previously in Figure 44.
Therefore, additional simulations were performed regarding not the gas flow but the electric
field.
3.2.3. Electric field Simulation
The Electric field simulations were performed applying the software package Ansys
Maxwell 16.0®. The calculations were done using Electrostatics solver described as follow
[108]:
• The Electrostatic solver solves for the static electric fields resulting from
stationary charge distribution or applied potentials
• Electric Field (E) and Electric Flux Density (D) are automatically calculated
from the scalar potential (ø)
• All fields inside conductors are assumed to be perfect and equipotential in an
electrostatic equilibrium (no current flow), therefore Joule losses are zero
everywhere
• The Electrostatic solver utilizes an automatic adaptive mesh refinement
technique to achieve an accurate and efficient mesh required to meet defined
accuracy level (energy error)
For the present thesis, considering the current low-pressure plasma chamber setup,
the following boundary conditions were applied:
• Powered electrodes potential: 30V
• Grounded electrodes potential: 0V
• Materials selection: Aluminum

Simulation and Experimental Part
74
The results of the electric field calculation for the current setup are shown in Figure
48. Black bars represent the powered electrode and orange bars represent grounded
electrodes. The bottom plane shows a stronger electric field close to the left and right
grounded electrode. The same plane by the coating deposition rate distribution (Figure 45c)
showed also high deposition rates close to the grounded electrodes. The middle plane image
from Figure 48, shows a very low electric field (radial) exactly in the middle of the plane, i.e.
center of the chamber, and the coating deposition rate distribution by Figure 45b displays
also a radial tendency. Regarding the top plane, the electric field pattern depicted in Figure
48 is rotated 90° in relation to the bottom plane – the higher electric field is closer to the
powered electrodes. Nevertheless, by the same plane in Figure 45a, even though it showed
lower deposition rate in the middle, there is not a visible higher deposition rate close to the
powered electrodes.
The experimental results (Figure 45) in combination with the gas flow simulation
(Figure 44) and electric field simulation (Figure 48) showed that the coating deposition rate
distribution might be a compromise between gas flow and electric field. It is important to
keep these findings in mind when a new chamber/electrode will be developed.

Simulation and Experimental Part
75
Figure 48 Electric field calculation results for the current setup

Simulation and Experimental Part
76
3.3. Electrode assembly
From the previous sections, it was observed and described the influence of the gas
flow distribution and electric field distribution in respect to the local deposition rate as well
as in the coating properties for an electrode setup with a “U-form”. In this connection it
could be shown the benefits of a Baffle Plate to achieve a good coating homogeneity. The
idea now is to keep the “U-form” electrode along with the Baffle Plate installed and just add
a metallic plate connected with the bottom electrode. This metallic plate will act as an
additional RF-electrode and could be used, for example, to place samples to be coated. In
this case, the objective is to understand the effect of the assembly of additional electrode in
the homogeneity of the coating deposition rate for the situation where there is a small
distance between the metallic plate and the side of the “U-form” electrode. This is one
desired construction from the point of view of scaling up the process. If there is an idea to
place more electrode areas inside the plasma coaters, small distance between them will be
generated and therefore this investigation is helpful. It is expected to see the local influence
of the gas flow as well as from the electric field on the coating deposition rate distribution.
To evaluate the effect of the electrode assembly in the homogeneity of the coating
deposition rate the experiment in Figure 49 was planned.
Figure 49 Scheme of the experiment with one additional electrode (sides open)

Simulation and Experimental Part
77
Figure 49 shows to different views of the experiment, XY plane (left) and ZY plane
(right). The “U-Electrode” is represented by the thick black line and the grounded electrode
is represented by the thick orange line. For this experiment, one additionally metallic plate
(90 mm x 54 mm) was placed 130 mm from the back of the chamber (grounded). With this
setup, the sides of the metallic plate were 57.5 mm distance from the powered electrode. As
the metallic plate was direct in contact with the RF-electrode (“U-Electrode”), it will also
work as an RF-electrode. The gas feed-in pipe was placed between the metallic plate and the
grounded electrode. It is important to observe that for this case; the sides of the electrode
are completely open. It means that the gas can flow to the sides as well as direct toward the
exhaustion system. The surface of the metallic plate under analysis is the one facing the
grounded electrode.
The second experiment, represented by the scheme in Figure 50, aimed to see the
influence in the coating deposition rate distribution due to the installation of a
polycarbonate plate, in each side of the metallic plate, to close both sides. There is 20 mm
height difference between the metallic plate and the polycarbonate plate. This was let on
purpose to force one pathway for the gas and due to that it is expected to see one influence
in the coating deposition rate distribution.
Figure 50 Scheme of the experiment with one additional electrode (sides closed)

Simulation and Experimental Part
78
Defined the experiments, the first step was to run the gas flow simulation as well as
the electric field simulation for both cases.
3.3.1. CFD simulation
The CFD simulations were performed using the same boundary conditions showed in
Table 7. From Figure 51a can be observed that due to the open sides, the gas tends to flow
to the smallest pathway (sides), which imposes fewer obstacles to the flow. It shows also
higher velocities (red) close to the bottom sides of the metallic plate. This scenario can be
better understood with Figure 51b, where the streamlines are clear moving to the sides of
the plate. Based on this statement, it can be expected that a higher density of gas, or
reactive particles from the precursor gas, will be available in the bottom sides of the metallic
plate and therefore higher deposition rate is expected in these regions.
Figure 51 Gas flow simulation results – Experiment Metallic Plate open sides (a) XY plane (b) ZY plane

Simulation and Experimental Part
79
To see if it is possible to move the influence of the concentration of streamlines, as
they represent the preferentially path which the gas will go through, for the same
experiment construction new gas flow simulations were done with the polycarbonate plate
installed to close the sides of the metallic plate but leaving on purpose 20 mm height
difference between them. The idea is to let one pathway for the gas on the top sides and see
if the streamlines will concentrate in this region.
Figure 52a show the streamlines moving straight from bottom to top and the higher
velocities is close to the top of the metallic plate. Additionally, close to the top sides of the
metallic plate the velocity is higher (yellow) as compared to the velocity over the plate
(green). From this point of view, it would be expected that higher deposition rate will be find
in the top sides of the metallic plate.
Figure 52 Gas flow simulation results – Experiment Metallic Plate closed sides (a) XY plane (b) ZY plane

Simulation and Experimental Part
80
Looking forward acquire more information about the coating deposition rate
distribution over the metallic plate in both setups, electric field simulations were performed.
3.3.2. Electric field simulation
The electric field simulations were done in the same way as explained in section 3.2.3
and the results are depicted in Figure 53.
Figure 53 Electric field calculation results for the Experiment - Metallic Plate (a) Plane XZ (side view) (b) Plane YZ (front view) (c) Plane XY (top view)
The “U-Electrode” as well as the metallic plate is represented by the black color and
the grounded electrode is represented by orange color. Figure 53a shows stronger electric
field in the regions where a powered electrode is close to a grounded electrode. It can be
a
b
c
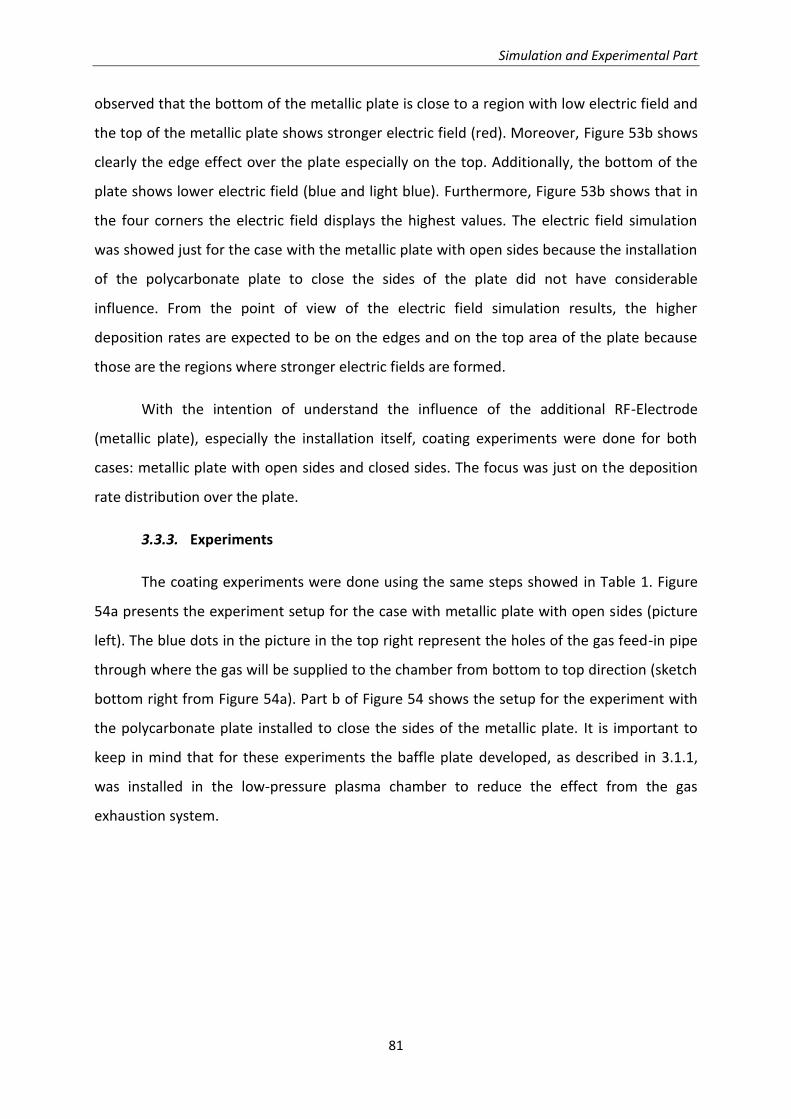
Simulation and Experimental Part
81
observed that the bottom of the metallic plate is close to a region with low electric field and
the top of the metallic plate shows stronger electric field (red). Moreover, Figure 53b shows
clearly the edge effect over the plate especially on the top. Additionally, the bottom of the
plate shows lower electric field (blue and light blue). Furthermore, Figure 53b shows that in
the four corners the electric field displays the highest values. The electric field simulation
was showed just for the case with the metallic plate with open sides because the installation
of the polycarbonate plate to close the sides of the plate did not have considerable
influence. From the point of view of the electric field simulation results, the higher
deposition rates are expected to be on the edges and on the top area of the plate because
those are the regions where stronger electric fields are formed.
With the intention of understand the influence of the additional RF-Electrode
(metallic plate), especially the installation itself, coating experiments were done for both
cases: metallic plate with open sides and closed sides. The focus was just on the deposition
rate distribution over the plate.
3.3.3. Experiments
The coating experiments were done using the same steps showed in Table 1. Figure
54a presents the experiment setup for the case with metallic plate with open sides (picture
left). The blue dots in the picture in the top right represent the holes of the gas feed-in pipe
through where the gas will be supplied to the chamber from bottom to top direction (sketch
bottom right from Figure 54a). Part b of Figure 54 shows the setup for the experiment with
the polycarbonate plate installed to close the sides of the metallic plate. It is important to
keep in mind that for these experiments the baffle plate developed, as described in 3.1.1,
was installed in the low-pressure plasma chamber to reduce the effect from the gas
exhaustion system.

Simulation and Experimental Part
82
Figure 54 Setup of the experiment - Metallic Plate (a) open sides (b) closed sides
The calculated deposition rates were plotted using a color contour graphic and are
depicted in Figure 55. This kind of plot was used to make easier the understanding, in a way
that a 3D experiment is showed in a 2D graphic. In this case, blue color means low
deposition rate and red color high deposition rate. The black dots represent the positions
where the coating thicknesses were measured. The measurements started 25 mm for each
edge of the plate.
a
b
Metallic plate Polycarbonate
plate

Simulation and Experimental Part
83
Figure 55 Coating deposition rate distribution (a) open sides (b) closed sides
Part “a” from Figure 55 shows the coating deposition rate distribution for the case
where the sides of the metallic plate were open. It can be observed that the higher
deposition rates were concentrated in the bottom corners and the lowest deposition rates
were in the center of the plate. Figure 55b shows the deposition rate distribution for the
experiment with the polycarbonate plate installed to close the sides of the metallic plate. For
this case, the higher deposition rates were in the top corners. If we compare the pattern of
the coating deposition rate from the two experiments, the action to close the sides of the
metallic plate and leaving on purpose a gas pathway in the top corners, practically mirrored,
in respect to the ZX plane, the results from the setup with open sides. This is a hint that the
gas pathway, represented by the streamlines, played a major role in these experiments. This
influence can also be seen in Figure 56, where a brighter plasma is seen in the top corners of
the metallic plate in comparison to the hole volume of the low-pressure plasma chamber.
The influence of the created gas pathway (metallic plate 20 mm higher than the
polycarbonate plate) was higher than the electric field since from the electric field
simulations results, it would be expected higher deposition rates all over the edges.
Gas feed-in pipe Polycarbonate plate
a b

Simulation and Experimental Part
84
Figure 56 Image of the coating process – Metallic plate with closed sides, showing local plasma concentration on the top corners
The averages of coating deposition rate for both experiments are showed in Figure
57a. The experiment with closed sides presented lower values in average; however, the
standard deviation was slightly lower than the experiment with open sides. The lower
deposition rate in average for the case with closed sides can be attributed to the fact that
the gas velocity was higher in this setup as compared to the open sides experiment as
already showed in Figure 52a and Figure 51a respectively. From the coating properties point
of view, both experiments displayed similar values of surface energy as depicted in Figure
57b. The higher standard deviations for both cases might be related to the local influence of
the gas streamlines due to the open sides in the first experiment and due to the opening left
on purpose on the top corners of the metallic plate in the second experiment. If these areas
are removed from the analyzed data, the standard deviations would clearly decrease.
Furthermore, from the experiments showed in the section 3.2, it is recommended to keep at
least 200 mm distance from the electrodes to mitigate the influence of the walls in the gas
flow and the region with stronger electric field.
Local plasma
(brighter)
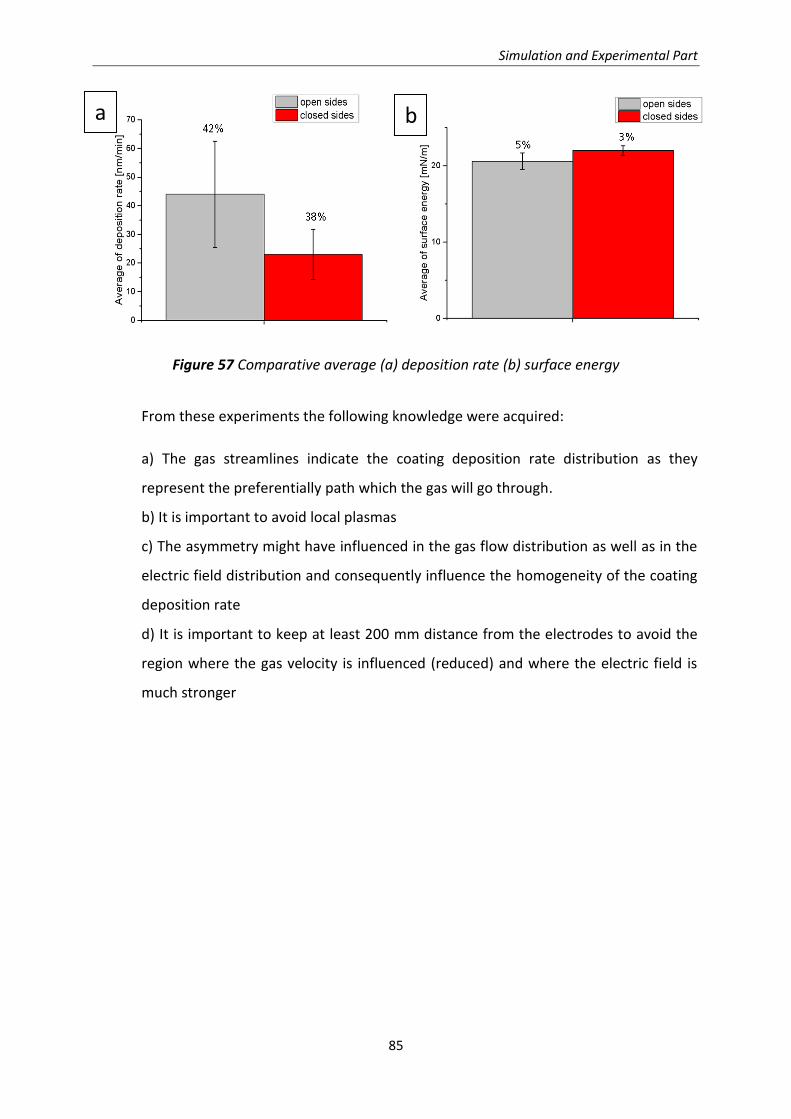
Simulation and Experimental Part
85
Figure 57 Comparative average (a) deposition rate (b) surface energy
From these experiments the following knowledge were acquired:
a) The gas streamlines indicate the coating deposition rate distribution as they
represent the preferentially path which the gas will go through.
b) It is important to avoid local plasmas
c) The asymmetry might have influenced in the gas flow distribution as well as in the
electric field distribution and consequently influence the homogeneity of the coating
deposition rate
d) It is important to keep at least 200 mm distance from the electrodes to avoid the
region where the gas velocity is influenced (reduced) and where the electric field is
much stronger
b a

Construction of a new low-pressure plasma chamber
86
4. Construction of a new low-pressure plasma chamber
In the three previous chapters (3.1,3.2,3.3) special attention were done for the
construction of gas feed-in systems, gas exhaustion systems and construction of RF-
Electrodes respectively. The idea was to create construction guidelines for scientists and
constructors with higher probability to achieve homogenous coating deposition rate, in
further applications of this low-pressure plasma technology, with less rework. It will
consequently improve the time plan and costs for future developments. Moreover, it will at
least reduce the risk significantly.
In this context, a new low-pressure plasma chamber was constructed using the
knowledge acquired through this research work with the objective to deposit plasma
polymeric coating over flat surfaces, for example over two plain metallic products (Figure 58)
with 1 m2 area each. This coating must show a homogeneous easy to clean functionality and
at least over the plain a constant deposition rate.
Figure 58 Plain metallic product placed on a Polycarbonate-holder
Therefore an electrode with flat surfaces and large dimensions is required. The
dimensions of the electrode must be larger than the ones from the plain metallic product to
allow the placement of the products in an area distant from the chamber walls, where local
influences on the coating deposition rate due to gradient in the gas flow as well as strong
electric field are detected as showed in the previous chapter. The low-pressure plasma
chamber has a volume of 3 m3 and the working principle is the same as the previous one
described in the end of the chapter 2.2.2.

Construction of a new low-pressure plasma chamber
87
The first step for this development was to define the gas feed-in system, gas
exhaustion system and RF-Electrode geometry, since the coating parameters are already
established (Table 1).
Regarding the gas feed in system, a square pipe (A=30 mm x 30 mm) with sides
closed were selected. On the top plane of this pipe, 14 holes (D=1.5 mm) were equally
distributed as depicted in Figure 59. This geometry was selected based on the guidelines
showed previously in section 3.1.3.
Figure 59 Model of the gas feed-in system
The next step was to define the geometry of the RF-Electrode. Since plain metallic
products are desired to coat, the electrode must have flat and inclined sides to make easier
the fixing of the product and consequently to enable of a fast preparation step for the next
coating process. One first idea was to have a triangular shape RF-electrode as showed in
Figure 60a. It has the two inclined sides and from this point of view it would be suitable to
coat two plain metallic products per batch. However, the triangle shape implies in a very
sharp edge on the top. The electric field calculations show that the electric field strongly
concentrates in this region (Figure 60b).
Gas inlet
hole
Gas inlet hole

Construction of a new low-pressure plasma chamber
88
Figure 60 (a) Model of the low-pressure plasma chamber with triangular shape RF-Electrode
(b) Electric field simulation for the triangular shape RF-electrode
For this reason, a new solution came substituting the triangular shape RF-Electrode
to a trapeze shape RF-electrode. It will allow in the same way the coating of two plain
metallic products per batch but without a sharp edge on the top. The model of this trapeze
RF-electrode can be seen in Figure 61. Figure 65 shows the corresponding electrical field
calculation.
Figure 61 Model of the trapeze RF-electrode

Construction of a new low-pressure plasma chamber
89
The last step to define the low-pressure plasma chamber is related to the gas
exhaustion system. In chapter 3.2, it was described the importance to install a Baffle Plate to
reduce the effects from the central gas exhaustion system and thereby be able to increase
the homogeneity of the coating distribution over the substrate surface. In this way, also a
Baffle Plate was designed to this application as depicted in Figure 62. It has
30 holes (D=18 mm) evenly distributed. The holes distribution was done in a way that one
row of holes would be placed exactly in the middle of the chamber and consequently in the
middle of the trapeze electrode with the aim of keep the gas streamlines in contact all over
the side electrode surfaces as can be seen in Figure 64a.
Figure 62 Model of the Baffle Plate
After the definition of the gas feed-in system, RF-electrode geometry and gas
exhaustion system, the complete model of the low-pressure plasma chamber was completed
and can be seen in Figure 63.

Construction of a new low-pressure plasma chamber
90
Figure 63 Model of the complete low-pressure plasma chamber
With the aim of be sure that the developed model will work, CFD simulation were
done to have a picture of the gas flow behavior inside the developed low-pressure plasma
chamber.
4.1.1. CFD simulation
The CFD simulations were performed using the same boundary conditions showed in
Table 7 and the results are depicted in Figure 64. Part “a” from Figure 64 shows the gas
streamlines. There is a recirculation zone in the bottom part of the trapeze electrode and it
extends for approximately 70 mm in height from the bottom of the chamber. This might
imply in higher deposition rate in this region due to the higher residence time of the gas, and
consequently from its fragments. Moreover, the existence of a line of holes exactly in the
middle of the Baffle Plate seems to work in a way that keeps the gas streamlines in contact
with all the extension of the lateral sides of the trapeze electrodes. This effect is very
important since this is the place where the plain metallic product will be placed and in fact
where the coating deposition is expected. Part “b” from Figure 64 shows an equal gas
velocity pattern in both sides of the electrodes and Figure 64c shows the gas velocity pattern
over the plane close to the electrode surface. It shows a region of small velocities (dark blue)
which extends for about 120 mm from the walls. Nevertheless, the gas velocity is
homogeneous (light blue) in most of the electrode surface area.
Gas feed-in
Baffle Plate
Isolation (100 mm)
Trapeze
electrode
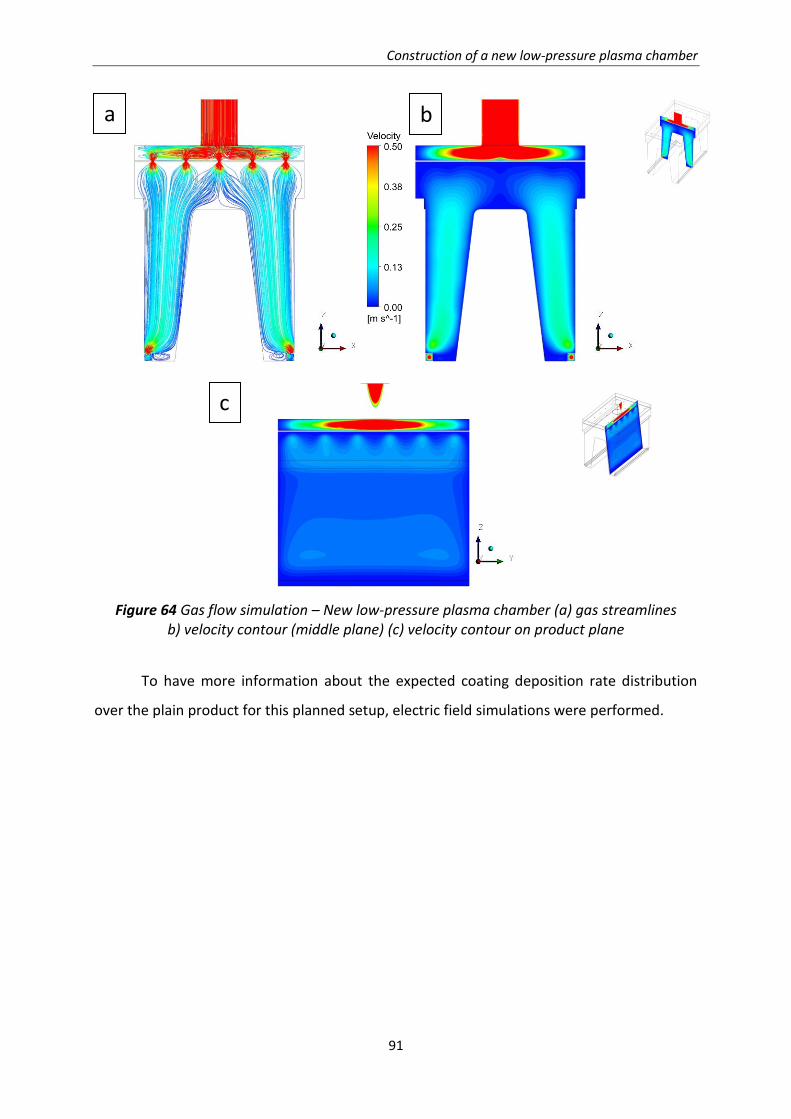
Construction of a new low-pressure plasma chamber
91
Figure 64 Gas flow simulation – New low-pressure plasma chamber (a) gas streamlines b) velocity contour (middle plane) (c) velocity contour on product plane
To have more information about the expected coating deposition rate distribution
over the plain product for this planned setup, electric field simulations were performed.
a
c
b

Construction of a new low-pressure plasma chamber
92
4.1.2. Electric field simulation
The electric field simulations were done in the same way as explained in section 3.2.3
and the results are depicted in Figure 65.
Figure 65 Electric field simulation results for the new low-pressure plasma chamber model
Figure 65 displays still a higher electric field on the sides of the electrode due to the
proximity from the powered electrode (Trapeze) and the grounded electrode (represented
by orange). Nevertheless, the electric field was strongly reduced in the top of the trapeze
electrode due to the mitigation of sharp edge in this region (unlike the triangular electrode).
Moreover, there is a large area (blue) on the surface of the trapeze electrode with
homogeneous electric field which can contribute to a homogenous coating deposition rate.
4.1.3. Experiment
The results from the gas flow simulation and electric field simulation presented a very
laminar and homogeneous gas flow as well as a large area with homogeneous electric field
respectively. It is the confirmation that the way the low-pressure chamber was planned
should be right and homogenous coating deposition rate can be achieved.
In this context, the low-pressure plasma chamber was constructed, and a practical
experiment was performed. The coating experiment was done using the same steps showed
in Table 1. Figure 66 illustrates the setup of the experiment. The plain product is fixed on
Reference view

Construction of a new low-pressure plasma chamber
93
each side of the trapeze electrode (left and right) keeping 70 mm distance from the bottom
of the chamber and 180 mm from the edge of the electrode.
Figure 66 Setup of the experiment – One product for each side of the trapeze electrode
The calculated deposition rates were plotted using a color contour graphic and are
depicted in Figure 67. This kind of plot was used to make easier the understanding, in a way
that a 3D experiment is showed in 2D graphic. In this case, blue color means low deposition
rate and red color high deposition rate. The black dots represent the positions where the
coating thicknesses were measured. The measurements started 50 mm from each edge of
the plain metallic product.
Figure 67 Coating deposition rate distribution (a) left side (b) right side
Gas feed-in
Plain
metallic
product

Construction of a new low-pressure plasma chamber
94
The results from Figure 67 show a symmetrically coating deposition rate pattern even
though on the left side the deposition rate was slightly lower than the right side.
Furthermore, in both sides the maximum values were in the bottom region. This can be
related to the low gas velocity in this region, which increased the gas residence time.
Consequently, higher deposition rates are realized. This is not a huge problem, once the
product can be placed a little bit higher than 70 mm from the bottom to avoid this low gas
velocity region. Regarding the higher deposition rate on the sides of the product, it seems
that influences from the electrical field additively superpose those ones of lower gas
velocity. It might be overcome through more distance to the side walls and a higher trapeze
electrode. Figure 68 shows the average of the coating thickness measured on both plain
products. The average value for both cases is in average 15%. This value is a successful result
and corresponds to a reduction of 67% in the standard deviation value obtained for the
standard equipment with the conditions described in chapter 3.2.
Figure 68 Coating thickness results for both plain products
Regarding coating properties, Figure 69 and Figure 70 shows a very homogeneous
surface free energy and elastic modulus in both sides (left and right) which confirms the
good development/construction of this low-pressure plasma chamber based on the
construction guidelines developed in the previous chapter.
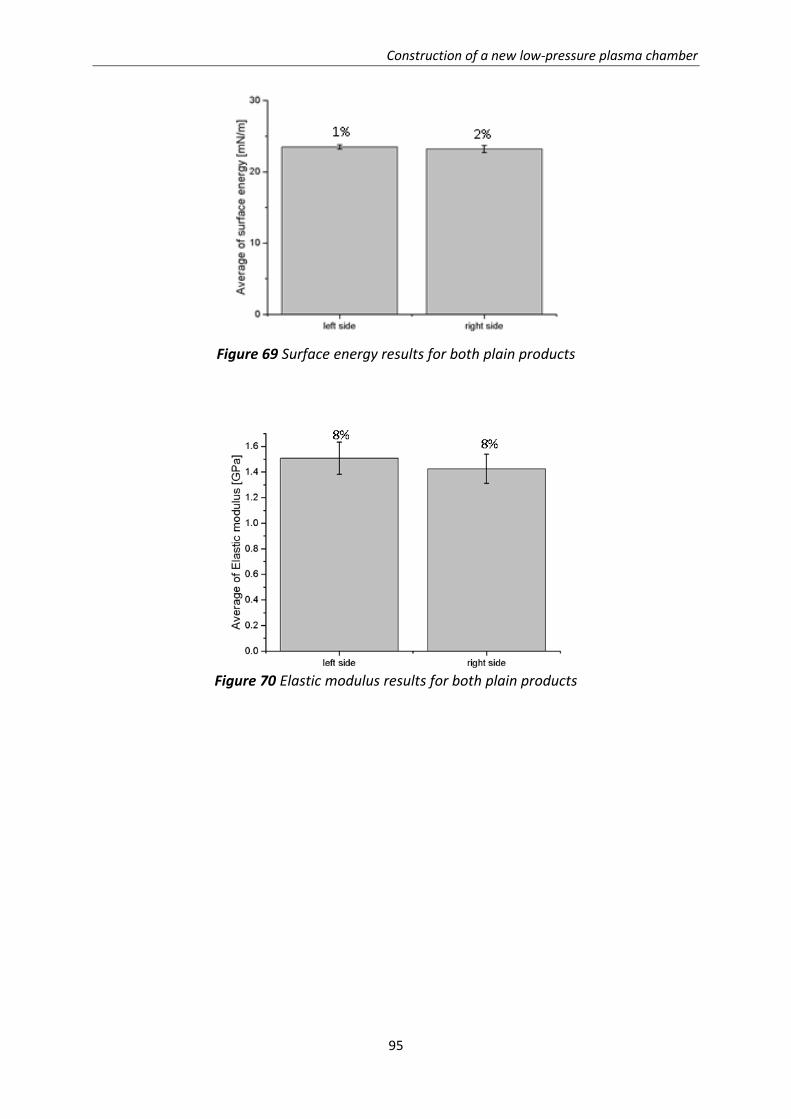
Construction of a new low-pressure plasma chamber
95
Figure 69 Surface energy results for both plain products
Figure 70 Elastic modulus results for both plain products

Conclusions
96
5. Conclusions
Plasma polymerization is a technique used to deposit thin film coatings (nanometer
until some micrometer thickness) on different materials surface. This thin film coating
technology offers the advantage to provide additional functions to multi-material surfaces.
Some of the practical applications of this technique are the possibility to transform
hydrophilic/adhesive surfaces in hydrophobic/non-sticking ones or vice versa, it allows the
protection of surfaces against corrosion and permits also the enhancement of wear
resistance. Therefore, this is a technique which can be applied in a broad range of industrial
sectors. Additionally, it is an eco-friendly technology. The employed chemicals are used in
very small quantities. Furthermore, if it is compared to the wet techniques applied in the
textile industry it offers many advantages. There are no harmful chemicals, wet processes,
waste water and mechanical hazards to textiles. Besides, it has specific action on the surface
[109].
The thin film coating is deposited onto the surface of the substrate, which is placed in
a low-pressure plasma chamber, from a partially ionized precursor gas subjected to the
effect of the plasma. This coating process regarding the achievement of the desired
properties is in general well developed. The challenge is the scaling-up of the deposition
process. To realize attractive costs, it is necessary to coat very fast a smaller number of
articles or to coat a lot of them at once. The decision, which may yield to the best economic
results, depends among other things to the coating process itself. Processes which use a high
Self-Bias are predicted for small chambers because they show a high deposition rate and the
scale up is restricted by the RF-system. In the case of low Self-Bias processes there are strong
limitations concerning the deposition rate because it is not possible to use higher RF-powers
without changing the coating properties. For those processes the scale up in chamber
volume is essential.
In this context, there are very few information available for scientists or constructors
in respect to construction of large volume low-pressure plasma-coaters with the aim of
achieve homogeneous coating deposition rate as well as homogeneous coating properties
over all the products surfaces in contact with the plasma. Large volume plasma-activation
chambers are common up to a volume of about 30m³. But those processes are quite easy in
comparison to a coating process. They make no great demands on the process know-how.
Conclusions
97
The lack of information regarding large low-pressure plasma-coaters led to this
research thesis. The general research question is:
• How to construct large volume low-pressure plasma-coaters focusing on
homogeneous coating deposition rate as well as homogeneous coating
properties?
Having this general question in mind, the next logical step was to identify the
potential systems which could direct influence in the homogeneity of the deposition process.
Starting from the principle that the coating process needs essentially a precursor gas, which
is the material source for the coating. Analyzing the coating process, one can easily see that
two main systems are involved directly to the gas flow: 1) gas feed-in system and 2) gas
exhaustion system. The objective of this research was to create construction guidelines in a
way that researchers or constructors could use them in an easy and efficient way. They must
be generalized, so that they can be used for different chamber constructions.
Gas feed-in system
In the context of this work, a flexible and easy to build solution was developed. The
solution needed to be flexible, to be suitable for different chamber and electrode
configurations, to be built easily and to be feasible regarding time and cost. The solution
consists in a square section pipe with closed sides and some equally distributed holes over
one of the surfaces. The gas inlet is situated on the opposite surface in the middle or at one
end of the pipe. The idea was to achieve a higher and homogeneous pressure along the pipe
axis in comparison to the pressure inside the plasma chamber, to supply the gas evenly
through the holes to the chamber volume. On the other hand it was necessary not to disturb
the working conditions of the gas flow-meter. This idea could be achieved with other
geometries like a ring, showerhead or a perforated plate (even integrated into the electrode
system) but it would require higher investments and would be more time consuming.
Furthermore, the flexibility to adapt the pipe for different electrode system in the same
plasma-coater is much higher than in those possible solutions.
Because it is not possible to measure the local gas velocity inside of low-pressure
plasma chamber a validation of the CFD results is only possible by using a pressure
measurement. There are limited positions where the local pressure can be measured. The
Conclusions
98
goal was to identify the important technical layout parameters which influence the pressure
gradient distribution inside the pipe and consequently the homogeneity of the gas supply
through the holes and thereby to create guidelines for construction of gas feed-in systems.
During the development process, the following technical parameters were evaluated:
• Pipe section area;
• Gas flow rate;
• Pipe length;
• Hole diameter;
• Amount of holes;
• Aspect ratio of the pipe.
The main conclusions extracted from the results are:
a) From the analyzed parameters the pipe section area was the most relevant
one influencing the homogeneity of gas distribution.
b) By decreasing the pipe section area, the pressure gradient increases inside
the pipe resulting in a nonhomogeneous gas distribution through the holes. For
instance, the nonuniformity coefficient for the 30 mm x 30 mm pipe section area is
0.1% and for the 6 mm x 6 mm one 45%.
c) Taking the construction border (Φ <5%) into consideration the results showed
that the pipe section area above 20 mm x 20 mm is in a safety region regarding the
homogeneity of gas distribution.
d) The pressure values from the CFD simulations were in good agreement with
the obtained experimental data.
e) The gas feed-in has a main influence zone over a distance of about 50 mm
from the holes. It means that one must respect this distance to avoid any direct gas
effects on the coating deposition distribution over the substrate.
f) No limitations are observed through the gas feed-in system toward the
capability of the flow meters, especially not for the pressure sensitive one for
HMDSO.

Conclusions
99
The knowledge acquired with the CFD calculations in agreement with experimental
pressure measurements are very helpful for researchers or constructors to develop new gas
feed-in systems for low-pressure plasma chambers.
Gas exhaustion system
Regarding the gas exhaustion system, initially through experimental results and
afterwards through simulations, its influence on the homogeneity of coating deposition rate
was revealed. Therefore, a pretty new solution to reduce the influence of the gas exhaustion
system in a low-pressure plasma system was developed. The idea consisted in a polymeric
perforated plate (sealed towards the plasma chamber), which under the frame of this work
was named as “Baffle Plate”. In this case, the knowledge was applied acquired with the
construction of gas feed-in system but in an inverse way, instead of to feed-in the gas, to
remove the gas from the chamber. To accomplish this objective, it would be necessary to
develop this Baffle plate in a way that all the holes will show the same pressure difference
between the regions under and above the holes what will imply in homogenous gas
exhaustion from each hole.
In this scenario, again the support of a CFD tool was used to get access to the gas
velocity distribution as well as pressure distribution inside the chamber volume. Important
technical parameters were taken into consideration with the aim of create guidelines for the
construction of Baffle Plates as follows:
• Distance from the Baffle Plate to the top of the chamber
• Distribution of the holes over the Baffle Plate
• Amount of holes
• Diameter of the holes
• Gas flow
• Volume of the chamber
The main conclusions extracted from the results are:
a) From the analyzed parameters the distance between Baffle-Plate and top
chamber was the most relevant one influencing the homogeneity of gas exhaustion.

Conclusions
100
b) By decreasing the distance between Baffle-Plate and top chamber, the
pressure gradient in this region increases resulting in nonhomogeneous gas exhaustion
through the holes. For instance, the nonuniformity coefficient for 100 mm distance is 0.5%
and for 10 mm distance is 69%.
c) Taking the construction border (Φ <5%) into consideration the results showed
that the installation of the Baffle-Plate with a distance above 80 mm to the top chamber is in
a safety area regarding the homogeneity of gas exhaustion for low-pressure applica-tion.
d) From the analyzed values, flow rate and number of holes do not have a
consid-erable influence in the homogeneity of gas exhaustion through the holes. However, it
is recommended to start the layout with hole diameter in the order of 15 mm.
e) The hole diameter strongly influences the homogeneity of gas exhaustion
through the holes, especially with high distances between Baffle-Plate and top of the
chamber
f) The chamber volume has an influence in the homogeneity of gas exhaustion,
es-pecially with high distances between Baffle-Plate and the top of the chamber
g) The Baffle-Plate is an effective solution to improve the homogeneity of
coating deposition rate for plasma polymerization processes
In this investigation it was not possible to run the gas flow simulations with the
metallic perforated grid installed due to limited computer processing capacity. This is the
reason why the absolute calculated pressure values were not in total agreement with the
measured ones (especially for high gas flows). Nevertheless, for this thesis, the simulations
results are still valuable because the calculated pressure difference between inside chamber
and the gas exhaustion were very similar and therefore it is expected that the gas flow
would behave in the same way.
The layout and the installation of a Baffle Plate for the described plasma-coater
showed through practical coating experiments that the non-uniformity coefficient was
enhanced from 47% (without Baffle Plate) to 23%. Low values from the nonuniformity
coefficient mean more homogeneous coating distribution. Better values of the non-
uniformity coefficient could be achieved with new RF-Electrode geometry as described in

Conclusions
101
chapter 4. Taking this into account for the construction of a new low-pressure plasma-
chamber a non-uniformity coefficient of about 15% could be achieved for an area of 2 m²,
which are very good results for an industrial application.
The construction guidelines for the use of a Baffle-Plate solution for large volume
PECVD chambers developed in this thesis showed to be very effective in terms of achieve
homogenous coating deposition rate. Basically, the person in charge should start with hole
diameter in the order of 15 mm and distribute them in a proper manner aiming to avoid
concentration of gas suction in small areas. Optimal is to distribute the holes in a way to
cover the section area of the chamber. Furthermore, it is important to keep a distance, for
instance 25 mm, between the Baffle-Plate and the perforated grid to reduce pressure loss
through the holes. After done the first layout, the next step is to assemble the Baffle-Plate
and measure the pressure difference. If the desired working pressure is not reached, then
the holes can be enlarged and proceed with measurements again until the desired working
pressure is reached.
Like for the gas feed-in system, the support of CFD tool was very successful to
understand the influence of the gas exhaustion system, to study and to propose solution to
enhance the homogeneity of coating deposition.
Electrode assembly
For some industrial applications it is important to install more electrodes/product
holders in the low-pressure plasma chamber. Therefore, it is important to understand the
influence of its assembly from the point of view of the gas flow along with the electric field.
Under the frame of this work it was found out that some points must be taken into
consideration to achieve a proper homogeneity in the coating deposition as follows:
a) It is important to keep symmetry in the construction
b) It is mandatory to avoid opening areas close to the region of interest where
the coating is desired.
c) It is recommended to keep the product to be coated at least 200 mm away
from the walls to avoid the gas deceleration region as well as to avoid the sheath
formed close to the electrodes.

Conclusions
102
Construction of a new low-pressure plasma chamber
The complete knowledge acquired through this research thesis was applied for the
construction of a new low-pressure plasma-chamber that will be industrially used to coat
plain metallic products. With this, the transfer of the results to a new chamber with new
challenges are tested.
The gas feed-in system was selected based on the construction guidelines developed
in section 3.1. It is a square section pipe (30 mm x 30 mm) with 14 holes equally spaced over
its top surface. As well the Baffle Plate was constructed following the construction guidelines
described in section 3.2. The holes have 18mm diameter and a total amount of 30 holes
equally spaced distributed in a way to cover all the section area of the low-pressure plasma
chamber. The Baffle Plate was installed 90 mm away from the top of the chamber which is a
safety distance following the construction guidelines.
An electrode with trapeze geometry was selected because of its possibility to handle
two products at once. Furthermore, it avoids sharp edges reducing the probability to
develop local/concentrated electric field. It was assembled in a symmetrically way as well as
avoiding opening regions close to the place where the product will be fixed.
The coating experiment showed symmetry in the coating deposition pattern
distribution on both sides of the trapeze electrode and the non-uniformity coefficient was
very positive: 15% for both sides. This is clear a successful result once in the beginning of the
thesis, the standard low-pressure plasma chamber showed a standard deviation of 46% and
now, with this new low-pressure plasma chamber construction based on the created
guidelines, presented 15% as standard deviation value. Moreover, the coating properties
(surface free energy and elastic modulus) were homogenous over the area of both products.
The objectives proposed to this work were well accomplished and the results of the
knowledge acquired about gas feed-in system, electrode geometry and gas exhaustion
system which led to the formulation of construction guidelines. They are already used for
the construction of new low-pressure plasma-chamber focusing on good coating
homogeneity as well as good homogeneity of coating properties. From this point of view, the
knowledge acquired and described in this research thesis represents an advance in the state
of the art.
Outlook
103
6. Outlook
The framework provided by the presented research work precede to the creation of
construction guidelines for gas feed-in-, gas exhaustion systems and electrodes applied to
low-pressure plasma coating processes, could be used for future investigations dealing with
the aim of coat lots of small products in one batch or a single huge product keeping the
same coating properties regardless of the installed electrode area. To coat a big amount of
small products, parts holders (connected or not with the RF generator) are required.
Depending on the case, three scenarios can happen:
1) Less RF-electrode area than grounded one which leads to negative Self-Bias;
2) Equal area of RF- and grounded electrode which leads to a Self-Bias near zero;
3) More RF-electrode area than grounded one which leads to positive Self-Bias.
With all three aforementioned scenarios, using apart from that the same coating
conditions, three different coating properties can be achieved [110,111]. The different
coating properties are directly related to the Self-Bias signal as well as to its absolute value.
In this sense, future investigations could focus on techniques to manipulate electronically
the Self-Bias for different ratio of electrode area (powered/grounded) looking toward to the
same coating properties. Similar effect occurs for the case where a single metallic massive
product (in contact with the RF-Electrode) is desired to coat. In this case, the large surface
area of the product will contribute to increase the powered electrode area influencing the
Self-Bias and consequently leading to different coating properties.
Furthermore, it could be helpful to investigate techniques which allow the
measurement/control of plasma potential, floating potential, sheath potential and Self-Bias
during the coating process. There are some techniques available, for example the Langmuir
Probe [112] associated with thermal probes [113], which work very fine for activation or
etching processes. However, it is still challenging to apply these techniques looking toward
to acquire the real potential values for plasma-coaters since the tip of the measuring device
will be covered and therefore the acquired signal will change.
Regarding the gas feed-in system, further investigation would be interesting using a
kind of perforated plate instead of a square section pipe. This perforated plate could be part
of the RF-electrode or made with plastic material like the Baffle Plate. This solution offer
more flexibility for different electrode configurations using the same plasma-coater.
Outlook
104
Additional investigation can be done regarding the meshing process for the CFD
model, since for this thesis it was a restriction in the case of the perforated grid which is
installed under the Baffle Plate keeping 25 mm distance. As the perforated grid contains a
huge quantity of very small holes, it requires lots of computational efforts to do the mesh
and afterwards to calculate. Therefore, would be interesting to search for alternatives in the
CFD community ways to overcome this barrier.
Not of less importance is the investigation of software or codes which allows the
calculation of the precursor gas flow along with the chemical reactions (coating formation)
under the influence of plasma generated by an RF-generator source. Modelling of reactive
plasma process is quite complex due to a variety of reasons. For instance, there are
countless reactions among charged particles and neutral species with mostly unknown rate
constants.
These future investigations would contribute to widen the present guidelines for
development of new low-pressure plasma coating processes.
Besides, the methodology developed in this thesis to construct gas feed-in systems,
gas exhaustion systems and electrodes for low-pressure plasma process can similarly be
tailored to new developments in the atmospheric plasma applications.

Acknowledgements
105
7. Acknowledgements
Foremost, I would like to express my sincere gratitude to Prof. Dr. Bernd Mayer for
his assessment and that he thereby enabled me to carry out my research at Fraunhofer IFAM
in cooperation with the University of Bremen. Besides my advisor, I would like to thank Prof.
Dr. Jürgen Meichsner for his involvement as second evaluator.
Special thanks to Dr. Welchy Leite Cavalcanti. She believed on me and opened the
doors to do this research thesis.
My sincere thanks also go to Dr. Ralph Wilken, my head of department, for his affable
reception and for the acceptance of the elaboration of this thesis in the department “Plasma
Technology and Surfaces” at Fraunhofer Institute IFAM.
I am truly grateful to Dr. Klaus Vissing for all the time spent on discussions and
sharing ideas as well as his constant motivation, permanent guidance and endless patience,
without which, this work would not have been possible. I could not have imagined having
better help and advice during my thesis. For their aid and scientific inputs, I am grateful to
the technicians and researchers of the OE413. Special thanks to my “ND-Plasma” colleagues
always helping me with German and making me feel at home.
Thanks a lot to all IFAM colleagues, which I have the pleasure to meet, for their
friendly atmosphere.
I would like to thank my beloved wife, Lays, for her patience and comprehension
during the realization and writing of my thesis. She has always tried to make my PhD time
easier. My infinite gratitude to my parents, Leila and Nocleci, for giving me all the tools I
needed to become a responsible man, especially to keep believing in my dreams; to my
sisters Ana Paula and Simone and my nephew Joaquim for pushing me up always when I
needed and to believe on me.
A particular gratitude to all my friends in Brazil, especially to Cadu Palumbo and
Sheila Costa, for the right words in the right time which motivated me to move on.
Finally, I would like to thank the financial support of the Brazilian Government
(Brazilian National Council of Technological and Scientific Development - CNPq) in the frame
of the Science without Borders Program (201387/2014-0).

References
106
8. References
[1] H. Yasuda. Plasma Polymerization. Orlando,Florida: Academic Press,Inc; 1985.
[2] Dominik Paulkowski, Stefanie Karpinski, Klaus Vissing. Friction and wear resistance of
plasmapolymeric coatings applied on elastomers. Tribologia: Finnish Journal of
Tribology 2014;32(2):12–9.
[3] Yong Tae Kim, Suk-Ki Min, Jong Sung Hong, Choong-Ki Kim. Highly Conductive Tungsten
Thin Films Prepared by the Plasma-Assisted Silane Reduction Process. Japanese Journal
of Applied Physics 1991;30(4):820–6.
[4] Vogel K, Westphal N, Salz D, Thiel K, Wittig L, Ciacchi LC et al. Dental implants coated
with a durable and antibacterial film. Surface Innovations 2015;3(1):27–38.
[5] Paulkowski D, Vissing K. Tribological improvement of elastomers using plasmapolymeric
coatings. Proceedings of Tribologie Fachtagung 2011;1:15/1-15/14.
[6] Gürsoy M, Karaman M. Hydrophobic coating of expanded perlite particles by plasma
polymerization. Chemical Engineering Journal 2016;284:343–50.
[7] Milton Ohring. The Materials Science of Thin Films. San Diego, California: Academic
Press; 1992.
[8] Martinu L, Poitras D. Plasma deposition of optical films and coatings: A review. Journal
of Vacuum Science & Technology A Vacuum Surfaces and Films 2000;18(6):2619–45.
[9] Harald Herchen, Walter Merry, William Brown. Etch enhancement using an improved
gas distribution plate(US 5819434 A); 1998.
[10] Kyung Cheol Jeong. Gas distribution system and method for chemical vapor deposition
apparatus(US 5853484 A); 1998.
[11] Ramprakash Sankarakrishnan, Ganesh Balasubramanian, Juan Carlos Rocha-Alvarez,
Dale R. Du Bois, Mark Fodor, Jianhua Zhou et al. Confined process volume PECVD
chamber(US 8778813 B2); 2014.
[12] Qunhua Wang, Li Hou, Sanjay Yadav, Gaku Furuta, Kenji Omori, Soo Young Choi et al.
Gas distribution uniformity improvement by baffle plate with multi-size holes for large
size pecvd systems(US 20080178807 A1); 2008.
[13] Eric Breitung, George Dalakos, Peter Codella, Manisha Tinani-Mendleson. Delivery
system for PECVD powered electrode(US20050022735 A1); 2005.

References
107
[14] Alan D. Rose, Robert M. Kennedy. Gas dispersion disk for use in plasma enhanced
chemical vapor deposition reactor(US 4792378 A); 1988.
[15] Kulkarni AV, Roy SS, Joshi JB. Pressure and flow distribution in pipe and ring spargers:
Experimental measurements and CFD simulation. Chemical Engineering Journal
2007;133(1-3):173–86.
[16] Michelmore A, Steele DA, Whittle JD, Bradley JW, Short RD. Nanoscale deposition of
chemically functionalised films via plasma polymerisation. RSC Adv. 2013;3(33):13540–
57.
[17] Michelmore A, Whittle JD, Short RD. The importance of ions in low pressure PECVD
plasmas. Front. Phys. 2015;3:1–5.
[18] Michelmore A, Charles C, Boswell RW, Short RD, Whittle JD. Defining plasma
polymerization: new insight into what we should be measuring. ACS Appl Mater
Interfaces 2013;5(12):5387–91.
[19] Hiroji Hanawa, Kyawwin Maung, Hua Chung. Gas distribution showerhead and method
of cleaning(US 20110052833 A1); 2011.
[20] Yuh-Jia Su. Gas distribution plate for semiconductor wafer processing apparatus with
means for inhibiting arcing(US5589002 A); 1996.
[21] Jelil RA. A review of low-temperature plasma treatment of textile materials. J Mater Sci
2015;50(18):5913–43.
[22] Kang MS, Chung TH, Kim Y. Plasma enhanced chemical vapor deposition of nitrogen-
incorporated silicon oxide films using TMOS/N2O gas. Thin Solid Films 2006;506-507:45–
9.
[23] Carlos E. Viana, Ana N. R. da Silva, Nilton I. Morimoto. Analysis of SiO2 thin films
deposited by PECVD using an Oxygen-TEOS-Argon mixture. Brazilian Journal of Physics
2001;31(2):299–303.
[24] Barni R, Zanini S, Riccardi C. Characterization of the Chemical Kinetics in an O 2 /HMDSO
RF Plasma for Material Processing. Advances in Physical Chemistry 2012;2012(6):1–6.
[25] S. Gaur and G. Vergason. Plasma Polymerization:Theory and Practice. Society of Vacuum
Coaters 2000:267–71.
[26] Petit-Etienne C, Tatoulian M, Mabille I, Sutter E, Arefi-Khonsari F. Deposition of SiOχ-
Like Thin Films from a Mixture of HMDSO and Oxygen by Low Pressure and DBD

References
108
Discharges to Improve the Corrosion Behaviour of Steel. Plasma Process. Polym.
2007;4(S1):S562-S567.
[27] Bewilogua K, Bräuer G, Dietz A, Gäbler J, Goch G, Karpuschewski B et al. Surface
technology for automotive engineering. CIRP Annals - Manufacturing Technology
2009;58(2):608–27.
[28] Noborisaka M, Kodama H, Nagashima S, Shirakura A, Horiuchi T, Suzuki T. Synthesis of
transparent and hard SiOC(−H) thin films on polycarbonate substrates by PECVD
method. Surface and Coatings Technology 2012;206(8-9):2581–4.
[29] R. Lamendola, R. d'Agostino, and F. Fracassi. Thin film deposition from
hexamethyldisiloxane fed glow discharges. Plasmas and Polymers 1997;2:147–64.
[30] F. Fracassi, R. d'Agostino, F. Fanelli, A. Fornelli, and F. Palumbo. GC-MS Investigation of
Hexamethyldisiloxane-Oxygen Fed Plasmas. Plasmas and Polymers 2003;8:259–69.
[31] Lutz Körner. Diffusion Barrier Coatings for Polymer Diffusion Barrier Coatings for
Polymer Containers processed by Plasma Enhanced Chemical Vapor Deposition
(Doctoral dissertation); 2010, Retrieved from http://e-
collection.library.ethz.ch/eserv/eth:1657/eth-1657-02.pdf.
[32] Bernd Jacoby. Abscheidung und Charakterisierung von Plasmapolymerschichten auf
Fluorkohlenstoffund Siloxan-Basis (Doctoral dissertation); 2008, Retrieved from
https://www.deutsche-digitale-
bibliothek.de/binary/7CVTT726IQBBCOQWC4DXNDB3D55B7XY3/full/1.pdf.
[33] H. Conrads, M. Schmidt. Plasma generation and plasma sources. Plasma Sources Sci.
Technol. 2000;9:441–54.
[34] Li C, Liang C, Huang C. Tailoring surface properties of polyethylene separator by low
pressure 13.56 MHz RF oxygen plasma glow discharge. Jpn. J. Appl. Phys.
2016;55(1S):01AF04.
[35] Tanışlı M, Şahin N, Demir S. An investigation on optical properties of capacitive coupled
radio-frequency mixture plasma with Langmuir probe. Optik - International Journal for
Light and Electron Optics 2017;142:153–62.
[36] Vladimir Danilov. Plasma Modification of Polydimethylsiloxane in a hydrogen CCRF low-
pressure discharge (Doctoral dissertation); 2013, Retrieved from http://d-
nb.info/1047137178/34.

References
109
[37] Bohm D. Minimum ionic kinetic energy for a stable sheath: In: Guthrie A and Wakerling
RK,editors. The Characteristics of Electrical Discharges in Magnetic Fields. NewYork,
London: McGrawHill; 1949.
[38] Prof. A. von Keudell. Vorlesungsskript: Einführung in die Plasmaphysik II:
Niedertemperaturplasmen: Wintersemester 2010/11. Ruhr-Universität Bochum; 2013.
[39] Advanced Energy Industries Inc. Impedance Matching. [June,2017]; Available from:
Retrieved from: http://www.advanced-energy.com/upload/file/white_papers/eng-
white18-270-02.pdf.
[40] University of Bristol - School of Chemistry. Plasma Diagnostics: Electron Temperatures
and Ion Energy Distributions. [June, 2017]; Available from:
http://www.chm.bris.ac.uk/~paulmay/misc/msc/msc4.htm.
[41] F. Fracassi. Architecture of Plasma Reactors: In R. D'Agostino, P. Favia, and F. Fracassi,
editors. Plasma Processing of Polymers, pages 47-64. Kluwer Academic Publishers,
Dordrecht; 1997.
[42] Kohler K, Cobum JW, Home DE, Kay E, Keller JH. Plasma potentials of 13.56-MHz rf
argon glow discharges in a planar system. Journal of Applied Physics 1985:59–66.
[43] Enrico Malatesta, Dennis Tee Xian Yang. The Importance of DC Self-Bias Voltage in
Plasma Applications. [June,2017]; Available from:
http://www.palomartechnologies.com/blog/the-importance-of-dc-self-bias-voltage-in-
plasma-applications.
[44] Giessler S, Just E, Störger R. Easy-to-clean properties–Just a temporary appearance?
Thin Solid Films 2006;502(1-2):252–6.
[45] Vissing K, Klyszcz-Nasko H. Permanente plasmapolymere Trennschichten. VIP
2006;18(1):12–4.
[46] Thorben Brenner. Struktureigenschaftsbeziehung von chemisch gleichartigen
plasmapolymeren Trennschichten mit stark variierendem Elastizitätsmodul (Master
thesis); 2017.
[47] Oxford Instruments Asylum Research, Inc. AFM Characterization of Thin Films: AFM
Characterization of Thin Films: High-Resolution Topography and Functional Properties.
[July/2017]; Available from:
https://www.asylumresearch.com/Applications/ThinFilms/Thin-Films-Characterization-
AFM.pdf.

References
110
[48] Baturin AS, Bormashov VS, Gavrilenko VP, Zablotskii AB, Zaitsev SA, Kuzin AY et al.
Ellipsometric Technique for Estimating the Thickness Nonuniformity of Thin-Film
Coatings. Meas Tech 2014;56(11):1224–32.
[49] Nie H, McIntyre NS, Lau WM, Feng JM. Optical properties of an octadecylphosphonic
acid self-assembled monolayer on a silicon wafer. Thin Solid Films 2008;517(2):814–8.
[50] Lei X, Kane S, Cogan S, Lorach H, Galambos L, Huie P et al. SiC protective coating for
photovoltaic retinal prosthesis. J Neural Eng 2016;13(4):1–12.
[51] Wolfgang Jacob, Achim von Keudell, and Thomas Schwarz-Selinger. Infrared Analysis of
Thin Films: Amorphous, Hydrogenated Carbon on Silicon. Brazilian Journal of Physics
2000;30(3):508–16.
[52] Wojcieszak D, Mazur M, Indyka J, Jurkowska A, Kalisz M, Domanowski P et al.
Mechanical and structural properties of titanium dioxide deposited by innovative
magnetron sputtering process. Materials Science-Poland 2015;33(3):660–8.
[53] Bruno P, Cicala G, Losacco A, Decuzzi P. Mechanical properties of PECVD hydrogenated
amorphous carbon coatings via nanoindentation and nanoscratching techniques.
Surface and Coatings Technology 2004;180-181:259–64.
[54] Sarkar DK, Farzaneh M, Paynter RW. Wetting and superhydrophobic properties of
PECVD grown hydrocarbon and fluorinated-hydrocarbon coatings. Applied Surface
Science 2010;256(11):3698–701.
[55] Subhash Latthe S, Basavraj Gurav A, Shridhar Maruti C, Shrikant Vhatkar R. Recent
Progress in Preparation of Superhydrophobic Surfaces: A Review. JSEMAT
2012;02(02):76–94.
[56] PLASMAtech I. Plasma Polymerized Thin Films for Surface Engineering. [July,2017];
Available from: http://www.plasmatechnology.com/pdf/PECVDCoatingsv2.pdf.
[57] Houta F, Quinten M. Layer Thickness Determination: The influence of the aperture of a
measuring head. Optik & Photonik 2015;10(4):54–6.
[58] Ocean Optics. Thickness Measurement. [July,2017]; Available from:
https://oceanoptics.com//application/thickness-measurement/.
[59] W.C. Oliver, G.M. Pharr. Measurement of hardness and elastic modulus by
instrumented indentation: Advances in understanding and refinements to methodology.
Journal of Materials Research 2004;19(1):3–20.

References
111
[60] Cech V, Lukes J, Palesch E, Lasota T. Elastic Modulus and Hardness of Plasma-
Polymerized Organosilicones Evaluated by Nanoindentation Techniques. Plasma
Process. Polym. 2015;12(9):864–81.
[61] W.C. Oliver, G. M. Pharr. An improved technique for determining hardness and elastic
modulus using load and displacement sensing indentation experiments. Journal of
Materials Research 1992;7(6):1564–83.
[62] Zhang M, Feng S, Wang L, Zheng Y. Lotus effect in wetting and self-cleaning.
Biotribology 2016;5:31–43.
[63] Lafuma A, Quéré D. Superhydrophobic states. Nat Mater 2003;2(7):457–60.
[64] Yuan Y, Lee TR. Contact Angle and Wetting Properties. In: Bracco G, Holst B, editors.
Surface Science Techniques. Berlin, Heidelberg: Springer Berlin Heidelberg; 2013, p. 3–
34.
[65] Snoeijer JH, Andreotti B. A microscopic view on contact angle selection. Physics of Fluids
2008;20(5):57101.
[66] Young T. An Essay on the Cohesion of Fluids. Philosophical Transactions of the Royal
Society of London 1805;95(0):65–87.
[67] Kaelble DH. Dispersion-Polar Surface Tension Properties of Organic Solids. The Journal
of Adhesion 2008;2(2):66–81.
[68] D. Owens, R. Wendt. Estimation of the surface free energy of polymers. J. Appl. Polym.
Sci 1969;13:1741–7.
[69] Wu S. Polar and Nonpolar Interactions in Adhesion. The Journal of Adhesion
1973;5(1):39–55.
[70] KRÜSS GmbH. Method according to Wu. [September 08, 2017]; Available from:
https://www.kruss.de/services/education-theory/glossary/method-according-to-wu/.
[71] Mohr, Sebastian. Simulation und Modellierung von CCRF-Entladungen in molekularen
Gasen; 2014, Retrieved from: http://www-brs.ub.ruhr-uni-
bochum.de/netahtml/HSS/Diss/MohrSebastian/diss.pdf.
[72] Cheng J, Ji L, Wang K, Han C, Shi Y. Two-dimensional simulation of inductively coupled
plasma based on COMSOL and comparison with experimental data. J. Semicond.
2013;34(6):66004.
[73] Krzhizhanovskaya VV, Sloot PM, Gorbachev YE. Grid-Based Simulation of Industrial Thin-
Film Production. SIMULATION 2016;81(1):77–85.

References
112
[74] Son S, Yi K, Mahrholz J, Rie K. Numerical studies on up scaling of metal organic PACVD
processes used for tribological coating in automotive industry. Surface and Coatings
Technology 2007;201(16-17):7318–26.
[75] Murley DT, Gibson R, Dunnett B, Goodyear A, French ID. Influence of gas residence time
on the deposition of nitrogen-rich amorphous silicon nitride. Journal of Non-Crystalline
Solids 1995;187:324–8.
[76] Collins DJ, Strojwas AJ, White DD. A CFD model for the PECVD of silicon nitride. IEEE
Trans. Semicond. Manufact. 1994;7(2):176–83.
[77] Crose M, Tran A, Christofides P. Multiscale Computational Fluid Dynamics: Methodology
and Application to PECVD of Thin Film Solar Cells. Coatings 2017;7(2):22.
[78] Da Silva A, Morimoto N. Gas flow simulation in a PECVD reactor. In Proceedings of the
2002 International Conference on Computational Nanoscience and Nanotechnology,San
Juan, Puerto Rico,22–25 April 2002.
[79] ANSYS Inc. ANSYS Fluent Theory Guide 16.0;. ANSYS Inc.:Canonsburg,PA, USA; 2015.
[80] Xu SY, Cai JS, Li J. Modeling and simulation of plasma gas flow driven by a single
nanosecond-pulsed dielectric barrier discharge. Physics of Plasmas 2016;23(10):103510.
[81] Kim HJ, Lee HJ. 2D fluid model analysis for the effect of 3D gas flow on a capacitively
coupled plasma deposition reactor. Plasma Sources Sci. Technol. 2016;25(3):35006.
[82] Barber RW, Emerson DR. The influence of Knudsen number on the hydrodynamic
development length within parallel plate micro-channels. Advances in fluid mechanics IV
2002;32:207–16.
[83] Gad-el-Hak M. The MEMS handbook. 2nd ed. Boca Raton, Florida: CRC Taylor & Francis;
2006.
[84] Jeerasak Pitakarnnop RW. Rarefied gas flow in pressure and vacuum measurements.
ACTA IMEKO 2014;3(2):60–3.
[85] Yasuda HK. Some Important Aspects of Plasma Polymerization. Plasma Processes and
Polymers 2005;2:293–304.
[86] Prabhakara S, Deshpande MD. The no-slip boundary condition in fluid mechanics.
Reson:61–71.
[87] Harvard University - Materials Research Science and Engineering Center. Fabrication
techniques II: Deposition; Available from:

References
113
http://www.mrsec.harvard.edu/education/ap298r2004/Erli%20chenFabrication%20II%
20-%20Deposition-1.pdf.
[88] Pfeiffer Vacuum GmbH. Vacuum Technology - Know How; 2009.
[89] Brandisky, Kostadin, et al. Electrostatic field simulations in the analysis and design of
electrical capacitance tomography sensors. Automatyka/Akademia Górniczo-Hutnicza
im. Stanisława Staszica w Krakowie 2010;14:655–69.
[90] Fleisch DA (ed.). A student's guide to Maxwell's equations. 14th ed. Cambridge:
Cambridge University Press; 2014, cop. 2008.
[91] Tinck S, Boullart W, Bogaerts A. Investigation of etching and deposition processes of Cl 2
/O 2 /Ar inductively coupled plasmas on silicon by means of plasma–surface simulations
and experiments. J. Phys. D: Appl. Phys. 2009;42(9):95204.
[92] Cunge G, Pelissier B, Joubert O, Ramos R, Maurice C. New chamber walls conditioning
and cleaning strategies to improve the stability of plasma processes. Plasma Sources Sci.
Technol. 2005;14(3):599–609.
[93] Moriya T, Nakayama H, Nagaike H, Kobayashi Y, Shimada M, Okuyama K. Particle
Reduction and Control in Plasma Etching Equipment. IEEE Trans. Semicond. Manufact.
2005;18(4):477–86.
[94] Guensuk Lee, Suhong Kim, Seunghyun Seok, Junsung Lee, Jinseok Lee, Sangjin Choi,
Taeyang Yoon, Juhwan Park, Han Seo Ko. A Study on Film Thickness Control of vertical
Flow Showerhead Reactor for RF Plasma Deposition. 28th Annual SEMI Advanced
Semiconductor Manufacturing Conference (ASMC),15-18 May 2017 2017:217–21.
[95] L. Sansonnens, A. A. Howling, Ch. Hollenstein. Gas flow uniformity study in large-area
showerhead reactors for RF plasma deposition. Plasma Sources Science and Technology
2000;9(2):205–9.
[96] Applied Materials I. Centura® POLYgen™ LPCVD. [October,2017]; Available from:
http://www.appliedmaterials.com/products/centura-polygen-lpcvd.
[97] Kulkarni AV, Joshi JB. Design and selection of sparger for bubble column reactor. Part I:
Performance of different spargers. Chemical Engineering Research and Design 2011.
[98] Kulkarni AV, Joshi JB. Design and selection of sparger for bubble column reactor. Part II:
Optimum sparger type and design. Chemical Engineering Research and Design 2011.
[99] Bahroun K, Behm H, Dahlmann R, Hopmann C. Plasmagestützte
Flascheninnenbeschichtung. Vakuum in Forschung und Praxis 2013;25(4):17–23.

References
114
[100] Reis R, Dumee LF, Tardy BL, Dagastine R, Orbell JD, Schutz JA et al. Towards Enhanced
Performance Thin-film Composite Membranes via Surface Plasma Modification. Sci Rep
2016;6:1–13.
[101] Barbosa, Gustavo Simiema de Freitas, Vissing K, Mayer B. Creation and Evaluation of
Construction Guidelines Using CFD for Low Pressure Plasma Gas Feed-in Systems to
Homogenize the Precursor Gas Flow. OJFD 2016;06(04):391–405.
[102] Heehak Ahn, Sunghyuk Lee, Sehyun Shin. Flow Distribution in Manifolds for Low
Reynolds Number Flow. KSME International Journal 1998;12:87–95.
[103] Kim Y, Boo J, Hong B, Kim YJ. Effects of showerhead shapes on the flowfields in a RF-
PECVD reactor. Surface and Coatings Technology 2005;193(1-3):88–93.
[104] Caquineau H, Despax B. Influence of the reactor design in the case of silicon nitride
PECVD. Chemical Engineering Science 1997;52(17):2901–14.
[105] Hassan JM, Mohamed TA, Mohammed WS, Alawee WH. Modeling the Uniformity of
Manifold with Various Configurations. Journal of Fluids 2014;2014(11):1–8.
[106] Malavasi S, Messa G, Fratino U, Pagano A. On the pressure losses through perforated
plates. Flow Measurement and Instrumentation 2012;28:57–66.
[107] Bayazit Y, Sparrow EM, Joseph DD. Perforated plates for fluid management: Plate
geometry effects and flow regimes. International Journal of Thermal Sciences
2014;85:104–11.
[108] ANSYS Inc. Ansys Maxwell V16 - Training Manual: Lecture4: Static Electric Solver.
ANSYS Inc.:Canonsburg,PA, USA; 2013.
[109] Gorjanc M, Gorensek M, Jovancic P, Mozetic M. Multifunctional Textiles –
Modification by Plasma, Dyeing and Nanoparticles. In: Gunay M, editor. Eco-Friendly
Textile Dyeing and Finishing. InTech; 2013.
[110] L. Zajickova, J. Janca, V. Perina. Characterization of silicon oxide thin films deposited
by plasma enhanced chemical vapour deposition from
octamethylcyclotetrasiloxane/oxygen feeds. Thin Solid Films 1999;338:49–59.
[111] Hegemann D, Brunner H, Oehr C. Deposition rate and three-dimensional uniformity
of RF plasma deposited SiOx films. Surface and Coatings Technology 2001;142-144:849–
55.
[112] Hansen AB. Langmuir Probe Measurements of an Argon Plasma. Macalester Journal
of Physics and Astronomy 2014;Vol. 2: Iss. 1, Article 5.

References
115
[113] Stamate E. Status and challenges in electrical diagnostics of processing plasmas.
Surface and Coatings Technology 2014;260:401–10.