Construction Accident Statistics - HKARMS · PDF fileConstruction Accident Statistics Dr. S.W....
29
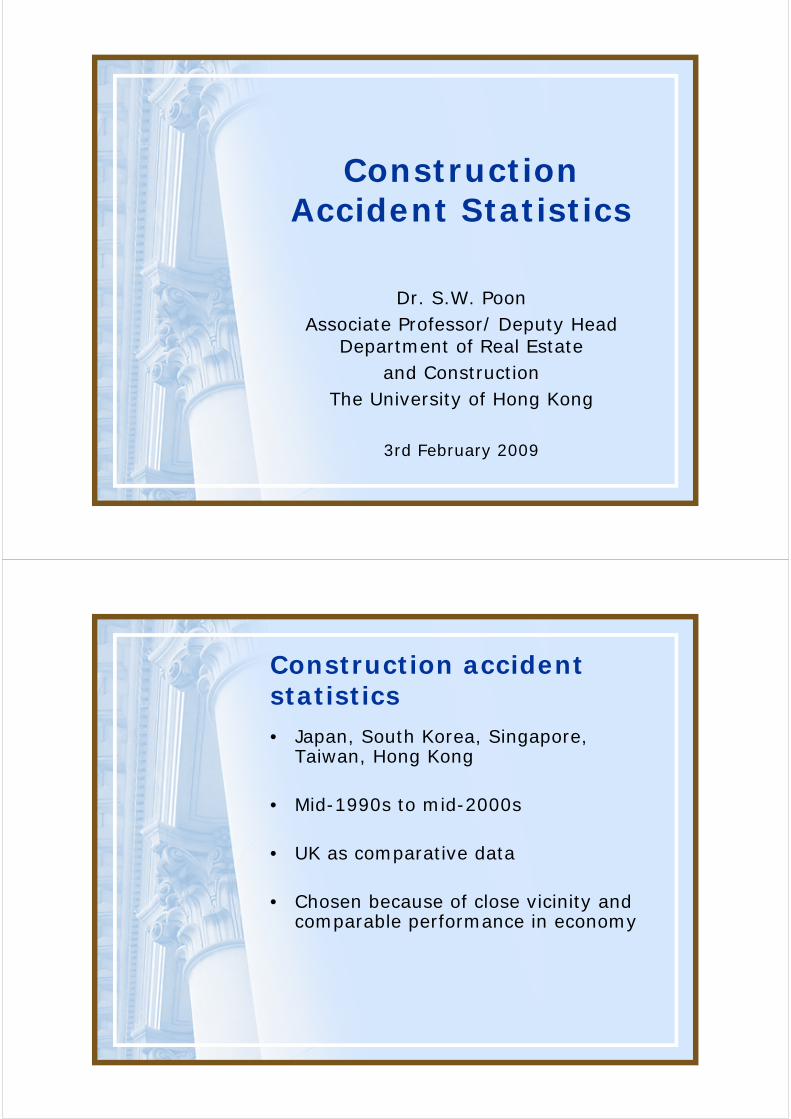
Construction Accident Statistics Dr. S.W. Poon Associate Professor/ Deputy Head Department of Real Estate and Construction The University of Hong Kong 3rd February 2009 Construction accident statistics • Japan, South Korea, Singapore, Taiwan, Hong Kong • Mid-1990s to mid-2000s • UK as comparative data • Chosen because of close vicinity and comparable performance in economy
-
Upload
trinhxuyen -
Category
Documents
-
view
215 -
download
1
Transcript of Construction Accident Statistics - HKARMS · PDF fileConstruction Accident Statistics Dr. S.W....
Construction Accident Statistics
Dr. S.W. PoonAssociate Professor/ Deputy Head
Department of Real Estate and Construction
The University of Hong Kong
3rd February 2009
Construction accident statistics• Japan, South Korea, Singapore,
Taiwan, Hong Kong
• Mid-1990s to mid-2000s
• UK as comparative data
• Chosen because of close vicinity and comparable performance in economy
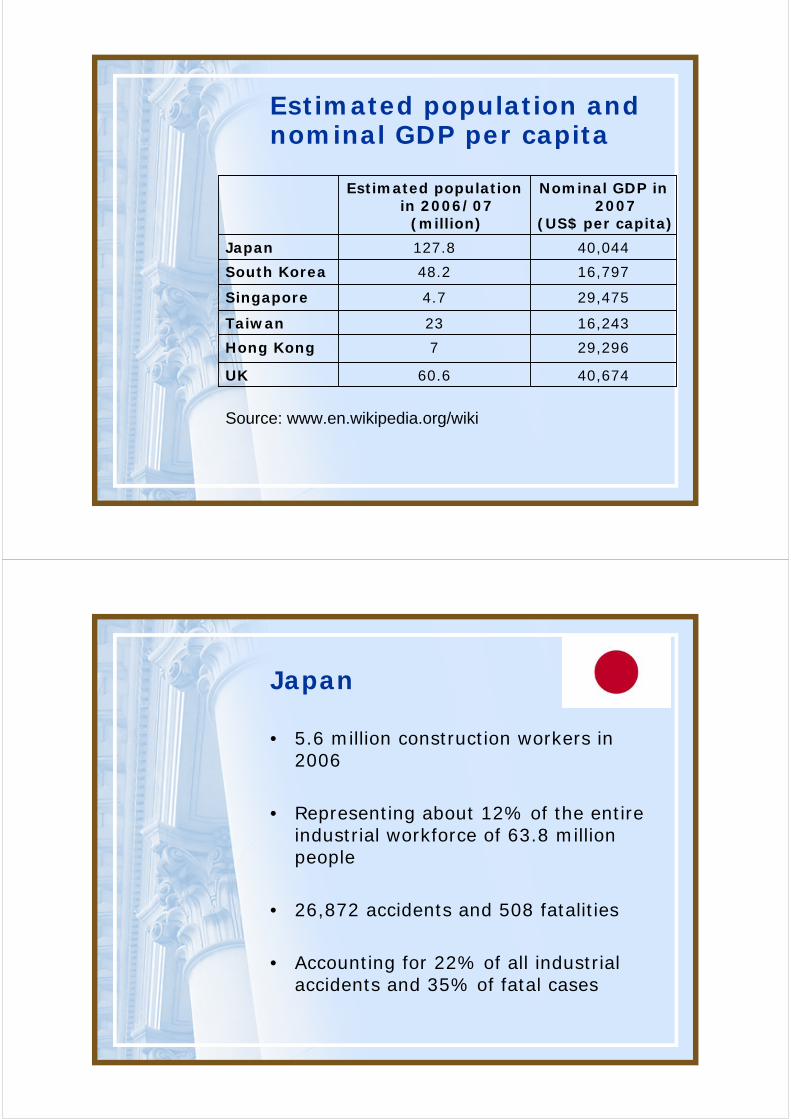
Estimated population and nominal GDP per capita
40,67460.6UK
29,2967Hong Kong
16,24323Taiwan
29,4754.7Singapore
16,79748.2South Korea
40,044127.8Japan
Nominal GDP in 2007
(US$ per capita)
Estimated population in 2006/07
(million)
Source: www.en.wikipedia.org/wiki
Japan
• 5.6 million construction workers in 2006
• Representing about 12% of the entire industrial workforce of 63.8 million people
• 26,872 accidents and 508 fatalities
• Accounting for 22% of all industrial accidents and 35% of fatal cases
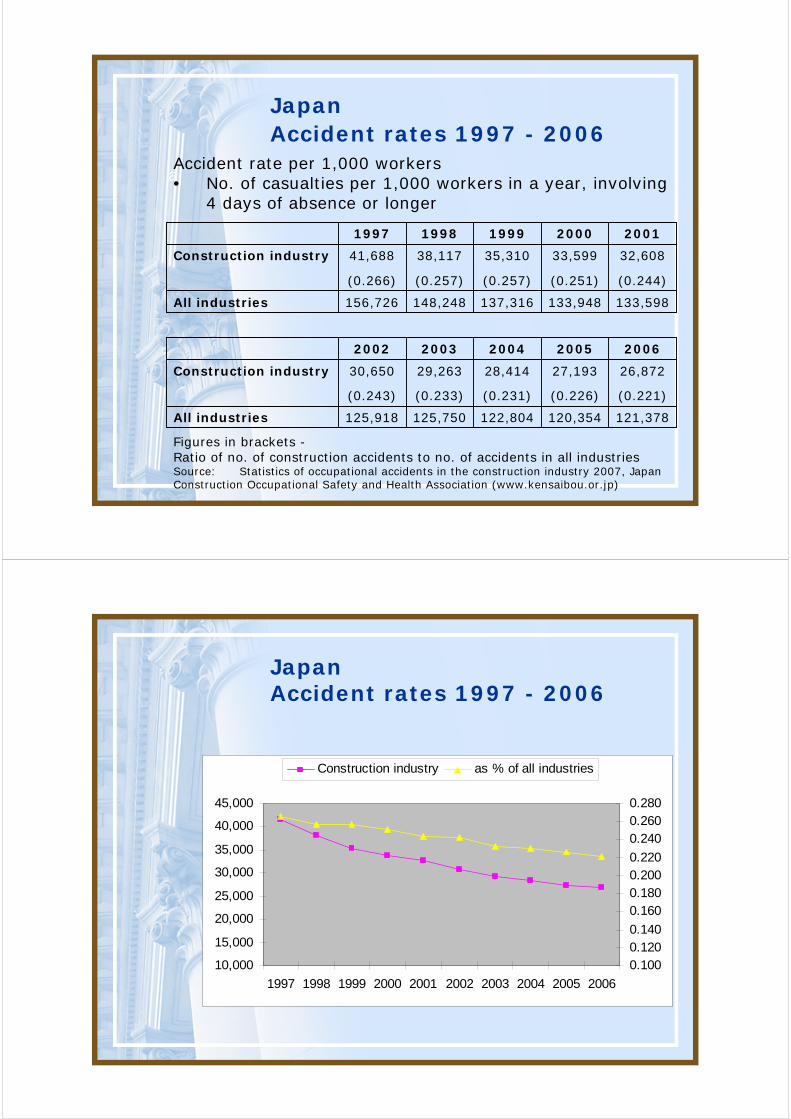
JapanAccident rates 1997 - 2006
121,378120,354122,804125,750125,918All industries
(0.221)(0.226)(0.231)(0.233)(0.243)
26,87227,19328,41429,26330,650Construction industry
20062005200420032002
133,598133,948137,316148,248156,726All industries
(0.244)(0.251)(0.257)(0.257)(0.266)
32,60833,59935,31038,11741,688Construction industry
20012000199919981997
Figures in brackets -Ratio of no. of construction accidents to no. of accidents in all industries Source: Statistics of occupational accidents in the construction industry 2007, Japan Construction Occupational Safety and Health Association (www.kensaibou.or.jp)
aAccident rate per 1,000 workers• No. of casualties per 1,000 workers in a year, involving
4 days of absence or longer
JapanAccident rates 1997 - 2006
10,000
15,000
20,000
25,000
30,000
35,000
40,000
45,000
1997 1998 1999 2000 2001 2002 2003 2004 2005 2006
0.1000.1200.140
0.1600.1800.2000.220
0.2400.2600.280
Construction industry as % of all industries
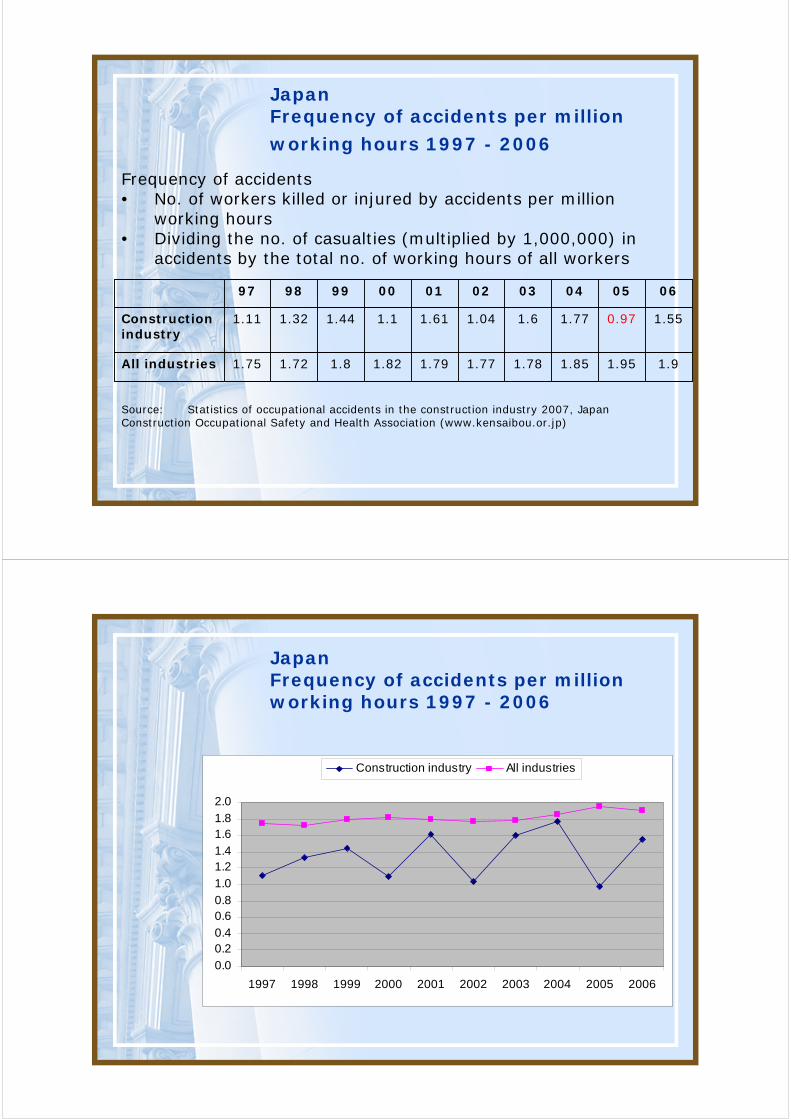
JapanFrequency of accidents per million
working hours 1997 - 2006
1.91.951.851.781.771.791.821.81.721.75All industries
1.550.971.771.61.041.611.11.441.321.11Construction industry
06050403020100999897
Source: Statistics of occupational accidents in the construction industry 2007, Japan Construction Occupational Safety and Health Association (www.kensaibou.or.jp)
Frequency of accidents• No. of workers killed or injured by accidents per million
working hours• Dividing the no. of casualties (multiplied by 1,000,000) in
accidents by the total no. of working hours of all workers
JapanFrequency of accidents per million working hours 1997 - 2006
0.0
0.20.4
0.60.8
1.0
1.21.4
1.61.8
2.0
1997 1998 1999 2000 2001 2002 2003 2004 2005 2006
Construction industry All industries
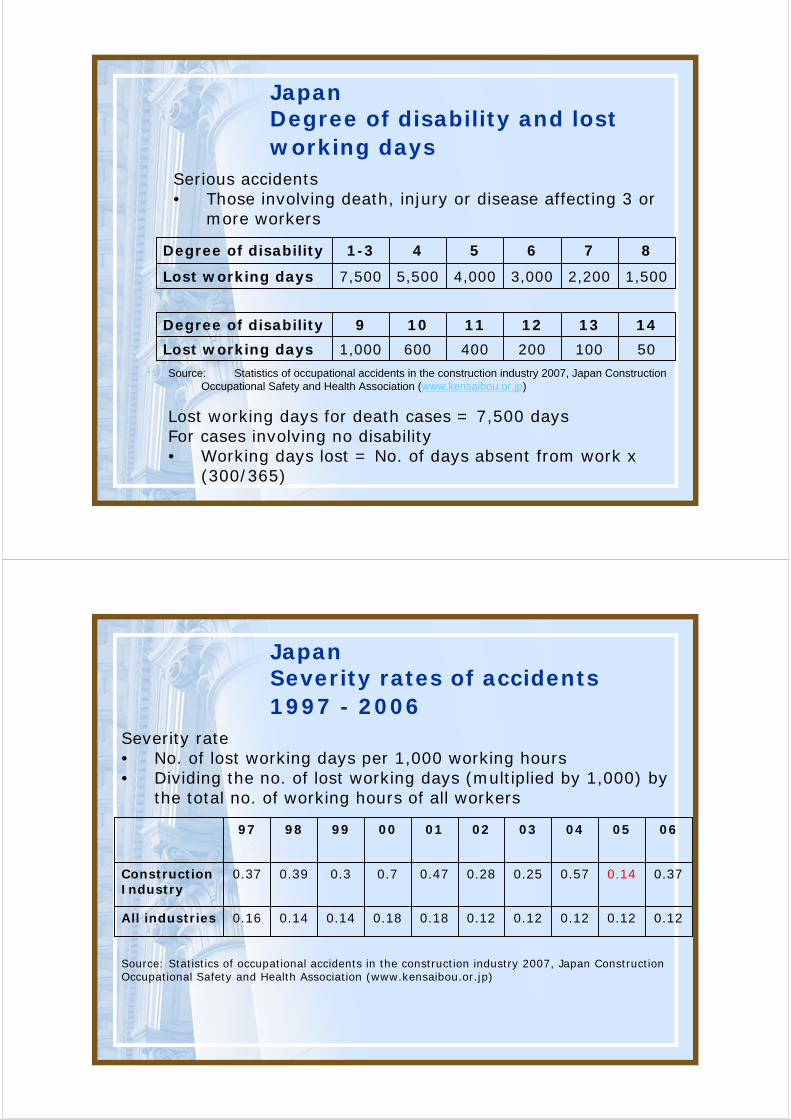
JapanDegree of disability and lost working days
501002004006001,000Lost working days
14131211109Degree of disability
1,5002,2003,0004,0005,5007,500Lost working days
876541-3Degree of disability
a
Source: Statistics of occupational accidents in the construction industry 2007, Japan Construction Occupational Safety and Health Association (www.kensaibou.or.jp)
Lost working days for death cases = 7,500 daysFor cases involving no disability• Working days lost = No. of days absent from work x
(300/365)
Serious accidents• Those involving death, injury or disease affecting 3 or
more workers
JapanSeverity rates of accidents 1997 - 2006
0.120.120.120.120.120.180.180.140.140.16All industries
0.370.140.570.250.280.470.70.30.390.37Construction Industry
06050403020100999897
Source: Statistics of occupational accidents in the construction industry 2007, Japan Construction Occupational Safety and Health Association (www.kensaibou.or.jp)
Severity rate• No. of lost working days per 1,000 working hours• Dividing the no. of lost working days (multiplied by 1,000) by
the total no. of working hours of all workers
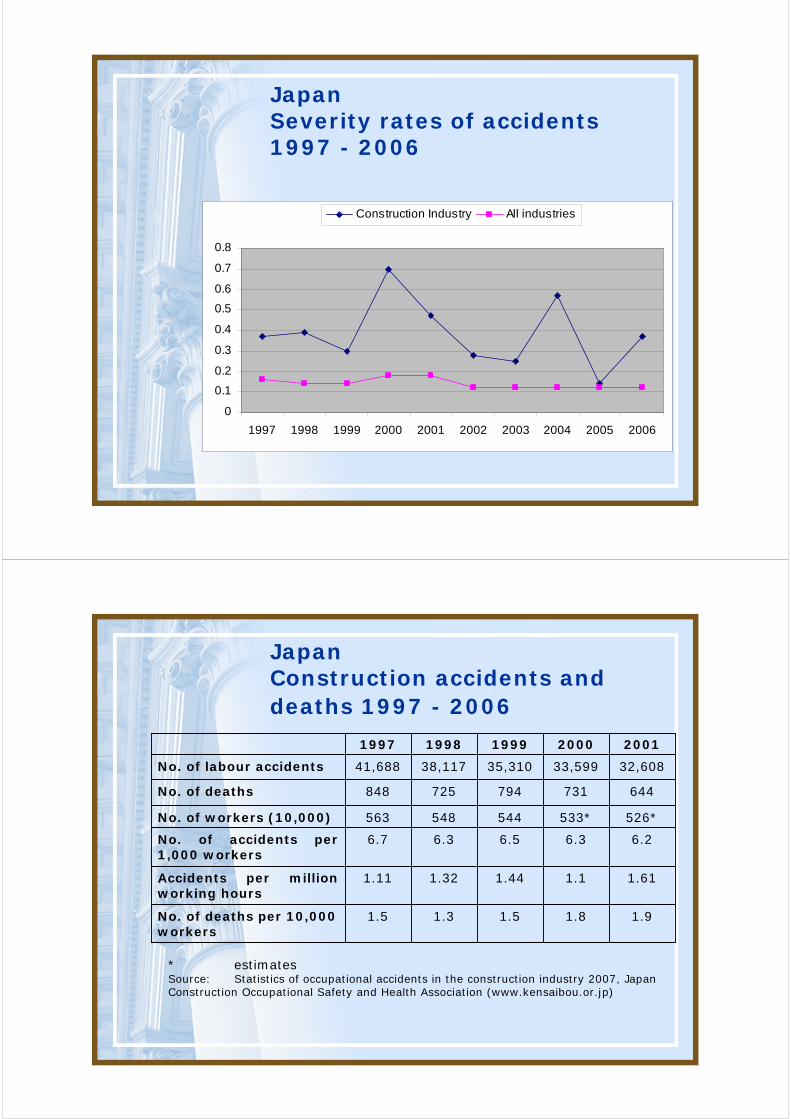
JapanSeverity rates of accidents 1997 - 2006
0
0.1
0.2
0.3
0.4
0.5
0.6
0.7
0.8
1997 1998 1999 2000 2001 2002 2003 2004 2005 2006
Construction Industry All industries
JapanConstruction accidents and deaths 1997 - 2006
1.91.81.51.31.5No. of deaths per 10,000 workers
1.611.11.441.321.11Accidents per million working hours
6.26.36.56.36.7No. of accidents per 1,000 workers
526*533*544548563No. of workers (10,000)
644731794725848No. of deaths
32,60833,59935,31038,11741,688No. of labour accidents
20012000199919981997
* estimatesSource: Statistics of occupational accidents in the construction industry 2007, Japan Construction Occupational Safety and Health Association (www.kensaibou.or.jp)
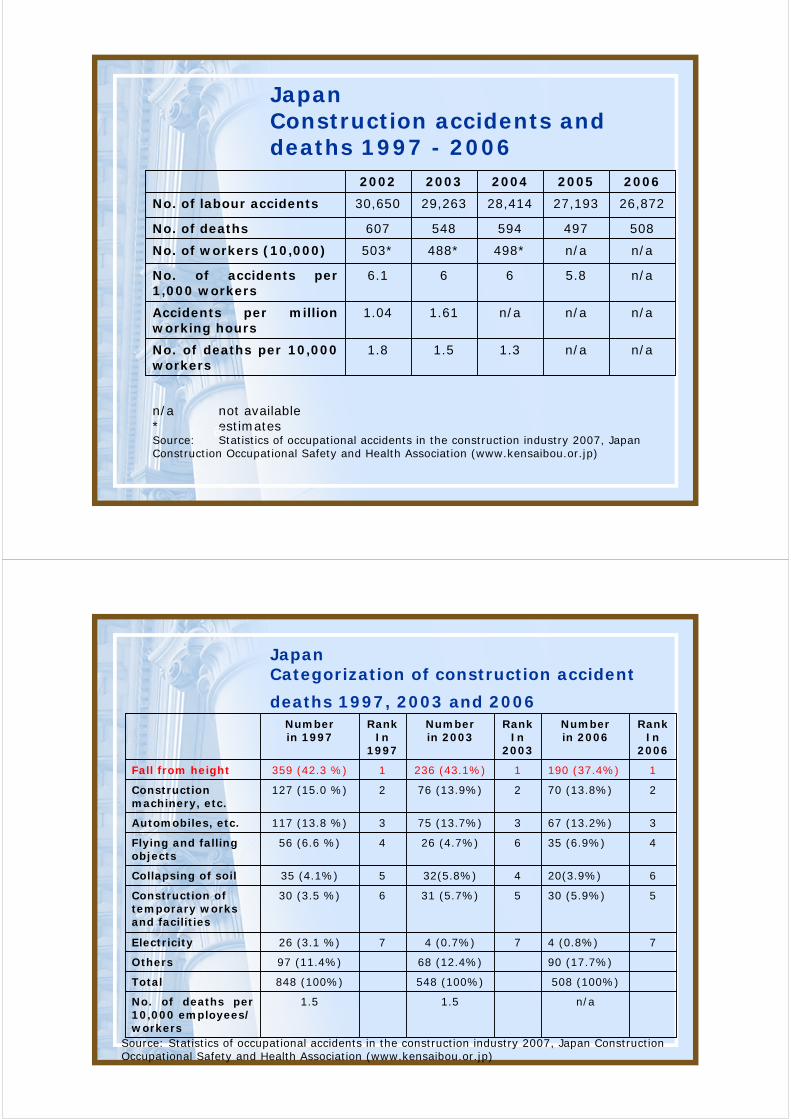
JapanConstruction accidents and deaths 1997 - 2006
n/an/a1.31.51.8No. of deaths per 10,000 workers
n/an/an/a1.611.04Accidents per million working hours
n/a5.8666.1No. of accidents per 1,000 workers
n/an/a498*488*503*No. of workers (10,000)
508497594548607No. of deaths
26,87227,19328,41429,26330,650No. of labour accidents
20062005200420032002
n/a not available* estimatesSource: Statistics of occupational accidents in the construction industry 2007, Japan Construction Occupational Safety and Health Association (www.kensaibou.or.jp)
a
JapanCategorization of construction accident
deaths 1997, 2003 and 2006
n/a1.51.5No. of deaths per 10,000 employees/workers
508 (100%)548 (100%)848 (100%)Total
90 (17.7%)68 (12.4%)97 (11.4%)Others
74 (0.8%)74 (0.7%)726 (3.1 %)Electricity
530 (5.9%)531 (5.7%)630 (3.5 %)Construction of temporary worksand facilities
620(3.9%)432(5.8%)535 (4.1%)Collapsing of soil
435 (6.9%)626 (4.7%)456 (6.6 %)Flying and falling objects
367 (13.2%)375 (13.7%)3117 (13.8 %)Automobiles, etc.
270 (13.8%)276 (13.9%)2127 (15.0 %)Construction machinery, etc.
1190 (37.4%)1236 (43.1%)1359 (42.3 %)Fall from height
RankIn
2006
Numberin 2006
RankIn
2003
Numberin 2003
RankIn
1997
Numberin 1997
Source: Statistics of occupational accidents in the construction industry 2007, Japan Construction Occupational Safety and Health Association (www.kensaibou.or.jp)
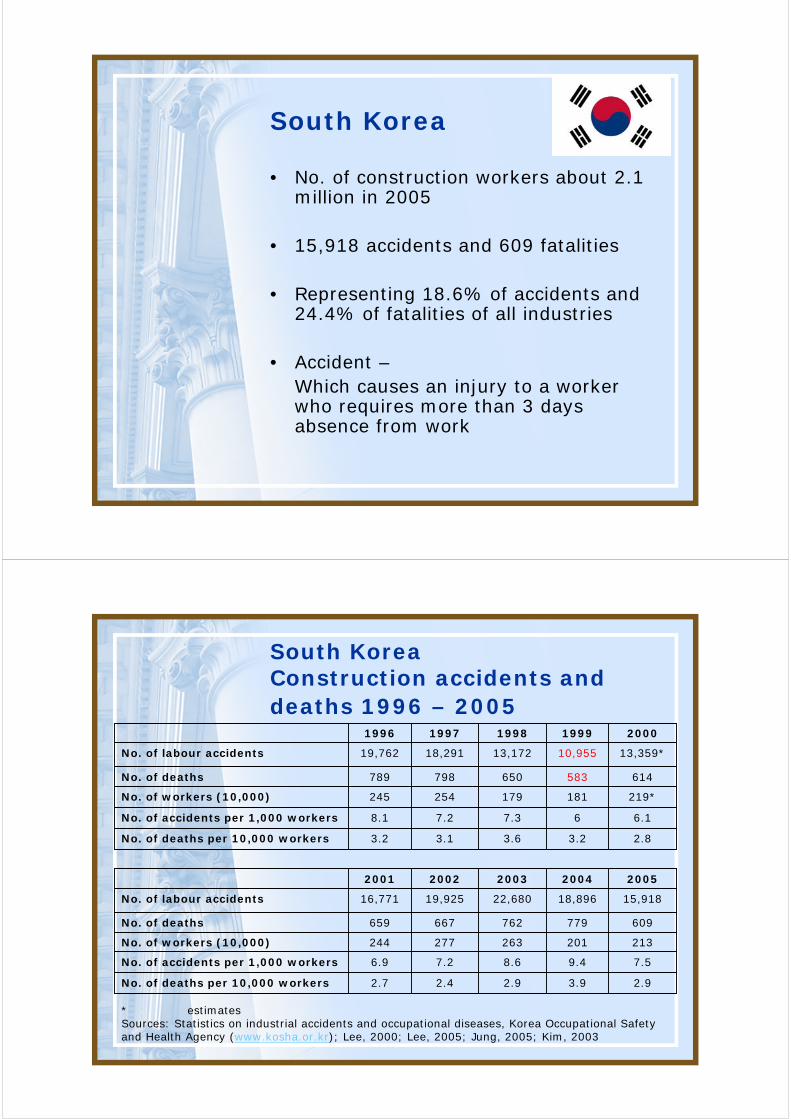
South Korea
• No. of construction workers about 2.1 million in 2005
• 15,918 accidents and 609 fatalities
• Representing 18.6% of accidents and 24.4% of fatalities of all industries
• Accident –Which causes an injury to a worker who requires more than 3 days absence from work
South KoreaConstruction accidents and deaths 1996 – 2005
2.93.92.92.42.7No. of deaths per 10,000 workers
7.59.48.67.26.9No. of accidents per 1,000 workers
213201263277244No. of workers (10,000)
609779762667659No. of deaths
15,91818,89622,68019,92516,771No. of labour accidents
20052004200320022001
2.83.23.63.13.2No. of deaths per 10,000 workers
6.167.37.28.1No. of accidents per 1,000 workers
219*181179254245No. of workers (10,000)
614583650798789No. of deaths
13,359*10,95513,17218,29119,762No. of labour accidents
20001999199819971996
* estimatesSources: Statistics on industrial accidents and occupational diseases, Korea Occupational Safety and Health Agency (www.kosha.or.kr); Lee, 2000; Lee, 2005; Jung, 2005; Kim, 2003
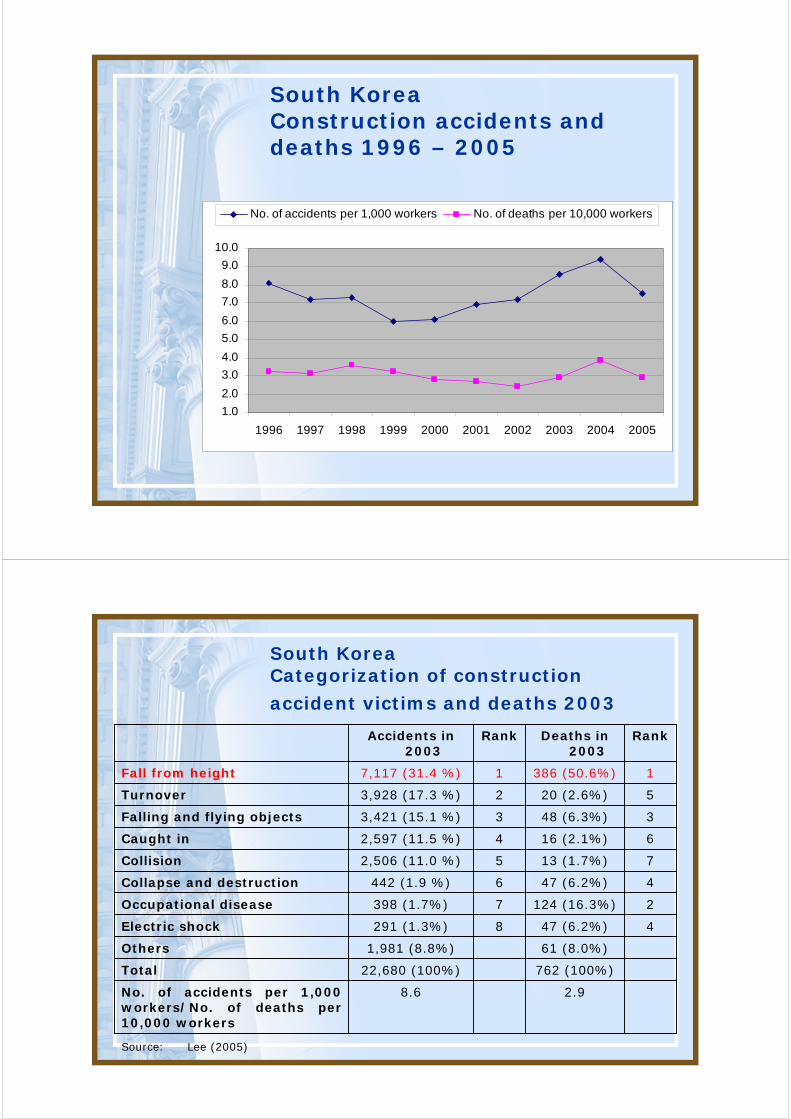
South KoreaConstruction accidents and deaths 1996 – 2005
1.0
2.0
3.0
4.0
5.0
6.0
7.0
8.0
9.0
10.0
1996 1997 1998 1999 2000 2001 2002 2003 2004 2005
No. of accidents per 1,000 workers No. of deaths per 10,000 workers
South KoreaCategorization of construction
accident victims and deaths 2003
2.98.6No. of accidents per 1,000 workers/No. of deaths per 10,000 workers
762 (100%)22,680 (100%)Total
61 (8.0%)1,981 (8.8%)Others
447 (6.2%)8291 (1.3%)Electric shock
2124 (16.3%)7398 (1.7%)Occupational disease
447 (6.2%)6442 (1.9 %)Collapse and destruction
713 (1.7%)52,506 (11.0 %)Collision
616 (2.1%)42,597 (11.5 %)Caught in
348 (6.3%)33,421 (15.1 %)Falling and flying objects
520 (2.6%)23,928 (17.3 %)Turnover
1386 (50.6%)17,117 (31.4 %)Fall from height
RankDeaths in 2003
RankAccidents in 2003
Source: Lee (2005)
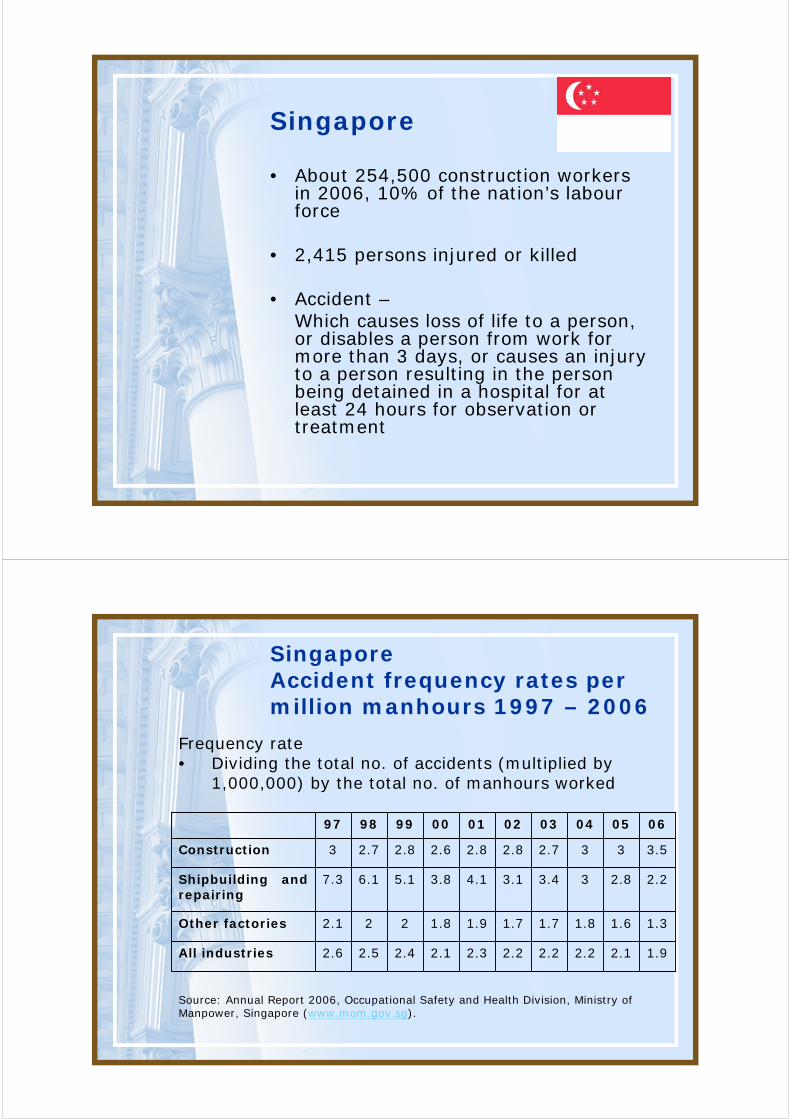
Singapore
• About 254,500 construction workers in 2006, 10% of the nation’s labourforce
• 2,415 persons injured or killed
• Accident –Which causes loss of life to a person, or disables a person from work for more than 3 days, or causes an injury to a person resulting in the person being detained in a hospital for at least 24 hours for observation or treatment
SingaporeAccident frequency rates per million manhours 1997 – 2006
1.92.12.22.22.22.32.12.42.52.6All industries
1.31.61.81.71.71.91.8222.1Other factories
2.22.833.43.14.13.85.16.17.3Shipbuilding and repairing
3.5332.72.82.82.62.82.73Construction
06050403020100999897
Source: Annual Report 2006, Occupational Safety and Health Division, Ministry of Manpower, Singapore (www.mom.gov.sg).
Frequency rate• Dividing the total no. of accidents (multiplied by
1,000,000) by the total no. of manhours worked
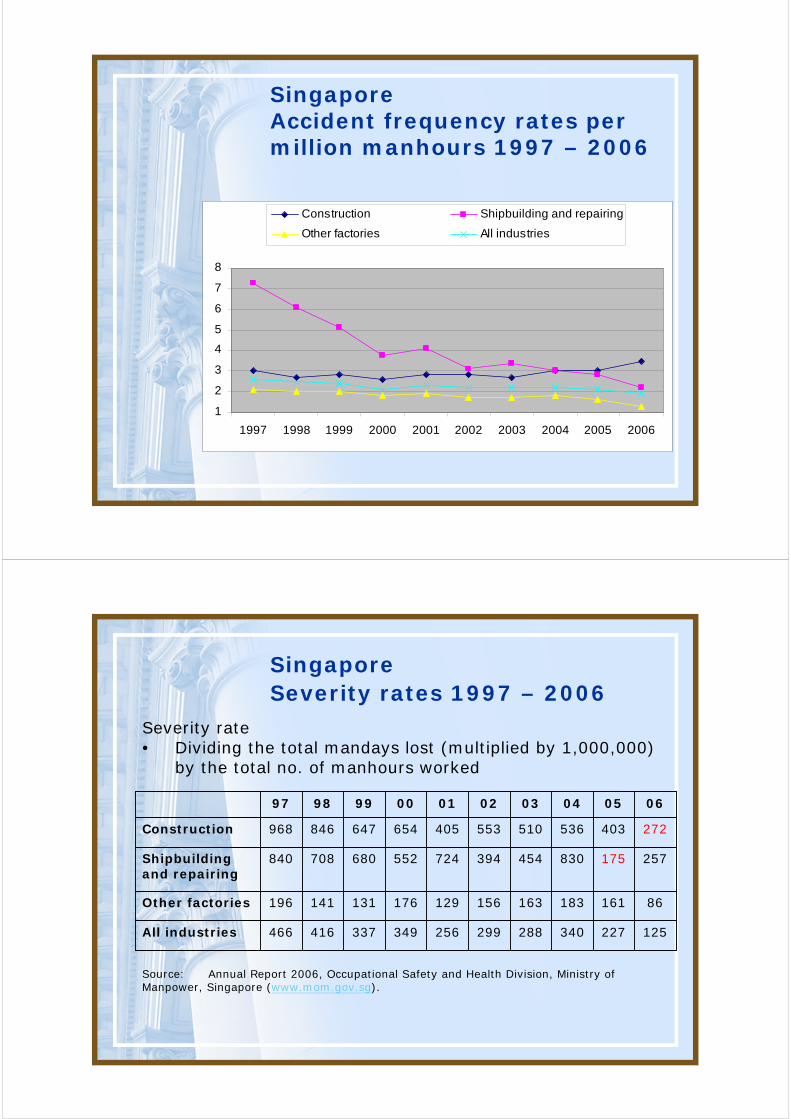
SingaporeAccident frequency rates per million manhours 1997 – 2006
1
2
3
4
5
6
7
8
1997 1998 1999 2000 2001 2002 2003 2004 2005 2006
Construction Shipbuilding and repairing
Other factories All industries
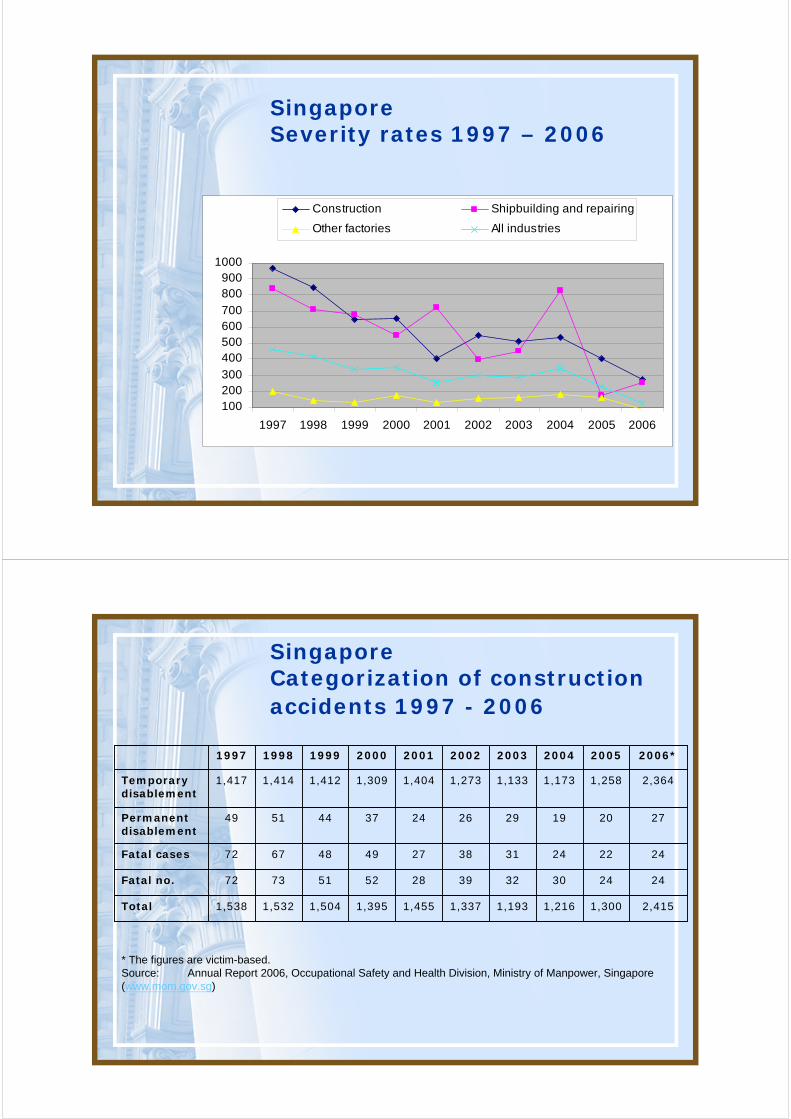
SingaporeSeverity rates 1997 – 2006
125227340288299256349337416466All industries
86161183163156129176131141196Other factories
257175830454394724552680708840Shipbuilding and repairing
272403536510553405654647846968Construction
06050403020100999897
Source: Annual Report 2006, Occupational Safety and Health Division, Ministry of Manpower, Singapore (www.mom.gov.sg).
Severity rate• Dividing the total mandays lost (multiplied by 1,000,000)
by the total no. of manhours worked
SingaporeSeverity rates 1997 – 2006
100200300
400500600700
800900
1000
1997 1998 1999 2000 2001 2002 2003 2004 2005 2006
Construction Shipbuilding and repairing
Other factories All industries
SingaporeCategorization of construction accidents 1997 - 2006
2,4151,3001,2161,1931,3371,4551,3951,5041,5321,538Total
24243032392852517372Fatal no.
24222431382749486772Fatal cases
27201929262437445149Permanent disablement
2,3641,2581,1731,1331,2731,4041,3091,4121,4141,417Temporary disablement
2006*200520042003200220012000199919981997
* The figures are victim-based.Source: Annual Report 2006, Occupational Safety and Health Division, Ministry of Manpower, Singapore (www.mom.gov.sg)
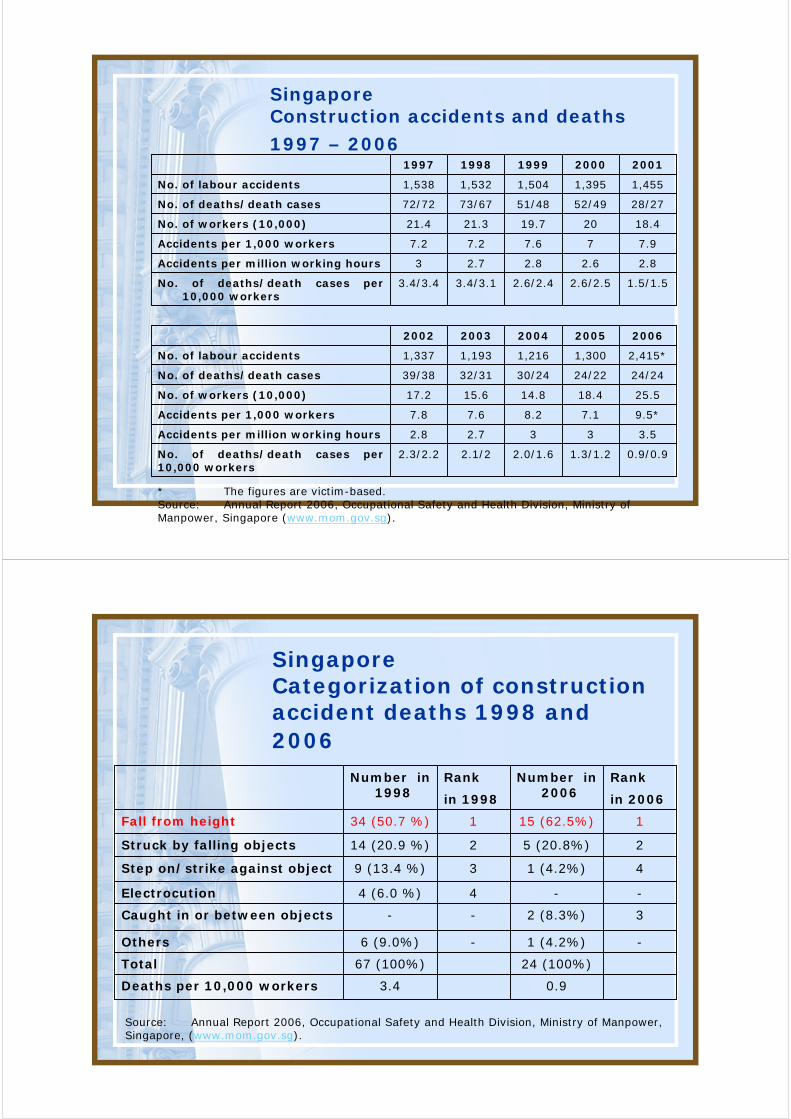
SingaporeConstruction accidents and deaths
1997 – 2006
0.9/0.91.3/1.22.0/1.62.1/22.3/2.2No. of deaths/death cases per 10,000 workers
3.5332.72.8Accidents per million working hours
9.5*7.18.27.67.8Accidents per 1,000 workers
25.518.414.815.617.2No. of workers (10,000)
24/2424/2230/2432/3139/38No. of deaths/death cases
2,415*1,3001,2161,1931,337No. of labour accidents
20062005200420032002
1.5/1.52.6/2.52.6/2.43.4/3.13.4/3.4No. of deaths/death cases per 10,000 workers
2.82.62.82.73Accidents per million working hours
7.977.67.27.2Accidents per 1,000 workers
18.42019.721.321.4No. of workers (10,000)
28/2752/4951/4873/6772/72No. of deaths/death cases
1,4551,3951,5041,5321,538No. of labour accidents
20012000199919981997
* The figures are victim-based.Source: Annual Report 2006, Occupational Safety and Health Division, Ministry of Manpower, Singapore (www.mom.gov.sg).
SingaporeCategorization of construction accident deaths 1998 and 2006
0.93.4Deaths per 10,000 workers
24 (100%)67 (100%)Total
-1 (4.2%)-6 (9.0%)Others
32 (8.3%)--Caught in or between objects
--44 (6.0 %)Electrocution
41 (4.2%)39 (13.4 %)Step on/strike against object
25 (20.8%)214 (20.9 %)Struck by falling objects
115 (62.5%)134 (50.7 %)Fall from height
in 2006in 1998
Rank Number in 2006
Rank Number in 1998
Source: Annual Report 2006, Occupational Safety and Health Division, Ministry of Manpower, Singapore, (www.mom.gov.sg).
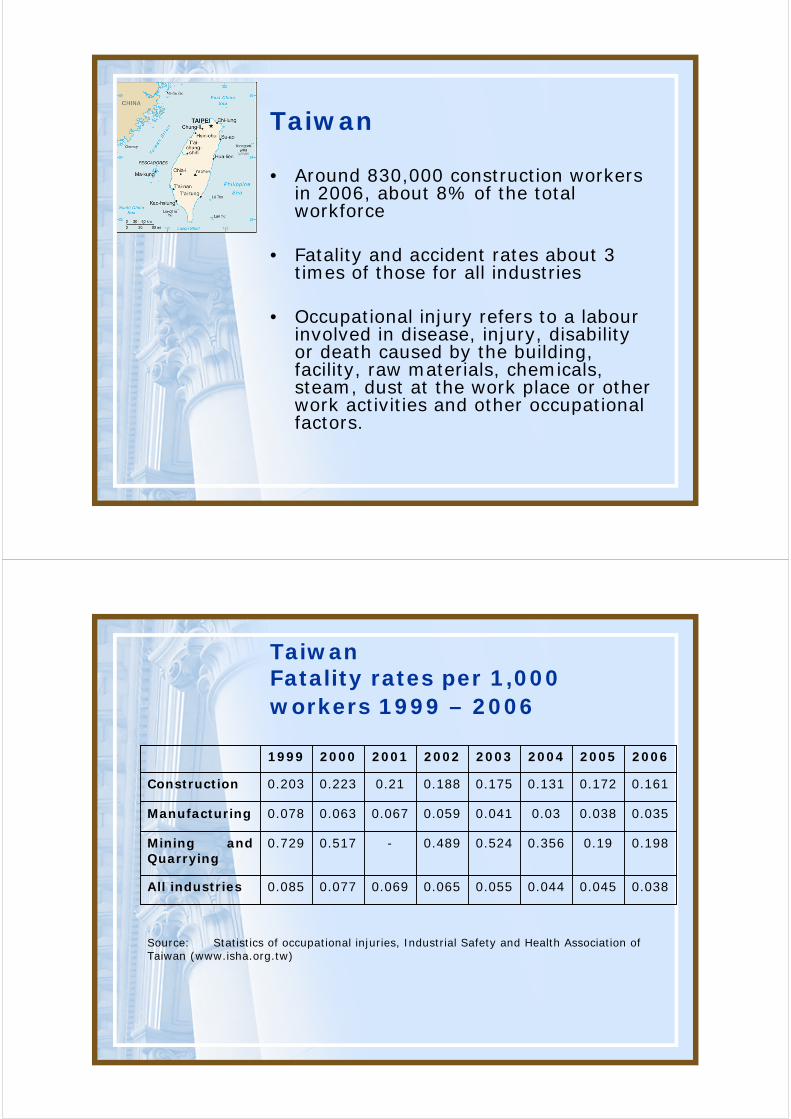
Taiwan
• Around 830,000 construction workers in 2006, about 8% of the total workforce
• Fatality and accident rates about 3 times of those for all industries
• Occupational injury refers to a labourinvolved in disease, injury, disability or death caused by the building, facility, raw materials, chemicals, steam, dust at the work place or other work activities and other occupational factors.
TaiwanFatality rates per 1,000 workers 1999 – 2006
0.0380.0450.0440.0550.0650.0690.0770.085All industries
0.1980.190.3560.5240.489-0.5170.729Mining and Quarrying
0.0350.0380.030.0410.0590.0670.0630.078Manufacturing
0.1610.1720.1310.1750.1880.210.2230.203Construction
20062005200420032002200120001999
Source: Statistics of occupational injuries, Industrial Safety and Health Association of Taiwan (www.isha.org.tw)
TaiwanFatality rates per 1,000 workers 1999 – 2006
0.0
0.1
0.2
0.3
0.4
0.5
0.6
0.7
0.8
1999 2000 2001 2002 2003 2004 2005 2006
Construction Manufacturing
Mining and Quarrying All industries
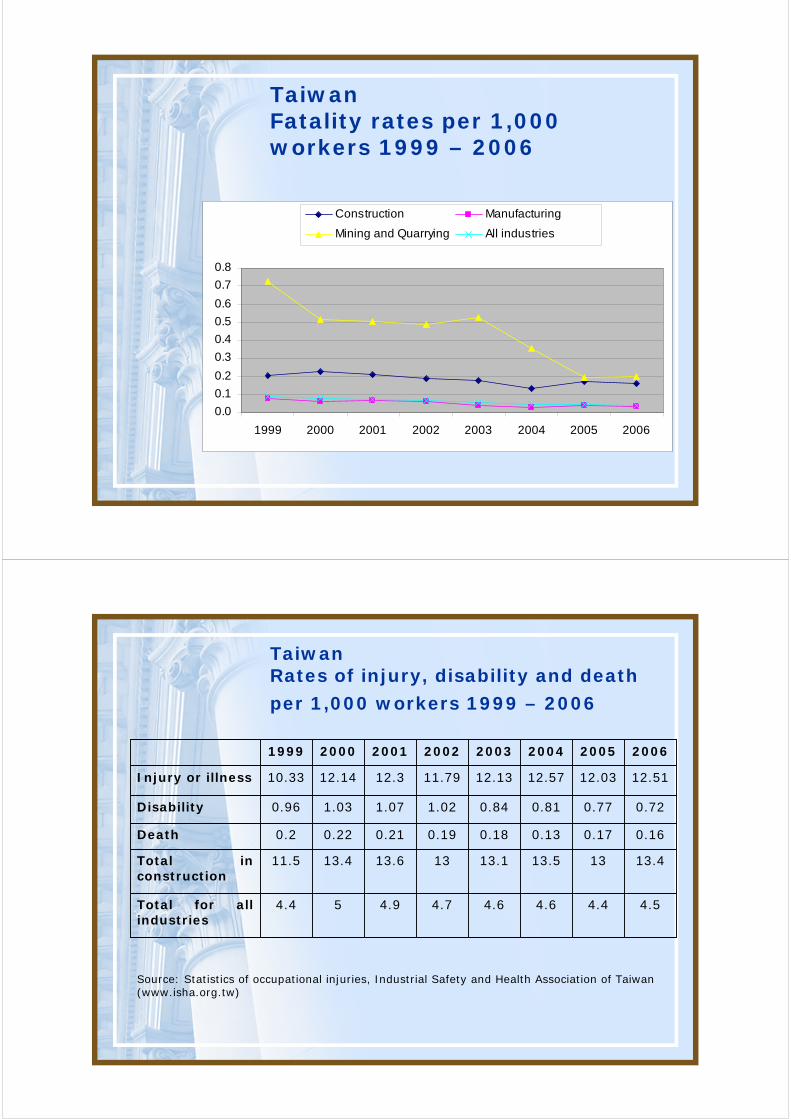
TaiwanRates of injury, disability and death
per 1,000 workers 1999 – 2006
4.54.44.64.64.74.954.4Total for all industries
13.41313.513.11313.613.411.5Total in construction
0.160.170.130.180.190.210.220.2Death
0.720.770.810.841.021.071.030.96Disability
12.5112.0312.5712.1311.7912.312.1410.33Injury or illness
20062005200420032002200120001999
Source: Statistics of occupational injuries, Industrial Safety and Health Association of Taiwan (www.isha.org.tw)
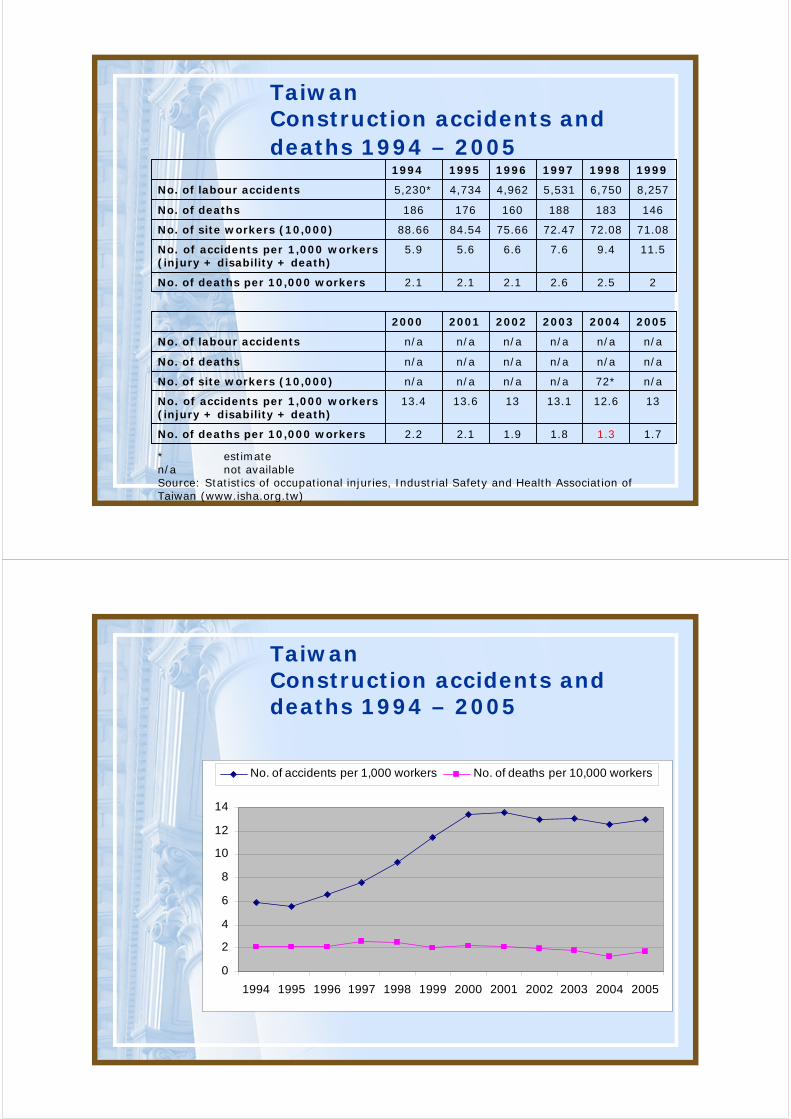
TaiwanConstruction accidents and deaths 1994 – 2005
1.71.31.81.92.12.2No. of deaths per 10,000 workers
1312.613.11313.613.4No. of accidents per 1,000 workers (injury + disability + death)
n/a72*n/an/an/an/aNo. of site workers (10,000)
n/an/an/an/an/an/aNo. of deaths
n/an/an/an/an/an/aNo. of labour accidents
200520042003200220012000
22.52.62.12.12.1No. of deaths per 10,000 workers
11.59.47.66.65.65.9No. of accidents per 1,000 workers (injury + disability + death)
71.0872.0872.4775.6684.5488.66No. of site workers (10,000)
146183188160176186No. of deaths
8,2576,7505,5314,9624,7345,230*No. of labour accidents
199919981997199619951994
* estimaten/a not availableSource: Statistics of occupational injuries, Industrial Safety and Health Association of Taiwan (www.isha.org.tw)
TaiwanConstruction accidents and deaths 1994 – 2005
0
2
4
6
8
10
12
14
1994 1995 1996 1997 1998 1999 2000 2001 2002 2003 2004 2005
No. of accidents per 1,000 workers No. of deaths per 10,000 workers
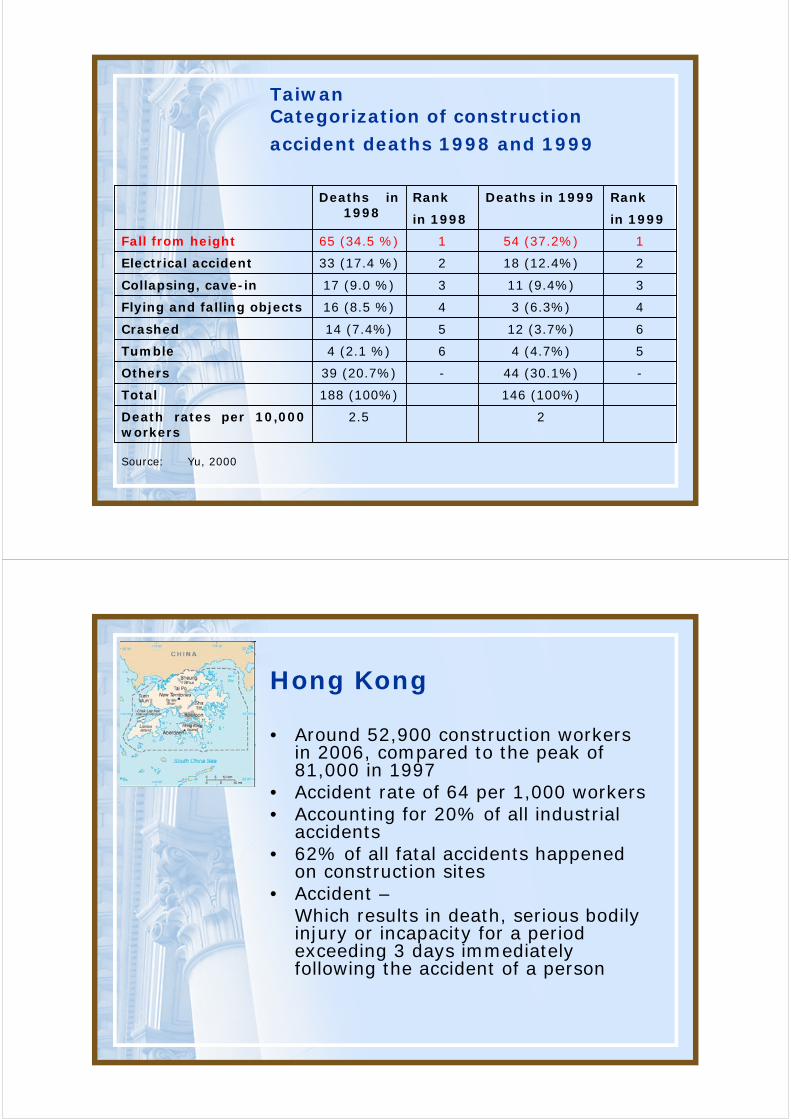
TaiwanCategorization of construction
accident deaths 1998 and 1999
22.5Death rates per 10,000 workers
146 (100%)188 (100%)Total
-44 (30.1%)-39 (20.7%)Others
54 (4.7%)64 (2.1 %)Tumble
612 (3.7%)514 (7.4%)Crashed
43 (6.3%)416 (8.5 %)Flying and falling objects
311 (9.4%)317 (9.0 %)Collapsing, cave-in
218 (12.4%)233 (17.4 %)Electrical accident
154 (37.2%)165 (34.5 %)Fall from height
in 1999in 1998
Rank Deaths in 1999Rank Deaths in 1998
Source: Yu, 2000
Hong Kong
• Around 52,900 construction workers in 2006, compared to the peak of 81,000 in 1997
• Accident rate of 64 per 1,000 workers• Accounting for 20% of all industrial
accidents• 62% of all fatal accidents happened
on construction sites• Accident –
Which results in death, serious bodily injury or incapacity for a period exceeding 3 days immediately following the accident of a person
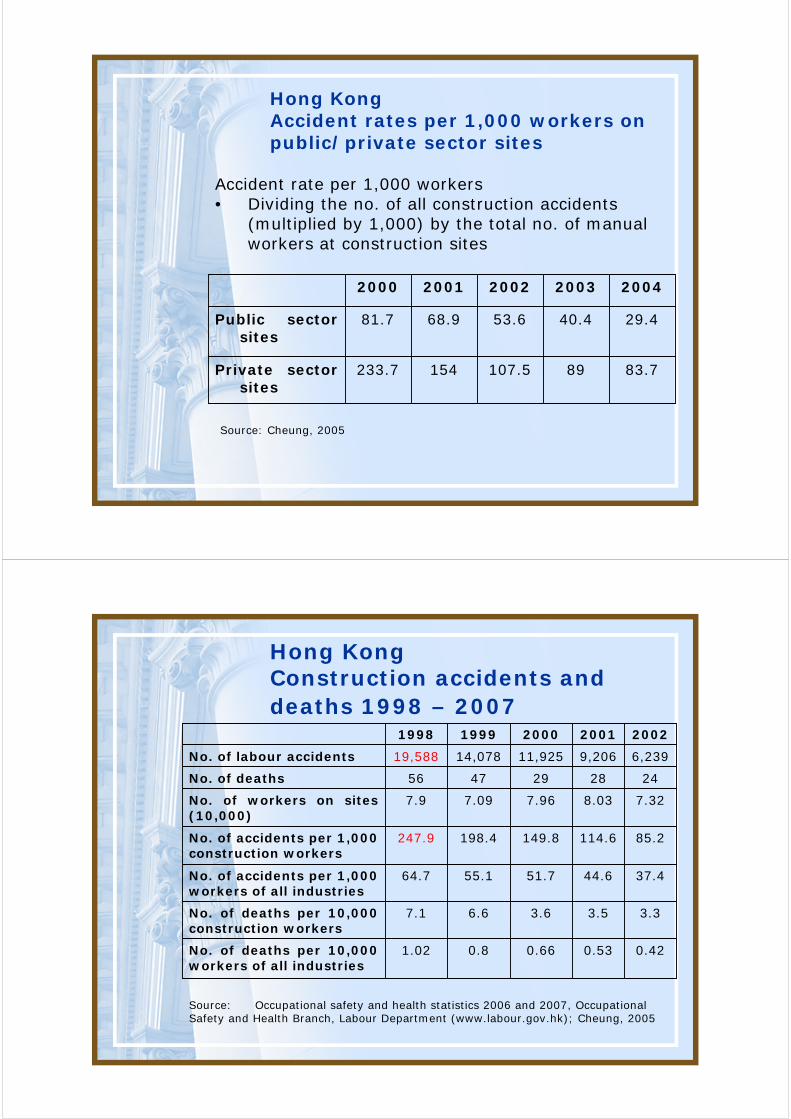
Hong KongAccident rates per 1,000 workers on public/private sector sites
83.789107.5154233.7Private sector sites
29.440.453.668.981.7Public sector sites
20042003200220012000
Source: Cheung, 2005
Accident rate per 1,000 workers• Dividing the no. of all construction accidents
(multiplied by 1,000) by the total no. of manual workers at construction sites
Hong KongConstruction accidents and deaths 1998 – 2007
0.420.530.660.81.02No. of deaths per 10,000 workers of all industries
3.33.53.66.67.1No. of deaths per 10,000 construction workers
37.444.651.755.164.7No. of accidents per 1,000 workers of all industries
85.2114.6149.8198.4247.9No. of accidents per 1,000 construction workers
7.328.037.967.097.9No. of workers on sites (10,000)
2428294756No. of deaths
6,2399,20611,92514,07819,588No. of labour accidents
20022001200019991998
Source: Occupational safety and health statistics 2006 and 2007, Occupational Safety and Health Branch, Labour Department (www.labour.gov.hk); Cheung, 2005
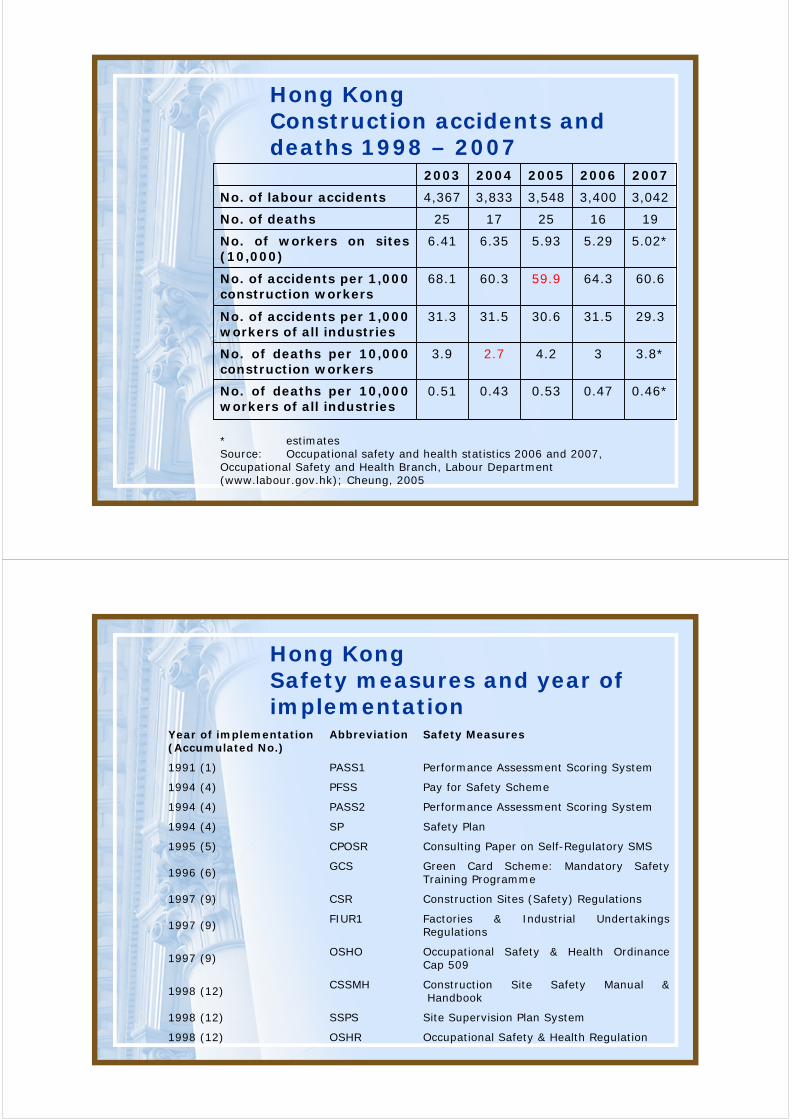
Hong KongConstruction accidents and deaths 1998 – 2007
0.46*0.470.530.430.51No. of deaths per 10,000 workers of all industries
3.8*34.22.73.9No. of deaths per 10,000 construction workers
29.331.530.631.531.3No. of accidents per 1,000 workers of all industries
60.664.359.960.368.1No. of accidents per 1,000 construction workers
5.02*5.295.936.356.41No. of workers on sites (10,000)
1916251725No. of deaths
3,0423,4003,5483,8334,367No. of labour accidents
20072006200520042003
* estimatesSource: Occupational safety and health statistics 2006 and 2007, Occupational Safety and Health Branch, Labour Department (www.labour.gov.hk); Cheung, 2005
Hong KongSafety measures and year of implementation
Occupational Safety & Health RegulationOSHR1998 (12)
Site Supervision Plan SystemSSPS1998 (12)
Construction Site Safety Manual & Handbook
CSSMH1998 (12)
Occupational Safety & Health Ordinance Cap 509
OSHO1997 (9)
Factories & Industrial Undertakings Regulations
FIUR11997 (9)
Construction Sites (Safety) RegulationsCSR1997 (9)
Green Card Scheme: Mandatory Safety Training Programme
GCS1996 (6)
Consulting Paper on Self-Regulatory SMSCPOSR1995 (5)
Safety PlanSP1994 (4)
Performance Assessment Scoring SystemPASS21994 (4)
Pay for Safety SchemePFSS1994 (4)
Performance Assessment Scoring SystemPASS11991 (1)
Safety MeasuresAbbreviationYear of implementation (Accumulated No.)
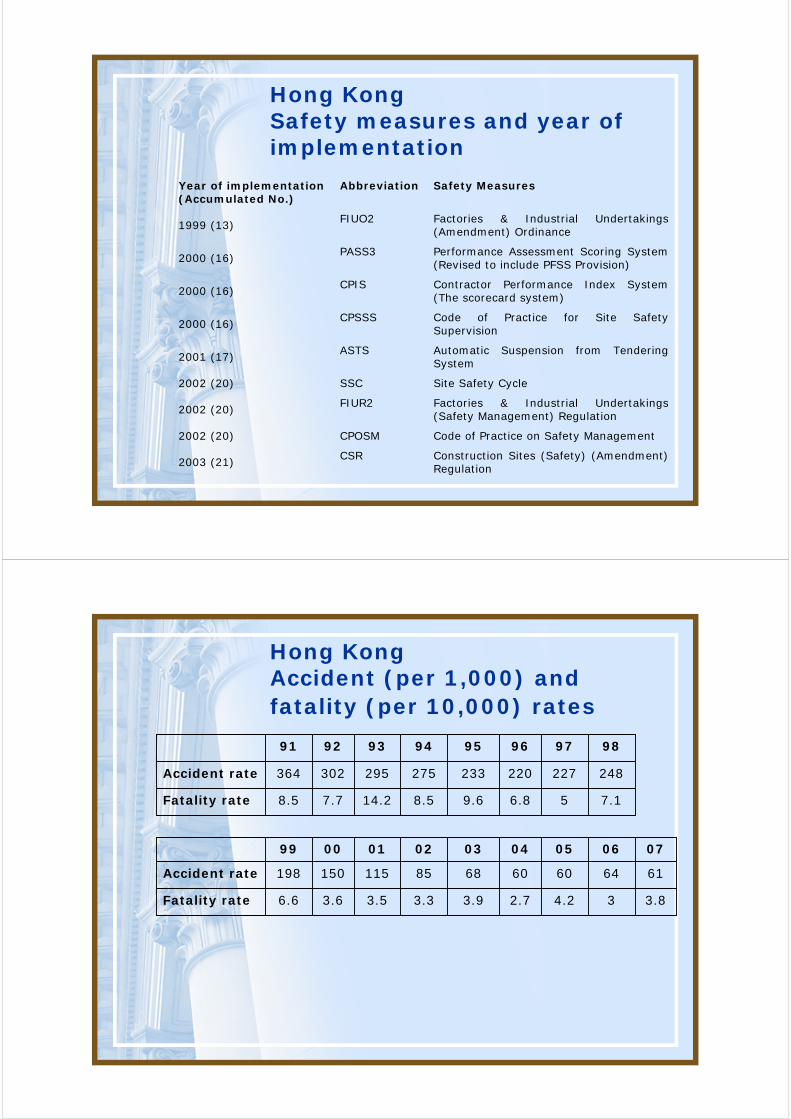
Hong KongSafety measures and year of implementation
Construction Sites (Safety) (Amendment) Regulation
CSR2003 (21)
Code of Practice on Safety ManagementCPOSM2002 (20)
Factories & Industrial Undertakings (Safety Management) Regulation
FIUR22002 (20)
Site Safety CycleSSC2002 (20)
Automatic Suspension from Tendering System
ASTS2001 (17)
Code of Practice for Site Safety Supervision
CPSSS2000 (16)
Contractor Performance Index System (The scorecard system)
CPIS2000 (16)
Performance Assessment Scoring System (Revised to include PFSS Provision)
PASS32000 (16)
Factories & Industrial Undertakings (Amendment) Ordinance
FIUO21999 (13)
Safety MeasuresAbbreviationYear of implementation (Accumulated No.)
Hong KongAccident (per 1,000) and fatality (per 10,000) rates
3.834.22.73.93.33.53.66.6Fatality rate
616460606885115150198Accident rate
070605040302010099
7.156.89.68.514.27.78.5Fatality rate
248227220233275295302364Accident rate
9897969594939291
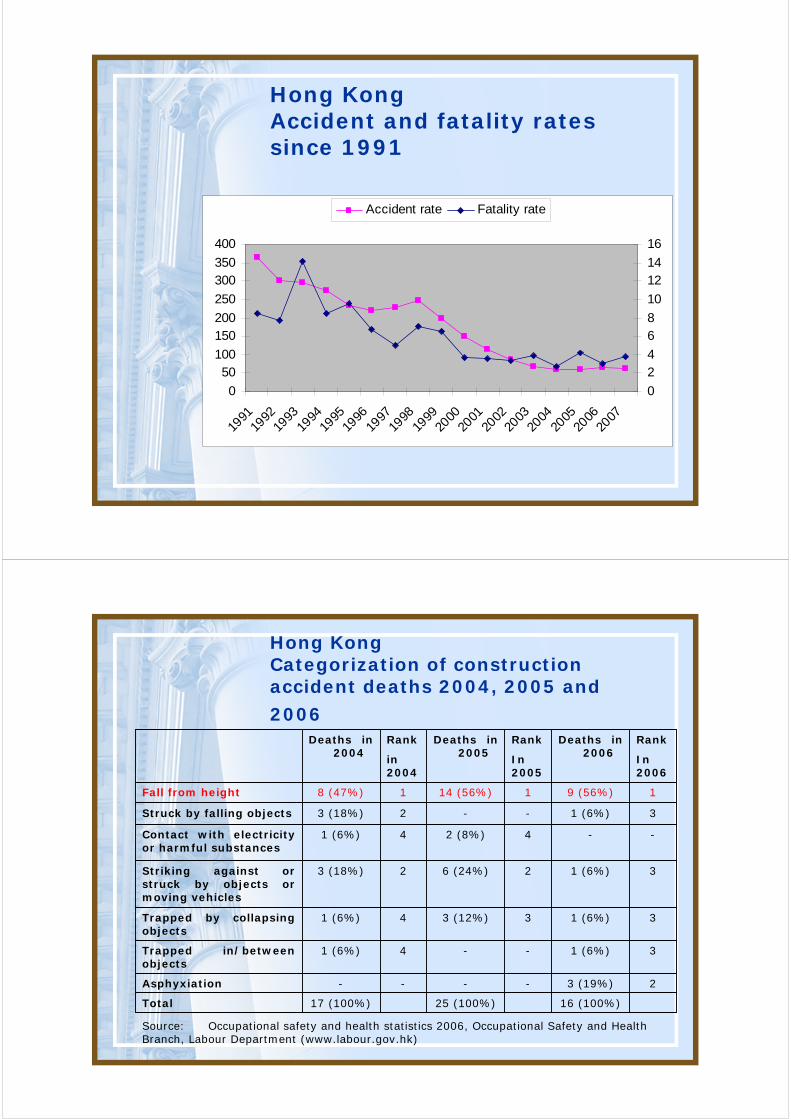
Hong KongAccident and fatality rates since 1991
0
50100
150200
250
300350
400
1991
1992
1993
1994
1995
1996
1997
1998
1999
2000
2001
2002
2003
2004
2005
2006
2007
0
24
68
10
1214
16
Accident rate Fatality rate
Hong KongCategorization of construction accident deaths 2004, 2005 and
2006
16 (100%)25 (100%)17 (100%)Total
23 (19%)----Asphyxiation
31 (6%)--41 (6%)Trapped in/between objects
31 (6%)33 (12%)41 (6%)Trapped by collapsing objects
31 (6%) 26 (24%) 23 (18%)Striking against or struck by objects or moving vehicles
--42 (8%)41 (6%)Contact with electricity or harmful substances
31 (6%)--23 (18%)Struck by falling objects
19 (56%)114 (56%)18 (47%) Fall from height
In2006
In2005
in 2004
Rank Deaths in 2006
Rank Deaths in 2005
Rank Deaths in 2004
Source: Occupational safety and health statistics 2006, Occupational Safety and Health Branch, Labour Department (www.labour.gov.hk)
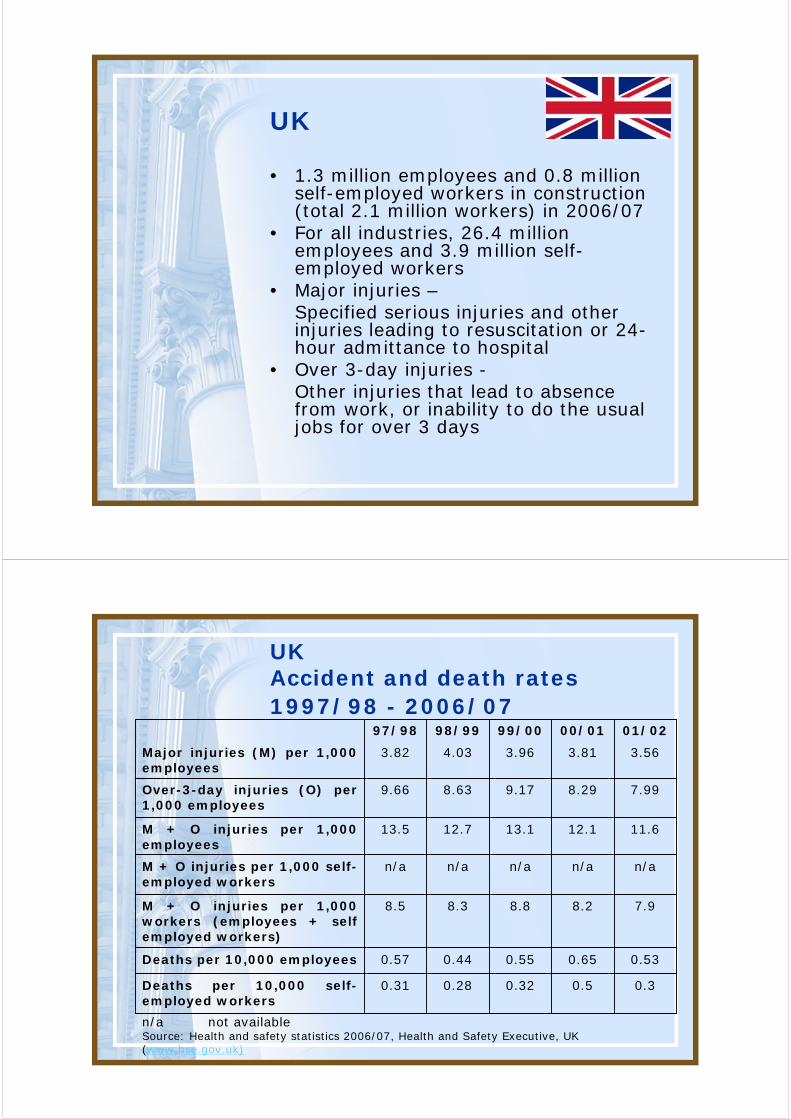
UK
• 1.3 million employees and 0.8 million self-employed workers in construction (total 2.1 million workers) in 2006/07
• For all industries, 26.4 million employees and 3.9 million self-employed workers
• Major injuries –Specified serious injuries and other injuries leading to resuscitation or 24-hour admittance to hospital
• Over 3-day injuries -Other injuries that lead to absence from work, or inability to do the usual jobs for over 3 days
UKAccident and death rates 1997/98 - 2006/07
0.30.50.320.280.31Deaths per 10,000 self-employed workers
0.530.650.550.440.57Deaths per 10,000 employees
7.98.28.88.38.5M + O injuries per 1,000 workers (employees + self employed workers)
n/an/an/an/an/aM + O injuries per 1,000 self-employed workers
11.612.113.112.713.5M + O injuries per 1,000 employees
7.998.299.178.639.66Over-3-day injuries (O) per 1,000 employees
3.563.813.964.033.82Major injuries (M) per 1,000 employees
01/0200/0199/0098/9997/98
n/a not availableSource: Health and safety statistics 2006/07, Health and Safety Executive, UK (www.hse.gov.uk)
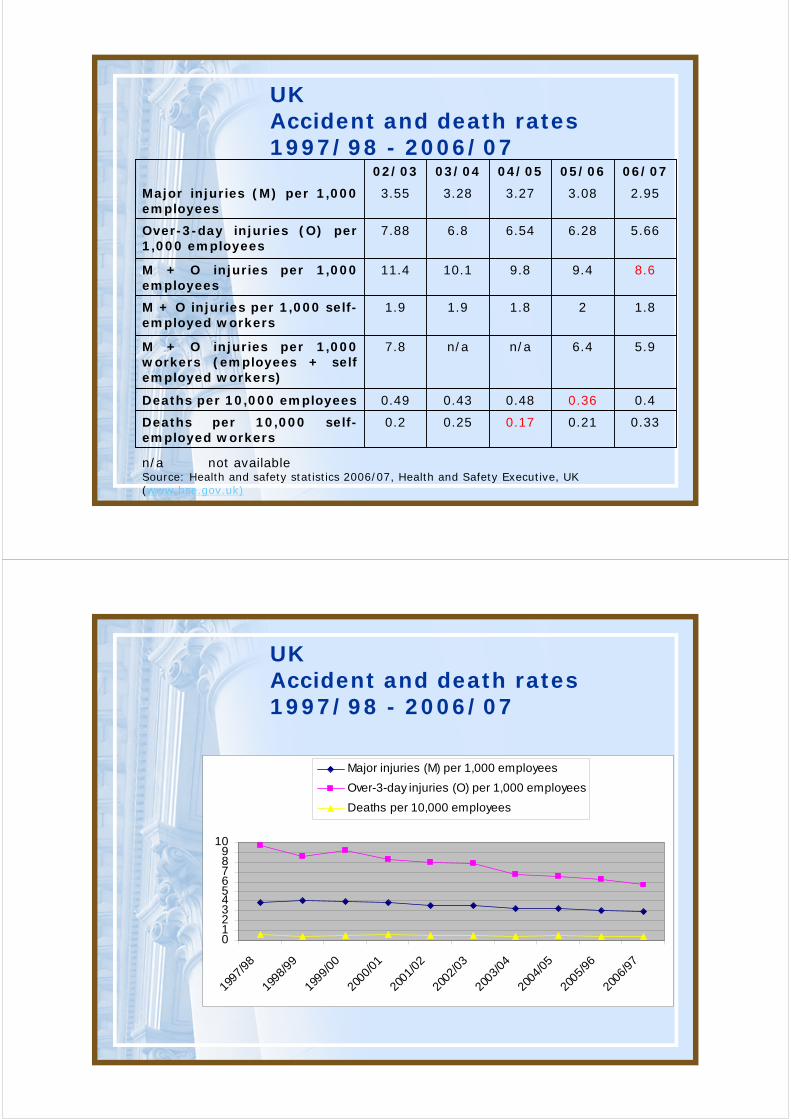
UKAccident and death rates 1997/98 - 2006/07
0.330.210.170.250.2Deaths per 10,000 self-employed workers
0.40.360.480.430.49Deaths per 10,000 employees
5.96.4n/an/a7.8M + O injuries per 1,000 workers (employees + self employed workers)
1.821.81.91.9M + O injuries per 1,000 self-employed workers
8.69.49.810.111.4M + O injuries per 1,000 employees
5.666.286.546.87.88Over-3-day injuries (O) per 1,000 employees
2.953.083.273.283.55Major injuries (M) per 1,000 employees
06/0705/0604/0503/0402/03
n/a not availableSource: Health and safety statistics 2006/07, Health and Safety Executive, UK (www.hse.gov.uk)
UKAccident and death rates 1997/98 - 2006/07
0123456789
10
1997
/98
1998
/99
1999
/00
2000
/01
2001
/02
2002
/03
2003
/04
2004
/05
2005
/96
2006
/97
Major injuries (M) per 1,000 employees
Over-3-day injuries (O) per 1,000 employees
Deaths per 10,000 employees
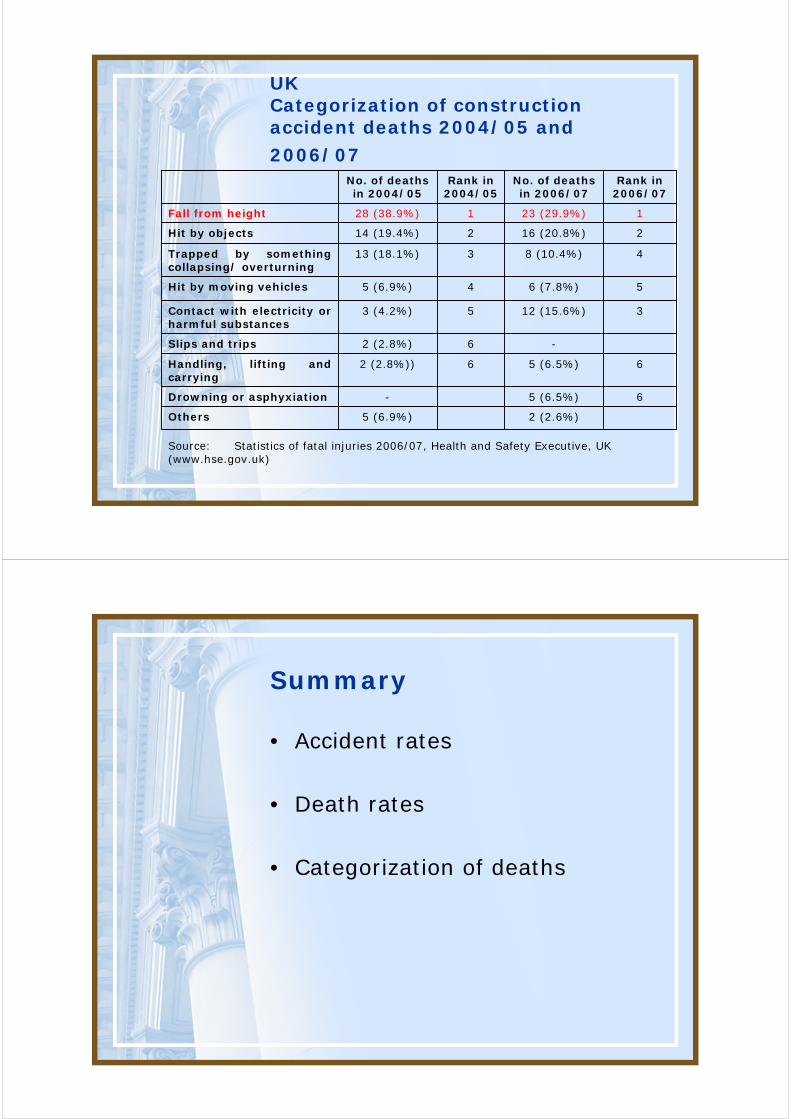
UKCategorization of construction accident deaths 2004/05 and
2006/07
Total72 (100%)77 (100%)
2 (2.6%)5 (6.9%)Others
65 (6.5%)-Drowning or asphyxiation
65 (6.5%)62 (2.8%))Handling, lifting and carrying
-62 (2.8%)Slips and trips
312 (15.6%)53 (4.2%)Contact with electricity or harmful substances
56 (7.8%)45 (6.9%)Hit by moving vehicles
48 (10.4%)313 (18.1%)Trapped by something collapsing/ overturning
216 (20.8%)214 (19.4%)Hit by objects
123 (29.9%)128 (38.9%)Fall from height
Rank in 2006/07
No. of deaths in 2006/07
Rank in 2004/05
No. of deaths in 2004/05
Source: Statistics of fatal injuries 2006/07, Health and Safety Executive, UK (www.hse.gov.uk)
Summary
• Accident rates
• Death rates
• Categorization of deaths
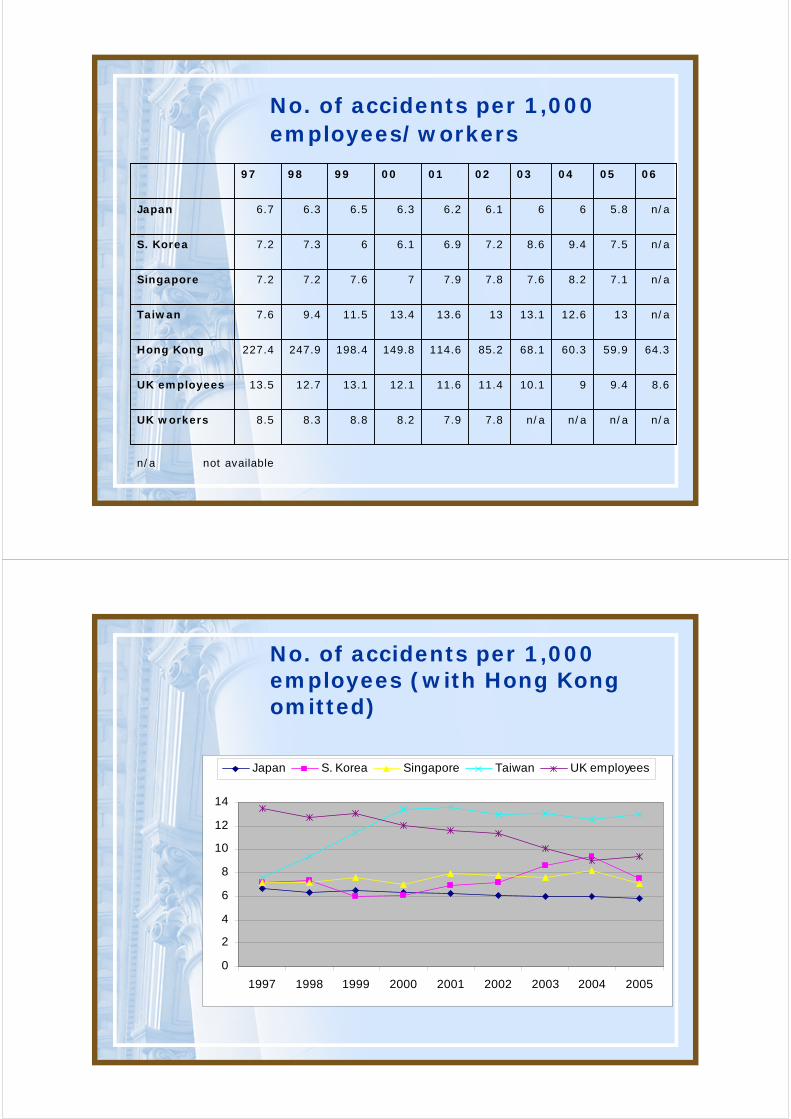
No. of accidents per 1,000 employees/workers
n/an/an/an/a7.87.98.28.88.38.5UK workers
8.69.4910.111.411.612.113.112.713.5UK employees
64.359.960.368.185.2114.6149.8198.4247.9227.4Hong Kong
n/a1312.613.11313.613.411.59.47.6Taiwan
n/a7.18.27.67.87.977.67.27.2Singapore
n/a7.59.48.67.26.96.167.37.2S. Korea
n/a5.8666.16.26.36.56.36.7Japan
06050403020100999897
n/a not available
No. of accidents per 1,000 employees (with Hong Kong omitted)
0
2
4
6
8
10
12
14
1997 1998 1999 2000 2001 2002 2003 2004 2005
Japan S. Korea Singapore Taiwan UK employees
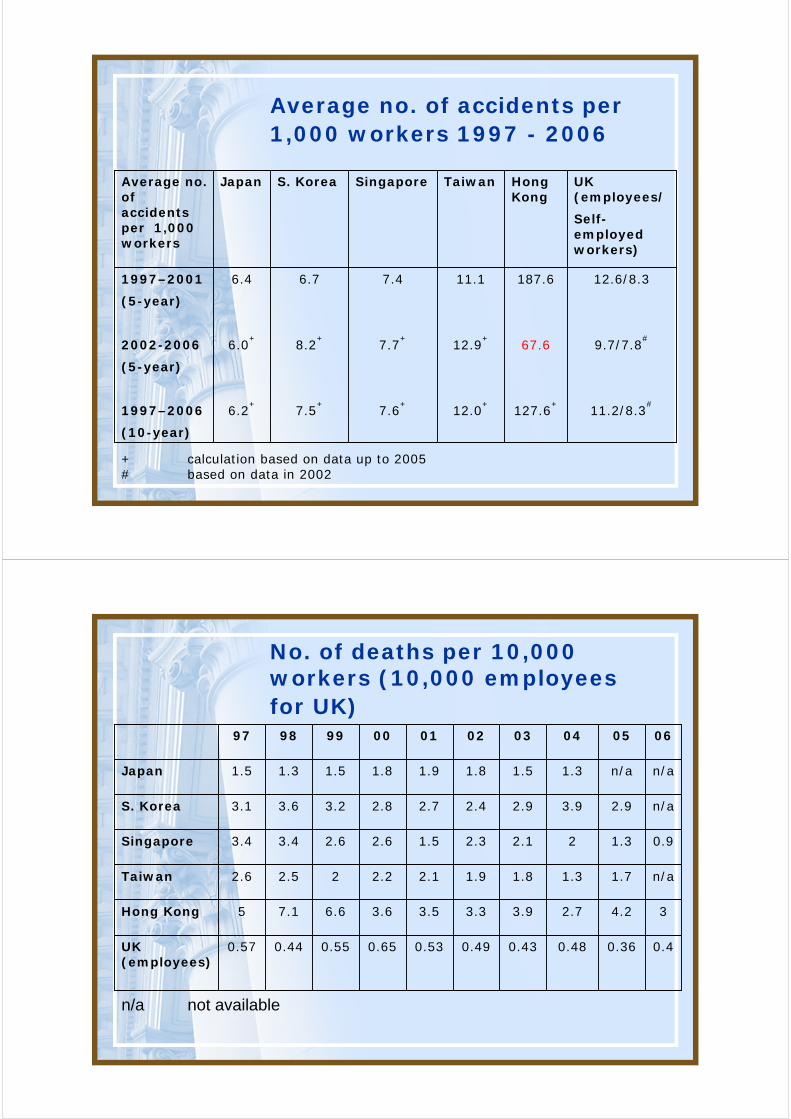
Average no. of accidents per 1,000 workers 1997 - 2006
(10-year)
11.2/8.3#
127.6+
12.0+
7.6+
7.5+
6.2+
1997–2006
(5-year)
9.7/7.8#
67.612.9+
7.7+
8.2+
6.0+
2002-2006
(5-year)
12.6/8.3187.611.17.46.76.41997–2001
Self-employed workers)
UK (employees/
Hong Kong
Taiwan Singapore S. Korea Japan Average no. of accidents per 1,000 workers
+ calculation based on data up to 2005# based on data in 2002
No. of deaths per 10,000 workers (10,000 employees for UK)
0.40.360.480.430.490.530.650.550.440.57UK (employees)
34.22.73.93.33.53.66.67.15Hong Kong
n/a1.71.31.81.92.12.222.52.6Taiwan
0.91.322.12.31.52.62.63.43.4Singapore
n/a2.93.92.92.42.72.83.23.63.1S. Korea
n/an/a1.31.51.81.91.81.51.31.5Japan
06050403020100999897
n/a not available
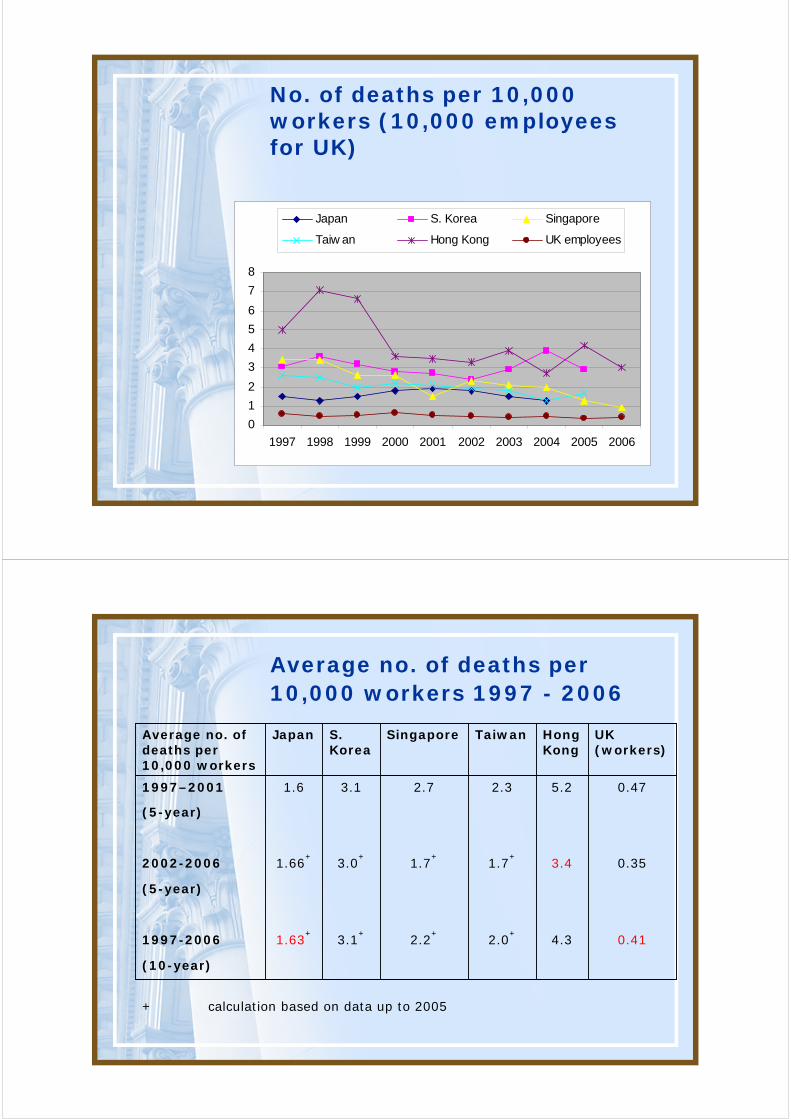
No. of deaths per 10,000 workers (10,000 employees for UK)
0
1
2
3
4
5
6
7
8
1997 1998 1999 2000 2001 2002 2003 2004 2005 2006
Japan S. Korea Singapore
Taiw an Hong Kong UK employees
Average no. of deaths per 10,000 workers 1997 - 2006
(10-year)
0.414.32.0+
2.2+
3.1+
1.63+
1997-2006
(5-year)
0.353.41.7+
1.7+
3.0+
1.66+
2002-2006
(5-year)
0.475.22.32.73.11.61997–2001
UK (workers)
Hong Kong
Taiwan Singapore S. Korea
Japan Average no. of deaths per 10,000 workers
+ calculation based on data up to 2005
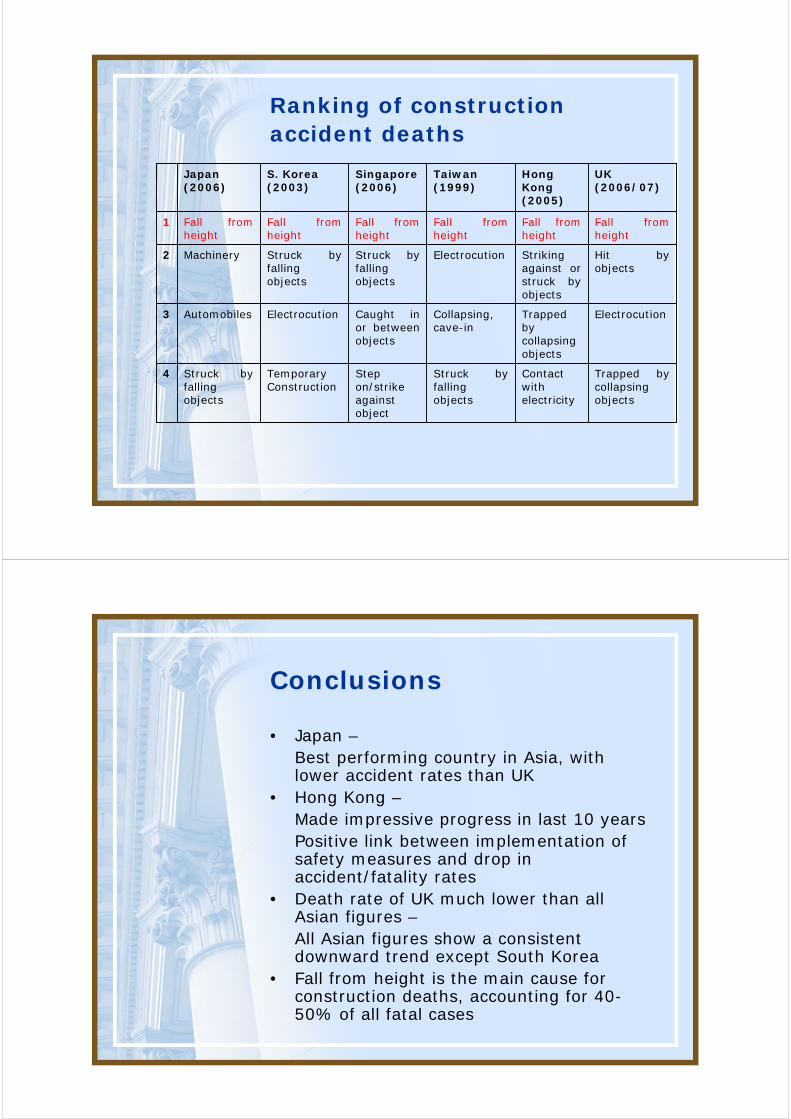
Ranking of construction accident deaths
Trapped by collapsing objects
Contact with electricity
Struck by falling objects
Step on/strike against object
Temporary Construction
Struck by falling objects
4
ElectrocutionTrapped by collapsing objects
Collapsing, cave-in
Caught in or between objects
ElectrocutionAutomobiles3
Hit by objects
Striking against or struck by objects
Electrocution Struck by falling objects
Struck by falling objects
Machinery2
Fall from height
Fall from height
Fall from height
Fall from height
Fall from height
Fall from height
1
UK (2006/07)
Hong Kong (2005)
Taiwan (1999)
Singapore (2006)
S. Korea (2003)
Japan (2006)
Conclusions
• Japan –Best performing country in Asia, with lower accident rates than UK
• Hong Kong –Made impressive progress in last 10 yearsPositive link between implementation of safety measures and drop in accident/fatality rates
• Death rate of UK much lower than all Asian figures –All Asian figures show a consistent downward trend except South Korea
• Fall from height is the main cause for construction deaths, accounting for 40-50% of all fatal cases
Reference:
Management and Economics of Construction Safety in Hong Kong
By S.W. Poon, S.L. Tang and Francis Wong
Hong Kong University Press1st Edition 2008
Thank you very much