Constraints on the partitioning of K«lauea s lavas
18
RESEARCH ARTICLE Constraints on the partitioning of Kīlauea’ s lavas between surface and tube flows, estimated from infrared satellite data, sulfur dioxide emission rates, and field observations W. C. Koeppen & M. Patrick & T. Orr & A. J. Sutton & D. Dow & R. Wright Received: 17 December 2012 / Accepted: 4 April 2013 # Springer-Verlag Berlin Heidelberg 2013 Abstract This paper describes how observations of sulfur dioxide (SO 2 ) degassing rates (obtained in situ), thermal emission rates (obtained from infrared satellite data), and semiquantitative flow field observations can be used to elucidate the partitioning of lava between the surface and tube systems at Kīlauea volcano, Hawai’i, over a decadal timescale. For most of our study period, 2000 to 2009, we found that the infrared spectral radiance measured by Moderate Resolution Imaging Spectroradiometer from the flow field under clear-sky conditions is controlled by the lava effusion rate and the amount of flow accommodated by the subsurface tube system. At Kīlauea, the degree of tubing is estimated qualitatively using field observations, and we show that the satellite data and in situ gas data can be used to estimate the percentage of lava on the surface relative to the total amount erupted. This empirical relationship works to describe many cases in the past decade at Kīlauea but breaks down when there is a lack of concurrent clear-sky radiance and SO 2 data or when magma is being stored and degassed prior to eruption. Our observations provide a sim- ple way to estimate the partitioning of Kīlauea’ s total lava supply between surface and tube-fed flows using a long- term dataset. This is important because the transition be- tween periods when lava is distributed primarily by surface flows to periods where tubes dominate has been suggested to indicate significant changes in the character of decadal- scale eruptions at Kīlauea (Heliker et al., Bull Volcanol 59:381–393, 1998). In addition, it is during those times when surface flows predominate that the flow field does most of its lateral expansion and the hazards associated with the lava effusion become more pronounced. Keywords Sulfur dioxide degassing rates . Thermal emission rates . Semiquantitative flow field observations . Kīlauea volcano . Surface and tube flows Introduction Kīlauea volcano is one of the most active and best studied volcanoes on Earth, and its current eruption centered on the east rift zone (ERZ) has been ongoing for over 29 years (Fig. 1; Heliker and Mattox 2003; Kauahikaua 2007). The eruption has been characterized by persistent emplacement of lava flows for most of its history, and tracking the rate of this discharge has been fundamental to monitoring activity levels of the volcano (Sutton et al. 2003). During typical flow field activity, magma supplied at the vent is distributed between surface flows and lava tubes (Kauahikaua et al. 2003). The transition between periods when lava is distrib- uted primarily by surface flows to a regime where most lava is confined to the tube system has been suggested as being indicative of significant changes in the character of such long term (i.e., decadal timescale) eruptions (Heliker et al. Editorial responsibility: S. Calvari W. C. Koeppen Earth and Ecological Science Institute, 1 University Place, Orono, ME 04473, USA M. Patrick : T. Orr : A. J. Sutton : D. Dow USGS Hawaiian Volcano Observatory, Hawai‘i Volcanoes National Park, Hawaii, HI 96718, USA R. Wright (*) Hawai‘i Institute of Geophysics and Planetology, University of Hawai‘i at Mānoa, Honolulu, HI 96822, USA e-mail: [email protected] Bull Volcanol (2013) 75:716 DOI 10.1007/s00445-013-0716-3
Transcript of Constraints on the partitioning of K«lauea s lavas

RESEARCH ARTICLE
Constraints on the partitioning of Kīlauea’s lavasbetween surface and tube flows, estimated from infraredsatellite data, sulfur dioxide emission rates, and fieldobservations
W. C. Koeppen & M. Patrick & T. Orr & A. J. Sutton &
D. Dow & R. Wright
Received: 17 December 2012 /Accepted: 4 April 2013# Springer-Verlag Berlin Heidelberg 2013
Abstract This paper describes how observations of sulfurdioxide (SO2) degassing rates (obtained in situ), thermalemission rates (obtained from infrared satellite data), andsemiquantitative flow field observations can be used toelucidate the partitioning of lava between the surface andtube systems at Kīlauea volcano, Hawai’i, over a decadaltimescale. For most of our study period, 2000 to 2009, wefound that the infrared spectral radiance measured byModerate Resolution Imaging Spectroradiometer from theflow field under clear-sky conditions is controlled by thelava effusion rate and the amount of flow accommodated bythe subsurface tube system. At Kīlauea, the degree of tubingis estimated qualitatively using field observations, and weshow that the satellite data and in situ gas data can be usedto estimate the percentage of lava on the surface relative tothe total amount erupted. This empirical relationship worksto describe many cases in the past decade at Kīlauea butbreaks down when there is a lack of concurrent clear-skyradiance and SO2 data or when magma is being stored anddegassed prior to eruption. Our observations provide a sim-ple way to estimate the partitioning of Kīlauea’s total lava
supply between surface and tube-fed flows using a long-term dataset. This is important because the transition be-tween periods when lava is distributed primarily by surfaceflows to periods where tubes dominate has been suggestedto indicate significant changes in the character of decadal-scale eruptions at Kīlauea (Heliker et al., Bull Volcanol59:381–393, 1998). In addition, it is during those timeswhen surface flows predominate that the flow field doesmost of its lateral expansion and the hazards associated withthe lava effusion become more pronounced.
Keywords Sulfur dioxide degassing rates . Thermalemission rates . Semiquantitative flow field observations .
Kīlauea volcano . Surface and tube flows
Introduction
Kīlauea volcano is one of the most active and best studiedvolcanoes on Earth, and its current eruption centered on theeast rift zone (ERZ) has been ongoing for over 29 years(Fig. 1; Heliker and Mattox 2003; Kauahikaua 2007). Theeruption has been characterized by persistent emplacementof lava flows for most of its history, and tracking the rate ofthis discharge has been fundamental to monitoring activitylevels of the volcano (Sutton et al. 2003). During typicalflow field activity, magma supplied at the vent is distributedbetween surface flows and lava tubes (Kauahikaua et al.2003). The transition between periods when lava is distrib-uted primarily by surface flows to a regime where most lavais confined to the tube system has been suggested as beingindicative of significant changes in the character of suchlong term (i.e., decadal timescale) eruptions (Heliker et al.
Editorial responsibility: S. Calvari
W. C. KoeppenEarth and Ecological Science Institute, 1 University Place,Orono, ME 04473, USA
M. Patrick : T. Orr :A. J. Sutton :D. DowUSGS Hawaiian Volcano Observatory, Hawai‘i VolcanoesNational Park, Hawaii, HI 96718, USA
R. Wright (*)Hawai‘i Institute of Geophysics and Planetology,University of Hawai‘i at Mānoa, Honolulu, HI 96822, USAe-mail: [email protected]
Bull Volcanol (2013) 75:716DOI 10.1007/s00445-013-0716-3

1998). In their study, Heliker et al. (1998) define periodswhen lava is distributed predominantly by long-lived tubesas periods of stability during which lava is delivered fromthe vent to the ocean entry with few surface breakouts.Periods of instability are caused by variations in effusionrate, which result in pauses and surges in the amount of lavaavailable for flow field transmission (Cervelli and Miklius2003). Surges in lava effusion can overwhelm the carryingcapacity of the lava tube, resulting in surface breakouts,particularly at points predisposed to formation of hydraulicjumps (Orr 2011). It is during these phases of instabilitywhen surface flows dominate that the Kīlauea flow fielddoes most of its lateral expansion. As such, recognizingthe transition between the stable and unstable phases hasimplications for evaluating lava flow hazards in this geo-graphic area (Heliker et al. 1998). Although sulfur dioxide(SO2) emission measurements provide a reliable way toestimate the total amount of magma available to be erupted(Sutton et al. 2003), characterizing the proportion of thiswhich is emplaced as surface flows or via lava tubes, whichmay be the ultimate expression of the shift between stableand unstable regimes, is typically subjective and qualitative.
Here, we present data that describe how thermal fluxfrom Kīlauea’s ERZ (obtained from infrared remotesensing data acquired by the National Aeronautics andSpace Administration [NASA] Terra and Aqua ModerateResolution Imaging Spectroradiometer [MODIS] sensors)and SO2 emission rates (determined in situ via solar occulta-tion methods) have varied between 2000 and 2009. We thencompare these datasets with field observations that describethe relative importance of tube-fed flows and surface flows todetermine the extent to which the partitioning of lava betweenthe surface and tube systems can be quantified using informa-tion extracted from these two routinely acquired datasets.Infrared satellite radiance data have been shown to providereasonable estimates of time-averaged effusion rate (Wright etal. 2001; Harris et al. 2007), but the satellite sensor will only“see” active lava on the surface of the flow field (lava trans-mitted by tubes being hidden from the sensor). By comparingthe satellite radiance (indicative of surface flows) to the SO2
emission (indicative of the total amount of lava degassed atshallow levels), we can gauge the relative supply of lava to thetube system and surface flows. Our work shows that the SO2
emission rates scale relatively well with emitted radiance
Fig. 1 Locationmaps showingKīlauea’s ERZ flow field and the locationof flows erupted from 1983 to 2009 covering Kīlauea’s east rift zone(ERZ) and southwest rift zone (SWRZ). Inset shows the southeast portion
of Hawai’i Island (yellow dotted box shows the extent of inset window),and the current flow field is shown in pink in the inset box. The flow fieldunits shown on the main map are colored by age
716, Page 2 of 18 Bull Volcanol (2013) 75:716
during periods dominated by surface flows, but these param-eters decouple during periods when lava is predominantlycarried by tubes, confirming that at-sensor radiance is con-trolled both by effusion rate and flow style (tube vs. surface) ina sensible manner. Overall, the combined analysis of thermalremote sensing data and field-based SO2 fluxes providessemiquantitative constraints on the emplacement styles atKīlauea volcano, with these variables being coupled duringperiods when surface flows are predominant, but decoupledwhen they are not.
Overview of activity at Kīlauea volcano for the period2000–2009
Eruption summary
The Pu‘u ‘Ō‘ō–Kupaianaha eruption, in Kīlauea’s ERZ, be-gan in January 1983 (Fig. 1). The first 3 years of the eruptionwere characterized by a series of episodic fountaining eventsthat constructed the Pu‘u ‘Ō‘ō cone and fed short-lived, high-volume channelized flows that buried the surrounding terrain(Wolfe et al. 1988; Heliker et al. 2003). In 1986, eruptiveactivity shifted 3 km downrift, and episodic lava fountainingwas replaced by relatively steady, sustained effusion that builtthe Kupaianaha lava shield (Kauahikaua et al. 1996; Helikerand Mattox 2003). The nearly continuous effusion led to theformation of a broad tube-fed pāhoehoe flow field thatreached the ocean and destroyed the village of Kalapana in1990 (Fig. 1; Mattox et al. 1993; Hon et al. 1994). TheKupaianaha vent was abandoned in 1992 as activity shiftedback to Pu‘u ‘Ō‘ō (Kauahikaua et al. 1996), and relativelysteady effusion from vents on the west and southwest flanks ofthe cone (Heliker et al. 1998; Heliker and Mattox 2003)persisted until 2007. The nearly continuous activity wasinterrupted several times by intrusions, such as those in 1993and 1997 (Heliker et al. 1998; Thornber et al. 2003), whichbriefly robbed magma from the Pu‘u ‘Ō‘ō reservoir, causingthe crater floor to collapse. Following another intrusion andcrater collapse in June 2007, new fissures opened up betweenPu‘u ‘Ō‘ō and Kupaianaha (Poland et al. 2008) in July 2007,eventually focusing on the easternmost fissure. After sendingflows northeast initially, the Fissure D vent, as it was called,stabilized in late 2007 with a switch in flow direction towardthe south (Fig. 1). These flows reached the ocean in March2008, adding to the already vast tube-fed flow field andremained active for the rest of the study period.
2000–2009: detailed eruption chronology
Now, we examine the 2000–2009 period in detail. Theyear 2000 began with ongoing steady effusion from flankvents on the west side of Pu‘u ‘Ō‘ō cone. Lava fed directly
into tubes and was transported downslope to feed wide-spread surface flows and intermittent ocean entries. Thisactivity was the continuation of the reorganization of thelava tube system following an intrusion and eruptive pausein September 1999. On several occasions, breakouts fromthe tube system above the steep slope of the Pūlama Pali ledto an increase in surface activity, particularly during a surgein effusion in late September 2000. Surface activity slowedduring October–early December, but was rejuvenated inmid-December with new breakouts that continued into2001. With the prevalence of surface flows, ocean entryactivity was subdued during the first 5 months of 2001, withlava tubes reaching the sea only intermittently. After a briefsurge in output in May, surface activity declined duringJune–August 2001 but picked up slightly by Septemberand remained widespread through November.
In December 2001, activity shifted to the upper flowfield, above the Pūlama Pali, and began the construction ofa series of rootless shields in a process that lasted throughApril 2002. A large breakout—the Mother ’s Dayflow—began on May 12, 2002 on the west flank of Pu‘u‘Ō‘ō and widened the west margin of the flow field as lavamade its way quickly downslope to the ocean (Fig. 2a).After the initial downslope push, surface activity related tothe Mother’s Day flow declined in volume but remainedpresent into 2003. This relatively steady, moderate level ofsurface activity was interrupted by two surges in eruptiveoutput in 2003, on January 21 and August 9. Both events ledto large breakouts on the Mother’s Day flow field above thePūlama Pali that increased the level of surface activitytemporarily. The August increase began to fade in late2003, and the distal portion of the Mother’s Day tube systemwas abandoned as breakouts began to occur farther upslope.Rootless shields began to grow over the upper part of thetube system in a pattern much like that seen in late 2001–early 2002.
The dominance of the Mother’s Day tube system wasusurped in early 2004 by the Martin Luther King (MLK;started January 18) and the Prince Kūhiō Kalaiana‘ole(PKK; started March 20) breakouts on the southwest flankof Pu‘u ‘Ō‘ō (Fig. 2b). During this period, all activities wereconfined to the surface, and a branch of the Mother’s Dayflow began to creep downslope, reaching the ocean eventu-ally in late May. By August, the ocean entry had stoppedand surface activity related to the Mother’s Day flow beganto diminish. As it did so, the PKK flow began to ramp up,presaged by a surge in effusion in late July, and progres-sively hosted a greater level of surface activity. By lateSeptember, the PKK flow had captured the full effusionfrom Pu‘u ‘Ō‘ō, and a new tube system carrying lava fromthe PKK vent to the ocean was established by earlyNovember. The PKK flow was bolstered again in February2005 by another surge in output, resulting in an increase in
Bull Volcanol (2013) 75:716 Page 3 of 18, 716

surface activity that had begun to taper off by the end ofMarch. The level of surface activity declined slowly butsteadily through the remainder of 2005 as the PKK tubesystem became well established, and the first several monthsof 2006 were characterized by relatively steady flowthrough the tube to the ocean (Fig. 2b). Short-lived increasesin effusion built a series of shatter rings along the PKK tube(Orr 2011) eventually leading to the formation of a newbranch of the PKK tube system in May 2006. This newbreakout resulted in an increase in the level of surfaceactivity over the following several months as lava advancedslowly to the ocean. Comparatively benign surface activitycontinued on the flow field into the first half of 2007, with amoderate number of surface flows and several persistentocean entries.
Effusion from Pu‘u ‘Ō‘ō was terminated by the Father’sDay intrusion on June 17–19, 2007. The intrusion culmi-nated in a tiny, brief eruption on Kāne Nui O Hamo shield,about 6 km west of Pu‘u ‘Ō‘ō (off map), and was accom-panied by the collapse of the floor of the Pu‘u ‘Ō‘ō craterdue to magma withdrawal (Poland et al. 2008). This wasfollowed by an eruptive pause that lasted until July 1, whenlava began to refill the Pu‘u ‘Ō‘ō crater. On July 21, 2007,fissures opened on the east flank of Pu‘u ‘Ō‘ō (Poland et al.2008) and propagated to the western base of Kupaianaha(Fig. 2c). Effusion soon centered on the easternmost fissure,Fissure D, and from late July to November, lava flows weredirected north of the rift zone (Kauahikaua 2007), building aperched lava channel (Patrick et al. 2011). On November 21,2007, a breakout (informally called the Thanksgiving EveBreakout [TEB]) from directly above the buried trace ofFissure D diverted lava toward the south away from theperched lava channel. From December 2007 to February2008, the bulk of the TEB lava had accumulated withinabout 2.5 km of the Fissure D vent, building more than adozen rootless (i.e., tube-fed) lava shields (Fig. 2c), each20–30 m high and 200–400 m wide (Patrick and Orr 2011).In late February, lava began to advance more rapidly, cuttinga swath through the Royal Gardens subdivision (Fig. 1) andreaching the ocean on March 5. Surface flows diminishedover the next months as a stable tube was established,though a brief surge in activity in late June–early July fedvigorous surface flows for several days. Thereafter, the TEBtube and associated ocean entry were active almost contin-uously through the end of 2009.
In addition to the lava merging at Pu‘u ‘Ō‘ō, a new ventat Kīlauea’s summit (not shown) opened in March 2008 inHalema‘uma‘u Crater (Wilson et al. 2008). A lava lakeresided deep within the vent cavity, which enlarged from35 m across at the beginning of the eruption to 130 m acrossby the end of 2009 (Orr and Patrick 2009). SO2 emissionwas generally 600–1,000 t day−1, which is lower than typ-ical values on the ERZ during 2000 to 2008. The steady
Fig. 2 Locationmaps showingKīlauea’s ERZ flow field and the locationof flows erupted for individual time periods. All major tubes are shownfor these flows, but not all were active at the same time. Solid yellow linesdenote well-mapped lava tubes (accurate to within a few tens of meters),while dotted yellow lines denote approximate path of lava tubes (accurateto within a hundred meters). a Flow field showingMother’s Day flow andassociated lava tubes from May 2002 to September 2004. b Extent ofMLK and PKK flows erupted between January 2004 and June 2007 withassociated lava tubes. c Map of Fissure D–TEB flows erupted betweenJuly 2007 and December 2009 with associated lava tubes. The perchedlava channel from late 2007 is shown as a heavy red line and rootlessshields active in early 2008 are shown by gray circles
716, Page 4 of 18 Bull Volcanol (2013) 75:716

degassing and lava lake activity were punctuated by a handful ofsmall explosive events that ejected juvenile and lithic tephra (Orret al. 2008; Houghton et al. 2011). Notably, intermittent minor tomoderate surface breakouts from the TEB tube system onto theERZ flow field were commonly associated with cycles ofdeflation and inflation (DI events) at Kīlauea’s summit.
Methods
Estimating the total lava supply rate using SO2 emission rates
SO2 gas emitted byKīlauea has beenmeasured regularly since1979 (Elias et al. 1998). For this study, we used SO2 datacollected between 2000 and 2009 by three vehicle-based in-struments: the Correlation Spectrometer (COSPEC IV) fromJanuary 2000 to March 2001, COSPEC V from March 2001to September 2004, and FLYSPEC from September 2004 untilthe present. Each instrument changeover included a transitionperiod during which both the old and new instruments wererun concurrently (Elias and Sutton 2002, 2007).
Kīlauea’s summit region and ERZ are generally treated asdistinct and independent sources of SO2, and they have beenmeasured and recorded separately since 1984 (Elias et al.1998). At Kīlauea, ERZ SO2 emission rates were routinelyused to estimate the volume of lava erupted from ERZ vents.However, in late 2008, ERZ SO2 release began to be affect-ed by preeruptive summit degassing, so that SO2 measuredfrom the ERZ beyond July was no longer clearly linked tothe ERZ effusion rate (Sutton et al. 2009). Therefore, for thisstudy, we used vehicle-based SO2 measurements from theERZ from January to July 2008, and we excluded SO2 datafrom July 2008 to December 2009.
SO2 emission rates, reported in metric tons per day, canbe converted to dense rock equivalent lava effusion rates viathe equation:
Vm ¼ ESO2 � Kd ð1Þwhere Vm is the derived effusion rate (cubic meters per day),ESO2 is the measured SO2 flux (metric tons per day), and Kd isa degassing constant based on the weight percentage of SO2
present in typical Kīlauea basalts and the void-free lava den-sity measured from Kīlauea’s submarine basalts (a full deri-vation of Eq. 1 can be found in Sutton et al. 2003). Previousestimates of Kd have ranged from 207 (Sutton et al. 2001) to233±80m3 of lava erupted per metric ton of SO2 (Sutton et al.2003). For this work, we use a Kd of 239 m
3/ton SO2, a valuecalculated by USGS Hawaiian Volcano Observatory (HVO)staff using the methods of Sutton et al. (2001) that moreaccurately reflects the CO2/SO2 ratio of the east rift eruptivegases during our period of our study. For comparison with theradiance data, we present the derived effusion rate (Vm) incubic meters per second.
Estimating the relative abundance of surface flows usinginfrared satellite data
Spectral radiance data from two MODIS currently in orbitwere used in this study. The first MODIS instrument waslaunched on board NASA’s Terra satellite and beganreturning data in February 2000; a second instrument waslaunched on board NASA’s Aqua platform and beganreturning data in June 2002. Individually, the two polarorbiting satellites achieve global coverage of the earth ap-proximately twice per day. However, for this study, we usedonly nighttime passes, which avoided complications due toreflected sunlight in the thermal images. Nighttime imagesover Hawai‘i are collected nearly daily between 9:40 and11:30 p.m. Hawaiian Standard Time (HST) by Terra andbetween 1:10 and 3:00 a.m. HST by Aqua. This providedapproximately one image each night between February 2000and June 2002 and approximately two MODIS images eachnight from July 2002 to December 2009. There were dayswhere neither satellite orbit track included Kīlauea in itsfield of view; however, this occurred in <5 % of days thatwe analyzed in this study.
MODIS collects data in 36 wavebands, 10 of which aresuitable for monitoring thermal behavior on the Earth’ssurface. For this work, we used MODIS bands 21 (3.930–3.989 μm), 22 (3.930–3.989 μm), and 32 (11.770–12.270 μm), which have spat ia l resolut ions of~1 km pixel−1. Bands 21 and 22 cover the same wavelengthregion; however, band 21 has a higher saturation tempera-ture (~500 K) than band 22 (~330 K) as well as more noise(Barnes et al. 1998; Kaufman et al. 1998).
We used a hybrid time series algorithm (Koeppen et al.2010) that combines two previous algorithms, MODVOLC(Wright et al. 2002) and a time series approach (e.g., Pergolaet al. 2004, 2009), to process the nighttime MODIS databetween February 2000 and December 2009. The algorithmdetects thermal anomalies (i.e., volcanic surface activity)and calculates the excess 4-μm radiance, which is the radi-ance emitted by the active lava corrected for backgroundradiance emitted by the surrounding inactive lava/substrate.It uses bands 21, 22, and 32 of each MODIS MOD021KMradiance file, along with its companion MOD03 geolocationfile, to generate oversampled (0.5 km pixel−1), time-ordered,georeferenced image cubes for the 4- and 12-μm wave-length data. The 4-μm cubes are composed of band 22 data,unless the band 22 values are saturated by high-temperaturethermal anomalies (e.g., active volcanic eruptions or fires)whereby those pixel values are replaced with band 21values. The hybrid time series algorithm (1) uses the 4-and 12-μm image cubes to calculate the normalized thermalindex, identifying and removing major thermal anomaliesfrom the cube (Wright et al. 2002, 2004), (2) derives 4-μmreference (mean) and variability (standard deviation) images
Bull Volcanol (2013) 75:716 Page 5 of 18, 716
for the region for each calendar month, (3) compares theoriginal 4-μm data to the reference images, normalized bytheir variability, and (4) adds any pixels that fall outside ofthe envelope of normal thermal behavior to the pixelsdetected in step 1. A mask cube of thermally anomalouspixels is returned, with one mask image for each inputimage in the cube. We calculated the excess 4-μm radianceemitted by Kīlauea’s ERZ flow field in each image bysubtracting the reference radiance from the measured radi-ance for each anomalous pixel and then summing the excessradiances across the region.
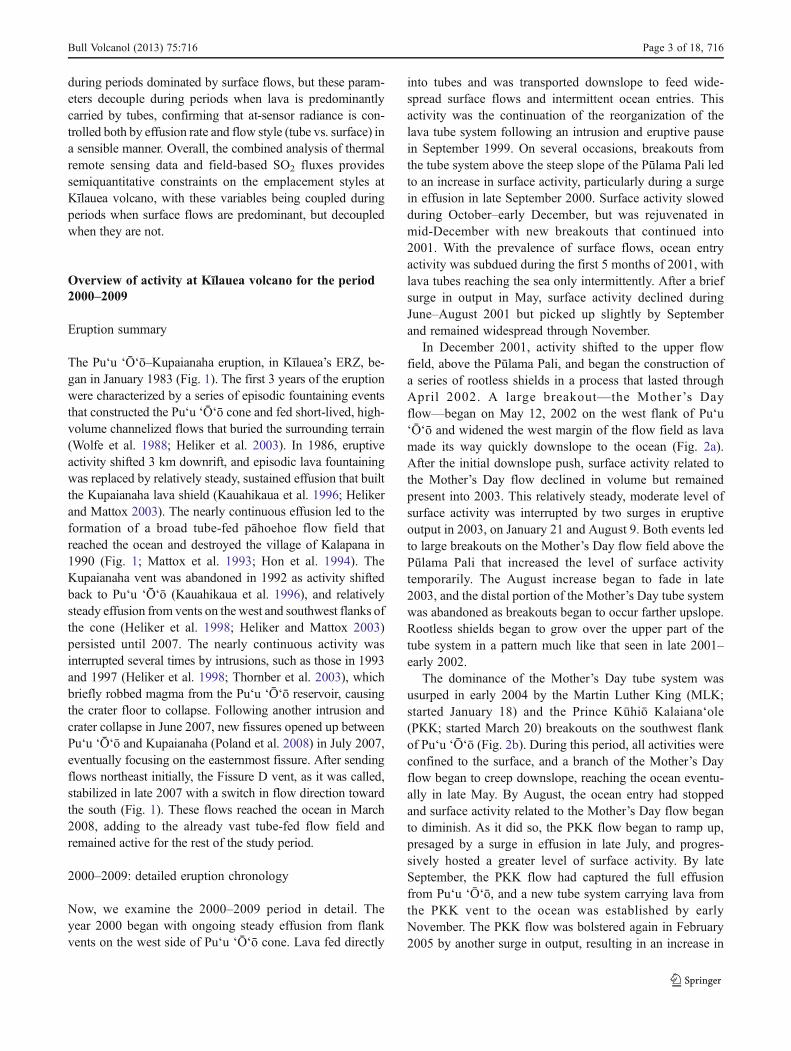
Using both Terra and Aqua instruments, MODIS provid-ed excess 4-μm thermal radiance measurements on 8,008discrete occasions over Kīlauea volcano between February2000 and December 2009. However, many of these imagesshowed the presence of clouds that can either partially orfully obscure the volcano, leading to observed radiancevalues lower than what was present on the surface.Unfortunately, the MODIS cloud mask could not be usedto automatically identify cloudy images as it consistentlymisidentified cloudy vs. clear conditions over Hawai‘i(Koeppen et al. 2010). Therefore, for this test case, wemanually inspected all of the MODIS images and classifiedthe area over the ERZ as “clear” (747 images), “partly clear”(1,599 images), or “cloudy/unknown” (5,662 images).Images with the clear classification showed no identifiableclouds over the flow field, and satellite-measured thermal
radiances are expected to be indicative of the lava present onthe surface of the flow field. Images with the partly clearclassification showed some clouds present over the flowfield, some of which may partially obscure the excess radi-ance emitted by the surface lava. In these cases, the excessradiance may be indicative of the lava on the surface or maybe slightly depressed and underestimate that emitted bysurface flows. Images with the cloudy/unknown classifica-tion show individual clouds obscuring the ERZ flow field,moderate to heavy cloud cover over the entire image, or theyshow missing values in the region of interest (a product ofbeing on the edge of the MODIS field of view). Excessradiance values derived from these images almost certainlyunderestimate the excess radiance emitted by Kīlauea’s sur-face flows.
To form a complete radiance time series, we used all ofthe data classified as clear and added some measurementsfrom partly cloudy and cloudy images when those valuesexceeded what could otherwise be interpolated betweentemporally adjacent clear-sky observations (Fig. 3). Forexample, between February and November 2000, there areonly ten clear images of the ERZ flow field, and there wereno clear images identified in February, April, May, orOctober. During this time, there are an additional 47 cloudyor partly cloudy images that show radiance values exceed-ing those that would be obtained by interpolating betweenthe few available clear-sky observations. As another
Fig. 3 Time series of excess radiance values over the ERZ flow fieldof Kīlauea volcano. The solid line connects values that were used forthis study, which mostly consist of clear-sky data (blue squares), but
include partly cloudy (green squares) and cloudy data (red squares)that displayed a higher excess radiance than that which would beinterpolated from the clear-sky values alone
716, Page 6 of 18 Bull Volcanol (2013) 75:716
example, the peak of the excess 4-μm radiance in July 2008would be estimated at ~260 W m−2 μm−1 sr−1, occurring onJuly 5, if only clear-sky radiance data were used to form thetime series. However, a cloudy image shows an excess radi-ance of at least ~410 W m−2 μm−1 sr−1 on July 4. Because thethermal radiance values associated with partly cloudy andcloudy images cannot overestimate the excess radiance, weused these values to fill in gaps and achieve better estimates ofthe excess radiance during this time period. Unfortunately, it isimpossible to algorithmically identify periods where the partlycloudy and/or cloudy data can be used when it is lower thanthe values interpolated between clear data. For example, thereis a paucity of clear data between March and May 2002 wherethe interpolated radiance values are quite high. Partly cloudydata appears to indicate a drop in excess radiance during lateApril–early May before returning to high levels indicated bythe clear data; but, there is no way to know if those are betterestimates of the radiance emitted by the flow field than inter-polating the sparse clear data during that time. Using our dataselection method, we were able to add 567 partly cloudyimages to the 747 clear-sky images to form a time series with1,314 data points to compare with SO2 measurements. One ofthe advantages of using long temporal time series of satellitedata (and looking for general trends in emitted radiance ratherthan very specific events) is that the effect of intermittentcloud cover can be reduced.
For most of this work, we relate measurements of SO2 inunits of metric tons per day to measurements of radiance inwatts per square meter per micrometer per steradian overKīlauea. However, to directly compare with SO2-based ef-fusion rates, we also converted the excess 4-μm radiancevalues to apparent effusion rates. Many studies have beenpublished on the topic (e.g., Harris et al. 1998, 2007; Wrightet al. 2001), and they show that the apparent area of eachimage (Alava) covered by the thermal anomaly can be deter-mined by the equation:
Alava ¼X Lsat � Lbg
Llava � Lbg� Apixel ð½2�Þ
where Lsat is the measured MODIS band 22/21 radiance, Lbg isthe normal (ambient) band 22/21 radiance of the pixel when noanomaly is present, Llava is the black-body radiance at 3.96 μmemitted by a thermal anomaly of an assumed lava temperature,and Apixel is the area of a pixel (square meters). By makingassumptions about the lava’s density, specific heat capacity,surface temperature, cooling temperature from liquidus to sol-idus, latent heat of crystallization, and convective heat transfercoefficients, the area of the lava in each image can be furtherconverted into a time-averaged effusion rate (Er) by:
Er ¼ Alava � a ð½3�Þwhere α is a scaling factor dependent on the assumed values.Harris et al. (2007) present a range of typical values for α at
Kīlauea based on values and equations that they explain indetail. For this work, we used their derived values and calcu-lated a minimum effusion rate based on an assumed lavatemperature of 773.15 K (500 °C) and an α value of 29×10−6 m s−1 and a maximum effusion rate based on an assumedlava temperature of 373.15 K (100 °C) and an α value of 0.9×10⁻⁶ m s−1. For comparison with the SO2 effusion rates, wepresent the average of the two rates and use the minimum andmaximum to estimate errors.
It is important to note that, while effusion rates are a moreintuitive way to describe what’s happening within the flowfield, errors in these rates from satellite-based radiance datacan be quite large. Harris et al. (2007) estimate that un-certainties in the remote sensing method can be as high as50 %. However, both the radiance-based and SO2-baseddischarge rates are, for the most part, linear transformations,i.e., the absolute values of the effusion rates may changewith the various assumptions made, but the relative differ-ences between data points are constant, regardless of theassumptions. The discharge rate estimated from radiance isnot completely linear because it includes the Lbg term, whichchanges through time; however, in Hawai‘i, these differ-ences are minimized because ambient temperatures (and,therefore, Lbg) have only a small range of values.
A semiquantitative measure of the relative proportionsof tube vs. surface flows obtained from field observations
The HVO conducts field observations and flow mapping on aregular basis. Helicopter flights approximately once per weekprovide a synoptic view of flow field activity. Recent and activeflows are mapped using a handheld GPS from the helicopter orby foot on a similar frequency. Reports summarizing the activ-ity are then written on a bimonthly or quarterly basis.
We reviewed all of the activity reports compiled between2000 and 2009 to characterize the emplacement style of theactive flows during the study period. Activity on each daywas assigned to one of six categories, designated by anumber (Table 1). Assigning these categories based on theactivity reports is partly subjective, particularly in choosingbetween categories 2 and 3 (major vs. minor breakouts).However, these descriptions are still valuable observationaldata, and they provided a serviceable depiction of emplace-ment style that can be used to compare against our quanti-tative calculations of surface vs. tube-fed flow.
Results
Figure 4 shows the clear-sky excess thermal radiance, the SO2
output, and the recorded degree of tubing in the ERZ flow fieldfrom 2000 through 2009. Both the excess radiance and the SO2
data show large variations in their point-to-point values;
Bull Volcanol (2013) 75:716 Page 7 of 18, 716

however, on the monthly and yearly timescales there are cleartrends. For example, peaks in SO2 are generally correlated withperiods of high excess radiance. In May 2001 and February2005, there is close agreement in the timing of increases inboth datasets. An increase in both SO2 flux and emitted ther-mal radiance is consistent with (a) increased lava effusion fromthe vent and (b) the distribution of this lava predominantly assurface flows. Field observations confirm that these periodswere times when surface flows were conspicuous (surfaceflows and/or major breakouts from the tube system in Fig. 3).On the other hand, troughs in emitted thermal radiance aregenerally decorrelated with SO2 flux. There are at least fiveperiods during which the data show reduced excess radiancevalues that do not correspond to any notable decrease in SO2,
including the following: October–December 2000, June–August 2001, June–July 2004, May–September 2005,February–May 2006, and March–June 2008. These radiancetroughs that are decoupled from the SO2 data occur duringperiods in which the flow field was observed to have a well-established tube system. In the following sections, we describepatterns in the time series during five specific time periods inthe context of observed eruptive activity.
January 2000–December 2001
In 2000 to 2001, the data show only one major SO2 spikeand two drops in emitted thermal radiance attributed totubing of the surface flows (Fig. 5a). From January 2000
Table 1 Classification of lava effusion style on the ERZ based on field observations
Category Summary Description
5 All surface flows No discernible lava tube system was present on the flow field.
4 Surface flows, advancing tube A developing lava tube system was migrating towards the ocean. Flows were partiallytubed but exited at its front and margins without entering the ocean.
3 Established tube, major breakouts A significant amount of lava was contained in lava tubes, which reached the ocean.Major breakouts still fed large surface flows.
2 Established tube, minor breakouts A significant amount of lava was contained in lava tubes, which reached the ocean.Only minor breakouts fed small surface flows.
1 All tubed All erupted lava was contained within the lava tube system, which reached the ocean.
0 No eruption No lava was erupting from the vent.
Fig. 4 Time series of excess radiance calculated for oversampledMODIS images (gray points), SO2 (black line), and flow field charac-terizations (colors). Points in the SO2 data that were measured more
than 60 days apart are not connected, and SO2 data after July 7, 2008were excluded from this study because of complications from summitdegassing discussed in the text
716, Page 8 of 18 Bull Volcanol (2013) 75:716
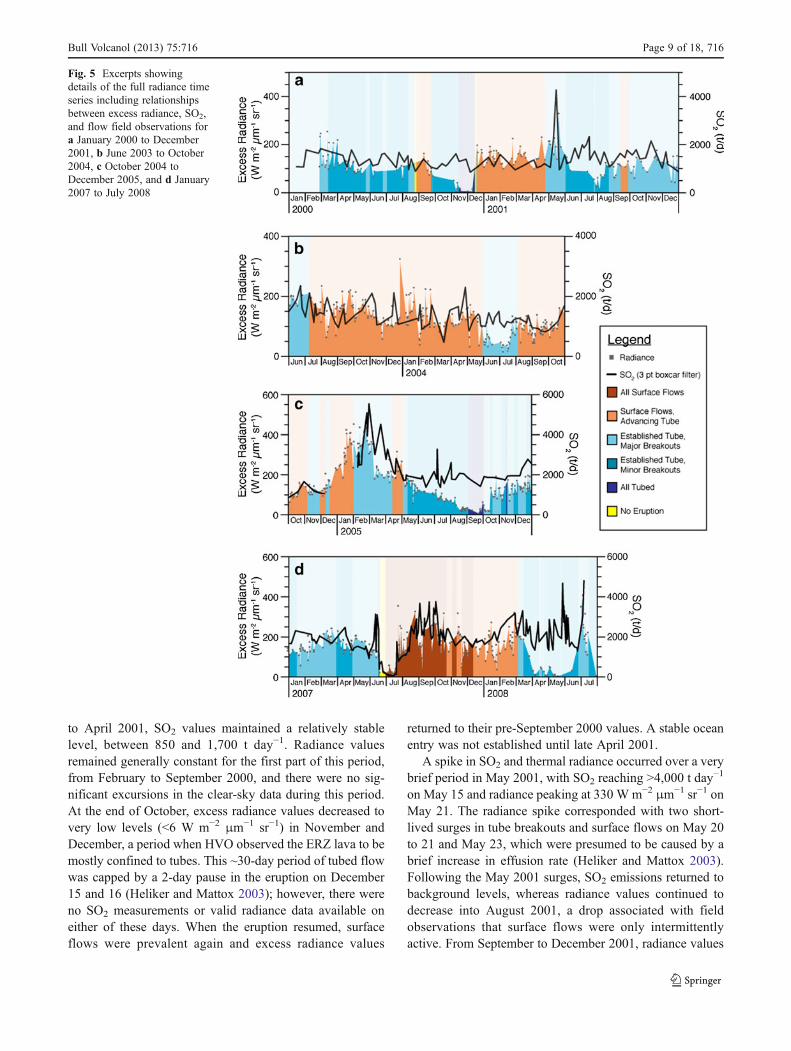
to April 2001, SO2 values maintained a relatively stablelevel, between 850 and 1,700 t day−1. Radiance valuesremained generally constant for the first part of this period,from February to September 2000, and there were no sig-nificant excursions in the clear-sky data during this period.At the end of October, excess radiance values decreased tovery low levels (<6 W m−2 μm−1 sr−1) in November andDecember, a period when HVO observed the ERZ lava to bemostly confined to tubes. This ~30-day period of tubed flowwas capped by a 2-day pause in the eruption on December15 and 16 (Heliker and Mattox 2003); however, there wereno SO2 measurements or valid radiance data available oneither of these days. When the eruption resumed, surfaceflows were prevalent again and excess radiance values
returned to their pre-September 2000 values. A stable oceanentry was not established until late April 2001.
A spike in SO2 and thermal radiance occurred over a verybrief period in May 2001, with SO2 reaching >4,000 t day−1
on May 15 and radiance peaking at 330 W m−2 μm−1 sr−1 onMay 21. The radiance spike corresponded with two short-lived surges in tube breakouts and surface flows on May 20to 21 and May 23, which were presumed to be caused by abrief increase in effusion rate (Heliker and Mattox 2003).Following the May 2001 surges, SO2 emissions returned tobackground levels, whereas radiance values continued todecrease into August 2001, a drop associated with fieldobservations that surface flows were only intermittentlyactive. From September to December 2001, radiance values
Fig. 5 Excerpts showingdetails of the full radiance timeseries including relationshipsbetween excess radiance, SO2,and flow field observations fora January 2000 to December2001, b June 2003 to October2004, c October 2004 toDecember 2005, and d January2007 to July 2008
Bull Volcanol (2013) 75:716 Page 9 of 18, 716
remained relatively steady (~100 W m−2 μm−1 sr−1), withvariations in the data corresponding to individual breakoutevents.
June 2003–October 2004
From June 2003 to May 2004, there was a nearly 11-monthstretch of surface flows that displayed a gradual decrease inboth SO2 and thermal radiance (Fig. 5b). While SO2 valuesfollowed a steady decline, an abrupt drop in excess radiancevalues occurred at the end of May 2004 with low valuesmaintained until July 23, 2004. This change represented aphase during which the PKK flows developed tube systemthat reached the ocean, albeit with major breakouts (Fig. 2b).In August 2004, the established tube to the ocean was aban-doned and a new, partly tubed flow from the PKK vent areabegan to advance. Breakouts from the new advancing tubeand surface flows along its margins were recorded byMODISas moderate excess radiance values. By September 2004, SO2
emission rates averaged ~1,000 t day−1 and nontubed radiancevalues were ~75 W m−2 μm−1 sr−1 (compared to average SO2
values of ~1,800 t day−1 and excess radiance values of~175 W m−2 μm−1 sr−1 at the beginning of June 2003).
October 2004–December 2005
Beginning in October 2004, both SO2 and thermal radiancerapidly rose to a level that was unprecedented in our decadaldataset (Fig. 5c). In February 2005, SO2 discharge peaked at~5,500 t day−1, or about four times the typical average of~1,500 t day−1, and excess radiance values reached~450Wm−2 μm−1 sr−1, approximately three times the averagefor the preceding 5 years. During this period of increasing SO2
and thermal radiance, surface activity on the PKK flow field(Fig. 2b) intensified, possibly as a result of increased magmasupply at Kīlauea’s summit (Poland et al. 2012). Small lavafountaining events occurred sporadically at Pu‘u ‘Ō‘ō duringthis time period, and field observations point to an abundanceof surface flows and major breakouts.
Radiance and SO2 fell jointly between March and May2005 as the frequency and scale of surface flows decreased.The declining SO2 flux leveled off in May 2005 and remainedrelatively constant through the end of 2005, albeit at a higherlevel than the 2000 to 2004 average (Elias and Sutton 2007),whereas radiance values continued to decrease, reaching verylow levels in late August that were maintained until October.This decoupling of the emitted thermal radiance observationsfrom the SO2 between May and October corresponded with asteady increase in tubing and a consistent drop in the numberof breakouts on the flow field. For most of September 2005,when radiance was at its minimum, lava on the flow field wasentirely tubed and HVO scientists observed no significantbreakouts. Radiance values returned to more typical levels in
mid-October, when surface breakouts from the tube systemresumed.
January 2007–May 2008
Moderate levels of SO2 and thermal radiance persisted be-tween January and early June 2007; however, in late June,both datasets show a precipitous drop related to the Father’sDay intrusive event (Fig. 5d). The event started on June 17,culminated in a very small volume flow in the upper ERZ,and triggered a 2-week pause in eruptive activity at Pu‘u‘Ō‘ō. Between July 1 and 20, the eruption resumed withinthe Pu‘u ‘Ō‘ō crater, but thermal radiance and SO2 remainedlow during this phase, and no surface flows on the ERZwere observed. In late July and August, SO2 and excessradiance began climbing in concert, concurrent with theonset of new fissures and surface flows beginning July 21.Relatively high levels of thermal radiance and SO2 weremeasured between August 2007 and March 2008, associatedwith the presence of an open lava channel, followed by aseries of perched lava ponds and surface flows (Fig. 2c;Patrick et al. 2011; Patrick and Orr 2011). Though SO2
levels remained high throughout 2008, thermal radiancevalues declined in March relative to measured SO2 flux,again corresponding with the establishment of a tube tothe ocean and subsequent decrease in surface flow activityin March to June as the tube stabilized (Fig. 2c). In late June2008, Pu‘u ‘Ō‘ō (along with the Kīlauea summit) beganinflating, followed by deflation and surface breakouts dur-ing the first week of July, an episode recorded by a spike inthe excess radiance data that reflected the surge in lavasupply.
July 2008–December 2009
From July 2008 until the end of 2009, the excess radiancedata correlates well with observations of the surface flowactivity. In August and September 2008, there were at leastfour DI events (Poland et al. 2011) visible in the thermalradiance data, with each one lasting approximately a weekor two. The inflation portion of each event was expressed asa cycle of increasing excess radiance values associated witha surge of lava and increased number of surface flows,whereas the deflation phase is associated with a decreasein lava supply, sometimes pausing entirely, and decliningexcess radiance values. The DI events gave way to sustainedmoderate excess radiance values in October 2008. In 2009,the excess radiance data recorded three longer period events(3- to 4-month timescales), with each event being a se-quence of breakouts that each declined until surface flowssubsided. The data show that each of these cycles endedwith surface flows becoming entirely tubed in May, August,and December of 2009.
716, Page 10 of 18 Bull Volcanol (2013) 75:716

Discussion
SO2 flux data and satellite-derived thermal radianceobservations as an index of lava emplacement styleat Kīlauea volcano
Figure 6 shows histograms of the total thermal radiance emit-ted by the flow field (clear-sky observations only), as a func-tion of each of the qualitative flow field categories that weidentified (Table 1). In general, as the abundance of surfaceflow decreases and the abundance of tubed flow increases, thesatellite-derived thermal radiance histograms display lowermeans, positive skewness, and a decrease in the maximumvalue. This is sensible, as a larger proportion of the availablelava is partitioned from the surface into the tube system,effectively hiding much of it from the satellite sensor.
Correlating SO2 flux and thermal radiance measurementsconfirms that the development of tubes carrying a greaterproportion of the available lava, and not a cessation in theeruption, is the cause of these changes. Both the SO2 emis-sion rates and excess radiance values were converted to acommon variable (effusion rate; cubic meters per second)using Eqs. 1, 2, and 3, and Fig. 7 displays the full time seriesof each variable on the same scale along with their associ-ated envelopes of uncertainties. Although the uncertaintiesin the effusion rate calculations are large, the drops in
radiance data relative to the SO2 data are still clearly presentoutside the margin of error.
To more clearly associate the derived effusion rates withthe observed character of the flow field, we also calculated theratio of thermal emission-based effusion rate to the SO2-basedeffusion rate (Er/Vm) for measurements that were taken rela-tively close together in time. At Kīlauea, the ratio of the tworates can be thought of as the percentage of lava present on thesurface relative to the total amount supplied to the ERZ flowfield. This was done by selecting SO2 measurements that hada clear-sky radiance image taken within 3 days, a process thatreduced the dataset to only 334 comparable data points for thenearly 10-year record. We calculated the respective effusionrates for the points, calculated the ratio between them, andplotted them alongside the flow field observations (Fig. 8). Asexpected, this plot reiterates our previous results (e.g., Fig. 4),but it also adds some insight. First, the ratio time seriespredominantly falls below the one-to-one line, which indicatesthat, at Kīlauea, it is normal for lava that rises and degasses at ashallow level to be erupted through tubes with a varyingamount of surface activity—the amount of lava degassedalmost always exceeds the amount of lava detected as surfaceflows. The use of the word “detected” is significant herebecause lava flows that become ponded or which grow viainflation begin to violate the assumed relationships betweenat-satellite spectral radiance and lava effusion rates. For ex-ample, an eruption that accommodates additional lava viaflow inflation would cease to expand laterally, and anychanges in effusion rate, inferred using lava area as a proxy,would be impossible to document. Second, lack of data abovethe one-to-one line confirms that the contrary condition,where more lava is erupted as surface flows than apparentlyhas been supplied, is relatively rare. Such a condition couldoccur where magma emplaced and degassed at shallow levelsis later entrained and erupted contemporaneous with freshmaterial (Steffke et al. 2011; Patrick and Orr 2011). Thismay have been a process that contributed to the large spikein radiance relative to SO2 that occurred in June and July of2007, when the upper section of the flow field was inundatedwith fissures and open lava channels after a brief eruptionpause. During that period, the effusion rate ratio was very low(~0.2) before becoming very high (~4.1). The rest of the ratiotime series is as we expected, the ratio of the apparent effusionrates is generally close to 1 when the flow field was classifiedas having all surface flows or an advancing tube with signif-icant surface flow activity. Under those circumstances, thepercentage of the total lava supplied to the flow field, whichis exposed to the satellite sensor, is greatest. The ratio de-creases during periods characterized by an established tubesystem, and it is lowest when there are only minor breakoutsor when it is all tubed; during these times, lava is obscuredfrom the spacecraft and the apparent satellite-derived effusionrates fall to their minima.
Fig. 6 Histograms of clear-sky excess radiance values based on theoversampled MODIS images associated with flow field characteriza-tions. The dotted line on each plot represents the mean excess radiancevalue for the histogram
Bull Volcanol (2013) 75:716 Page 11 of 18, 716

To summarize, using the SO2 emission rates with thesatellite-derived thermal flux to monitor surface vs. tubedflows on a daily basis must be done with care. Given the errorsand uncertainties associated with each individual measurementand the probability of clouds obscuring the satellite data, thesedata may be useful in only the best circumstances. However,our results show how trends made evident by analyzing de-cadal time series of these data can be used to classify themanner of lava emplacement at Kīlauea. The clear-sky thermalradiance measured byMODIS over Kīlauea’s ERZ is primarilycontrolled by two factors, the lava effusion rate and the degreeto which the lava supplied to the vent is distributed as surfaceflows or through lava tubes. When there is no established tubesystem, all of the erupted lava is visible to the satellite andrecorded as radiance in excess of the typical backgroundvalues. In this case, variations in the radiance data (and anyderived parameters) are generally coupled with variations inthe SO2 (Fig. 4). This finding agrees with the notion that SO2
can be used as a proxy for all of the lava that is erupted onto theflow field (Sutton et al. 2003). Consequently, this implies that,at Kīlauea, during our study period, lava was not being eruptedfaster than SO2 can exsolve nor was a substantial amount oflava being degassed at shallow levels without erupting (previ-ously identified shallow intrusive events, such as the Father’sDay intrusion, prove exceptions to this rule).
Once the lava flow establishes an active tube system onthe flow field, lava is hidden from the satellite. This results
in thermal radiance variations that become decoupled fromthe measured SO2 flux. At Kīlauea, this is most easilyrecognized when the thermal radiance decreases while theSO2 remains relatively constant, situations which occurredin November 2000, June 2001, July 2004, September 2005,most of 2006, and March–July of 2008. This pattern is mosteasily observed for the period April–September 2005(Fig. 5c), when the radiance data showed a smooth andsteady decline over the course of 6 months, whereas theSO2 maintained relatively consistent values.
Temporal trends in thermal radiance and SO2 flux data
There appears to be a statistical basis for categorizing flowsas predominantly surface or tubed based on the temporalevolution of SO2 gas and heat flux measurements, and weshow good agreements in the data over longer (e.g., month-ly) timescales. An idealized progression in the developmentof the established tube system might involve initial abun-dance of surface flows, which gradually coalesce to formtubes. The tubes themselves gradually coalesce and eventu-ally form a conduit from the source to the ocean. Thereafter,the incidence of surface flows gradually decreases as thetube system becomes more utilized. Such a progressionwould result initially in high (and correlated) thermal radi-ance and SO2 fluxes until the tube reached the ocean,followed by a period of gradual decrease in thermal radiance
Fig. 7 Time series of effusionrates calculated from SO2 andexcess radiance data. Shadedenvelopes indicate error bars. ForSO2, errors are based on standarddeviations of the measurement;for radiance, they come fromaveraging two models for lavatemperature, one hot (500 °C)and one cold (100 °C)
Fig. 8 Time series of the ratio of radiance-based effusion rates to SO2-based effusion rates (thick black line) and flow field characterizations(colors). The shaded envelope represents the errors calculated bycombining errors from radiance-based rates estimated using two
temperature models and SO2-based rates using the standard deviationof the measurements. The dashed line indicates where the ratio ofeffusion rates is one-to-one
716, Page 12 of 18 Bull Volcanol (2013) 75:716

and its decoupling from the SO2 observations as more andmore lava utilizes it. This simplified scenario has the SO2
and thermal radiance observations falling within distinctfields in radiance–gas feature space for each flow fieldcondition. If this occurs, can the development of a predom-inantly tube-fed flow field from one dominated by surfaceflows be tracked as a trajectory of sequential thermal radi-ance and SO2 ratio values, as idealized in Fig. 9?
The answer appears to be yes and no. Scatter plots of theSO2 and thermal radiance data split out by flow field char-acter show weak clustering (Fig. 10). Observations fromwhen the eruption was producing all surface flows overlapwith those of surface flows with an advancing tube. That isnot surprising given the efficiency of lava tubes—the lengthof the tube system does not affect the excess radiance valuesuntil it reaches the ocean. However, the latter shows a muchtighter distribution of points, however, possibly because anadvancing tube system requires a somewhat steady lavasupply, whereas the former case does not. Similarly, whenmajor breakouts were observed on the flow field, the radi-ance and SO2 data is more widely spread. Indeed, breakoutsfrom an established tube system often occur when thesupply of lava is variable. The distribution of data forthe case of an established tube system with minorbreakouts shows a narrower distribution in terms ofSO2 (suggesting uniform lava supply) and it falls loweron the excess radiance scale (because lava is transportedto the ocean under cover). There are only a few pointsin the tubed and no-eruption cases at Kīlauea and allshow low values. The lack of data in these two catego-ries is a testament to the longevity and consistency ofsurface flows at Kīlauea, but it also illustrates howshort-lived the completely tubed systems are.
In some cases, it appears possible to use the SO2 andthermal radiance datasets to estimate the degree of tub-ing more quantitatively than the characterizations thatare currently employed (i.e., Table 1). To illustrate this,we again used the ratio of the radiance-based effusionrate to the SO2-based effusion rate (Er/Vm). We plottedthe fields containing 10 % increments of these ratiosinto SO2 vs. excess radiance space. The result is a plotthat shows the path of data points identified by theirSO2 and excess radiance values as they move throughthe ratio fields, which represent a quantitative measureof the degree of tubing.
As just one example, the time series of data fromFebruary to September 2005 is plotted in Fig. 11. Inearly February, both SO2 and radiance were near theirpeak; field reports indicate major breakouts from thetube system, and the effusion rate ratios indicate a highpercentage of the available lava was present on thesurface of the ERZ. The SO2 flux increased by up to300 % (suggesting an increasing total effusion rate) bythe end of February, but radiance values increased onlyby ~30 %, suggesting that the established tube systemwas accommodating more lava and, consequently, thepath moves to fields with lower effusion rate ratios. OnFebruary 28, the ratio data estimate that only 50 to60 % of the supplied lava was present as surface flows.Through March, excess thermal radiance fell by 50 %as did SO2 flux, consistent with an overall decrease inlava supply and the proportion of that lava erupted assurface flows; written records describe an overall de-crease in surface activity through March, and in thisfeature space, the percentage of available lava emplacedas surface flows decreases to 30–50 %. During April,this percentage increases to 60–80 %, consistent withfield observations of a new, advancing flow front. FromMay to September 2005, SO2 measurements varied,sometimes significantly, but emitted radiance steadilydecreased, indicating a systematic switch from surfaceflows to tube-fed flow, during which time field obser-vations point to the preponderance of an establishedtube with minor breakouts. Excess radiance values fi-nally bottomed out in September when effusion rateratios estimate that ~90 % of the lava was accommo-dated within the tube system. Although during thisperiod of time the qualitative summary of flow field conditionwe use here indicates that the flows were “all tubed,” night-time MODIS data show that there was some lava still presenton the surface for at least some of that month, possibly in theform of small breakouts on the ocean entry delta, which arecommon; weak surface activity was observed by the HVOthrough September.
There are other times within our study period when thetrends are less evident or indiscernible, and we provide two
Fig. 9 Diagram depicting the relationship between excess radiance,SO2, and flow field characterizations. The dashed trajectory shows avery simplified scenario where an eruption begins as surface flows,establishes a tube system to the ocean, and eventually stops altogether
Bull Volcanol (2013) 75:716 Page 13 of 18, 716

examples. Between September 2000 and April 2001, theflow field was observed to follow a cycle from a conditionof advancing tube with surface flows, established tubewith minor breakouts, completely tubed, eruption pause,and back to advancing tube with surface flows(Fig. 12). Such a cycle might be expected to show anobservable change through time when contemporaneousSO2 and thermal radiance observations are plotted.However, from September 23 to December 13, there
were only three data points that had concurrent SO2
measurements and clear-sky radiance values. As such,this may be a situation in which lack of data prevents aconsistent pattern from emerging.
The period July 2007 to June 2008 illustrates thesecond case (Fig. 13). Here, the gross characteristicsof the circular, clockwise, trajectory seen in the scatterplots of Fig. 9 are somewhat apparent. However, duringa 7-month period (August 2007 to March 2008), there is
Fig. 10 Scatter plots of SO2 vs.thermal radiance at Kīlauea fordays when a valid excessradiance image was obtainedwithin 3 days of the SO2
measurement (334 points).Each scatter plot represents datapertaining to a different flowfield character
716, Page 14 of 18 Bull Volcanol (2013) 75:716

no consistent path discernible for the SO2 and thermalradiance observations. In early to mid-July, both SO2
and thermal radiance were extremely low following apause in the eruption. SO2 values spiked in late Julyfollowed by, but not concurrent with, a spike in thermalemission. This led to a calculated effusion rate ratio of>1.0, a case that is not typical at Kīlauea. From lateAugust 2007 to mid-March 2008, the data showed highdaily variations, resulting in no discernible pattern interms of the calculated ratios. The scatter in these dataand the effusion rate ratio of >1 could be produced ifthere was a lag time between magma degassing, whichdrives the SO2 values, and the exposure of lava at thesurface, which drives the thermal radiance values.
Alternatively, the low effusion rate ratio values thatoccurred in June 2007 (visible in Fig. 8) may haveindicated that at least some shallow magma emplace-ment and degassing may have been taking place. Mostlikely, this shows that the physical processes occurringon the flow field are often more complicated than thevery simple model we present in Fig. 9. Even clear-skyradiance values derived from satellite measurements canbe modulated by many physical processes. During thisperiod, for example, lava was mostly confined toperched lava ponds and rootless shields (Patrick andOrr 2011), situations that hide thermal energy from thesatellite, and violate the assumptions of satellite-basedeffusion rate calculations.
Fig. 11 SO2 vs. excessradiance from February toSeptember 2005. The solid linedepicts the general path of thedata through time (dates areapproximate because not alldays have concurrent data).Light shaded areas separatefields containing the ratio oflava on the surface to the totalamount of lava erupted
Fig. 12 SO2 vs. excessradiance from September 2000to April 2001. The solid linedepicts the general path of thedata through time (dates areapproximate because not alldays have concurrent data).Light shaded areas separatefields containing the ratio oflava on the surface to the totalamount of lava erupted. Darkshaded area encompasses datawith no consistent patternthrough time
Bull Volcanol (2013) 75:716 Page 15 of 18, 716

Conclusions
By comparing satellite-derived thermal radiance measure-ments (a proxy for the abundance of surface lava flows)against the measured SO2 flux (a proxy for the total amountof lava supplied to the flow field and ocean entries), wedeveloped a semiquantitative framework for estimating therelative dominance of tube-fed vs. surface flows at Kīlaueavolcano. Comparison of SO2 and thermal flux with semiquan-titative flow field observations support the notion that SO2 andthermal radiance observations are correlated during periodswhen surface flows dominate in distributing lava withinKīlauea’s ERZ and that these two parameters becomedecoupled during periods when established tube systems dom-inate lava distribution. Attempts to place this relationship on amore quantitative footing met with limited success. Simplestatistical clustering of the data provides some evidence thatthe SO2 and thermal emission data do record transitions frompurely surface flows to the establishment of an advancing tubesystem and from an unstable tube system showing majorbreakouts to a more stable one that has only minor breakouts.However, the five discrete observational eruption categories(Table 1) do not appear to correspond to clear, unambiguousquantitative data fields. At least in part, this is due to thesubjective nature of the observational classifications.Although onemight expect to be able to trace the developmentof an eruption phase from an abundance of surface flows to anestablished tube system with few surface flows as a trajectorythrough an SO2–thermal radiance feature space, this is notalways possible either. Relating the data using effusion ratesdoes not help, unfortunately, as the errors and uncertainties inthe calculation of effusion rates from thermal radiance andSO2 measurements may be as high as 50 %.
Our results could be improved by leveraging more satel-lite assets to provide the necessary thermal radiance data,with more imaging opportunities serving to ameliorate theeffects of clouds. At Kīlauea, in situ monitoring of SO2 isalso limited to days on which the northeast trades blow theplume across the path of the monitoring network (whichhappens for most, but not all, of the year). In particular, datawith finer spatial resolution (e.g., <100 m resolution) wouldbe of use in calibrating the low-resolution MODIS classradiance data and constraining the spatial distribution ofsurface flows. MODIS class (1 km spatial resolution) ther-mal radiance measurements acquired at ~24 h separationhave been shown to scale well with those acquired by theGeostationary Operational Environmental Satellites (GOES)spacecraft (Koeppen et al. 2010), which is acquired with atemporal frequency of tens of minutes at 4 km spatialresolution. A suite of thermal radiance data acquired at highspatial resolution (i.e., <100 m) but low temporal resolution(once every 2 weeks) by sensors such as ASTER or theforthcoming Landsat Data Continuity Mission, combinedwith moderate and low spatial resolution data acquired byMODIS class and GOES class missions (at temporal fre-quencies of decaminutes to days), may allow the effects ofcloud to be reduced (but obviously never eliminated). Fromthis perspective, the proposed NASA HyspIRI mission mayprovide a useful bridge between these end-members: HyspIRIis proposed to acquire data once by night and once by dayevery 5 days at a spatial resolution of 60 m. At Kīlauea andother volcanoes, improved SO2 emission rate retrieval couldsimilarly be achieved through enhanced leveraging of satelliteassets such as the Ozone Monitoring Instrument carriedaboard NASA’s Aura spacecraft (e.g., Carn and Lopez 2011;Prata et al. 2013).
Fig. 13 SO2 vs. excessradiance from July 2007 to June2008. The solid line depicts thegeneral path of the data throughtime (dates are approximatebecause not all days haveconcurrent data). Light shadedareas separate fields containingthe ratio of lava on the surfaceto the total amount of lavaerupted. Dark shaded areaencompasses data with noconsistent pattern through time
716, Page 16 of 18 Bull Volcanol (2013) 75:716

Acknowledgments The authors would like to thank the diligentwork of the HVO scientists and volunteers for recording daily obser-vations at Kīlauea. Greg Vaughan (United States Geological Survey)reviewed the paper prior to submission, and Sonia Calvari, DiegoCoppola, and an anonymous reviewer produced thoughtful reviewsthat helped clarify and improve the manuscript. Koeppen and Wrightwere supported by NASA grant NNX08AF08G. This is HIGP publi-cation #2002 and SOEST publication #8876.
References
Barnes WL, Pagano TS, Salomonson VV (1998) Prelaunch characteristicsof the Moderate Resolution Imaging Spectroradiometer (MODIS) onEOS-AM1. IEEE Trans Geosci Remote Sens 36:1088–1100
Carn SA, Lopez TM (2011) Opportunistic validation of sulfur dioxidein the Sarychev Peak volcanic eruption cloud. Atmos Meas Tech4:1705–1712
Cervelli PF, Miklius A (2003) The shallow magmatic system of Kīlaueavolcano. In: Heliker C, Swanson DA, Takahashi TJ (eds) The Pu‘u‘Ō‘ō–Kūpaianaha eruption of Kīlauea volcano, Hawai‘i: the first20 years. USGS Professional Paper 1676, pp 149–164
Elias T, Sutton AJ, Stokes JB, Casadevall TJ (1998) Sulfur dioxideemission rates of Kīlauea volcano, Hawai‘i, 1979–1997. USGeological Survey Open-File Report 98-462, 40 pp
Elias T, Sutton AJ (2002) Sulfur dioxide emission rates from Kīlaueavolcano, Hawai‘i, an update: 1998–2001. US Geological SurveyOpen-File Report 02-460, 10 pp
Elias T, Sutton AJ (2007) Sulfur dioxide emission rates from Kīlaueavolcano, Hawai‘i, an update: 2002–2006. US Geological SurveyOpen-File Report 2007-1114, 37 pp
Harris AJL, Flynn LP, Keszthelyi L, Mouginis-Mark PJ, Rowland SK,Resing JA (1998) Calculation of lava effusion rates from LandsatTM data. Bull Volcanol 60:52–71
Harris AJL, Dehn J, Calvari S (2007) Lava effusion rate definition andmeasurement: a review. Bull Volcanol 70:1–22
Heliker C, Mattox TN (2003) The first two decades of the Pu‘u ‘Ō‘ō–Kupaianaha eruption: chronology and selected bibliography. In:Heliker C, Swanson DA, Takahashi TJ (eds) The Pu‘u ‘Ō‘ō–Kūpaianaha eruption of Kīlauea volcano, Hawai‘i: the first20 years. USGS Professional Paper 1676, pp 1–28
Heliker CC, Mangan MT, Mattox TN, Kauahikaua JP, Helz RT (1998)The character of long-term eruptions: inferences from episodes50–53 of the Pu‘u ‘Ō‘ō–Kūpaianaha eruption of Kīlauea Volcano.Bull Volcanol 59:381–393
Heliker C, Kauahikaua J, Sherrod DR, Lisowski M, Cervelli P (2003)The rise and fall of Pu‘u ‘O‘o cone, 1983–2002. In: Heliker C,Swanson DA, Takahashi TJ (eds) The Pu‘u ‘Ō‘ō–Kūpaianahaeruption of Kīlauea volcano, Hawai‘i: the first 20 years. USGSProfessional Paper 1676, pp 29–52
Hon KA, Kauahikaua JP, Denlinger RP, Mackay K (1994)Emplacement and inflation of pahoehoe sheet flows; observationsand measurements of active lava flows on Kilauea volcano.Hawaii Geol Soc Am Bull 106:351–370
Houghton BF, Swanson DA, Carey RJ, Rausch J, Sutton AJ (2011)Pigeonholing pyroclasts: insights from the 19 March 2008 explo-sive eruption of Kilauea volcano. Geology 39:263–266
Kauahikaua JP, Mangan MT, Heliker CC, Mattox TN (1996) A quanti-tative look at the demise of a basaltic vent; the death of Kūpaianaha,Kīlauea Volcano, Hawai‘i. Bull Volcanol 57:641–648
Kauahikaua J, Sherrod DR, Cashman KV, Heliker C, Hon K, MattoxTN, Johnson JA (2003) Hawaiian lava-flow dynamics during thePu‘u ‘Ō‘ō–Kūpaianaha eruption: a tale of two decades. In:Heliker C, Swanson DA, Takahashi TJ (eds) The Pu‘u ‘Ō‘ō–
Kūpaianaha eruption of Kīlauea volcano, Hawai‘i: the first20 years. USGS Professional Paper 1676, pp 63–88
Kauahikaua J (2007) Lava flow hazard assessment, as of August 2007,for Kīlauea east rift zone eruptions, Hawai‘i Island. USGeological Survey Open File Report 2007-1264, 12 pp
Kaufman YJ, Justice CO, Flynn LP, Kendall JD, Prins EM, GiglioL, Ward DE, Menzel WP, Setzer AW (1998) Potential globalfire monitoring from EOS-MODIS. J Geophys Res 103:32215–32238
Koeppen WC, Pilger E, Wright R (2010) Time series analysis ofinfrared satellite data for detecting thermal anomalies: a hybridapproach. Bull Volcanol 73:577–593
Mattox TN, Heliker CC, Kauahikaua JP, Hon KA (1993) Developmentof the 1990 Kalapana flow field, Kīlauea Volcano, Hawai‘i. BullVolcanol 55:407–413
Orr TR (2011) Lava tube shatter rings and their correlation withlava flux increases at Kīlauea volcano, Hawai‘i. BullVolcanol 73:335–346
Orr TR, Patrick MR (2009) What has driven degassing events duringthe 2008–2009 summit eruption of Kīlauea volcano, Hawai‘i?Abstract V32G-2330 presented at 2009 Fall Meeting, AGU, SanFrancisco, CA, 14–18 December
Orr TR, Patrick MR, Wooten KM, Swanson DA, Elias T, Sutton J,Wilson DC, Poland MP (2008) Explosions, tephra, and lava: achronology of the 2008 summit eruption of Kilauea volcano,Hawai'i. Abstract #V11B-2018 presented at 2008 Fall Meeting,AGU, San Francisco, CA, 15–19 December
Patrick MR, Orr T (2011) Rootless shield and perched lava pondcollapses at Kīlauea Volcano. Hawai'i Bull Volcanol 74:67–78
Patrick MR, Orr T, Wilson D, Dow D, Freeman R (2011) Cyclesof spattering, seismic tremor and surface fluctuation within aperched lava channel, Kīlauea volcano. Bull Volcanol73:639–653
Pergola N, Marchese F, Tramutoli V (2004) Automated detection ofthermal features of active volcanoes by means of infrared AVHRRrecords. Remote Sens Environ 93:311–327
Pergola N, Giuseppe DA, Lisi M, Marchese F, Mazzeo G,Tramutoli V (2009) Time domain analysis of robust satellitetechniques (RST) for near real-time monitoring of activevolcanoes and thermal precursor identification. Phys ChemEarth 34:380–385
Poland M, Miklius A, Orr T, Sutton J, Thornber C, Wilson D (2008)New episodes of volcanism at Kilauea Volcano Hawaii. Eos (AmGeophys Union Trans) 89(5):37–38
Poland M, Miklius A, Lundgren P, Sutton AJ (2011) Transient defla-tion–inflation cycles at Kilauea volcano, Hawaii: what’s up (anddown) with that? Abstract V51G-01 presented at 2011 FallMeeting, AGU, San Francisco, CA, 5–9 December
Poland M, Miklius A, Sutton AJ, Thornber CR (2012) A mantle-drivensurge in magma supply to Kīlauea Volcano during 2003–2007.Nature Geosci 5:238–239
Prata AJ, Bluth GJS, Werner C, Realmuto VJ, Carn SA, Watson IM(2013) Gas emissions from volcanoes. In: Dean KG, Dehn J (eds)Monitoring volcanoes in the North Pacific: observations fromspace. Springer-Praxis Books, Chichester
Steffke A, Harris AJL, Burton MR, Caltabiano T, Salerno GG (2011)Coupled use of COSPEC and satellite measurements to define thevolumetric balance during effusive eruptions at Mt. Etna Italy. JVolcanol Geotherm Res 205:47–53
Sutton AJ, Elias T, Gerlach TM, Stokes JB (2001) Implications foreruptive processes as indicated by sulfur dioxide emissions fromKīlauea Volcano, Hawai‘i, 1979–1997. J Volcanol Geotherm Res108:283–302
Sutton AJ, Elias T, Kauahikaua J (2003) Lava-effusion rates for thePu‘u ‘Ō‘ō–Kūpaianaha eruption derived from SO2. In: Heliker C,
Bull Volcanol (2013) 75:716 Page 17 of 18, 716

Swanson DA, Takahashi TJ (eds) The Pu‘u ‘Ō‘ō–Kūpaianahaeruption of Kīlauea volcano, Hawai‘i: the first 20 years. USGSProfessional Paper 1676, pp 137–148
Sutton AJ, Elias T, Gerlach T, Lee R, Miklius A, Poland MP, WernerCA, Wilson D (2009) Volatile budget of Kilauea volcano receivesstimulus from the magma bank. Abstract V52B-08 presented at2009 Fall Meeting, AGU, San Francisco, CA, 14–18 December
Thornber CR, Heliker C, Sherrod DR, Kauahikaua JP, Miklius A,Okubo PG, Trusdell FA, Budahn JR, Ridley WI, Meeker GP(2003) Kīlauea east rift zone magmatism: an episode 54 perspec-tive. J Petrology 44:1525–1559
Wilson D, Elias T, Orr T, Patrick M, Sutton J, Swanson D (2008) Smallexplosion from new vent at Kīlauea’s summit. EOS, TransactionsAmerican Geophysical Union 89(22):203
Wolfe EW, Neal CA, Banks NG, Duggan TJ (1988) Geologicobservations and chronology of eruptive events. In: WolfeEW (ed) The Pu‘u ‘Ō‘ō eruption of Kīlauea volcano,Hawai‘i, episodes 1–20. US Geological Survey ProfessionalPaper 1463, pp 1–97
Wright R, Blake S, Harris AJL, Rothery DA (2001) A simple expla-nation for the space-based calculation of lava eruption rates. EarthPlanet Sci Lett 192:223–233
Wright R, Flynn L, Garbeil H, Harris A, Pilger E (2002) Automatedvolcanic eruption detection using MODIS. Remote Sens Environ82:135–155
Wright R, Flynn L, Garbeil H, Harris A, Pilger E (2004) MODVOLC:near-real-time thermal monitoring of global volcanism. J VolcanolGeotherm Res 153:29–49
716, Page 18 of 18 Bull Volcanol (2013) 75:716