Constraints on the LAB from Seismology, Petrology and Geodynamics/Mineral Physics
27
Constraints on the LAB from Seismology, Petrology and Geodynamics/Mineral Physics www.physicalgeography.net/ fundamentals/10h .html A. Bengston, M. Blondes, M. Collier, J. Gaherty, T. Höink, M. Jiang, E. Kite, C.-T. Lee, A. Levander, J. Li, Q. Li, P. Luffi, M. Manga, M. Miller, J. Naliboff, T.-L. Tseng, D. Weeraratne, Y. Xu, T. Yano, Z. Yang, Y. Zhang
-
Upload
bethany-ellison -
Category
Documents
-
view
44 -
download
1
description
Constraints on the LAB from Seismology, Petrology and Geodynamics/Mineral Physics. - PowerPoint PPT Presentation
Transcript of Constraints on the LAB from Seismology, Petrology and Geodynamics/Mineral Physics

Constraints on the LAB from Seismology, Petrology and
Geodynamics/Mineral Physics
www.physicalgeography.net/ fundamentals/10h.html
A. Bengston, M. Blondes, M. Collier, J. Gaherty, T. Höink, M. Jiang, E. Kite, C.-T. Lee, A. Levander, J. Li, Q. Li, P. Luffi, M. Manga, M. Miller, J. Naliboff, T.-L. Tseng, D. Weeraratne, Y. Xu, T. Yano, Z. Yang, Y. Zhang

Understanding the nature of the lithosphere-asthenoshpere boundary (LAB)
Partial melting in the asthenosphere
Wet/damp asthenosphere Solid state anelastic effects
Stixrude and Lithgow-Bertelloni 2005Hirth and Kohlstedt 1996
ZLAB
ZbaseZ
T
Hypotheses

H0: The Asthenosphere results from solid-state anelasticity.H1: The Asthenosphere is partially molten.
Establish reference model for solid state(anharmonicity and
anelasticity )
Refine estimates of Q beneath ocean basins=
?
Petrologic constraints on the origin depths of
magmas
Seismic constraints on depth of LVZ=
?
Geodynamics of a low viscosity channel (solid state creep reference)
Dynamic Topography Modeling

Melting depths vs seismic lid (also dynamic topography
and surface heat flow)
Observed Q vs theoretical Q
Geodynamics

Testing LVZ Hypotheses with Thermodynamically Calculated Seismic
Velocities and Estimates of Q
Input (P,T,C)
Calculate equilibrium phase assemblages & elastic constants
Test null hypothesis by comparing calculated seismic velocities with Q corrections to seismic observations.

Null Hypothesis for LVZ
• For a given composition and temperature, solid-state anhydrous processes can explain the low-velocity zone observed in some regions beneath the lithosphere.
• Solid-state processes:– Attenuation related to anelasticity– Seismic anisotropy related to solid-state dislocation creep.
• Estimates of attenuation in the upper mantle:– Romanowicz (1995)*, Faul and Jackson (2005), this group.

Stixrude and Lithgow-Bertelloni, JGR 2005
Solid-State LVZ?

Tan&Helmberger(2007)
Estimate Q models for LVZ under West Pacific
Data Source: 30 events with intermediate depth

6 different Q models with PA5 as velocity model:
Q30
Q50g
Q50 (original PA5)
Q70g
Q70
Q90g
Example of synthetic/observed seismograms with pa5_Q50 model
PA5 velocity model

Preliminary Result: High Q in West Pacific?Preliminary Result: High Q in West Pacific?
Test of data sensitivity to Q in LVZ
Synthetic SS/S ratios, relative to Q50
More sensitive to Q
Q30 Q50g Q50 Q70g Q70 Q90g
Residual Sum
13.2 12.6 9.2 9.7 7.4 7.8
Observed SS/S ratios relative to Q models

Japan

Non-Plume Intraplate Magmas near Japan
MotivationsPartial melting in asthenosphere or plume?
Hirano et al., 2006

Pressure ~ MORB
Temperature ~ MORB
Consistent with plate model -- Not plume
Inferred Pressure and Temperature

How to get the melt Up?
Modified from Garcia-Castellanos 2000
Current stress pattern (fps) consistent with the model prediction
Extension predicted by slab pull model
The extension may facilitate the melt rising up

Western USA

QuickTime™ and aTIFF (Uncompressed) decompressor
are needed to see this picture.
QuickTime™ and aTIFF (Uncompressed) decompressor
are needed to see this picture.
QuickTime™ and aTIFF (Uncompressed) decompressor
are needed to see this picture.
Teleseismic S wave
59 events
556 stations

QuickTime™ and aTIFF (Uncompressed) decompressor
are needed to see this picture.
Sdp SRF vs PRF
Pds
Moho
Moho
LAB
LAB

QuickTime™ and aTIFF (Uncompressed) decompressor
are needed to see this picture.
Latitude 37 deg
Moho
LAB
QuickTime™ and aTIFF (Uncompressed) decompressor
are needed to see this picture.
Longitude -119 deg
Moho
LAB
QuickTime™ and aTIFF (Uncompressed) decompressor
are needed to see this picture.
QuickTime™ and aTIFF (Uncompressed) decompressor
are needed to see this picture.
Sierra drip
Zandt Nature 2004

Basalt whole rock data from NAVDAT database
Black: all dataRed: most likely to be unaffected by petrologic complexity 1) likely not highly modified 2) likely saturated only in olivine


Viscous Radial Forces Acting on the Base of the Lithosphere ~ Dynamic Topography
Moucha et al. (2008)
Pref Plith≠ Pref Pref=Plith
E
c
c
mmm
Residual Topography = Observed topography - Isostatic Elevation (E)
m => constant, (P,TC)
Ref Lith

Variations in Isostatic Elevation
Depleted Mantle Density (kg/m3)
Isostatic
Elevation
-
Mean
Isostatic
Elevation
(meters)
63 km
45 km
30 km

Compositional and Thermal Constraints
Average Mantle Density (kg/m^3)
Residual Topography
(meters)

LZ from dynamic rheology?
flow law
simple flow:
slabplume
use rheologic flow lax + simple flow = consistent computing strategy
effective viscosity

generic dry oceanic system (dislocation creep)
60 Ma1450 K
solidus
prediction:
• developed LZ
• without melt or water
• strain rate localization
• anisotropy maximized
• descends with age
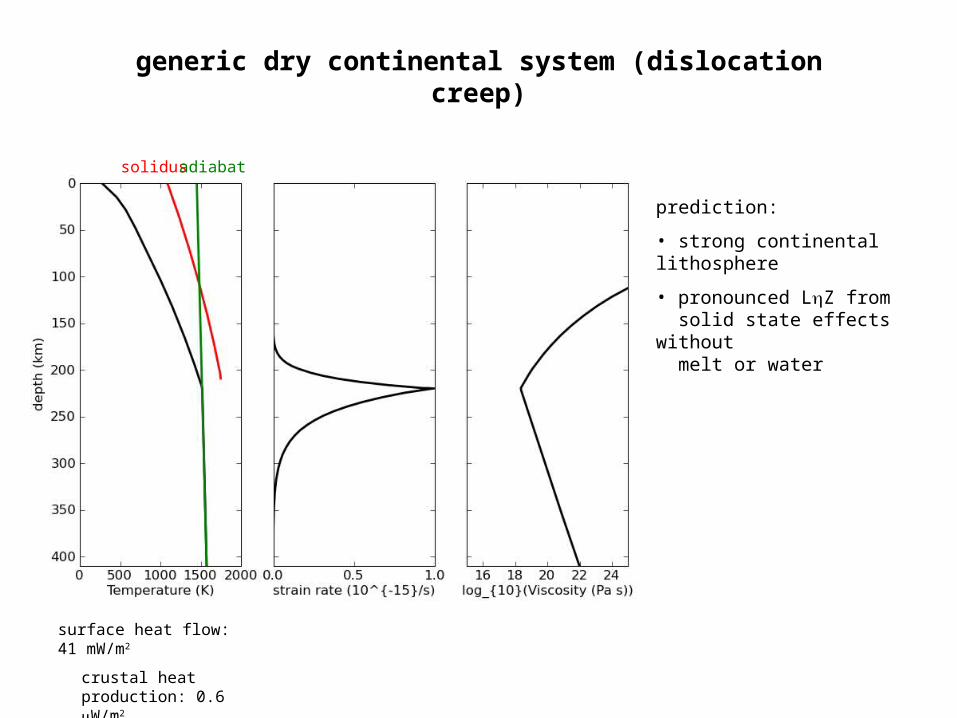
generic dry continental system (dislocation creep)
prediction:
• strong continental lithosphere
• pronounced LZ from solid state effects without melt or water
solidus adiabat
surface heat flow:41 mW/m2
crustal heat production: 0.6 W/m2

The LAB is hot, weak, produces melt (at least in some places) and might be
wet.A. Bengston, M. Blondes, M. Collier, J. Gaherty, T. Höink, M. Jiang, E. Kite, C.-T. Lee, A. Levander, J. Li, Q. Li, P. Luffi, M. Manga, M. Miller, J. Naliboff, T.-L. Tseng, D. Weeraratne, Y. Xu, T. Yano, Z. Yang, Y. Zhang