Consommation d’énergie liée au - Blogs...
75
Consommation d’énergie liée au transfert, stockage et visionnage d’une vidéo de 60s
Transcript of Consommation d’énergie liée au - Blogs...

Consommation d’énergie liée au
transfert, stockage et visionnage
d’une vidéo de 60s

STOCKAGE

Hypothèse : nouveau
modèle (Etude de 2007)
0,55 W/ TB
On a donc :
-video FullHD : 57,6 MB
-video 4K : 81 MB
FullHD : 0,55 W/TB * 57,6 MB
= 0,00003168 W
4K : 0,55 W/TB * 81 MB
= 0,00004455 W

UPLOAD
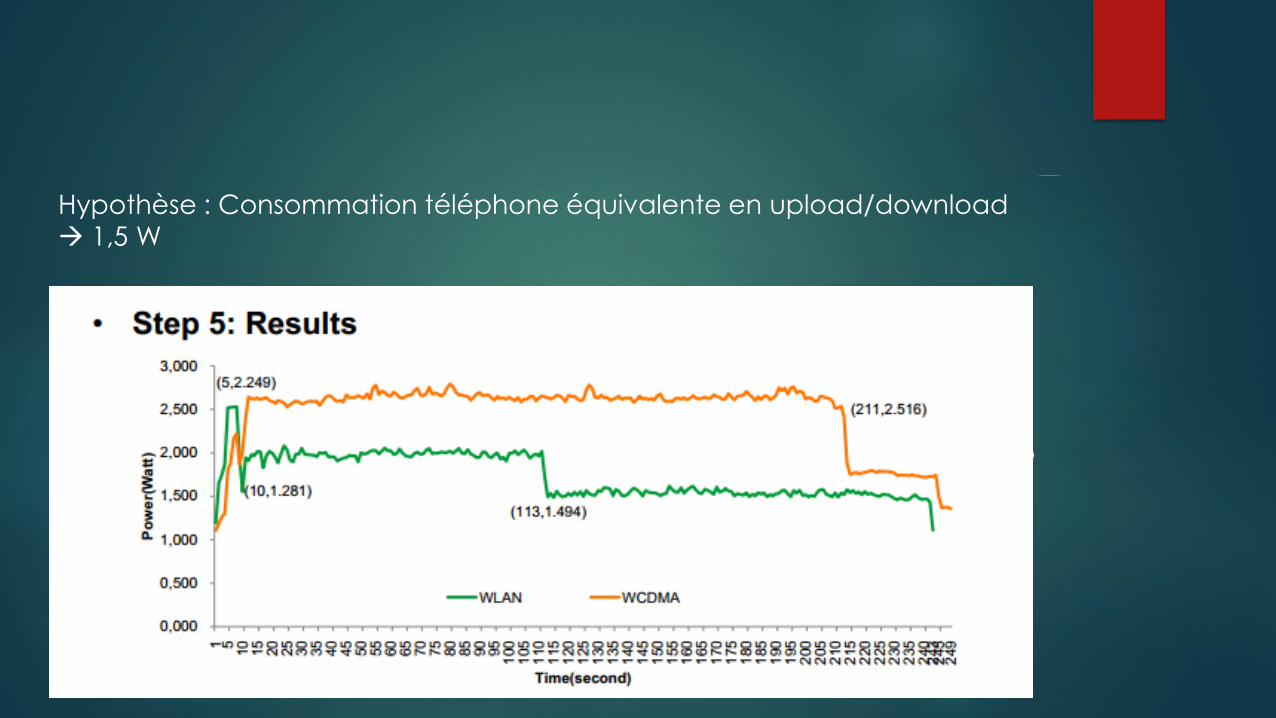
Hypothèse : Consommation téléphone équivalente en upload/download 1,5 W
Le W-CDMA est une technique de codage utilisée dans la partie radio des réseaux de téléphonie mobile UMTS.

Upload par GSM ou ordi quasi même vitesse 10 Mbps
Consommation ordinateur : 40 W
Consommation GSM : 1,5 W
Temps upload :
FullHD: 57,6 MB * 8 Mb/MB * / 10 Mbps = 46,08 s
4K: 81 MB * 8 Mb/MB * / 10 Mbps = 64,8 s
Consommation upload
Ordinateur : 40 W * 46,08s = 1843,2 J | 40 W * 64,8s = 2592 J
GSM : 1,5 W * 46,08s = 69,12 J | 1,5 W * 64,8s = 97,2 J

Visionnage : 1000 personnes
Ordinateur : 40W * 60s * 1000 = 2 400 000 J
GSM : 1,5W * 60s *1000 = 90 000 J
Mixte (50/50) = …

https://toolstud.io/video/filesize.php
Reducing Data Center Power Consumption Through Efficient
Storage by Brett Battles, Cathy Belleville, Susan Grabau, Judith
Maurier, February 2007 | WP-7010-0207 [PDF]
http://www.speedtest.net/reports/united-kingdom/#fixed
Power consumption of smartphones, Yu Xiao from Aalto University
School of Science, April 2016

Agenda
• Overview of energy causes
• Smartphone hardware architecture
• Energy-efficiency analysis
19.4.2016
Laitoksen nimi
2

Group Discussion (10 min)
19.4.2016
Laitoksen nimi
3
Hardware
• From energy perspective, what is the relationship between the
following items?
Software
User
Environment
• What are the real
energy consumers?
• What are the
impacting factors of
energy consumption?

Overview of Energy Causes
19.4.2016
Laitoksen nimi
4

• Hardware components are the real energy consumers
• Software including the OS and applications generate the
workload of computing, I/O access, encoding/decoding, and
other hardware operations.
• The work is transformed into a set of circuit activities on the
corresponding hardware components, and the circuit
activities consume energy.
19.4.2016
Laitoksen nimi
5

• In this course, we focus on software solutions, not low-
power hardware design
• How is software execution related to energy consumption of
the underlying hardware?
19.4.2016
Laitoksen nimi
6
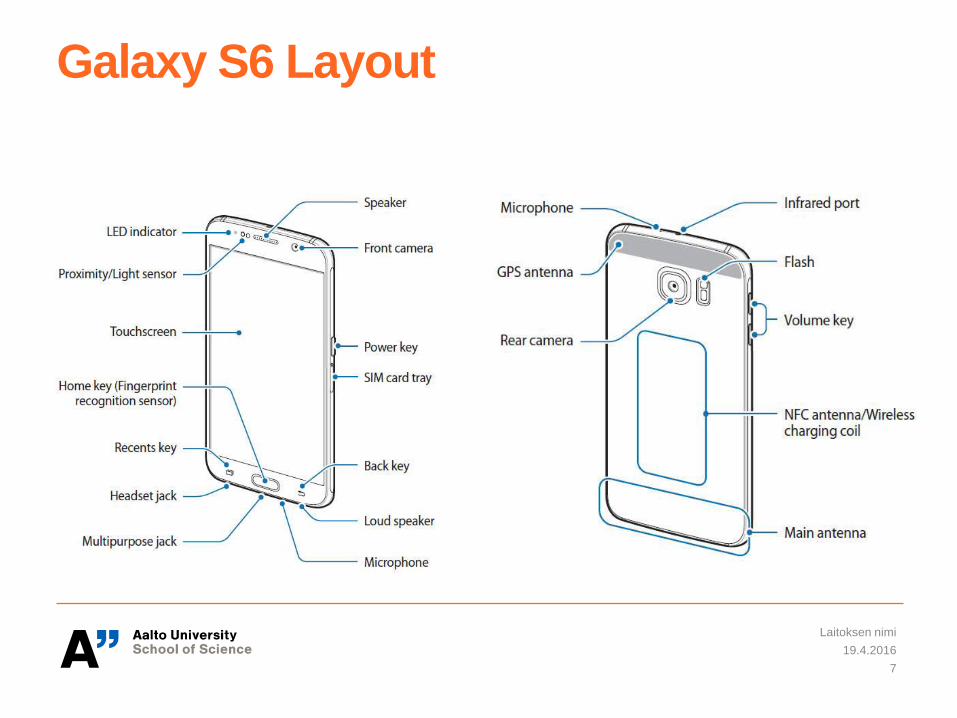
Galaxy S6 Layout
19.4.2016
Laitoksen nimi
7

A Teardown of Galaxy S6
19.4.2016
Laitoksen nimi
8
Main Printed
Circuit Board (PCB)
I/O Connector

Smartphone Hardware Architecture A System-on-Chip (SoC) architecture with 3 primary components
• An application processor which executes users’ application and related OS services
• A baseband processor which controls radio activities
• A number of peripheral devices for interacting with end users
19.4.2016
Laitoksen nimi
9
9

Application Processor
• Processor core (e.g. ARM based processor)
• Multimedia engine which is hardware implementation of one or
more multimedia standards (e.g. JPEG module, MPEG module,
audio module)
• Device interfaces which are used to communicate with
peripheral device (e.g. USB, camera, display)
19.4.2016
Laitoksen nimi
10

Baseband Processor • It has a communication protocol stack which enables different types
of wireless technologies, such as LTE, WCDMA, Wi-Fi, and
Bluetooth.
• It provides radio communication related functions: signal modulation,
RF shifting, encoding/decoding, and etc.
19.4.2016
Laitoksen nimi
11
RF front end: receiving and
transmitting on different frequencies

• In many ways, the SoC defines what a smartphone can and can’t do,
plus it determines the device’s performance and battery efficiency.
• At the moment there are four major smartphone SoC makers
− Qualcomm, with its Snapdragon range
− Samsung with its Exynos chips
− MediaTek with its MT and Helio processors
− Huawei’s Kirin chips made by its subsidiary HiSilicon.
19.4.2016
Laitoksen nimi
12

Examples
19.4.2016
Laitoksen nimi
13
Exynos 7420 (Galaxy S6) Snapdragon 801
Architecture ARMv8-A (32 & 64 bit) ARMv7-A (32 bit)
CPU cores 4x ARM Cortex-A57 +
4x Cortex-A53
(big.LITTLE with GTS)
4x Krait 400
CPU clock A57 - 2.1GHz
A53 - 1.5GHz
Up to 2.45GHz
GPU ARM Mali-T760 MP8 Adreno 330
GPU clock 772 MHz 578 GHz
RAM support 1552MHz LPDDR4 LPDDR3 933MHz 32-bit
Process 14nm FinFET 28nm

19.4.2016
Laitoksen nimi
14
Recommended Reading List
Up close and personal: how the Samsung Galaxy S6
uses its octa-core processor
http://www.androidauthority.com/galaxy-s6-octa-core-
processor-usage-617585/
19.4.2016
Laitoksen nimi
15
What is your smartphone?
• Which processors does it use?
• Does it have a dedicated GPU?
• How much storage does it have?
• What peripheral devices does it have?
19.4.2016
Laitoksen nimi
16

How to analyze energy efficiency of mobile software?
19.4.2016
Laitoksen nimi
17

Overview of Energy Causes
19.4.2016
Laitoksen nimi
18

Given an app, we would like to know
• How much energy is being consumed by the phone while running the application?
• Which operations are power hungry? Why are they power hungry? Is it due to heavy CPU processing, wireless networking, always-on display, intensive sensing, or other factors?
• Does the energy consumption vary with the operating status of the phone, the networking environment, the order of the user operations, and the location?
19.4.2016
Laitoksen nimi
19

How to analyze energy-efficiency
Software design &
implementation
Workload (type, size, pattern)
Hardware activities
Energy Consumption
19.4.2016
Laitoksen nimi
20
Environment(
e.g. network
conditions)
Power
measurement

Group Discussion (10 min)
Software design &
implementation
Workload (type, size, pattern)
Hardware activities
Energy Consumption
19.4.2016
Laitoksen nimi
21
Environment(
e.g. network
conditions)
Power
measurement Which operations are power hungry?
How is the energy consumption affected by the
environment?

Overview of Energy-efficiency Analysis
Software design &
implementation
Workload (type, size, pattern)
Hardware activities
Energy Consumption
19.4.2016
Laitoksen nimi
22
Environment(
e.g. network
conditions)
Power
measurement
Log of
software
operations

Overview of Energy-efficiency Analysis
Software design &
implementation
Workload (type, size, pattern)
Hardware activities
Energy Consumption
19.4.2016
Laitoksen nimi
23
Measurement
of CPU usage,
network traffic
traces, etc.
Power
measurement
Log of
software
operations
Environment(
e.g. network
conditions)
Context
monitoring
(e.g. signal
strength)

What is a power model?
It is a mathematical model that describes the relationship between power
consumption and …
Examples:
• Processor power ~ instruction (V.Tiwari et al.)
• Processor power ~ Hardware performance counters(HPC) (K.Singh et al., B.C.Lee et al. , C. Isci et al., B. Goel et al., D.Brooks et al.)
• Wireless transmission cost ~ network throughput (Y.Xiao et al.)
• ...
A power model can be built for a whole device, a certain hardware
component, or a software component.
19.4.2016
Laitoksen nimi
24

Example Energy Model
• An energy model can be formulated as follows for a component
based system:
𝑦 𝑡 = 𝑓 𝑥1 𝑡 , 𝑥2 𝑡 , … , 𝑥𝑛 𝑡 ,
where y(t) represents the energy draw in the time interval t, and the
functions 𝑥1 𝑡 , 𝑥2 𝑡 , … , 𝑥𝑛 𝑡 represent the component level
behaviors.
• The function f can be linear or non-linear.
• The overall energy drain for a given time period can be obtained
by integrating y(t) over the period.
19.4.2016
Laitoksen nimi
25

Overview of Energy-efficiency Analysis
Software design &
implementation
Workload (type, size, pattern)
Hardware activities
Energy Consumption
19.4.2016
Laitoksen nimi
26
Measurement
of CPU usage,
network traffic
traces, etc.
Power
measurement
Log of
software
operations
Environment(
e.g. network
conditions)
Context
monitoring
(e.g. signal
strength)

How to build a power model?
Statistical power modelling
Finding out the relationship between power consumption and the model
variables based on statistical models like linear regression.
The variables of statistical power models can be application-specific
parameters, hardware performance metrics, and other variables that are
related to power consumption.
19.4.2016
Laitoksen nimi
27
).(125.0
)(3822.0)(0015.0
)(0011.0)(0606.0
)(0815.0)(2474.07655.0)(
2020
19191818
171722
1100
xg
xgxg
xgxg
xgxgWPower

How to build a power model? Deterministic power modelling
map software operations to hardware activities based on expert knowledge and to estimate the power consumed by the hardware components involved based on their activities
19.4.2016
Laitoksen nimi
28
SLEEP
PS
TRANSMIT
PT
IDLE PI
RECEIVE PR
PSM
Timeout
For example, power consumption behavior
of a Wi-Fi interface can be described with a
power state machine.
The Power(W) in each state is measured
and used for calculating the variable
coefficient.

Why do we need power models? Power models can be used for estimating power
consumption
Power models quantify the impact of different influcing
factors. They can provide hints on how to reduce energy
consumption.
19.4.2016
Laitoksen nimi
29

Power Measurement
19.4.2016
Laitoksen nimi
30

Measurement Methods
• Hardware-based: using physical power meters
• Software-based: getting battery usage information through
APIs
19.4.2016
Laitoksen nimi
31

Can I measure the power consumption of each hardware component?
19.4.2016
Laitoksen nimi
32

Component-level Power Measurement
• Requires information about power distribution network at
the circuit level
• Only a few off-the-shelf devices can be measured on
component-level
e.g. Openmoko Neo Freerunner
It has a debug port with complete
access to low-level hardware.
19.4.2016
Laitoksen nimi
33
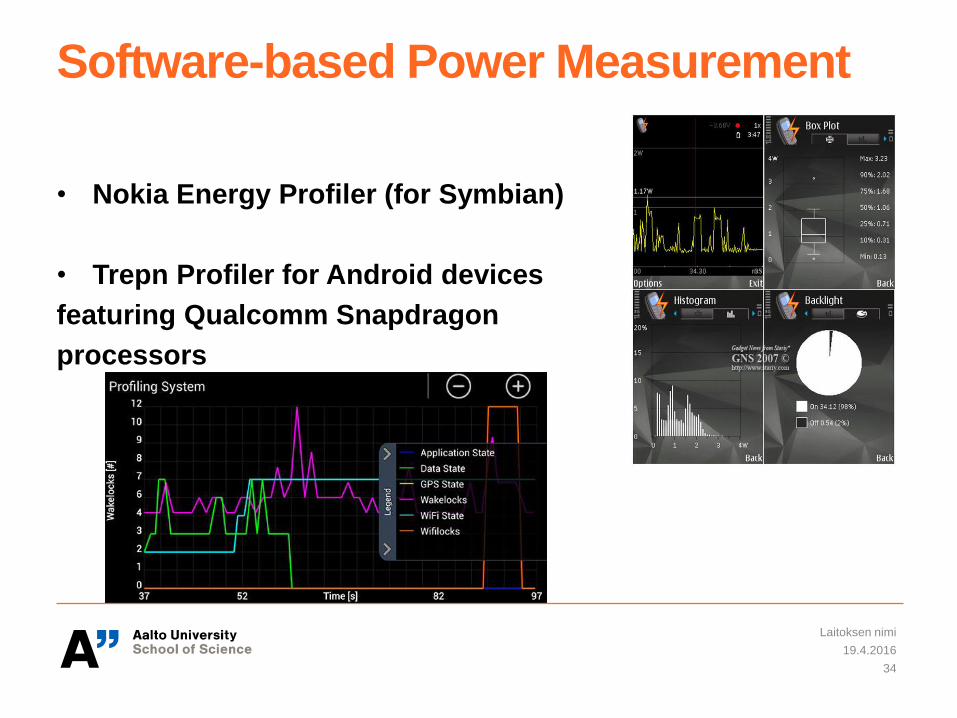
Software-based Power Measurement
• Nokia Energy Profiler (for Symbian)
• Trepn Profiler for Android devices
featuring Qualcomm Snapdragon
processors
19.4.2016
Laitoksen nimi
34

Software-based Power Measurement
• Smart battery APIs
A smart battery is a battery that has special hardware for monitoring its internal state and environment
The monitoring hardware usually estimates voltage, current, and temperature of the battery
Smartphone OS and its drivers can access these values through a low-power serial bus
19.4.2016
Laitoksen nimi
35

Overview of Smartphone Battery APIs
19.4.2016
Laitoksen nimi
36
SOC: state of charge which gives the remained battery capacity in percentage.
Cycle count: the number of charge/discharge cycles

Example Smart Battery Interfaces
19.4.2016
Laitoksen nimi
37

Hardware-based Power Measurement
Strengths:
• High sampling frequency
• Does not cause energy overhead
Weakness:
• Not feasible for power measurement in mobility scenarios
• Require special hardware
19.4.2016
Laitoksen nimi
38

Limitations of Software-based Power Measurement
• The required information may not be available, namely the
current.
• Update rate of the battery status is low
• The readings of the smart battery interface are not accurate
19.4.2016
Laitoksen nimi
39
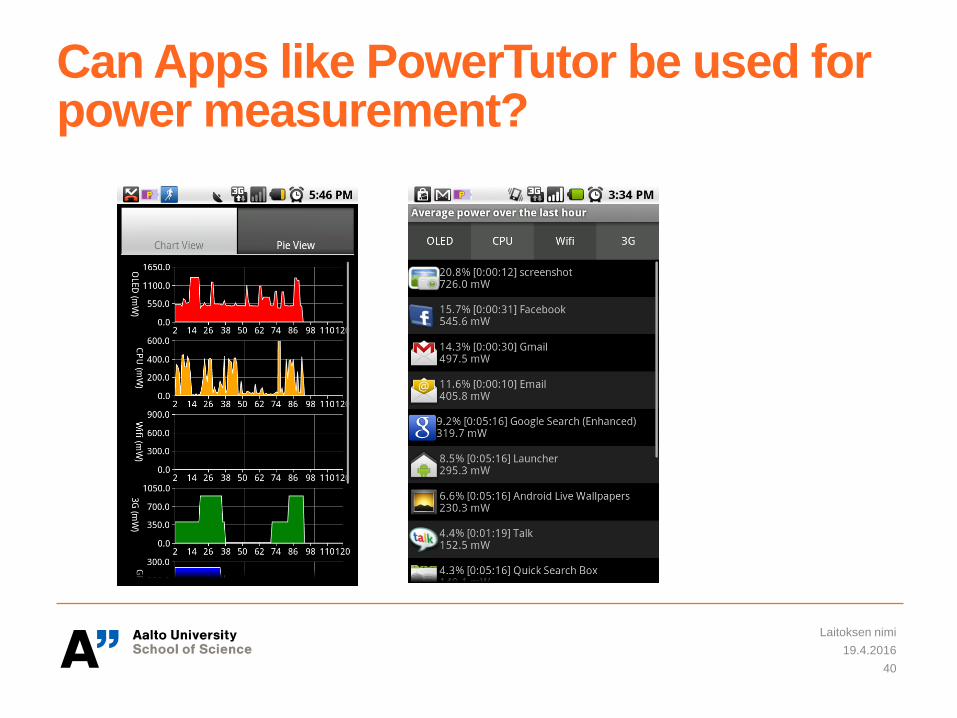
Can Apps like PowerTutor be used for power measurement?
19.4.2016
Laitoksen nimi
40

• Not all energy profiling software can provide ground truth of
power consumption
• Accuracy of model-based energy profilers like PowerTutor
depends on the accuracy of the power models in use
• Power models are usually hardware specific, which means
the models built for Phone Model A may not be applied to
Phone Model B
19.4.2016
Laitoksen nimi
41

Case Study
19.4.2016
Laitoksen nimi
42

Case 1: Idle Power
• How do you define an idle or standby state?
19.4.2016
Laitoksen nimi
43
Wi-Fi scanning Off
Wi-Fi 1) Off
2) On(no traffic)*
3G/LTE 1) Remove SIM card
2) Idle(no traffic)*
Display
1)Turn off
2)Turn on with a fixed brightness level*
Background
Services
Stopped
Sensors(e.g. GPS) Off
CPU frequency Fixed (no change in frequency during measurement)

Idle Power of Samsung Nexus S
Samsung Nexus S (Wi-Fi IDLE)
19.4.2016
Laitoksen nimi
44
CPU Freq Display Power(W)
100MHz Off 0.213
200MHz Off 0.435
100MHz On 0.742
200MHz On 0.800
400MHz On 0.890
In a study of Wi-Fi transmission
cost, we notice
-- when the display is off, the CPU
freq increases from 100MHz to
200MHz whenever the data
sending rate increases from
256KBps to 512KBps.
-- due to CPU partial wakelock,
the data rate cannot go over
512KBps if the display is off.

Case 2: watch YouTube video online
How would you analzye the power consumption of a YouTube
client? Assume that the client is open source and you can use
either Wi-Fi, 3G or LTE network. You can use the physical
power meter in our lab for power measurement.
Group Discussion(12min)
19.4.2016
Laitoksen nimi
45

Guideline for Group Discussion
1) Design criteria and description of test cases (e.g. what kind of power
consumption behavior do you want to study through these test cases?
Are your test cases sufficient?)
Hints: operations of the applications? environment?
2) Measurement metrics you choose(e.g. Power(W), Energy(J), unit cost,
energy utility)
3) Experiment setup (e.g. how do you measure power consumption? How
do you set up network connection? How do you monitor network traffic?)
19.4.2016
Laitoksen nimi
46

Case 2: watch YouTube video online
• Step 1
What happen after a video request is sent from the phone?
How is video delivered from YouTube server to the phone?
When can playback start?
19.4.2016
Laitoksen nimi
47

Case 2: watch YouTube video online
• Step 1
What happen after a video request is sent from the phone?
19.4.2016
Laitoksen nimi
48

Case 2: watch YouTube video online
• Step 1
How is video delivered from YouTube server to the phone?
When can playback start?
19.4.2016
Laitoksen nimi
49
Figure: I/O graph of YouTube traffic (Byte/tick)
Small but regular bursts Big burst

Case 2: watch YouTube video online
• Online YouTube viewing includes 3 stages: download only,
download+playback, playback only
• Step 2: design test cases
How much energy is consumed by video download? How much is cost by video playback?
Is it more energy-efficient to use WiFi than 3G?
19.4.2016
Laitoksen nimi
50

Example Test Cases
19.4.2016
Laitoksen nimi
51
Test Case Network Storage
Online view via WCDMA 3G Cache
Online view via 802.11g Wi-Fi Cache
Download-and-play via WCDMA 3G Phone memory
Download-and-play via 802.11g Wi-Fi Phone memory
Playback from phone memory Disabled Phone memory
Playback from flash drive Disabled Flash drive
Replay Disabled Cache

Case 2: watch YouTube video online
• Step 3: Metrics
Energy cost (J)
Average Power(W) during each stage
Duration(s)
• Step 4: Experiment Setup
Network connectivity
Software-based power measurement
Settings of Wi-Fi AP
Logging of software operations
Monitoring of network signal strength
19.4.2016
Laitoksen nimi
52

Case 2: watch YouTube video online
• Step 5: Results
19.4.2016
Laitoksen nimi
53
(5,2.249)
(10,1.281)
(113,1.494)
(211,2.516)
0,000
0,500
1,000
1,500
2,000
2,500
3,000
1 510
15
20
25
30
35
40
45
50
55
60
65
70
75
80
85
90
95
10
010
511
011
512
012
513
013
514
014
515
015
516
016
517
017
518
018
519
019
520
020
521
021
522
022
523
023
524
024
324
524
9
Po
wer(
Watt
)
Time(second)
WLAN WCDMA
Results of Test Case 1&2 show that it is more energy-efficient
to use WiFi than 3G

Case 2: watch YouTube video online
• Step 6: Discussions
3G Tail Energy
If you would like to learn more about this case, please refer to
Yu Xiao; Kalyanaraman, R.S.; Yla-Jaaski, A., "Energy Consumption of Mobile YouTube:
Quantitative Measurement and Analysis," NGMAST '08. pp.61,69, 16-19 Sept. 2008
19.4.2016
Laitoksen nimi
54
0,00
0,20
0,40
0,60
0,80
1,00
1,20
1 6 11 16 21 26 31 36 41 46 51 56
Po
wer(
Watt
)
Time(second)
CELL_FACH
CELL_PCH
CELL_DCH

Case 2: watch YouTube video online
geographic and temporal variation
Video codec/encoding rate/resolution ~ playback cost
Location of the YouTube server ~ download cost
19.4.2016
Laitoksen nimi
55

Summary
• Overview of energy causes
• Smartphone hardware architecture
• Overview of energy-efficiency analysis and basics of power
modelling
• Case Study: How to analyze power consumption of YouTube
19.4.2016
Laitoksen nimi
56

• Reading sessions
19.4.2016
Laitoksen nimi
57

Guideline for Paper Reading
1) Overview of the paper
2) Design criteria and description of test cases
3) Measurement metrics
4) Experiment design
5) Experiment results (how do they analyze and present the results?)
6) Limitations of the work
19.4.2016
Laitoksen nimi
58

NETAPP VISION SERIES
REDUCING DATA CENTER POWER CONSUMPTION THROUGH EFFICIENT STORAGE Brett Battles, Cathy Belleville, Susan Grabau, Judith Maurier | February 2007 | WP-7010-0207
AN EIGHT-POINT PLAN FOR FIGHTING POWER CONSUMPTION The NetApp approach to fighting rapidly growing power consumption is simple: subtract machines and disks from the power equation by using storage more efficiently. This strategy has many corollary benefits: it lowers complexity, lowers people costs, lowers support and service costs, and improves network efficiency and performance. The NetApp eight-point strategy for reducing storage power consumption makes use of today’s technology to halt power growth at its source.

Reducing Datacenter Power Consumption Through Efficient Storage 2
TABLE OF CONTENTS
HITTING THE LIMITS ................................................. 3
THE NETAPP EIGHT-POINT PLAN FOR FIGHTING POWER CONSUMPTION......................... 4
1 Consolidate Servers and Storage .. . .4 2 Use Higher-Capacity Drives .. . . . . . . . . . .4 3 Protect Against Disk Failures
with Fewer Drives.. . . . . . . . . . . . . . . . . . . . . . . . . .5 4 Migrate Data to More Eff icient
Storage .. . . . . . . . . . . . . . . . . . . . . . . . . . . . . . . . . . . . . . . . .5 5 Increase Uti l ization .. . . . . . . . . . . . . . . . . . . . . . .5 6 Backup: Do More with Less .. . . . . . . . . . .6 7 Eliminate Storage Overhead for
Testing and Development . . . . . . . . . . . . . . .6 8 Measure Your Power Eff iciency .. . . . .6
LOOKING AHEAD ...................................................... 7
THE NETAPP COMMITMENT.................................... 7
FURTHER READING.................................................. 8

Reducing Datacenter Power Consumption Through Efficient Storage 3
HITTING THE LIMITS Exponential data growth is a reality for most data centers. IDC Worldwide Disk Storage Systems Forecast 2006–2010 predicts that worldwide data will grow at a compound annual growth rate of 50.6% through the decade. This growth is a huge concern for IT managers. Until recently, continuous improvements in price-performance and $/GB have made it both easy and affordable to solve storage concerns simply by adding more disks to existing storage systems. However, IT executives are discovering that there are limits to that easy growth: floor space, weight loads, rack space, network drops, power connections, cooling infrastructure, and even power itself are finite resources. Hitting any one of these limits significantly jeopardizes the ability of IT to meet the demands of business.
Hitting the Fan Cooling is inextricably linked to power consumption. Every watt of power that enters the data center generates heat that must be removed from the environment—and to do so takes more power. As the heat increases, systems become more unstable and component failure rates rise. The cost of power to cool a system often is as much as powering the system itself.
But cost is not the only issue. In some cases, rack densities generate more heat than existing cooling infrastructures can handle. Where there is no room for additional cooling infrastructure, there is no room for growth.
Power Hungry Storage companies have been steadily increasing storage density, inadvertently driving up data center power demands and cooling concerns. In the next 18 months, increases in average storage rack density are expected to drive average power consumption from 2kW per rack to 30kW per rack—and that’s only half the story. For each watt used by the server or storage, A/C, power supplies, and other related equipment together require nearly 1.5 times that amount.
Putting Business at Risk The combined effect of recent increases in the price of energy and the adoption of denser computing and storage architectures has driven energy costs for some data centers to 30% of their total operating budgets. If left unchecked, the cost to power IT equipment could exceed its acquisition cost in a matter of years. Without deliberate action, high energy costs will cripple an IT department’s ability to grow and change in support of the demands of the business.
The Greening of Storage Environmental issues are gaining serious commercial momentum and, fueled by the growing number of local and global green initiatives, they are rising ever more insistently up the corporate agenda. More power-efficient storage solutions provide for business growth while saving power. Every watt of energy saved in the data center is a watt that is removed from an organization’s carbon footprint and the global warming equation.
A WATT IN MEANS A WATT OUT
“We’re at 100% of power capacity today. For every new watt I bring in, I’ve got to figure out how to take one out.”
IT exec
Global Financial Services Company
New York City

Reducing Datacenter Power Consumption Through Efficient Storage 4
THE NETAPP EIGHT-POINT PLAN FOR FIGHTING POWER CONSUMPTION The NetApp approach to fighting rapidly growing power consumption is simple: subtract machines and disks from the power equation by using storage more efficiently. This strategy has many corollary benefits: it lowers complexity, lowers people costs, lowers support and service costs, and improves network efficiency and performance. The NetApp eight-point strategy for reducing storage power consumption makes use of today’s technology to halt power growth at its source.
1 CONSOLIDATE SERVERS AND STORAGE Servers alone can consume 50% of the power coming into the data center. The first step in reducing power consumption is to attack the power problem where you can reap the most gains—consolidating and virtualizing application servers.
Storage is the next largest consumer of energy after servers and cooling systems. In environments with lots of direct-attached storage, as much as 27% of the power going into the data center is being consumed by storage1.
The dramatic growth of Windows® data has led to a proliferation of Windows file servers and direct-attached storage units. Not only are these server and storage assets poorly utilized, they are also difficult to manage, resulting in extremely high overhead costs.
Data centers that use lots of direct-attached storage can see significant power savings by implementing a storage network. Removing file servers immediately increases the total watts available in the data center. File server consolidation also increases your ability to scale in a power-efficient manner; instead of adding servers, you can scale by adding disks. Adding disks to an existing system has the additional advantage of allowing you to amortize operational costs over more drives.
In addition to reducing power loads, consolidating Windows data onto a highly available NetApp storage system dramatically simplifies the file-serving environment and creates valuable management, performance, and cost efficiencies.
2 USE HIGHER-CAPACITY DRIVES Using higher-capacity drives can significantly alter the storage power equation. Typical SATA disk drives consume about 50% less power per TB than equivalent-capacity Fibre Channel drives. They also offer the highest available storage density per drive, further helping minimize power consumption. NetApp disk resiliency and data protection technologies have made SATA drives an increasingly viable alternative for many enterprise applications. Many companies are finding that SATA
1 “Power, Heat and Sledgehammer.” Maximum Throughput, Inc. April 2002.

Reducing Datacenter Power Consumption Through Efficient Storage 5
performance is good enough to support many more applications than they originally thought possible.
Dramatic Benefits of Higher-Capacity Drives For example, if you replace 11 older systems with one modern, high-capacity system, you can increase capacity by 16% while consuming 81% less power and 93% less space than was required for the old systems. With this arithmetic, it doesn’t take very long to achieve a significant return on your investment.
Table 1: Potential Savings from Higher-Capacity Drives
Old Systems New Systems Improvement
# of systems 11 Old Systems: 4 F880 3 F810 2 F820 1 F825 1 F840
1 FAS 3020 with 3 disk shelves
Power* (kW HRs) *Does not include power for cooling.
113,651 20915 81% Decrease
Space (Cubic Feet) 63.0 4.3 93% Decrease
Capacity (GBs) 9,776 14,000 16% Increase
3 PROTECT AGAINST DISK FAILURES WITH FEWER DRIVES
When SATA drives are utilized for data storage, larger amounts of data are stored per drive when compared to smaller Fibre Channel primary disk drives. To insure that data reliability is not compromised. Network Appliance provides dual-parity RAID-DP™. When compared to RAID 10, data mirroring, RAID-DP offers 70% greater storage utilization2. In addition, RAID-DP provides superior fault tolerance by recovering from the simultaneous failure of two drives, unlike other RAID levels that can tolerate only a single drive failure.
4 MIGRATE DATA TO MORE EFFICIENT STORAGE To ensure the most efficient use of your storage resources, minimize the use of primary storage by migrating data to more efficient secondary storage where appropriate. The Network Appliance™ IS1200 information server automates migration of infrequently accessed data from primary storage to the more storage-efficient secondary storage of NearStore®.
5 INCREASE UTILIZATION According to industry estimates, storage utilization rates average 25–40%. That means 60–75% of all storage capacity that is being powered goes unused. Not only is such a low utilization rate a waste of storage, it is a waste of power.
In most systems, storage administrators allocate and dedicate storage space to a particular volume or LUN at the time of its creation. This creates two significant administrative challenges: (1) once a volume is created on physical storage, its size is extremely difficult to change, and (2) once storage is allocated to a particular application, it is not available for another use. Since it is difficult to predict actual storage requirements, application administrators typically request much more space than they think they will need to protect themselves should they need more storage down the line. This common practice guarantees overallocation. NetApp Flex Vol®
2 Network Appliance testing

Reducing Datacenter Power Consumption Through Efficient Storage 6
technology enables thin provisioning, a technique that lets storage administrators quickly and dynamically resize flexible volumes, eliminating the need for over-allocation.
With NetApp FlexVol technology, utilization rates of 60% are the average3. By making all disks available to all datasets through a common pool of storage, both performance and capacity utilization are maximized. When disk space is no longer needed by a particular application, it can be returned to the free pool and made available to other applications as their storage needs grow. Increasing utilization 50% results in a corresponding reduction in the number of disks that are required.
6 BACKUP: DO MORE WITH LESS NetApp Snapshot™ copies provide two significant efficiency advantages, making them unique in the industry. First, because only changes to the data are saved, Snapshot copies consume minimal storage space. Second, these copies also let you leverage a single copy of your data for multiple uses, reducing your reliance on special-purpose storage systems. With other vendors, backup, compliance, and disaster recovery may each require a dedicated system, putting huge additional demands on your storage infrastructure. With NetApp technology, a single copy of your data can be used for multiple uses so your backup system can be used for compliance and asynchronous disaster recovery. Reducing the number of special-purpose storage systems you use can radically reduce your power requirements.
Countless copies of data files consume vast amounts of storage. De-duplication technology can help you free up this capacity. Network Appliance NearStore includes A-SIS de-duplication, a technology that eliminates duplicate data regardless of the amount of redundant data stored on the primary disk array. A-SIS de-duplication reduces the need to continuously add more storage capacity for secondary data storage.
7 ELIMINATE STORAGE OVERHEAD FOR TESTING AND DEVELOPMENT
Testing and development require numerous copies of your data, putting huge additional demands on your storage infrastructure.
NetApp FlexClone™ technology lets you make multiple, instant virtual copies of your data with virtually no storage overhead. As with NetApp Snapshot technology, only data that changes between a parent volume and a clone is stored. Data volumes and datasets can be instantly cloned without requiring additional storage space at the time of creation. This capability makes it possible to allocate many individual, writable copies of data in a fraction of the space that would typically be required.
Additionally, with NetApp FlexClone technology, activities that once had to be performed sequentially—due to previous storage limitations—can now be done simultaneously, increasing the speed of testing and deploying new applications.
8 MEASURE YOUR POWER EFFICIENCY Our last step is something that we encourage you to do on an ongoing basis to get a handle on your storage power consumption: measure the power efficiency of your storage systems.
One common measure of power consumption is watts per terabyte (W/TB). This measure can be misleading, however, when comparing machines that operate at different efficiency levels. A better way of evaluating storage power consumption is to measure watts per usable terabyte. This can be expressed with the following formula:
3 Customer reported utilization data

Reducing Datacenter Power Consumption Through Efficient Storage 7
To calculate the power efficiency of a particular storage system, divide the total watts per system by the total number of TBs in that system times the system utilization. System utilization is equal to that percent of your disks actually available for use. The figure below shows how this calculation reveals important differences between seemingly similar systems.
NetApp Storage Power Savings
LOOKING AHEAD We believe that following these steps will return enough power and headroom for growth to your data center to protect the ability of your storage infrastructure to support the demands of your business for many years to come. In the meantime, however, we will continue to look for ways to improve the efficiency of storage systems at every level.
Here are some of the power-saving technologies that are being investigated by our industry: larger SATA drives, in-line hardware data compression, file de-duplication, flash memory, improved power supply efficiency, energy-efficient CPUs, DC power, and intelligent control of the speed of individual drives in response to demand.
Just as today there is no single solution for reducing storage power consumption, future reductions will be attained through a combination of efforts and by attacking the issue on all fronts.
THE NETAPP COMMITMENT Runaway power consumption in the data center is an issue that storage vendors simply must address. At NetApp, we take this responsibility seriously and we will continue to devote our resources and talents to the development of data management and storage technologies that will help you overcome the challenges that power consumption realities pose to your success.
In our ongoing efforts to simplify data management, we will continue to reduce infrastructure complexity and cost and provide you the flexibility you need to stay competitive and meet your business challenges.

Reducing Datacenter Power Consumption Through Efficient Storage 8
By focusing on data management and storage efficiency, not only can your organization realize substantial cost savings, you can do so while contributing to the health of our planet.
FURTHER READING For more information, please check out these other papers at www.netapp.com:
• “NearStore Storage Efficiency,” TR-3539 • “Maximizing Storage Utilization” white paper, WP-7003-1106

© 2007 Network Appliance, Inc. All rights reserved. Specifications subject to change without notice. NetApp, the Network Appliance logo, NearStore, and FlexVol are registered trademarks and Network Appliance, FlexClone, RAID-DP, and Snapshot are trademarks of Network Appliance, Inc. in the U.S. and other countries. Windows is a registered trademark of Microsoft Corporation. All other brands or products are trademarks or registered trademarks of their respective holders and should be treated as such.