Consolidation of laboratory data across a network ...
26
Consolidation of laboratory data across a network; additional performance management tools from Fapas bespoke service Mark Sykes
Transcript of Consolidation of laboratory data across a network ...

Consolidation of
laboratory data across a
network; additional
performance
management tools from
Fapas bespoke serviceMark Sykes

Introduction
Topic 1Bespoke programmes of proficiency testing and test material production
Topic 2How to manage method dependency in proficiency test reports; allergens case study

What is Proficiency Testing?
If I ask you to do an analysis, how do I know
you’re giving me the correct answer?
Validated method?
Internal QC?
Accreditation? (ISO 17025)
Bias against
external reference

Operation of PT
Test material preparationNatural levelsSpiked
Homogeneity test10 x 2 random samplesISO 17025 method
Analysis, reporting by participants
Data assessment (z-score)
PT Report

Headquarters
Lab 1 Lab 2 Lab 3 Lab 1 Lab 2 Lab 3
Internal laboratories Contract laboratories
Partnering with Fapas enables you to easily assure quality across your laboratory network
Global Bespoke Service

Fapas Product Range
• Food Chemistry
• Food Microbiology
• GMO in Food
• Water and Environment
• Bespoke: customer
specifications
• Reference Materials

Why Fapas?
• Experienced in running closed trials
• Global delivery
• Successfully conducted bespoke schemes for numerous
organisations
• 200+ staff years of experience
• Market leaders
• UK Government heritage
• High quality statistical analysis

Reporting requirements
Network specific?
Geographic dependency?
Chemistry? GM? Microbiology?
Methods?
Analyte? Matrix?
Performance assessment?
10 36 6 25 21 26 1 4 3 23 24 9 5 8 19 16 17 2 37 18 28 29 11 13 7 31 15 32 12 20 27 35 33 34 30
10.52 µg/kg
7.30 µg/kg
4.09 µg/kg
-3.0
-2.0
-1.0
0.0
1.0
2.0
3.0
z-score
Laboratory Number
-3
-2
-1
0
1
2
3
z-S
core

Subset of data (1)
10 36 6 25 21 26 1 4 3 23 24 9 5 8 19 16 17 2 37 18 28 29 11 13 7 31 15 32 12 20 27 35 33 34 3010.52 µg/kg
7.30 µg/kg
4.09 µg/kg
-3.0
-2.0
-1.0
0.0
1.0
2.0
3.0
z-score
Laboratory Number
Evenly distributed

Subset of data (2)
10 36 6 25 21 26 1 4 3 23 24 9 5 8 19 16 17 2 37 18 28 29 11 13 7 31 15 32 12 20 27 35 33 34 3010.52 µg/kg
7.30 µg/kg
4.09 µg/kg
-3.0
-2.0
-1.0
0.0
1.0
2.0
3.0
z-score
Laboratory Number
Negative bias? Collusion?

How many labs for bespoke PT?
Statistical viability, labs > 20(robust mean, low uncertainty)
The bespoke network has only 5 labs.What can we do next?
• Use existing scheduled PT• Customer finds other labs to join• Fapas (agent) finds other labs to join
ExampleEthephon (pesticide) in red grape

Bespoke test material (non-PT)
Test material production only
Homogeneity testing/verification
For internal quality control
No proficiency test
Useful for specialist applications
ExamplesMycotoxins in geographic-specific matricesMicrobiological load on bespoke matrix

Data analysis bespoke service
Scheduled PTBespoke performance assessment for networkAssessment criteria different from scheduled PT
ExampleBespoke network using PT to validate a new method
External data analysisTest material production and distribution by customerFapas handles results entry and data analysis
ExampleGold purity analysis
p
axxz
σ)( −=
p
axxz
σ)( −=
p
axxz
σ)( −=

Part 1 Summary
• Bespoke service for network of laboratories
• Bespoke Proficiency Test
• Bespoke Test Material
• Bespoke data analysis
• Close liaison with PT experts at all times
Part 2 – method dependency and data interpretation

Typical Results and z-Scores
9 55 74 45 59 12 36 77 79 6 64 30 16 40 54 62 84 48 15 29 58 23 8 50 17 81 46 1 75 65 3 63 72 18 27 35 57 53 39 51 19 4 69 25 71 66 76 52 21 83 38 67 7 43 68 70 5 26 61 20 34 44 33 11 24 78 49 60 47 2 14 42 82 32 13 10 22 73 28 37 31
2.79 µg/kg
4.97 µg/kg
7.16 µg/kg
-4.0
-3.0
-2.0
-1.0
0.0
1.0
2.0
3.0
4.0
5.0
6.0
Laboratory Number
z-score
laboratorynumber
analyte
AFB1
assignedvalue
4.97 µg/kg
result recovery z-scoreµg/kg %
001 4.28 68.9 -0.6
002 6.78 100 1.7
003 4.5 106 -0.4
004 5.0 86 0.0
005 5.56 88.6 0.5
006 3.2 80 -1.6
007 5.4 95.6 0.4
008 4.07 81.8 -0.8
009 1.0 96 -3.6
010 9.1 63.65 3.8
011 6.0 75 0.9
012 2.9 79.2 -1.9
013 8.20 101.62 2.9
014 7.09 103 1.9
015 3.82 113 -1.1

Identifying normality
250200150100500
99
95
90
80
70
60
50
40
30
20
10
5
1
1979 Chlorpyrifos
Pe
rce
nt
Mean 86.08
StDev 33.43
N 57
KS 0.181
P-Value <0.010
1979 Chlorpyrifos normalityNormal
120110100908070605040
99
95
90
80
70
60
50
40
30
20
10
5
1
Culled
Pe
rce
nt
Mean 81.30
StDev 15.09
N 46
KS 0.068
P-Value >0.150
1979 Chlorpyrifos normality - culledNormal
200150100500
0.018
0.016
0.014
0.012
0.010
0.008
0.006
0.004
0.002
0.000
Analytical result
De
nsit
y
Adaptive kernel density plot - 1979 Chlorpyrifos
1 2
3 4

Vitamin B2 problem (1)
N
N
N
NH
O
O
OH
OH
OH
OH
N
N
N
NH
O
O
OH
OH
OH
O
P OHOH
O
Riboflavin
Riboflavin 5’-phosphate
Enzymatic digestion

Vitamin B2
problem (2)
250200150100500-50-100-150
0.025
0.020
0.015
0.010
0.005
0.000
Analytical result
De
nsit
y
2126 Vit B2 FFP
3002001000-100-200
0.030
0.025
0.020
0.015
0.010
0.005
0.000
Analytical result
De
nsit
y
2133 Vit B2 FFP
3002001000-100
0.014
0.012
0.010
0.008
0.006
0.004
0.002
0.000
Analytical result
De
nsit
y
2152 Vit B2 FFP
3020100-10-20
0.14
0.12
0.10
0.08
0.06
0.04
0.02
0.00
Analytical result
De
nsit
y
2164 Vit B2 FFP
Sykes et al, 2011, Anal Bioanal Chem, 400:305-310
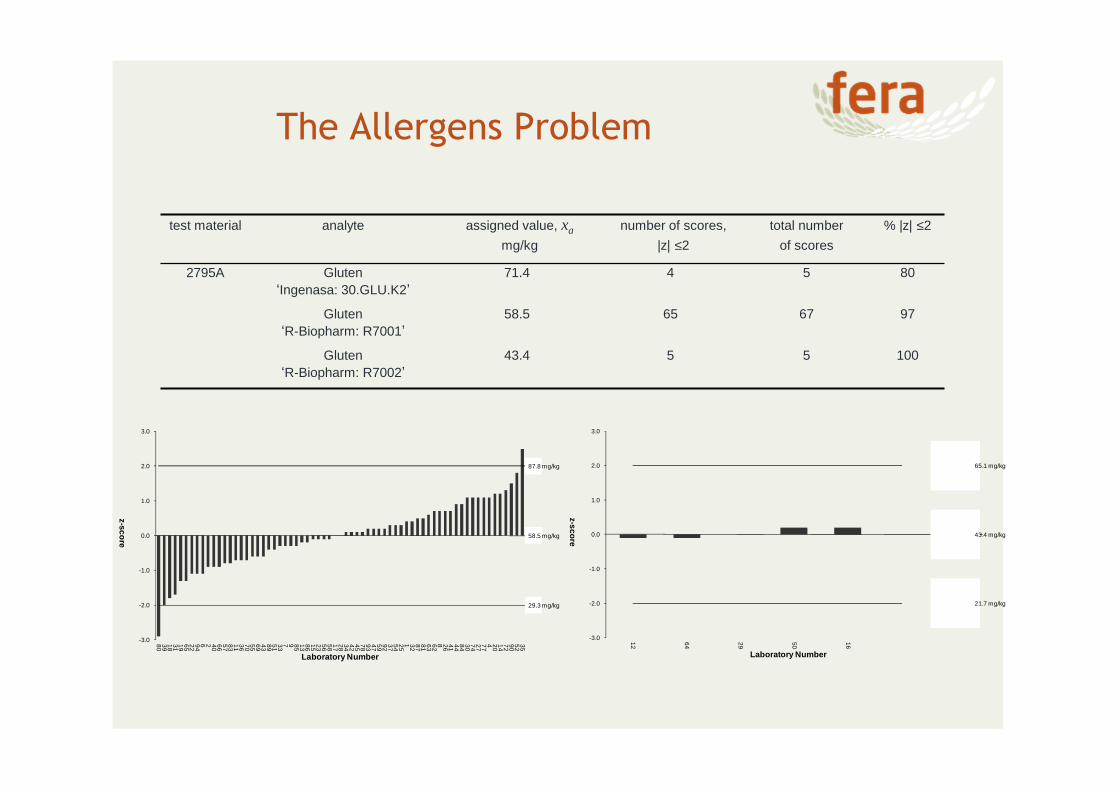
The Allergens Problem
test material analyte assigned value, xa
mg/kg
number of scores,
|z| ≤2
total number
of scores
% |z| ≤2
2795A Gluten‘Ingenasa: 30.GLU.K2’
71.4 4 5 80
Gluten‘R-Biopharm: R7001’
58.5 65 67 97
Gluten‘R-Biopharm: R7002’
43.4 5 5 100
12 64 29 50 16
65.1 mg/kg
43.4 mg/kg
21.7 mg/kg
-3.0
-2.0
-1.0
0.0
1.0
2.0
3.0
z-score
Laboratory Number
80
39
18
31
19
65
22
94
6 2 40
66
57
83
11
36
70
55
69
43
89
51
33
7 9 85
13
86
15
23
56
58
17
28
34
42
45
78
93
47
59
92
37
54
25
1 32
87
81
63
62
8 26
41
44
84
30
74
27
77
4 20
14
72
90
52
35
87.8 mg/kg
58.5 mg/kg
29.3 mg/kg
-3.0
-2.0
-1.0
0.0
1.0
2.0
3.0
z-score
Laboratory Number

More extreme allergens
test
material
analyte assigned value,
xa, mg/kg
number of scores,
|z| ≤2
total number
of scores
% |z| ≤2
27165A Neogen - Veratox for Soy
(8410)
12.7 26 29 90
ELISA Systems - Soy
(ESSOYPRD-48)
7.4 15 15 100
R-Biopharm - Ridascreen Fast
Soya (R7102)
33.3 19 23 83
TM Analyte Xa, mg/kg No. scores |z|<2
Total no. scores
% satis.
2758-A soya protein‘ELISA Systems’
6.30 13 14 93
2758-A soya protein‘Tepnel’
12485 6 6 100

Multi-modal distributions
What happens if we do not separate allergens results by different ELISA kits?

Problems with separating allergens results by ELISA kit
More work for the PT provider
Some results will not be assessed (no z-score)
Few or unique ELISA kits
Few results may give high uncertainty
test material analyte assigned value, xa
mg/kg
number of scores,
|z| ≤2
total number
of scores
% |z| ≤2
2795A Gluten‘Ingenasa: 30.GLU.K2’
71.4 4 5 80
Gluten‘R-Biopharm: R7001’
58.5 65 67 97
Gluten‘R-Biopharm: R7002’
43.4 5 5 100

Allergen results not scored
test
material
analyte assigned value,
xa, mg/kg
number of scores,
|z| ≤2
total number
of scores
% |z| ≤2
27165A Neogen - Veratox for Soy
(8410)
12.7 26 29 90
ELISA Systems - Soy
(ESSOYPRD-48)
7.4 15 15 100
R-Biopharm - Ridascreen Fast
Soya (R7102)
33.3 19 23 83
laboratory
number
analyte - soya
assigned value
not set
limit of
detection,
result, mg/kg mg/kg kit name
011 0.875 40 other (please specify)
035 34.62 2.5 other (please specify)
041 21.9 0.23 BioFront Technologies Inc. - MonoTrace Soy ELISA
(SG6-EK)
060 nq other (please specify)
066 87.5 16.0 other (please specify)
067 7,76 0,28 Transia - nutriLinea Soy-E Allergen ELISA
(NC-6012)
083 n.q. 0,7 Transia - nutriLinea Soy-E Allergen ELISA
(NC-6012)
089 7.5 2.1 Transia - nutriLinea Soy Allergen ELISA
(NC-6011)

Questions to ask
Are other participants using the same ELISA kit?Example – Transia NC-6012 soya
If my ELISA kit is unique, does it report whole allergen ingredient (soya) or allergen protein (soya protein)?
Is my LOD similar to other ELISA kits?Example – lab 35 result and LOD similar to R-Biopharm
Did my ELISA kit fail to detect the allergen?Example – labs 60 and 83

Other actions to take
Ask the ELISA kit manufacturer for more information and validation data
Generate measurement uncertainty data using FAPAS QC samples
Build a control chart using FAPAS QC samples
Validate your ELISA method using FAPAS QC samples
Verify your ELISA method against an alternative ELISA kit
Calibrate your ELISA method using FAPAS Reference Materials (to be launched later 2016)

Summary
Uncommon or unique ELISA kits won’t receive a z-score
Concentrate effort on the investigation, not the result
Demonstrate measurement uncertainty, reproducibility precision with control charts
Accreditation must understand fitness-for-purpose