Consolidation of a Performance-Sensitive Application ... · Consolidation of a Performance-...
16
Consolidation of a Performance- Sensitive Application: Virtualizing Electronic Sports League’s Gaming Infrastructure White Paper Intel® Xeon® Processor 7400-based Server Abstract An end-user case study with Electronic Sports League (ESL) using VMware ESX 3.5U1* with NetQueue feature running on Intel® Xeon® processor 7400 series-based servers with Intel® NICs supporting VMDq feature. Game servers are mission-critical, single-threaded, processor-intensive, and network-latency sensitive. They were previously believed to be “non-virtualizeable” due to the overhead of virtualization. In this case, we will show that game QoS can be preserved on virtualized game servers when using the latest technologies noted above. We’ll also show that large server consolidation ratios and cost savings can be achieved at the same time. Authors: Bob Albers, I/O Usage Architect, and Sreeram Sammeta, Sr. Systems Engineer, Intel Digital Enterprise Group
Transcript of Consolidation of a Performance-Sensitive Application ... · Consolidation of a Performance-...
Consolidation of a Performance- Sensitive Application: Virtualizing Electronic Sports League’s Gaming Infrastructure
White PaperIntel® Xeon® Processor 7400-based Server
Abstract
An end-user case study with Electronic Sports League (ESL) using VMware ESX 3.5U1* with NetQueue feature running on Intel® Xeon® processor 7400 series-based servers with Intel® NICs supporting VMDq feature. Game servers are mission-critical, single-threaded, processor-intensive, and network-latency sensitive. They were previously believed to be “non-virtualizeable” due to the overhead of virtualization. In this case, we will show that game QoS can be preserved on virtualized game servers when using the latest technologies noted above. We’ll also show that large server consolidation ratios and cost savings can be achieved at the same time.
Authors: Bob Albers, I/O Usage Architect, and Sreeram Sammeta,
Sr. Systems Engineer, Intel Digital Enterprise Group

Table of Contents
Introduction – Can We Virtualize Everything? . . . . . . . . . . . . . . . . . . . . . . . . . . . . . . . . . . . . . . . . . . . . . . . . . . . . . . . . . . . . . . . . . . 3
“Non-virtualizable” applications . . . . . . . . . . . . . . . . . . . . . . . . . . . . . . . . . . . . . . . . . . . . . . . . . . . . . . . . . . . . . . . . . . . . . . . . . . . . . . . . . . . . . . . . .3
Sidebar: ESL . . . . . . . . . . . . . . . . . . . . . . . . . . . . . . . . . . . . . . . . . . . . . . . . . . . . . . . . . . . . . . . . . . . . . . . . . . . . . . . . . . . . . . . . . . . . . . . . . . . 3
Problem statement . . . . . . . . . . . . . . . . . . . . . . . . . . . . . . . . . . . . . . . . . . . . . . . . . . . . . . . . . . . . . . . . . . . . . . . . . . . . . . . . . . . . . . . . . . . . . . . . . . . .4
New Technologies Allow Us to Virtualize More . . . . . . . . . . . . . . . . . . . . . . . . . . . . . . . . . . . . . . . . . . . . . . . . . . . . . . . . . . . . . . . . . 4
ESL Proof of Concept (PoC) overview . . . . . . . . . . . . . . . . . . . . . . . . . . . . . . . . . . . . . . . . . . . . . . . . . . . . . . . . . . . . . . . . . . . . . . . . . . . . . . . . . . .4
Server hardware . . . . . . . . . . . . . . . . . . . . . . . . . . . . . . . . . . . . . . . . . . . . . . . . . . . . . . . . . . . . . . . . . . . . . . . . . . . . . . . . . . . . . . . . . . . . . . . . . . . . . . .5
Network I/O . . . . . . . . . . . . . . . . . . . . . . . . . . . . . . . . . . . . . . . . . . . . . . . . . . . . . . . . . . . . . . . . . . . . . . . . . . . . . . . . . . . . . . . . . . . . . . . . . . . . . . . . . . .5
Software stack . . . . . . . . . . . . . . . . . . . . . . . . . . . . . . . . . . . . . . . . . . . . . . . . . . . . . . . . . . . . . . . . . . . . . . . . . . . . . . . . . . . . . . . . . . . . . . . . . . . . . . . .7
Question the Assumptions . . . . . . . . . . . . . . . . . . . . . . . . . . . . . . . . . . . . . . . . . . . . . . . . . . . . . . . . . . . . . . . . . . . . . . . . . . . . . . . . . . . 7
Key performance metrics . . . . . . . . . . . . . . . . . . . . . . . . . . . . . . . . . . . . . . . . . . . . . . . . . . . . . . . . . . . . . . . . . . . . . . . . . . . . . . . . . . . . . . . . . . . . . .7
Gaming protocol . . . . . . . . . . . . . . . . . . . . . . . . . . . . . . . . . . . . . . . . . . . . . . . . . . . . . . . . . . . . . . . . . . . . . . . . . . . . . . . . . . . . . . . . . . . . . . . . . . . . . . .8
Round-trip network latency tests . . . . . . . . . . . . . . . . . . . . . . . . . . . . . . . . . . . . . . . . . . . . . . . . . . . . . . . . . . . . . . . . . . . . . . . . . . . . . . . . . . . . . . .8
ESL game testing . . . . . . . . . . . . . . . . . . . . . . . . . . . . . . . . . . . . . . . . . . . . . . . . . . . . . . . . . . . . . . . . . . . . . . . . . . . . . . . . . . . . . . . . . . . . . . . . . . . . 10
ROI Delivered . . . . . . . . . . . . . . . . . . . . . . . . . . . . . . . . . . . . . . . . . . . . . . . . . . . . . . . . . . . . . . . . . . . . . . . . . . . . . . . . . . . . . . . . . . . . . . 11
Server consolidation . . . . . . . . . . . . . . . . . . . . . . . . . . . . . . . . . . . . . . . . . . . . . . . . . . . . . . . . . . . . . . . . . . . . . . . . . . . . . . . . . . . . . . . . . . . . . . . . . 11
Power savings . . . . . . . . . . . . . . . . . . . . . . . . . . . . . . . . . . . . . . . . . . . . . . . . . . . . . . . . . . . . . . . . . . . . . . . . . . . . . . . . . . . . . . . . . . . . . . . . . . . . . . . 12
Other savings . . . . . . . . . . . . . . . . . . . . . . . . . . . . . . . . . . . . . . . . . . . . . . . . . . . . . . . . . . . . . . . . . . . . . . . . . . . . . . . . . . . . . . . . . . . . . . . . . . . . . . . . 12
Conclusions . . . . . . . . . . . . . . . . . . . . . . . . . . . . . . . . . . . . . . . . . . . . . . . . . . . . . . . . . . . . . . . . . . . . . . . . . . . . . . . . . . . . . . . . . . . . . . . 13
Resources . . . . . . . . . . . . . . . . . . . . . . . . . . . . . . . . . . . . . . . . . . . . . . . . . . . . . . . . . . . . . . . . . . . . . . . . . . . . . . . . . . . . . . . . . . . . . . . . . 14
2
White Paper Consolidation of a Performance-Sensitive Application

ESL
Electronic Sports League (ESL) is the largest online gaming
community in Europe, with more than 844,000 active
users as of August 12, 2008.
ESL has deployed thousands of game servers to provide
services to its members. Obviously, for a game services
company, the game servers are mission critical. The key
performance criterion measured by gamers is the in-game
transaction latency, which determines the responsiveness
of the game and is a key component in the competitive
edge for the players, many of whom are actually profes-
sionals and quite demanding of the performance of this
key criterion. In addition, most game server code is single-
threaded and very CPU intensive, with CPU utilization
typically in the 60-80 percent range.
Introduction — Can We Virtualize Everything?Virtualization of enterprise data center applications using hyper-
visors or VMMs is taking a predictable path. It started with the
consolidation of the simplest, least performance-sensitive, and
least mission-critical applications, many of which had hardware
utilization figures in the 10 percent or less range. These applica-
tions were the “low-hanging fruit” of the first wave of applica-
tion virtualization, and consolidation ratios were quite high while
still delivering adequate performance. This consolidation wave
delivered a significantly positive ROI to the organizations. IT
organizations would like to have the benefits of virtualization
across the entire spectrum of applications, but there are
challenges to delivering on this potential.
“Non-virtualizable” applications
Not all enterprise applications fit the description above, of course.
There are more complex, high-performance, and mission-critical
applications, too. Many of these applications are very demand-
ing of the hardware resources in state-of-the-art servers; there-
fore we expect that it would be more difficult to virtualize them
while retaining adequate performance. Examples of some of
the generic types of applications that don’t fit the “low-hang-
ing fruit” description are those characterized by the following
characteristics:
•Missioncritical
•Transactionlatencysensitive
• CPU intensive: single thread vs. multi-thread
•Memoryintensive:size/throughput/latency
•I/O intensive: disk/network; throughput/latency
From our experiences with virtualization we know there are
certain overheads involved with delivering the value that a
VMM/hypervisor provides. These overheads can impact all the
characteristics noted above. This leads to the perception that
these types of applications “can’t be virtualized” because the
tradeoffs would be too severe. Is this a perception or reality?
Internet
Firewall
Game Servers
Figure 1 . ESL game server high-level architecture .
3
White Paper Consolidation of a Performance-Sensitive Application

Problem statement
ESL’s perception, along with that of many of its peers in the
gaming industry, was that gaming servers “can’t be virtualized”
due to their mission-critical nature, high CPU utilization, and
the critical focus of their user base on the in-game transaction
latency. However, ESL was very motivated to try to break through
this “perception barrier” because it has been experiencing expo-
nential growth for the past eight years, which caused substantial
problems for its IT team in managing game server sprawl, costs,
power, and operational expenses. The fundamental question
was: could we deliver the benefits of virtualization for the
gaming server infrastructure while maintaining high quality
of service (QoS) levels as perceived by the ESL members? The
virtualized game servers must deliver smooth game play and
measurably competitive in-game transaction latencies to be
acceptable to ESL’s customers.
New Technologies Allow Us to Virtualize MoreOur perceptions are shaped by our experiences and our knowl-
edge of the experiences of others. These perceptions often
become embedded in our thinking and need to be periodically
challenged to be sure that they still represent reality. As tech-
nology marches on, we have seen many IT perceptions change.
With this in mind, and with consideration of the latest technology
innovations that may be relevant to the problem at hand, ESL and
Intel proceeded to examine our perceptions about the virtualiza-
tion of gaming servers.
ESL Proof of Concept (PoC) overview
We know that servers grow more powerful with each new
generation, which improves the performance of any application
running on them, including virtualized ones. However, we also
know that virtualization overheads are especially severe for
I/O performance-sensitive applications such as this one, where
in-game transaction latency (which includes the round-trip
network latency) is so critical.
Our hypothesis was that virtualization of gaming servers may be
possible if we use the latest technologies:
•IntelXeonprocessor7400-basedserverswith24processing
cores to address the need for higher performance overall. This
should allow us to deliver QoS headroom to counteract the over-
heads of virtualization. This platform was also chosen due to the
desire for high consolidation ratios to address ESL challenges
with server sprawl, cost, power, and operational expenses.
•IntelNICswiththeVMDqfeature.whichallowthevirtualized
network overheads to be minimized and the network load to be
spread across multiple platform cores for higher performance
and more headroom to maintain QoS.
•VMwareESX3.5*tosupporttheplatformchosen.ESX3.5also
delivers substantial networking performance improvements
compared to earlier versions.
•VMwareNetQueuefeature,whichprovidesthesoftwareenviron-
ment to take advantage of the VMDq feature in the latest NICs.
We could not find any industry data on the latency impact of
virtualization that was relevant to typical gaming server proto-
cols, so we decided to first test the network-latency impact
7400 SeriesIntel Xeon Intel Xeon
Intel Xeon Intel Xeon
4 sockets with 6 cores
4x1066
Intel Xeon processor 7300
series
ESB2I/O Bridge
Configurable PCI Express*
32 Slots• 256 GB maximum• 32 GB as tested
Figure 2 . Intel® Xeon® processor 7300 platform high-level architecture .
4
White Paper Consolidation of a Performance-Sensitive Application

of virtualization in the Intel lab using common network micro-
benchmarks before attempting the virtualization of the gaming
server environment. This would allow us to quantify the latency
added by virtualization to see if it would be significant. When we
were sure that the latency added should not be a concern, we
proceeded to test the gaming server virtualization with private
testing in the ESL lab and ultimately onto public testing on the
Internet with real ESL members.
Server hardware
The PoC targeted the Intel Xeon processor 7300 platform with
four processor sockets with the six-core Intel Xeon processor
7400 series (Dunnington). These new processors became
available in September 2008 and are hardware and software
compatible with Intel Xeon processor 7300-based platforms
that have been in production for more than a year. The Intel
Xeon processor 7400 series delivers a performance boost from
using six rather than four cores per socket and by the addition
of a new 16 MB L3 cache. It also delivers an energy-efficiency
boost derived from our 45nm high-k process technology. In
addition, the Intel Xeon processor 7400 series has added some
enhanced hardware-assist features for virtualization. The
platform supports 32 memory slots for up to 256 GB capacity.
In this PoC we used 32 GB.
Network I/O
But virtualization is not just about CPU and memory resources.
It’s important to have I/O tuned for virtualization, too.
In a typical virtualization scenario (Figure 3), the network I/O for
all the VMs is delivered to the hypervisor. The hypervisor then
performs the necessary Ethernet switching functions in software
to forward each network flow to the destination VM. This
software function, called a virtual switch, is much slower than
a typical hardware-based Ethernet switch and causes CPU
loading that detracts from application VM performance. Also,
the hypervisor virtual switch has to process all the interrupts
sent by the network I/O device on a single CPU core. This can
be a bottleneck too, especially for faster networks like 10 GbE.
As shown in Figure 4, the Intel® 10 GbE NIC runs into this single-
core interrupt processing load bottleneck. In this case, the 10 GbE
NIC can only receive 4 GB of traffic due to the saturation of the
single CPU core processing all the receive interrupts at 10 GB
line rate.
VirtualizationHypervisor
VM1
Virtual
VM2
Virtual
VMn
Virtual
NIC
LAN
Figure 3 . Network data flow for virtualization without the use of VMDq and NetQueue technologies .
without VMDq
Unused I/O capacity
Result: NIC performance can be up to ~60% underutilized
10.0
8.0
6.0
4.0
2.0
4.0Thro
ughp
utFigure 4 . Impact of virtualization on a 10 GB Ethernet NIC without the use of VMDq and NetQueue .
5
White Paper Consolidation of a Performance-Sensitive Application

VMM overhead
•Switchingload
•Interruptbottleneck
We can optimize the network I/O solution to solve both of the
issues above.
In Figure 5, we show the effect of using the new Intel® VMDq
hardware in our latest NICs along with the new VMware
NetQueue software in ESX 3.5. In this case, the network flows
destined for each of the VMs are switched in hardware on the
NIC itself and put into separate hardware queues. This greatly
simplifies the work that the virtualization software layer has
to do to forward packets to the destination VMs and delivers
improved CPU headroom for application VMs. Each of the queues
noted above is equipped with a dedicated interrupt signal that
can be directly routed to the destination VM for handling. This
allows us to spread the load of a 10 G pipe across the processor
cores running those VMs. In this way we can break through the
single-core interrupt processing bottleneck to deliver near line-
rate performance even at 10 GbE speeds.
In Figure 6, we can see that the receive performance with
VMDq + NetQueue is 9.2 Gbps with standard 1518-byte packet
size and 9.5 Gbps with jumbo frames. This is more than double
the throughput without these new technologies enabled and
very close to maximum theoretical line rate.
VMDq and NetQueue
•Optimizeswitching
•Load-balanceinterrupts
VM1
Virtual
VM2
Virtual
VMn
Virtual
NIC withVMDq
VMwarewith NetQueue
LAN
Figure 5 . Network data flow for virtualization with VMDq and NetQueue .
• 2x throughput• Near Native 10 GbE
10.0
8.0
6.0
4.0
2.0
4.0
Thro
ughp
ut (G
B)
9.2 9.5
With VMDq Jumbo Frames
With VMDq
Without VMDq
Figure 6 . Tests measure wire speed Receive (Rx) side performance with VMDq on Intel® 82598 10 Gigabit Ethernet Controllers .
6
White Paper Consolidation of a Performance-Sensitive Application

Software stack
Figure 7 shows the software stack used in the PoC. We started
with VMware ESX 3.5U1, which was the latest production version
at the time the PoC began. We also used Virtual Center 2.5.*
The VMs were configured with 1 vCPU and 2 GB of memory each,
which emulates the physical server infrastructure used by ESL.
In each VM we loaded Windows Server 2003* 32-bit and the
Counter-Strike 1.6* game server. Counter-Strike is a very popu-
lar game and a good example of the types of games hosted by
ESL. Each VM hosts three game server processes, and each game
server process can host up to 12 game users. Again, this corre-
sponds with the typical deployment processes used by ESL for
its physical game servers.
Now that we’ve described the technologies used in the PoC,
we’ll move on to detailing the engineering and testing phase.
Question the Assumptions
Key performance metrics
The key performance metric for ESL—or for any online gaming
application—is the “in-game transaction latency.” This can be
defined as the sum of round-trip network latency and game
server processing time.
Figure 8 represents the typical in-game transaction latency
numbers that ESL observed in its current native environment.
When players are connected to the game servers through a local
area network, the best case in-game latency is ~5 ms. For play-
ers connected to game servers via the Internet, the in-game
latency is greater or equal to 20 ms; and for the players having
high-speed Internet connections, it’s about ~10ms, which is the
Internet best-case scenario.
Counter-Strike 1.6*
Windows Server 2003*
32 bit
Intel® Xeon® Processor 7400 Series-based Server
VMware ESX 3.5 U1*
VM1
Counter-Strike 1.6*
Windows Server 2003*
32 bit
VMn
Figure 7 . Software stack .
25
20
15
10
5
Aver
age
late
ncy
(rm
s)
TypicalInternet
Best Internet
Best LAN
Figure 8 . In-game latency .
7
White Paper Consolidation of a Performance-Sensitive Application

Gaming protocol
How does this gaming protocol work? A player sends a UDP
packet of 40–200 bytes in size to the game server. The game
server receives the packets, does its own processing, and then
updates all the players by sending a 2,000-byte UDP packet
(as represented in Figure 9).
We know that the virtualization will increase the round-trip
network latency, but we are not sure by how much. In theory
we also know that enabling VMDq and NetQueue will improve
the network latency. We searched both internally and externally
for data related to the impact of virtualization on latency sensi-
tive applications, but we were not successful. Therefore, we
decided to do our own tests in Intel labs.
Round-trip network latency tests
In order to run the round-trip network latency test, we used the
micro-benchmark Netperf 2.4.4, the UDP latency test and the ESL
workload, which consists of UDP packets. The following three
scenarios are being compared here:
1. Native
2. Virtualized with VMDq/NetQueue
3. Virtualized with no VMDq/NetQueue
Scenario 1: Native
The setup and configuration, as shown in Figure 10, includes
eight clients connected to eight 1-GbE ports of a 1G/10G link
aggregation switch (Force 10 S50*) and the Intel Xeon processor
7300 server connected to 10G port of the switch via Intel®
82598 10GbE CX4 NIC. SLES10 SP1 is the operating system
installed on all the clients and servers, and there are eight
parallel streams of UDP latency tests being run from the
clients to the server.
40–200 bytes UDP
2,000 bytes UDP
Game Player Game Server
Figure 9 . Game network protocol overview .
10 GbE Native Server
Force 10 S50*
Client 11 GbE
Client 81 GbE
Figure 10 . Native lab test setup .
8
White Paper Consolidation of a Performance-Sensitive Application
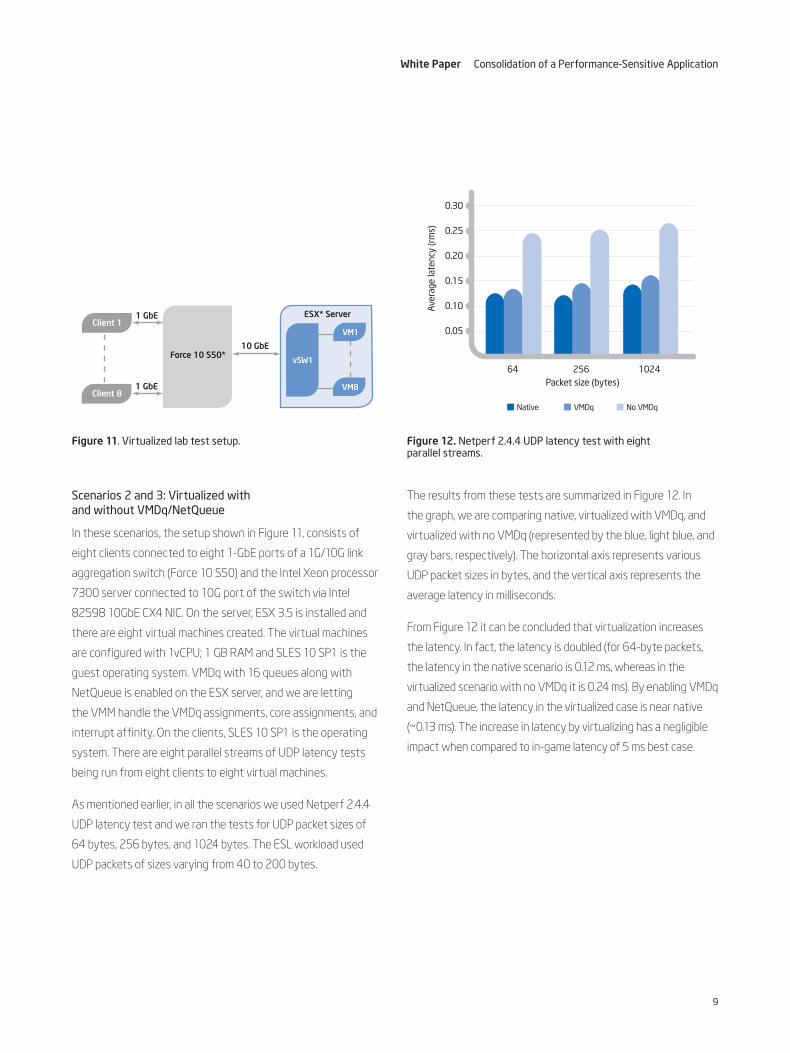
Scenarios 2 and 3: Virtualized with and without VMDq/NetQueue
In these scenarios, the setup shown in Figure 11, consists of
eight clients connected to eight 1-GbE ports of a 1G/10G link
aggregation switch (Force 10 S50) and the Intel Xeon processor
7300 server connected to 10G port of the switch via Intel
82598 10GbE CX4 NIC. On the server, ESX 3.5 is installed and
there are eight virtual machines created. The virtual machines
are configured with 1vCPU; 1 GB RAM and SLES 10 SP1 is the
guest operating system. VMDq with 16 queues along with
NetQueue is enabled on the ESX server, and we are letting
the VMM handle the VMDq assignments, core assignments, and
interrupt affinity. On the clients, SLES 10 SP1 is the operating
system. There are eight parallel streams of UDP latency tests
being run from eight clients to eight virtual machines.
As mentioned earlier, in all the scenarios we used Netperf 2.4.4
UDP latency test and we ran the tests for UDP packet sizes of
64 bytes, 256 bytes, and 1024 bytes. The ESL workload used
UDP packets of sizes varying from 40 to 200 bytes.
The results from these tests are summarized in Figure 12. In
the graph, we are comparing native, virtualized with VMDq, and
virtualized with no VMDq (represented by the blue, light blue, and
gray bars, respectively). The horizontal axis represents various
UDP packet sizes in bytes, and the vertical axis represents the
average latency in milliseconds.
From Figure 12 it can be concluded that virtualization increases
the latency. In fact, the latency is doubled (for 64-byte packets,
the latency in the native scenario is 0.12 ms, whereas in the
virtual ized scenario with no VMDq it is 0.24 ms). By enabling VMDq
and NetQueue, the latency in the virtualized case is near native
(~0.13 ms). The increase in latency by virtualizing has a negligible
impact when compared to in-game latency of 5 ms best case.
Figure 11 . Virtualized lab test setup .
10 GbE
ESX* Server
Force 10 S50*
Client 11 GbE
Client 81 GbE
VM1
VM8
vSW164
0.30
0.25
0.20
0.15
0.10Aver
age
late
ncy
(rm
s)
256 1024Packet size (bytes)
0.05
No VMDqVMDqNative
Figure 12 . Netperf 2 .4 .4 UDP latency test with eight parallel streams .
9
White Paper Consolidation of a Performance-Sensitive Application

ESL game testing
At ESL labs, we ran a series of tests cases that included private
and public Internet testing. All these tests revealed that there is
no impact on in-game latency, and as a result there is no impact
on the gaming experience.
As part of this testing, we used an Intel Xeon processor 7400
server code-named “Dunnington.” This is an MP server with four
sockets and six cores per socket, with a total of 24 cores. This
server is connected to a 10 GbE port of a 1G/10G aggregation
switch by using a 10 GbE CX4 NIC. ESX 3.5 U1 was installed on
the server, and each virtual machine is configured with 1vCPU,
2 GB memory, Windows 2003 server (32 bit) and Counter-Strike
1.6 (three game servers running per VM). We are not using any kind
of CPU affinity or memory reservations. Also, on the ESX server we
enabled the “NetQueue” feature and by default a maximum of 16
queues per 10 GbE port are created.
As a part of load generation we used real players who connected
to the game servers on the local LAN and through the Internet,
and “bots,” which are an emulation of a player playing a game.
These bots run on the game server as a plug-in and generate CPU
load. The setup and configuration are shown in Figures 13 and 14.
Counter-Strike 1.6*
Windows Server 2003*
32 bit
Intel® Xeon® Processor 7400 Series-based Server
VMware ESX 3.5 U1*
VM1
Counter-Strike 1.6*
Windows Server 2003*
32 bit
VMn
Figure 14 . Test software stack .
Force 10 S50N
Internet
Firewall
10 GbE VMDq
VM1 VMn Svc Cons
vSwitch 1 vSwitch 0
1 GbE
ESL Network
Figure 13 . Live Internet test setup .
10
White Paper Consolidation of a Performance-Sensitive Application

ROI Delivered
Server consolidation
Figure 15 represents the CPU utilization and power utilized by the
server at various numbers of virtual machines under a full load. The
bar graph represents CPU utilization, and the line graph represents
power utilized by the server. The horizontal axis represents the
number of virtual machines, and the left vertical axis and right
vertical axis represent the scale for CPU utilization and power
utilization, respectively.
Since the server has 24 cores, we started with 24 virtual
machines, all of them configured identically as mentioned
earlier. As we can see from the graph, for identical 24 virtual
machines the total average CPU utilization was a little more
than 40 percent, and power utilized was about 665 watts.
As the server is not fully utilized, the number of virtual machines
was scaled up to 40. At 40 virtual machines the CPU utilization
was about 90 percent, and power utilized was about 725 watts.
Even at 90 percent utilization there was no impact on the in-game
latency or gaming experience. But in ESL’s current native envi-
ronment, ESL tries to limit the CPU utilization per server around
60–80 percent. ESL needs this head room as there can be situa-
tions where some game servers need more resources. Therefore,
it was decided that 36 virtual machines is the optimal number as
the CPU utilization and power utilization are 75 percent and 710
watts, respectively.
Below is the quote from “Kapio,” a professional gamer who
actually played Counter-Strike on the virtual machines. He
did not see any difference as compared to native.
“ Playing on virtualized game servers running on
Intel and VMware technologies gives professional
gamers no disadvantages compared with playing
on a non-virtualized server . Everything ran
smoothly, and I did not notice anything unusual .
A perfect setup for professional gaming .”
— Navid Javadi, aka mousesports|Kapio
24
100
80
60
40
20
Aver
age
CPU
Util
izat
ion
(per
cent
age)
32 36
Number of VMs
40
Pow
er (W
atts
)
740
720
680
640
700
660
Figure 15 . ESL virtual game servers on Intel® Xeon® processor 7400 Series-based platforms .
11
White Paper Consolidation of a Performance-Sensitive Application

Power savings
Using the optimal number of virtual machines, which is 36, a
simple calculation of direct power costs was done comparing
the before (native) and after (virtualized).
Table 1 shows that with 36 virtual machines, with each virtual
machine having three game servers and each game server
supporting 12 players, we can see a consolidation ration of 18:1.
This means we can consolidate 18 of ESL’s existing Intel® Core™2
Duo processor-based native servers onto one Intel Xeon proces-
sor 7400 server by using virtualization in combination with VMDq
and NetQueue technologies without impacting the gaming
latency and gaming experience. This translates to direct power-
cost savings of $648,000 annually for every 1,000 Intel Core
2 Duo processor-based servers that will be converted. In these
calculations we are taking into consideration that these game
servers are running 24x7, 365 days per year, and we used the
actual power rate ESL is paying (0.16 euros/kWh).
Other savings
The above savings are only direct power savings. We did not
take into account other savings like cooling, datacenter
space, network hardware, and manageability.
Table 1 . ESL standard native hardware deployment metrics (“Before”) vs . virtualized deployment Proof-of-Concept metrics as described in this paper (“After”) .
Before After
Server 1P Intel® Core™2 Duo processor 4P Intel® Xeon® processor 7400
Cores 2 24
Game server processes 3 per CPU core 3 per VM; 4.5 per CPU core
VMs per box N/A 36
Game server per box 6 108
Total users per box 72 1,296
CPU utilization 60-80% 75%
Power utilized per server 350 W 710 W
Consolidation ratio 18 1
Annual direct power cost $731,000 per 1,000 servers $83,000 per 56 servers
12
White Paper Consolidation of a Performance-Sensitive Application
ConclusionsWe have shown that ESL’s mission-critical, processor-intensive,
network latency-sensitive game servers can be very effectively
virtualized using the latest technologies. We achieved 18:1
consolidation ratios and saved almost 90 percent on power
consumption compared to the ESL physical servers, while
preserving game QoS and customer satisfaction.
This one data point does not prove that we can virtualize every
server application. Some demanding applications are still beyond
the reach of current technology. However, we do show that the
latest technologies can allow us to virtualize more workloads, even
those once thought “non-virtualizable” like the ESL game servers.
To gain the benefits that virtualization brings, we will have to
question our assumptions and evaluate the latest technologies
to see if we can virtualize these demanding applications. This is
the only way to deliver the ROI to our organizations.
At some point in the relatively near future, with the ongoing march
of hardware and software technologies, we do expect that practi-
cally all server applications will be virtualizable. So when you take
a look at your server application inventory, you may have applica-
tions that seem to be “non-virtualizable.” Perhaps there are some
new technologies you could evaluate to prove or disprove this
perception. It may be time to capture the ROI of virtualizing these
demanding applications for your corporation, too.
“ The new Six-Core Intel Xeon 7400 processor series
(“Dunnington”) was completely overwhelming in
all terms . The Intel Xeon MP servers with Intel
VMDq technology enable us to efficiently run
our servers with reduced costs and without any
negative impacts .”
— Bjoern Metzdorf, Director of Information Technology, Electronic Sports League
13
White Paper Consolidation of a Performance-Sensitive Application
Additional sources of information on this topic
Intel Virtualization Developer Community: www.microsoft.com/windowsserver/compare/compare-windows-to-unix.mspx
Intel Virtualization Developer Community: softwarecommunity.intel.com/articles/eng/1424.htm
Intel Virtualization Technology: www.intel.com/technology/virtualization/index.htm
Intel Xeon processor 7400 series: www.intel.com/performance/server/xeon_mp/virtualization.htm?iid=SEARCH
More information on Intel® Virtualization Technology for Connectivity: www.intel.com/go/vtc
More information on Intel Networking Solutions: www.intel.com/network
Intel Virtualization Technology for Connectivity Tech Brief: softwarecommunity.intel.com/isn/downloads/virtualization/pdfs/20137_LAD_VTc_Tech_Brief_r04.pdf
Virtual Machine Device Queues White Paper: www.intel.com/technology/platform-technology/virtualization/VMDq_whitepaper.pdf
VMware ESX Server 3 Configuration Guide – Update 2 for ESX 3.5: www.vmware.com/pdf/vi3_35/esx_3/r35u2/vi3_35_25_u2_3_server_config.pdf
(Search for NetQueue/VMDq configuration info)
Intelligent Queueing Technologies for Virtualization: Intel-VMware white paper: http://download.intel.com/network/connectivity/products/s10727_Intel_LAD_VMDq_WP_103008.pdf
Intel 4-Processor Server System S7000FC4UR: http://www.intel.com/products/server/systems/s7000fc4ur/s7000fc4ur-overview.htm
Resources
14
White Paper Consolidation of a Performance-Sensitive Application


Performancetestsandratingsaremeasuredusingspecificcomputersystemsand/orcomponentsandreflecttheapproximateperformanceofIntelproductsasmeasuredbythosetests.Anydifferenceinsystemhardwareorsoftwaredesignorconfigurationmayaffectactualperformance.Buyersshouldconsultothersourcesofinformationtoevaluatetheperformanceofsystemsorcomponentstheyareconsideringpurchasing.Formoreinforma-tiononperformancetestsandontheperformanceofIntelproducts,visitIntelPerformanceBenchmarkLimitations
INFORMATIONINTHISDOCUMENTISPROVIDEDINCONNECTIONWITHINTEL®PRODUCTS.NOLICENSE,EXPRESSORIMPLIED,BYESTOPPELOROTHERWISE,TOANYINTELLECTUALPROPERTY RIGHTSISGRANTEDBYTHISDOCUMENT.EXCEPTASPROVIDEDININTEL’STERMSANDCONDITIONSOFSALEFORSUCHPRODUCTS,INTELASSUMESNOLIABILITYWHATSOEVER,ANDINTEL DISCLAIMSANYEXPRESSORIMPLIEDWARRANTY,RELATINGTOSALEAND/ORUSEOFINTELPRODUCTSINCLUDINGLIABILITYORWARRANTIESRELATINGTOFITNESSFORAPARTICULARPURPOSE,MERCHANTABILITY,ORINFRINGEMENTOFANYPATENT,COPYRIGHTOROTHERINTELLECTUALPROPERTYRIGHT.UNLESSOTHERWISEAGREEDINWRITINGBYINTEL,THEINTELPRODUCTSARENOTDESIGNEDNORINTENDEDFORANYAPPLICATIONINWHICHTHEFAILUREOFTHEINTELPRODUCTCOULDCREATEASITUATIONWHEREPERSONALINJURYORDEATHMAYOCCUR.
Intelmaymakechangestospecificationsandproductdescriptionsatanytime,withoutnotice.Designersmustnotrelyontheabsenceorcharacteristicsofanyfeaturesorinstructionsmarked“reserved”or“undefined.” Intelreservestheseforfuturedefinitionandshallhavenoresponsibilitywhatsoeverforconflictsorincompatibilitiesarisingfromfuturechangestothem.Theinformationhereissubjecttochangewithoutnotice.Donot finalizeadesignwiththisinformation.
Theproductsdescribedinthisdocumentmaycontaindesigndefectsorerrorsknownaserratawhichmaycausetheproducttodeviatefrompublishedspecifications.Currentcharacterized errataareavailableonrequest.ContactyourlocalIntelsalesofficeoryourdistributortoobtainthelatestspecificationsandbeforeplacingyourproductorder.Copiesofdocumentswhich haveanordernumberandarereferencedinthisdocument,orotherIntelliterature,maybeobtainedbycalling1-800-548-4725,orbyvisitingIntel’sWebsiteatwww.intel.com.
Copyright©2009IntelCorporation.Allrightsreserved.Intel,theIntellogo,Xeon,andCorearetrademarksofIntelCorporationintheU.S.andothercountries.*Othernamesandbrandsmaybeclaimedasthepropertyofothers. PrintedinUSA 0109/RS/OCG/XX/PDF PleaseRecycle 321250-001US
We want to hear from you
Join the conversation on Intel’s Open Port: The Server Room
• Bring your questions to the “Ask an Expert” discussion forum
• Share best practices with IT influencers
• Engage with Intel on your Datacenter challenges