Consolidated interim report - Asklepios Kliniken8a70d59b-329a...Consolidated statement of...
36
Consolidated interim report as at 30 September 2014 in accordance with International Financial Reporting Standards As k le pi os Kli nik e n G e se lls c h aft m it b e s c h r ä n kt er H a f tu n g , H a m b ur g
Transcript of Consolidated interim report - Asklepios Kliniken8a70d59b-329a...Consolidated statement of...
Consolidated interim report as at 30 September 2014
in accordance with International Financial Reporting Standards
Asklepios Kliniken Gesellschaft mit beschränkter Haftung, Hamburg
2
Asklepios Kliniken Consolidated Interim Report 9 months 2014 | Content
Content
Interim Group management report 5
Consolidated interim financial statements as at 30 September 2014 18
Consolidated income statement 18
Consolidated statement of comprehensive income 19
Consolidated statement of cash flows 20
Consolidated statement of financial position 21
Statement of changes in consolidated equity 23
Notes to the consolidated interim financial statements 24
3
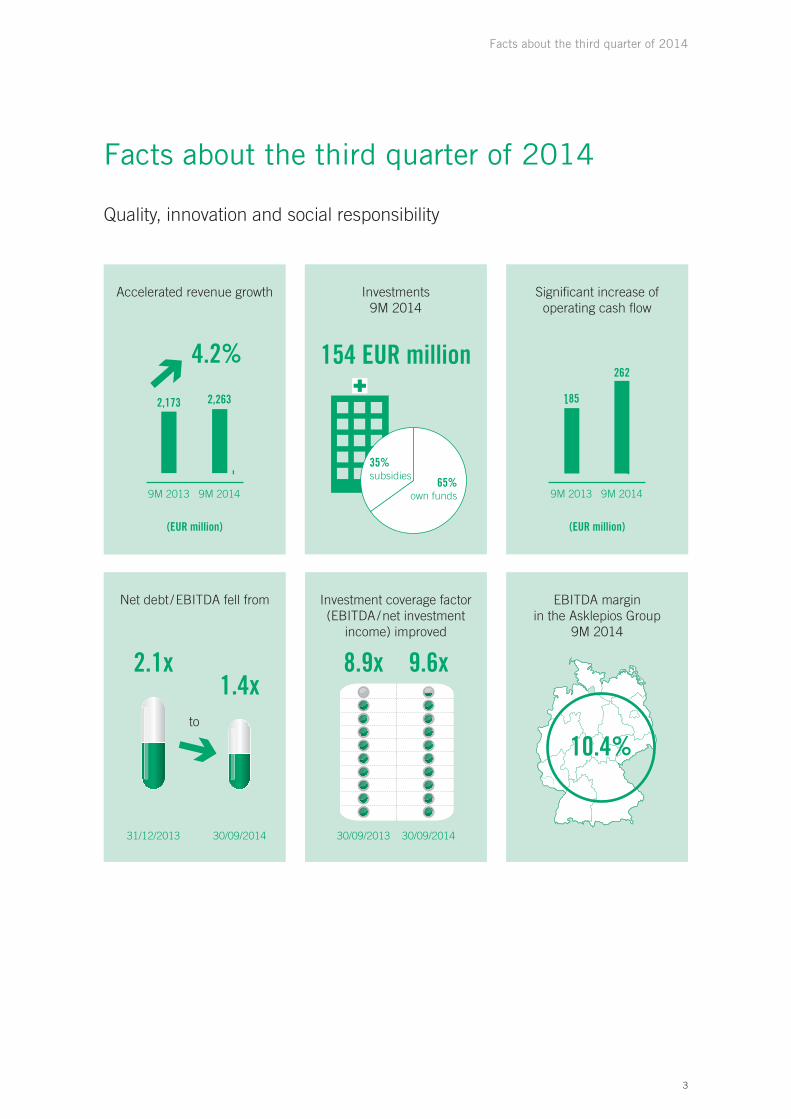
Facts about the third quarter of 2014
Facts about the third quarter of 2014
Quality, innovation and social responsibility
10.4%
EBITDA marginin the Asklepios Group
9M 2014
9M 2013 9M 2014
(EUR million)
262
185
Signifi cant increase of operating cash fl ow
9M 2013 9M 2014
(EUR million)
2,2632,173
4.2%
Accelerated revenue growth
31/12/2013
2.1x1.4x
30/09/2014
to
Net debt / EBITDA fell from
9.6x8.9x
30/09/201430/09/2013
Investment coverage factor (EBITDA / net investment
income) improved
65%own funds
35%subsidies
154 EUR million
Investments9M 2014
4
Asklepios Kliniken Consolidated Interim Report 9 months 2014 | Group key figures
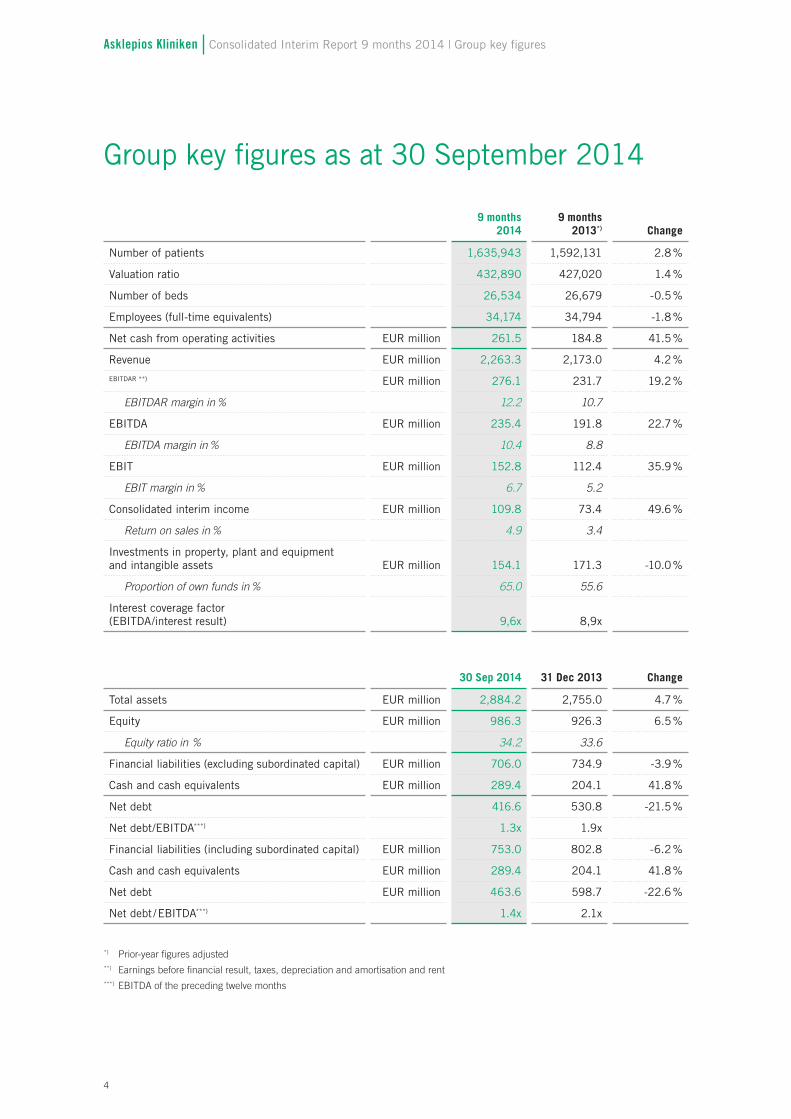
Group key figures as at 30 September 2014
9 months2014
9 months 2013*) Change
Number of patients 1,635,943 1,592,131 2.8 %
Valuation ratio 432,890 427,020 1.4 %
Number of beds 26,534 26,679 -0.5 %
Employees (full-time equivalents) 34,174 34,794 -1.8 %
Net cash from operating activities EUR million 261.5 184.8 41.5 %
Revenue EUR million 2,263.3 2,173.0 4.2 %
EBITDAR **) EUR million 276.1 231.7 19.2 %
EBITDAR margin in % 12.2 10.7
EBITDA EUR million 235.4 191.8 22.7 %
EBITDA margin in % 10.4 8.8
EBIT EUR million 152.8 112.4 35.9 %
EBIT margin in % 6.7 5.2
Consolidated interim income EUR million 109.8 73.4 49.6 %
Return on sales in % 4.9 3.4
Investments in property, plant and equipment and intangible assets EUR million 154.1 171.3 -10.0 %
Proportion of own funds in % 65.0 55.6
Interest coverage factor (EBITDA/interest result) 9,6x 8,9x
30 Sep 2014 31 Dec 2013 Change
Total assets EUR million 2,884.2 2,755.0 4.7 %
Equity EUR million 986.3 926.3 6.5 %
Equity ratio in % 34.2 33.6
Financial liabilities (excluding subordinated capital) EUR million 706.0 734.9 -3.9 %
Cash and cash equivalents EUR million 289.4 204.1 41.8 %
Net debt 416.6 530.8 -21.5 %
Net debt/EBITDA***) 1.3x 1.9x
Financial liabilities (including subordinated capital) EUR million 753.0 802.8 -6.2 %
Cash and cash equivalents EUR million 289.4 204.1 41.8 %
Net debt EUR million 463.6 598.7 -22.6 %
Net debt / EBITDA***) 1.4x 2.1x
*) Prior-year figures adjusted**) Earnings before financial result, taxes, depreciation and amortisation and rent***) EBITDA of the preceding twelve months

5
Interim Group management report
Interim Group management report
A. Asklepios Group maintains high organic growth in third quarter
In the first nine months of 2014, Asklepios generated Group revenue totalling EUR 2,263.3 million, a 4.2 % increase on the same period of the previous year. The income growth resulted primarily from a persistently high, overwhelmingly organic growth of patient numbers. From January to September 2014, a total of 1,635,943 patients were treated at the facilities of the Asklepios Group. Compared to the previous year, this equates to an increase of 43,812 cases or 2.8 %.
The trend that saw the major cost items increasing at a partly much lower rate than revenue in the first half of 2014 continued in the third quarter, leading to a further improvement in earnings. In addition to stable human resources development, active management of operating costs made the greatest impact here. Overall, Asklepios achieved an operating margin at EBITDA level of 10.4 % in the first nine months of 2014 (9M 2013: 8.8 %). The return on sales improved to 4.9 % in the reporting period after 3.4 % in the same period of the previous year.
Net cash from operating activities amounted to EUR 261.5 million, also significantly higher than in the previous year (EUR 184.8 million). This was particularly due to the improved earnings situation and the optimisation of working capital. Sustained high capital expenditure on property, plant and equipment and debt repayments was financed entirely from operating cash flow.
On 30 September 2014, the Group’s net debt had fallen by a further 22.6 % to EUR 463.6 million (31 December 2013: EUR 598.7 million). Only EUR 47.0 million (31 December 2013: EUR 67.9 million) of this figure still related to subordinated capital at a higher interest rate. The debt ratio fell further to 1.4 times EBITDA compared to 2.1 times EBITDA as of 31 December 2013. Solid financial and capital structures also continue to characterise the Asklepios Group. The equity ratio improved to 34.2 % as of 30 September 2014 (31 December 2013: 33.6 %). Cash and cash equivalents of EUR 289.4 million (31 December 2013: EUR 204.1 million) and unutilised credit facilities of approximately EUR 462.0 million mean that the Group has sufficient financial reserves for high internally financed capital expenditure.
Investments for the benefit of patients and employeesIn September 2014, Asklepios Klinikum Harburg opened its new building in Hamburg after nearly two years of construction and total investment of EUR 52.0 million. The extended Central Casualty Department, new cardiac catheterisation laboratories, a new computed tomography scanner, a hybrid operating theatre and state-of-the-art intensive care units are a sign of the consistent modernisation of Asklepios hospitals. The investments serve the best possible patient care as well as securing existing jobs and creating new jobs in the region. Alongside job security, Asklepios is particularly concerned with its employees’ lasting job satisfaction. To compensate for the increasingly intense workload and to prevent potential overloading, Asklepios promotes the health of its employees, not just with the Asklepios Aktiv programme. As in all major new buildings, conversions and renovations, for example, modern facilities like ceiling hoists were also installed in Harburg to reduce Asklepios employees’ physical workload. Furthermore, a total of 600 antimicrobial copper touch surfaces were installed in the intensive care units and other risk areas of the Asklepios Klinikum Harburg as an effective supplement to the established hygiene activities.
Basic, advanced and follow-up training meets high quality requirements with regard to both personal safety and that of the patients. Occupational safety measures through comprehensive training sessions also contribute to

Asklepios Kliniken Consolidated Interim Report 9 months 2014 | Interim Group management report
6
employee safety. Asklepios sees training its employees as its most important success factor and therefore the basis for continuing to offer safe workplaces at all locations in future.
Special attention is paid to employee and patient safety in psychiatry. A special qualification measure – the Asklepios Specialist Qualification in Psychiatric Care – has been launched nationwide, founded on the bedrock of Asklepios employees’ knowledge and abilities. Across all of the Asklepios Group’s psychiatric facilities, accessible training with a standardised curriculum is being organised by employees for employees. This ensures that as many employees as possible regularly receive training in order to always remain at the cutting edge of therapy and care. Patient and employee safety go hand in hand in the Asklepios Group.
B. General economic conditions
Economic development in Germany weakened in mid-2014. According to the German Federal Statistical Office, gross domestic product (GDP) in the second quarter of 2014 shrank by 0.2 % compared to the first quarter of 2014 (when adjusted for prices, seasonal factors and calendar effects). Compared to the same quarter of the previous year, the German economy was on a moderate course of expansion with a GDP increase of 1.2 % in the second quarter when adjusted for prices and calendar effects. In the first quarter of 2014, in contrast, growth was still at a two-year high of 2.3 % year-on-year. Positive stimuli also came from private and government consumer demand again in the second quarter. However, investment declined; the drop was particularly drastic in the construction sector at 4.2 % compared to the first quarter, although this was probably also a result of investments being brought forward due to the unusually mild winter of 2013/2014.
For the third quarter of 2014, the German Institute for Economic Research (DIW) again expects slight quarter-on-quarter growth of 0.2 %, as indicated by the DIW Economic Barometer for September 2014. The Institute assumes that geopolitical crises such as in Ukraine and Iraq may have curbed economic output, but overall they probably had only minor slowing effects.
In its autumn projection of October 2014, the German federal government significantly reduced its forecast for economic growth in Germany in this year and the next. Gross domestic product is now expected to increase by 1.2 % in 2014 and 1.3 % in 2015. Previously, several economic research institutes had already lowered their growth forecasts. In its autumn forecast from the end of September, the Cologne Institute for Economic Research (IW) predicts growth of just 1.5 % in both 2014 and 2015. The German economy is suffering from the sustained weakness of numerous neighbouring European countries and is also feeling the negative effects of the Ukraine conflict. IW argues that investing activity in Germany is also suffering from an economic policy that is inhibiting growth.
However, IW is anticipating continuingly positive but weakened development in the German employment market, stating that the unemployment rate is set to fall from 6.9 % in 2013 to 6.7 % in 2014 and further to 6.6 % in 2015. According to the IW autumn forecast, consumer prices will rise by 1.25 % in 2014 and 1.5 % in 2015. In connection with this, however, IW sees a range of indications that the current moderate price development in the entire euro zone is only a temporary phase.
7
Interim Group management report
C. General sector conditions
The Hospital Rating Report 2014 published by the Rheinisch-Westfälisches Institut für Wirtschaftsforschung (RWI) on the present economic situation of the hospital sector assumes that the financial aid enacted in 2013 from the federal government’s “Aid package for hospitals” is resulting in stabilisation into 2014, but in the medium term the situation remains tense. According to this report, cost increases will be greater than income growth again 2015, as was the case for many years. Therefore, the prevailing investment backlog throughout the entire sector is also expected to continue. The authors estimate the current accumulated investment backlog at around EUR 15 billion. The report says hospitals would have to raise EUR 5.4 billion a year just to cover the present investment requirements. The central statement of the Hospital Rating Report is therefore that nearly half of the German hospital sector does not have sufficient capacity to invest to ensure the maintenance of assets. Around 13 % of hospitals could exit the market by 2020.
Overall, however, cost increases in 2014 are funded somewhat better than in previous years. The financial aid for hospitals enacted prior to the 2013 federal election is contributing to this. The proportional refinancing of wage increases in 2013 and the care surcharge to offset the discounts for additional services are also having a positive impact in 2014. Moreover, the orientation value, the significant value for the increase in base rates at state level in 2014, is well above the values of previous years at 2.81 %. The positive development of statutory health insurers’ premium income is therefore at least partially passed on directly to the hospitals. The refinancing of the additional costs that arose from the amendment of German hygiene legislation in 2011 likewise enacted by the federal government last year will not have a significant effect, however.
In terms of demand, the situation varies considerably from regional to region and hospital to hospital, but overall the weakening of growth momentum observed in previous years is continuing. In some German states, the hospital market is still characterised by rising demand for medical services. At the same time, the performance of individual hospitals is very diverse. Developments range from declines in performance to growth well into the double-digit percentages. A year-on-year deceleration of growth can now also be discerned in the psychiatric departments, but the growth remains greater than in the somatic segment.
D. Outlook
Asklepios uses its financial strength to make continuously high investments in its locations from own funds. The opening of Asklepios Klinikum Harburg’s extensive new building in September 2014 is an outstanding example of this. But Asklepios also regularly invests in buildings and technical equipment in all other locations throughout Germany. The proportion of own funds in total investments in the current financial year will again be higher than the average in the hospital sector. In connection with substantial expenditure for the training and education of personnel, the Asklepios Group sees this as a significant reason for the ongoing organic growth of patient numbers. As well as increasing the attractiveness of the facilities for patients and referring doctors, the investments also frequently improve efficiency both in terms of the consumption of resources and clinical processes.
The organic growth is likewise supported by stronger cooperation and targeted network building within the Group, with a focus on establishing care structures that are as comprehensive as possible. Asklepios estimates that corresponding measures and targeted offerings in high-demand medical fields will make it possible to prevail in the present environment and to generate above-average growth.

Asklepios Kliniken Consolidated Interim Report 9 months 2014 | Interim Group management report
8
The Asklepios Group’s business goals for 2014 include organic revenue growth in a range of around 2 % to 4 % and a slight but sustainable increase in EBIT and EBITDA compared to the previous year. After the first nine months of 2014, Asklepios is firmly at the upper end of these targets with revenue growth of 4.2 % and EBITDA of EUR 235.4 million.
We also expect to achieve our business goals over the year as a whole.
E. Net assets, financial position and results of operations
1) Business performance and results of operations
EUR’0009 months
20149 months
2013Relative change
Revenue 2,263,305 2,173,002 4.2 %
Other operating income 162,820 154,042 5.7 %
Cost of materials 510,022 506,145 0.8 %
Staff costs 1,456,503 1,410,845 3.2 %
Other operating expenses (not including rental expenditure) 183,471 178,346 2.9 %
EBITDAR 276,129 231,708 19.2 %
Rental expenditure 40,739 39,939 2.0 %
EBITDA 235,390 191,769 22.7 %
Depreciation, amortisation and impairment 82,631 79,385 4.1 %
EBIT 152,759 112,384 35.9 %
Net finance costs -22,871 -19,741 15.9 %
Income taxes -20,044 -19,196 4.4 %
Consolidated interim income 109,844 73,447 49.6 %
Revenue increased by 4.2 % from EUR 2,173.0 million to EUR 2,263.3 million. This resulted from the number of patients increasing by 43,812 or 2.8 % to 1,635,943. The growth was almost entirely organic.
84.7 % (previous year: 85.0 %) of revenue was generated in acute-care hospitals, 14.5 % (previous year: 14.2 %) in rehabilitation clinics and 0.8 % (the same as in the previous year) in other facilities.
Other operating income of EUR 162.8 million (previous year: EUR 154.0 million) includes income from other services, additional operations, cost reimbursements, other grants and miscellaneous other operating income.

9
Interim Group management report
Group key figures9 months
20149 months
2013Absolute
change
Total patients 1,635,943 1,592,131 2.8 %
Valuation ratio 432,890 427,020 1.4 %
Number of beds 26,534 26,679 -0.5 %
Patient numbers increased from 1,592,131 in the same period of the previous year to their current level of 1,635,943. This effect primarily resulted from the stronger cooperation and targeted network building between Asklepios hospitals. The further expansion of care structures that are as comprehensive as possible in combination with targeted offerings in high-demand medical fields is the focus here. The somatic segment achieved performance growth (valuation ratio) of +1.4 % (+5,870 valuation ratio) due to capex and structural measures.
Average inpatient case income increased slightly from EUR 3,794.88 to EUR 3,893.06 in the third quarter of 2014. With a slight decrease in the number of beds accompanied by a rise in the number of hospitalisation days in the post-acute area, utilisation increased to 84.2 % (previous year: 83.2 %).
The cost and earnings ratios developed as follows:
9 months 2014
9 months 2013
Cost of materials ratio 22.5 % 23.3 %
Staff costs ratio 64.4 % 64.9 %
Other expenses ratio (not including rental expenditure) 8.1 % 8.2 %
Rental expense ratio 1.8 % 1.8 %
EBITDA 10.4 % 8.8 %
Depreciation and amortisation expense ratio 3.7 % 3.7 %
EBIT 6.7 % 5.2 %
Net finance costs ratio -1.0 % -0.9 %
Tax expense ratio -0.9 % -0.9 %
Consolidated interim income 4.9 % 3.4 %
The Asklepios Group succeeded in reducing the ratio of cost of materials and of staff costs in the third quarter of the current financial year. This was achieved even though, in terms of costs, increases in both staff costs and the cost of materials have been seen for some time due to quantitative and price effects. In addition, the discrepancy between rising costs due to continuously increasing energy prices, material and staff costs and capped remuneration for medical treatment is continuing to widen in 2014.
Cost of materials increased to a lower extent than revenue, rising by 0.8 % or EUR 3.9 million to EUR 510.0 million in the third quarter. The cost of materials ratio was lowered from 23.3 % in the previous year to 22.5 % thanks to active cost management. The measures to cut operating expenses took effect, especially in the field of high-priced implants. Energy costs remained a cost driver, especially as the measures taken in this area will only take full effect in the coming years. Nevertheless, costs relating to water, energy and fuels were reduced. The high production costs for cytostatics also impacted the cost of materials, although these were offset by increased
Asklepios Kliniken Consolidated Interim Report 9 months 2014 | Interim Group management report
10
income from dispensing cytostatics.
In absolute terms, staff costs also rose more slowly than revenue, increasing by 3.2 % from EUR 1,410.8 million to EUR 1,456.5 million. This resulted in a reduction in the staff costs ratio from 64.9 % to 64.4 %. Overall, the absolute increase in staff costs was due to wage increases in collective agreements concluded in the previous year. In the current 2014 financial year, the present collective wage agreements are again having a negative impact on the earnings situation due to rising staff costs.
Asklepios reported a change in other operating expenses (excluding rental expenditure) of EUR 5.2 million to EUR 183.5 million (previous year: EUR 178.3 million). The ratio of 8.1 % was slightly lower than the 8.2 % of the previous year. Costs were increased in particular by expenses for litigation and damage claims, maintenance and servicing.
EBITDA improved to EUR 235.4 million in the third quarter of 2014 after EUR 191.8 million in the previous year. This corresponds to a margin of 10.4 % in the third quarter of 2014 (previous year: 8.8 %) and an increase of 1.6 percentage points.
In the third quarter of 2014, the depreciation and amortisation expense ratio was 3.7 %, at the same level as in the previous year.
With EBIT amounting to EUR 152.8 million after EUR 112.4 million in the same period of the previous year, the EBIT margin improved to 6.7 % (previous year: 5.2 %).
The financial result was EUR -22.9 million (previous year: EUR -19.7 million). While interest income increased to EUR 1.9 million, interest expenses climbed by EUR 3.3 million to EUR 26.5 million.
Income taxes increased slightly to EUR -20.0 million (previous year: EUR -19.2 million).
Consolidated net income increased year-on-year, climbing from EUR 73.4 million to EUR 109.8 million in the period under review. In the third quarter of 2014, the return on sales was 4.9 % (previous year: 3.4 %).

11
Interim Group management report
2) Comparison of third quarter
July to September 2014 2013Relative change
Patients 539,773 531,783 1.5 %
EUR’000
Revenue 752,488 728,311 3.3 %
Other operating income 50,205 49,465 1.5 %
Cost of materials 168,714 169,553 -0.5 %
Staff costs 475,306 461,964 2.9 %
Other operating expenses (not including rental expenditure) 61,035 61,822 -1.3 %
EBITDAR 97,638 84,437 15.6 %
Rental expenditure 13,827 13,072 5.8 %
EBITDA 83,811 71,365 17.4 %
Depreciation, amortisation and impairment 28,040 26,978 3.9 %
EBIT 55,771 44,387 25.6 %
Operating cash flow 114,200 102,600 11.3 %
The quarterly comparison shows that the increase in patient numbers resulted in revenue growth of 3.3 %. The Group’s active cost management meant that the cost of materials declined in the third quarter compared to the same period of the previous year and the other expense ratios’ development was largely stable. EBITDA increased by 17.4 % and operating cash flow rose by EUR 11.6 million to EUR 114.2 million.
3) Financial position and net assets
As a conservative company in terms of finance, the Group’s financing structure is generally long-term in nature. Accordingly, most underlying credit volumes are hedged against interest fluctuation risks in the long term. The operating management of cash and cash equivalents and the financing of Group entities are performed via the Group holding company. Cash and cash equivalents are invested carefully and with a view to creditworthiness, involving broad diversification across banks within the three major deposit protection systems in Germany.
In addition to cash and cash equivalents of EUR 289.4 million, the Group has unutilised credit facilities of around EUR 462.0 million at its disposal. The high internal financing power and the relatively moderate level of net debt protect the Group from further financial market risks.
One of the central elements of the Group’s financing strategy consists of sustainably optimising capital costs. The starting point for this approach is the long-term limitation of financial risks in the organisation of the operating business. Accordingly, sound financial structures are considered to form an important basis for all significant stages of growth.

Asklepios Kliniken Consolidated Interim Report 9 months 2014 | Interim Group management report
12
The debt ratio – measured as net debt/EBITDA – fell again. According to internal guidelines, this ratio must not exceed 3.5x. The following table illustrates how this performance indicator was calculated as at the end of the quarter:
EUR million 30 Sep 2014 31 Dec 2013
Financial liabilities (including subordinated capital) 753.0 802.8
Cash and cash equivalents 289.4 204.1
Net liabilities (including subordinated capital) 463.6 598.7
EBITDA (for the preceding four quarters) 328.0 284.4
Net debt/EBITDA 1.4x 2.1x
This means that, at 1.4x (31 December 2013: 2.1x), this indicator is well within the internally specified guidelines in the current financial year.
Compared with German industry as a whole and the relevant competitors within the industry, this leverage can be considered positively low. In addition, the interest coverage factor (EBITDA/interest result) amounted to 9.6x in the third quarter (same period of the previous year: 8.9x).
Summarised statement of financial position in EUR million 30 Sep 2014 31 Dec 2013
Non-current assets 2,034.3 70.5 % 2,001.1 72.6 %
Current assets 849.9 29.5 % 753.9 27.4 %
ASSETS 2,884.2 100 % 2,755.0 100.0 %
Equity 986.3 34.2 % 926.3 33.6 %
Participation capital/subordinated capital 47.0 1.6 % 67.9 2.5 %
Non-current liabilities and provisions 1,262.0 43.8 % 1,237.4 44.9 %
Current liabilities and provisions 588.9 20.4 % 523.4 19.0 %
EQUITY AND LIABILITIES 2,884.2 100.0 % 2,755.0 100.0 %
The balance sheet and financing structures are sound. Total assets increased from EUR 2,755.0 million in the previous year to EUR 2,884.2 million. Equity rose by EUR 60.0 million to EUR 986.3 million. The equity ratio amounted to 34.2 % (31 December 2013: 33.6 %) of total assets. Non-current assets are covered by long-term disposable capital. Asklepios has permanent interest-free and redemption-free access to subsidies of approximately EUR 1,263.1 million (31 December 2013: EUR 1,287.1 million). As these subsidies will only fall due for repayment in the hypothetical event of no longer being included in the hospital plan, these funds are in effect similar to equity.
13
Interim Group management report
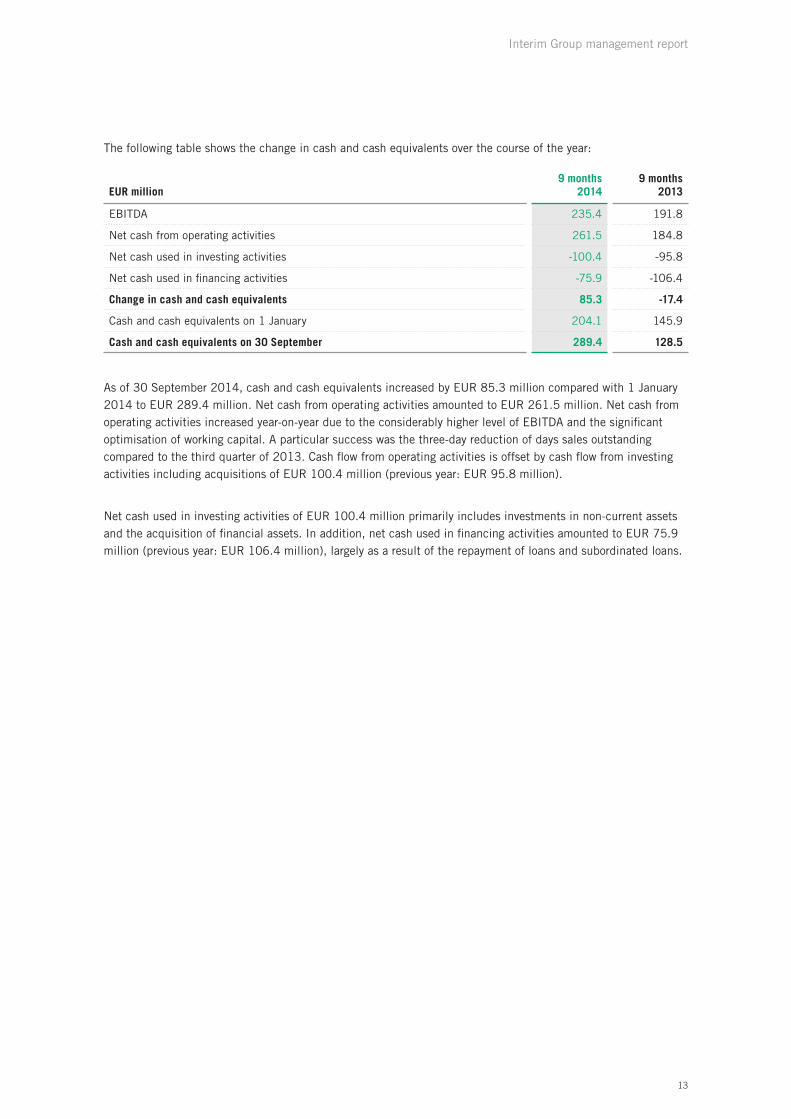
The following table shows the change in cash and cash equivalents over the course of the year:
EUR million9 months
20149 months
2013
EBITDA 235.4 191.8
Net cash from operating activities 261.5 184.8
Net cash used in investing activities -100.4 -95.8
Net cash used in financing activities -75.9 -106.4
Change in cash and cash equivalents 85.3 -17.4
Cash and cash equivalents on 1 January 204.1 145.9
Cash and cash equivalents on 30 September 289.4 128.5
As of 30 September 2014, cash and cash equivalents increased by EUR 85.3 million compared with 1 January 2014 to EUR 289.4 million. Net cash from operating activities amounted to EUR 261.5 million. Net cash from operating activities increased year-on-year due to the considerably higher level of EBITDA and the significant optimisation of working capital. A particular success was the three-day reduction of days sales outstanding compared to the third quarter of 2013. Cash flow from operating activities is offset by cash flow from investing activities including acquisitions of EUR 100.4 million (previous year: EUR 95.8 million).
Net cash used in investing activities of EUR 100.4 million primarily includes investments in non-current assets and the acquisition of financial assets. In addition, net cash used in financing activities amounted to EUR 75.9 million (previous year: EUR 106.4 million), largely as a result of the repayment of loans and subordinated loans.
Asklepios Kliniken Consolidated Interim Report 9 months 2014 | Interim Group management report
14
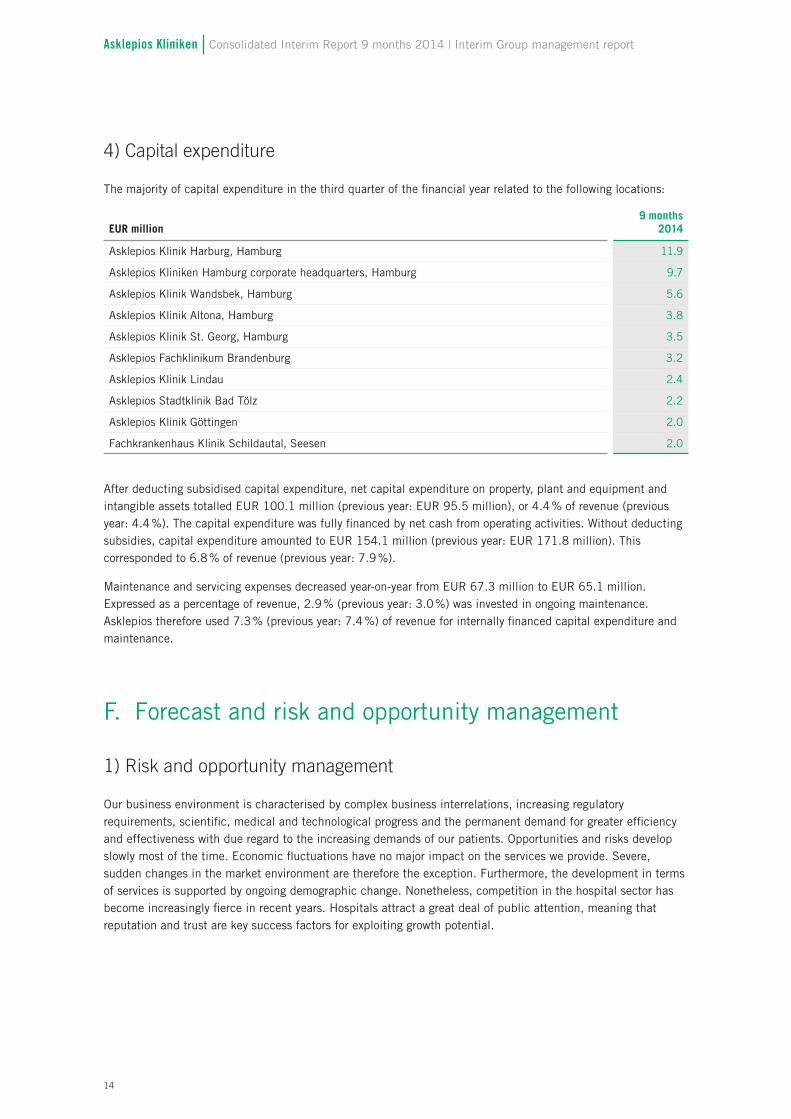
4) Capital expenditure
The majority of capital expenditure in the third quarter of the financial year related to the following locations:
EUR million9 months
2014
Asklepios Klinik Harburg, Hamburg 11.9
Asklepios Kliniken Hamburg corporate headquarters, Hamburg 9.7
Asklepios Klinik Wandsbek, Hamburg 5.6
Asklepios Klinik Altona, Hamburg 3.8
Asklepios Klinik St. Georg, Hamburg 3.5
Asklepios Fachklinikum Brandenburg 3.2
Asklepios Klinik Lindau 2.4
Asklepios Stadtklinik Bad Tölz 2.2
Asklepios Klinik Göttingen 2.0
Fachkrankenhaus Klinik Schildautal, Seesen 2.0
After deducting subsidised capital expenditure, net capital expenditure on property, plant and equipment and intangible assets totalled EUR 100.1 million (previous year: EUR 95.5 million), or 4.4 % of revenue (previous year: 4.4 %). The capital expenditure was fully financed by net cash from operating activities. Without deducting subsidies, capital expenditure amounted to EUR 154.1 million (previous year: EUR 171.8 million). This corresponded to 6.8 % of revenue (previous year: 7.9 %).
Maintenance and servicing expenses decreased year-on-year from EUR 67.3 million to EUR 65.1 million. Expressed as a percentage of revenue, 2.9 % (previous year: 3.0 %) was invested in ongoing maintenance. Asklepios therefore used 7.3 % (previous year: 7.4 %) of revenue for internally financed capital expenditure and maintenance.
F. Forecast and risk and opportunity management
1) Risk and opportunity management
Our business environment is characterised by complex business interrelations, increasing regulatory requirements, scientific, medical and technological progress and the permanent demand for greater efficiency and effectiveness with due regard to the increasing demands of our patients. Opportunities and risks develop slowly most of the time. Economic fluctuations have no major impact on the services we provide. Severe, sudden changes in the market environment are therefore the exception. Furthermore, the development in terms of services is supported by ongoing demographic change. Nonetheless, competition in the hospital sector has become increasingly fierce in recent years. Hospitals attract a great deal of public attention, meaning that reputation and trust are key success factors for exploiting growth potential.

15
Interim Group management report
With regard to performance, the statutory regulation of the compensation system is proving to be a challenge. Performance increases are remunerated with price reductions of up to 65 %. And when it comes to cost development, we also have to deal with steadily rising costs, especially staff costs and material expenses, which can be higher than growth due to performance increases. Adequately accounting for resulting income and cost risks is therefore one of the primary tasks of management in order to deal with the gap between income and cost increases that has been widening for years. On the other hand, such risks give rise to additional acquisition opportunities that we will continue to exploit in a selective but targeted way.
The examination procedure agreement for examinations by the MDK was concluded in July 2014. At present, the German Hospital Federation (DKG) and the GKV have yet to issue joint guidance on the interpretation of the examination procedure agreement, meaning that uncertainties concerning the agreed procedure will remain. Although it is generally assumed that the examination procedure will be accelerated, our view is that retrospective coding and, in particular, recoding within the examination procedure will be significantly impaired, while the previous flat-rate expenses of the health insurance funds for unsuccessful MDK examinations at hospitals will become less important. The transition to a flat-rate fee system for psychiatric and psychosomatic facilities (PEPP) in stationary acute care will also have an impact on our results of operations. The transition to PEPP is intended to be mandatory in 2015 but is designed to be budget-neutral until 2017. We are currently adjusting our internal processes to reflect these new requirements. The precise impact on our results of operations is generally expected to be low, although the corresponding empirical data will become more stable over the coming months and years.
In terms of financing, the Group is subject to fundamental capital market risks. However, as a conservative company in terms of finance, and on the basis of the investment terms of the real assets, Asklepios’ financing strategy is long-term in nature and therefore contains manageable short-term refinancing risks.
The high levels of cash and cash equivalents, the constant cash flow, the favourable capital structure (low level of debt), broad diversification of financing partners as well as the extensive undrawn lines of credit demonstrate that we are largely independent of general developments on the capital markets. Accordingly, Asklepios considers the probability of occurrence of financing and liquidity risks that could also lead to rising interest expenses as moderate.
We purposefully use our financial strength for a high proportion of proprietary investments in the hospitals. This increases the attractiveness of our facilities and in large measure supports sustainable organic growth. At the same time, investments improve efficiency and result in lower consequential costs. For the construction and extension of buildings and the furnishing and equipment of our hospitals, we utilise third-party services alongside internal ones. These services can cause delivery problems in the supply chains as well as quality deficits. Therefore, we base purchasing decisions and procurement on careful and continuous monitoring of all our suppliers and the entire market in order to limit these risks efficiently. For some of the properties used by Asklepios, rent reductions were granted and performance-based refunds agreed prior to their recognition by the Group. The corresponding risk is currently considered to be low.
In addition, training and education of specialist and service staff are a high priority for us. By ensuring optimum qualification of our employees, we guarantee high innovation potential and forward-looking processes, not just in the field of advanced medicine, and systematically prevent the lack of qualified staff. Using this approach, we fulfil both our economic and our social responsibility and take advantage of the opportunity to strengthen our brand.

Asklepios Kliniken Consolidated Interim Report 9 months 2014 | Interim Group management report
16
Our goal is to offer modern medical services that are geared towards proximity to the patient. This is supported by cooperation within the Group and targeted network building, with a focus on establishing care structures that are as comprehensive as possible. The Asklepios strategy, which includes targeted offerings in high-demand medical fields, will also contribute to generating above-average growth in future. Sales risks in the healthcare market can nevertheless arise in the areas where location changes have to be made or the quality assessment by patients and referring doctors is lower than for other hospitals in the market.
At the same time, we are aware that risks can arise from our patients’ treatment processes due to unexpected disruptions.
We minimise these operating risks firstly by maximising the quality of treatment that we ensure with our well educated and continually trained staff as part of our pre-defined courses of treatment. Secondly, our modern hospitals guarantee high-level care in terms of quality and technology. Furthermore, our clinical risk management (e.g. CIRS) and structured quality management ensure that we possess adequate preventive systems that we can use to identify potential error sources as well as increasing quality standards and the safety and efficiency of our processes. This ultimately allows us to achieve a permanent improvement in patient safety and treatment quality as well as process quality.
We have insured against claims from our patients, which are not completely avoidable, by using our own insurance model with an appropriate externally arranged deductible. This allows us to partially respond to the steadily rising insurance premiums of external insurers throughout the market, increase the Group’s liquidity and process claim notifications in the interest of patients and the Group itself while also taking account of the increasing claims from overwhelmingly isolated cases in risk management. In addition to patients’ willingness to take legal action, there is a risk of frequent recourse claims by payers. Steadily rising premiums are being observed throughout the market for property insurance, particularly due to unfavourable loss ratios in the construction sector. This correlates with the significant rise in our property insurance expenses. Our internal insurance unit actively observes the markets, develops measures aimed at minimising the number and amount of claims where possible, and uses targeted insurance management to control insurability by way of deductibles and premiums.
These measures are supported by intensified cooperation and targeted network building within the Group, with a focus on establishing care structures that are as comprehensive as possible. The Asklepios strategy, which includes targeted offerings in high-demand medical fields, will also support us in generating above-average growth in future.
As the second-largest provider of healthcare services, our offering is subject to a great deal of public scrutiny. Our aim is maintain the trust in Asklepios and the Group’s reputation and to be permanently open to coverage in all media. At the same time, we cannot rule out the possibility that negative press reports, e.g. on public television, or incriminatory accounts by our employees at some locations that we do not consider to fully reflect the true nature of conditions in our hospitals will damage our public perception and hence represent a risk to our reputation. We will continue to counter these risks by providing comprehensive information to the public and involving it in our strategies, conducting image campaigns and offering ample dialogue.
Potential hygiene and infection risks (e.g. Ebola) are countered by way of appropriate hygiene management concepts, structured workflows and process and continuous employee training. Our activities take adequate account of hygiene needs and requirements, while the process evaluations and improvements forming part of the quality management processes contribute to the further improvement of our workflow quality and efficiency.
Since the reporting as of 31 December 2013, there have been no significant changes in relation to opportunities and risks. As before, we do not see any risks jeopardising the continued existence of the individual companies or the Group.
17
Interim Group management report
2) Report on post-balance sheet date events and expected developments
No events significant for the assessment of the net assets, financial position and results of operations of the Asklepios Group occurred after 30 September 2014 up to the publication of this report.
The business goals for 2014 include organic revenue growth in a range of around 2 % to 4 % and a slight but sustainable increase of earnings at EBIT and EBITDA level compared to the previous year. The equity ratio is expected to increase slightly in the 2014 financial year compared to the previous year. After the major growth efforts, especially in connection with the takeover of what is now Asklepios Kliniken Hamburg GmbH and the consolidation of MediClin AG, the Group is now focusing further on increasing margins instead of external growth. However, Asklepios also regularly examines M&A opportunities with ongoing observation of the acute market in particular. The main area of interest is hospitals that offer a regionally and medically interesting addition to the existing portfolio of medical facilities. Market-leading clusters and integrated courses of treatment secure the Group an advantage over the competition. The focus will also remain on the non-cyclical acute market.
The stated goal remains sustainable business success – particularly in the interests of the patients. The number of beds is to increase on a continual basis over the current year on the basis of Group-wide quality management (2013 report on quality of medical outcomes, 8th edition). With regard to 2014 as a whole, the trend of previous years of a greater increase of outpatients than of inpatients is expected to be borne out. As things stand, the efforts also to tangibly increase the number of inpatients on an organic basis, like in the previous year, will be successful.
As well as financial figures, management will concentrate on two non-financial performance indicators when managing the company. Here, a slight year-on-year increase in valuation ratios and securing/slightly increasing the number of beds is the priority. An unchanged stable level is expected based on the continued measures to increase the Group’s efficiency initiated in 2013. The new compensation system in psychiatric care is expected to be implemented cautiously – certain risks exist here based on the performance of valuation ratios, for which the Group is preparing itself.

Asklepios Kliniken Consolidated Interim Report 9 months 2014 | Consolidated interim financial statements
18
Consolidated interim financial statements
Consolidated income statement*)
EUR’000 Note9 months
20149 months
2013*)
Revenue VI.1 2,263,305 2,173,002
Other operating income VI.2 162,820 154,042
Total operating revenue 2,426,125 2,327,044
Cost of materials 510,022 506,145
Staff costs 1,456,503 1,410,845
Other operating expenses VI.3 224,210 218,285
EBITDA**) 235,390 191,769
Amortisation and impairmentof intangible assets and depreciation and impairment of property, plant and equipment 82,631 79,385
EBIT***) 152,759 112,384
Net investment income 1,733 1,733
Interest and similar income 1,889 1,713
Interest and similar expenses -26,494 -23,187
Net finance costs VI.4 -22,871 -19,741
Earnings before income taxes 129,888 92,643
Income taxes VI.5 -20,044 -19,196
Consolidated interim income 109,844 73,447
of which attributable to the parent company 87,668 61,203
of which attributable to non-controlling interests 22,176 12,244
*) Prior-year figures adjusted**) Earnings before financial result, taxes and depreciation and amortisation***) Earnings before financial result and taxes

19
Consolidated interim financial statements
Consolidated statement of comprehensive income
EUR’0009 months
20149 months
2013
Consolidated interim income 109,844 73,447
Change in intrinsic value of interest cap 203 0
Measurement of financial assets 15,519 617
Income taxes -2,624 -98
Total changes in value reclassified to profit or loss if certain conditions are met 13,098 519
Change in actuarial gains (+)/losses (-) from defined benefit pension commitments and similar obligations -72,977 -32,210
Income taxes 11,549 5,097
Total changes in value not reclassified to profit or loss -61,429 -27,113
Total changes in value recognised in equity (other comprehensive income) -48,331 -26,594
Total comprehensive income (total consolidated interim income and other comprehensive income) 61,513 46,853
of which attributable to the parent company 55,867 40,770
of which attributable to non-controlling interests 5,646 6,084

Asklepios Kliniken Consolidated Interim Report 9 months 2014 | Consolidated interim financial statements
20
Consolidated statement of cash flows
EUR’000 Note9 months
20149 months
2013
Consolidated interim income 109,844 73,447
Income taxes 20,044 19,196
Net finance costs 22,871 19,741
Amortisation and impairment of intangible assets and depreciation and impairment of property, plant and equipment 82,631 79,385
Gross cash flow (EBITDA) 235,390 191,769
Other non-cash transactions 939 -266
Changes in inventories, receivables and other assets -4,332 -22,518
Changes in liabilities and provisions 39,578 34,709
Dividend received 1,733 1,733
Interest income 1,888 1,029
Income taxes paid VI.5 -13,646 -21,589
Net cash from operating activities 261,550 184,867
Investments in property, plant and equipment and intangible assets -100,193 -95,729
Proceeds from the disposal of non-current assets 454 2,703
Acquisitions of subsidiaries, equity investments -676 -2,823
and financial assets -100,415 -95,849
Net cash used in investing activities -33,447 +625
Borrowing (+)/repayment (-) of financial liabilities -20,900 -60,757
Repayment of subordinated loans -1,585 -18,479
Net cash used in hospital financing VI.4 -18,477 -21,940
Interest expenses -1,466 -5,863
Distributions -16 0
Changes in equity -75,890 -106,414
Change in cash and cash equivalents 85,245 -17,396
Cash and cash equivalents at the start of the period 204,142 145,945
Cash and cash equivalents at the end of the period VII.5 289,387 128,549
21
Consolidated interim financial statements
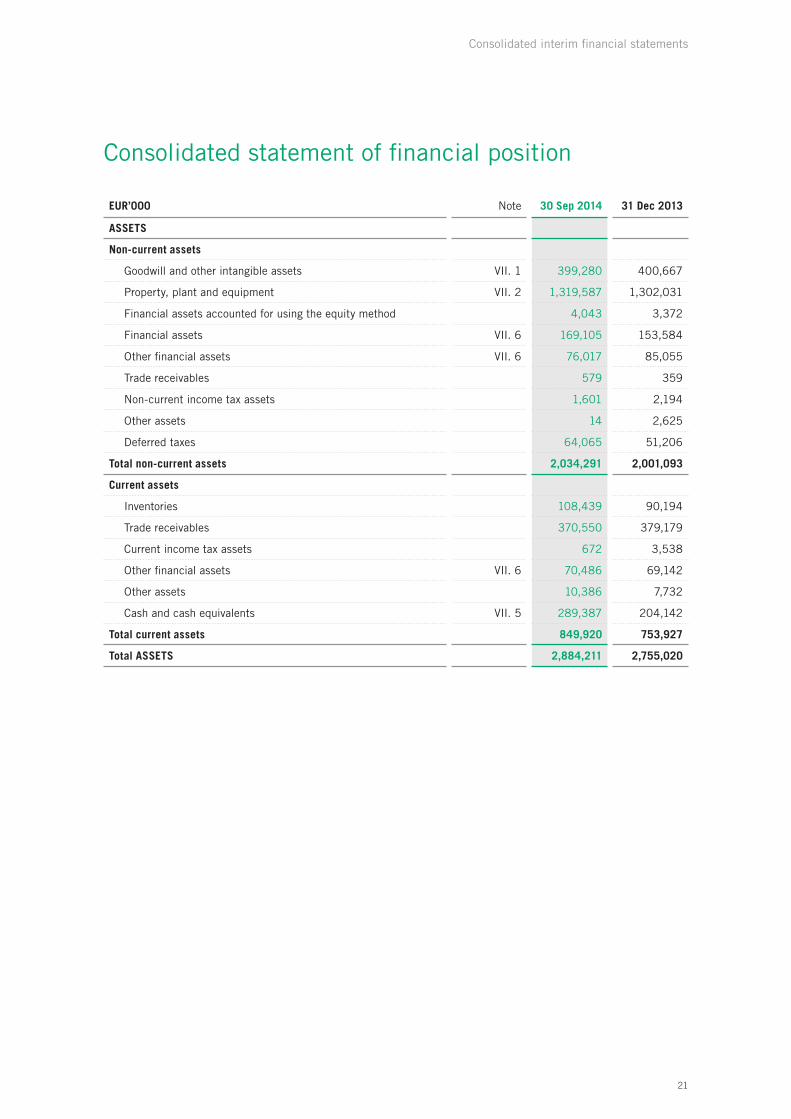
Consolidated statement of financial position
EUR’000 Note 30 Sep 2014 31 Dec 2013
ASSETS
Non-current assets
Goodwill and other intangible assets VII. 1 399,280 400,667
Property, plant and equipment VII. 2 1,319,587 1,302,031
Financial assets accounted for using the equity method 4,043 3,372
Financial assets VII. 6 169,105 153,584
Other financial assets VII. 6 76,017 85,055
Trade receivables 579 359
Non-current income tax assets 1,601 2,194
Other assets 14 2,625
Deferred taxes 64,065 51,206
Total non-current assets 2,034,291 2,001,093
Current assets
Inventories 108,439 90,194
Trade receivables 370,550 379,179
Current income tax assets 672 3,538
Other financial assets VII. 6 70,486 69,142
Other assets 10,386 7,732
Cash and cash equivalents VII. 5 289,387 204,142
Total current assets 849,920 753,927
Total ASSETS 2,884,211 2,755,020

Asklepios Kliniken Consolidated Interim Report 9 months 2014 | Consolidated interim financial statements
22
EUR’000 Note 30 Sep 2014 31 Dec 2013
EQUITY AND LIABILITIES
Equity attributable to the parent company
Issued capital 1,022 1,022
Reserves 684,026 615,434
Consolidated net income 87,668 100,408
Non-controlling interests 213,573 209,393
Total equity VII. 3 986,289 926,257
Non-current liabilities
Trade payables 105 107
Participation capital/subordinated capital VII. 4 0 7,000
Financial liabilities VII. 6 666,053 699,222
Finance lease liabilities 8,852 9,124
Pensions and similar obligations 194,562 119,512
Other provisions 252,017 263,289
Deferred taxes 33,558 31,016
Other financial liabilities 94,374 100,120
Other liabilities 12,514 14,997
Total non-current liabilities 1,262,035 1,244,387
Current liabilities
Trade payables 61,126 73,606
Participation capital/subordinated capital VII. 4 47,000 60,900
Financial liabilities VII. 6 39,932 35,712
Finance lease liabilities 153 203
Pensions and similar obligations 3,161 2,898
Other provisions 90,802 97,095
Current income tax liabilities 8,848 6,413
Other financial liabilities 139,104 117,927
Other liabilities 245,761 189,622
Total current liabilities 635,887 584,376
Total EQUITY AND LIABILITIES 2,884,211 2,755,020

23
Consolidated interim financial statements
Statement of changes in consolidated equity 2014
Equity attributable to the parent company
2014EUR’000
Issued capital
Revenue reserves
Fair value reserves
Conso-lidated net income
Total Non-con-trolling interests
Equity
As of 1 January 2014 1,022 616,631 -1,197 100,408 716,864 209,393 926,257
Consolidated interim income 0 0 0 87,668 87,668 22,176 109,844
Other comprehensive income 0 -44,899 13,098 0 -31,801 -16,530 -48,331
Total comprehensive income 0 -44,899 13,098 87,668 55,867 5,646 61,514
Change in equity interests in consolidated companies 0 -15 0 0 -15 0 -15
Compensation payment obli-gations 0 0 0 0 0 -1,466 -1,466
Allocations to reserves 0 100,408 0 -100,408 0 0 0
Total transactions recognised directly in equity 0 100,393 0 -100,408 -15 -1,466 -1,481
As of 30 September 2014 1,022 672,125 11,901 87,668 772,716 213,573 986,289
Equity attributable to the parent company
2013EUR’000
Issued capital
Revenue reserves
Fair value reserves
Conso-lidated net income
Total Non-con-trolling interests
Equity
As of 1 January 2013 1,022 556,248 -2,355 90,394 645,309 206,218 851,527
Consolidated interim income 0 0 0 61,203 61,203 12,244 73,447
Other comprehensive income 0 -20,953 519 0 -20,433 -6,160 -26,593
Total comprehensive income 0 -20,953 519 61,203 40,770 6,084 46,854
Change in equity interests in consolidated companies 0 -808 0 0 -808 -1,849 -2,657
Compensation payment obli-gations 0 0 0 0 0 -112 -112
Allocations to reserves 0 90,394 0 -90,394 0 0 0
Total transactions recognised directly in equity 0 89,586 0 -90,394 -808 -1,961 -2,769
As of 30 September 2013 1,022 624,881 -1,836 61,203 685,271 210,341 895,612

Asklepios Kliniken Consolidated Interim Report 9 months 2014 | Notes
24
Notes to the consolidated interim financial statements
I. Basis of the consolidated interim financial statements
The company is named Asklepios Kliniken Gesellschaft mit beschränkter Haftung (hereinafter also referred to as “AKG”, the “company” or the “Group”), Rübenkamp 226, 22307 Hamburg (Germany), and is entered in the commercial register of the Hamburg District Court under HRB 98981. The company was formed on 19 June 1985.
Asklepios Kliniken Gesellschaft mit beschränkter Haftung and its subsidiaries operate primarily on the German market in the clinical acute care and rehabilitation sectors as well as, to a very limited extent, in the nursing sector. The purpose of the company is the acquisition and operation of and the provision of consulting services for healthcare institutions.
The Group operates facilities in numerous federal states in Germany. The Group structure is geared towards regional differences in terms of personnel and company law. The operating entities are mainly equity inte-rests in the three sub-group interim financial statements of Asklepios Kliniken Verwaltungsgesellschaft mbH (“AKV”), Königstein im Taunus (100 % equity interest), Asklepios Kliniken Hamburg GmbH (“AKHH”), Ham-burg (74.9 % equity interest), and MediClin Aktiengesellschaft, Offenburg (52.73 % equity interest), that are included in the consolidated interim financial statements.
The Group also has selected foreign operations; to date, this relates almost exclusively to the investment in Greece (Athens Medical Center S.A., Athens).
II. Accounting principles
The consolidated interim financial statements for the period as of 30 September 2014 have been prepared for the results of the first nine months of 2014 in accordance with the requirements of IAS 34 and, pursuant to section 315a of the German Commercial Code (HGB), in accordance with the requirements of the International Financial Reporting Standards (IFRS) issued by the International Accounting Standards Board valid at the end of the reporting period and endorsed by the European Union in the versions effective from 2014.
The fair value reserve changed by EUR 13,098 thousand in the reporting period, with a balance of EUR 11,901 thousand as of 30 September 2014 (31 December 2013: EUR -1,197 thousand).
The change in the fair value of cash flow hedges of EUR -339 thousand (previous year: EUR -541 thousand) and the measurement of financial assets of EUR 12,240 thousand (31 December 2013: EUR -656 thousand) are recognised in this reserve.

25
Notes
Reporting and reclassifications
For a transparent presentation of the results of operations, a portion of revenue was reclassified to other opera-ting income in these financial statements. This primarily relates to income from rental and leasing, pharmacy income and tuition fees. In total, EUR 83.5 million was reclassified to other operating income in the same period of the previous year.
The consolidated interim financial statements do not contain all of the information that is required in the consolidated financial statements prepared at the end of the financial year and should therefore be read in conjunction with the consolidated financial statements for the year ended 31 December 2013.
In order to prepare the consolidated interim financial statements, the accounting policies presented in detail in the 2013 consolidated financial statements were applied unchanged with the exception of the following IFRSs that were required to be applied for the first time as at 1 January 2014. For details, please refer to the corres-ponding explanations.
The following new versions and amendments of IFRS standards and interpretations have come into force but did not have any impact on the figures and disclosures made in the consolidated interim financial statements of the Group when they were applied for the first time, with the exception of the description of accounting policies:
• IFRS 10 - Consolidated Financial Statements
• IFRS 11 - Joint Arrangements
• IFRS 12 - Disclosure of Interests in Other Entities
• New version of IAS 27 - Separate Financial Statements
• New version of IAS 28 - Investments in Associates and Joint Ventures
• Amendments to IAS 32 - Financial Instruments - Offsetting Financial Assets and Financial Liabilities
• Amendments to IFRS 10 - Consolidated Financial Statements, IFRS 11 - Joint Arrangements, IFRS 12 - Disclosure of Interests in Other Entities - Transitional Provisions
• Amendments to IAS 36 - Impairment of Assets - Recoverable Amount Disclosures for Non-Financial Assets
• Amendments to IAS 39 - Financial Instruments - Recognition and Measurement - Novation of Derivatives and Continuation of Hedge Accounting
No changes were required in the consolidated Group on the basis of the regulations of IFRS 10.
The other new regulations have no impact on the disclosures in the interim financial statements.
The IASB draft on accounting for leases will result in a significant increase of the finance lease arrangements to be recognised in the Asklepios Group. This is expected to lead to an increase of non-current assets, stan-dard market financial liabilities, total assets and, because of the omission of rental expenditure, an increase in EBITDA.
Asklepios Kliniken Consolidated Interim Report 9 months 2014 | Notes
26
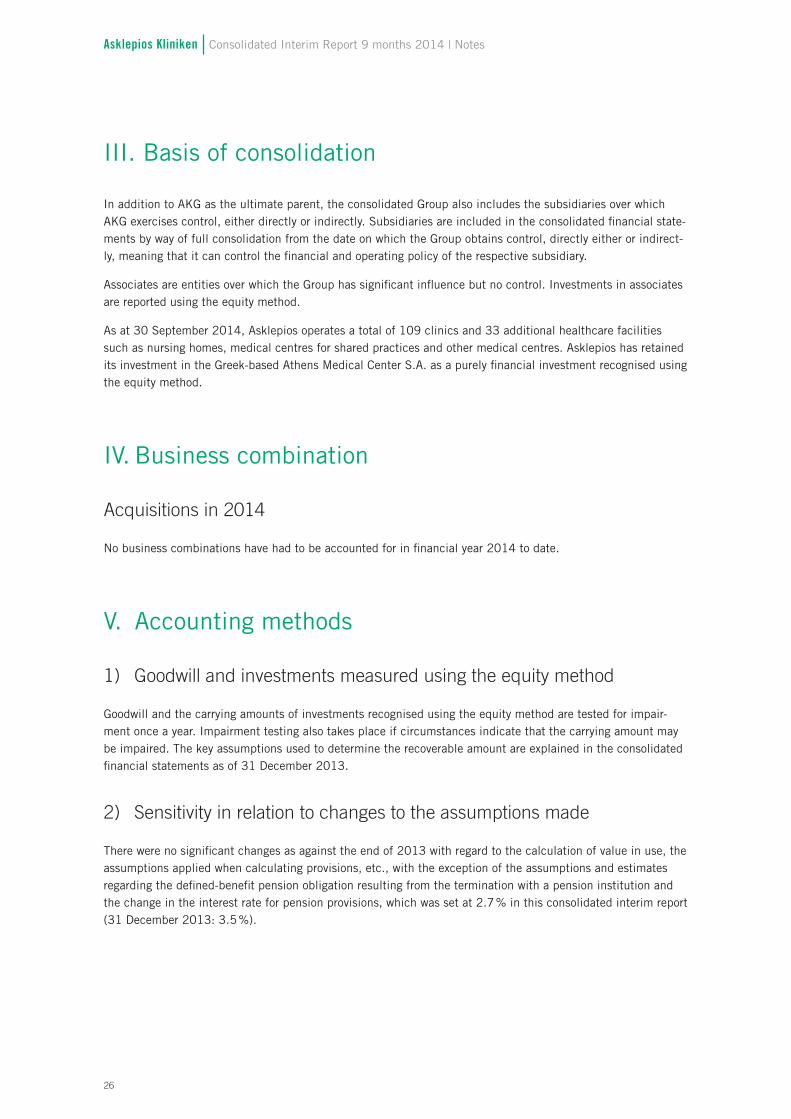
III. Basis of consolidation
In addition to AKG as the ultimate parent, the consolidated Group also includes the subsidiaries over which AKG exercises control, either directly or indirectly. Subsidiaries are included in the consolidated financial state-ments by way of full consolidation from the date on which the Group obtains control, directly either or indirect-ly, meaning that it can control the financial and operating policy of the respective subsidiary.
Associates are entities over which the Group has significant influence but no control. Investments in associates are reported using the equity method.
As at 30 September 2014, Asklepios operates a total of 109 clinics and 33 additional healthcare facilities such as nursing homes, medical centres for shared practices and other medical centres. Asklepios has retained its investment in the Greek-based Athens Medical Center S.A. as a purely financial investment recognised using the equity method.
IV. Business combination
Acquisitions in 2014
No business combinations have had to be accounted for in financial year 2014 to date.
V. Accounting methods
1) Goodwill and investments measured using the equity method
Goodwill and the carrying amounts of investments recognised using the equity method are tested for impair-ment once a year. Impairment testing also takes place if circumstances indicate that the carrying amount may be impaired. The key assumptions used to determine the recoverable amount are explained in the consolidated financial statements as of 31 December 2013.
2) Sensitivity in relation to changes to the assumptions made
There were no significant changes as against the end of 2013 with regard to the calculation of value in use, the assumptions applied when calculating provisions, etc., with the exception of the assumptions and estimates regarding the defined-benefit pension obligation resulting from the termination with a pension institution and the change in the interest rate for pension provisions, which was set at 2.7 % in this consolidated interim report (31 December 2013: 3.5 %).

27
Notes
VI. Selected notes to the consolidated interim income statement
1) Revenue
Revenue breaks down by business segment as follows:
EUR millionQ3
2014Q3
20139 months
20149 months
2013
Business segments
Clinical acute care 632.7 619.2 1,917.8 1,847.2
Post-acute and rehabilitation treatment 113.6 105.6 326.7 309.4
Social and welfare facilities 4.8 4.8 14.1 14.3
Other 1.4 -1.3 4.7 2.1
Total 752.5 728.3 2,263.3 2,173.0
2) Other operating income
Other operating income breaks down as follows:
EUR million9 months
20149 months
2013
Income from operations 50.4 44.6
Income from ancillary, additional and other operations 50.6 50.3
Income from other grants 24.5 22.2
Income from cost reimbursements 23.2 25.9
Miscellaneous other operating income 14.1 11.0
Total 162.8 154.0
Income from operations includes income from pharmacy sales. Miscellaneous other income comprises various items from current operations.
Asklepios Kliniken Consolidated Interim Report 9 months 2014 | Notes
28
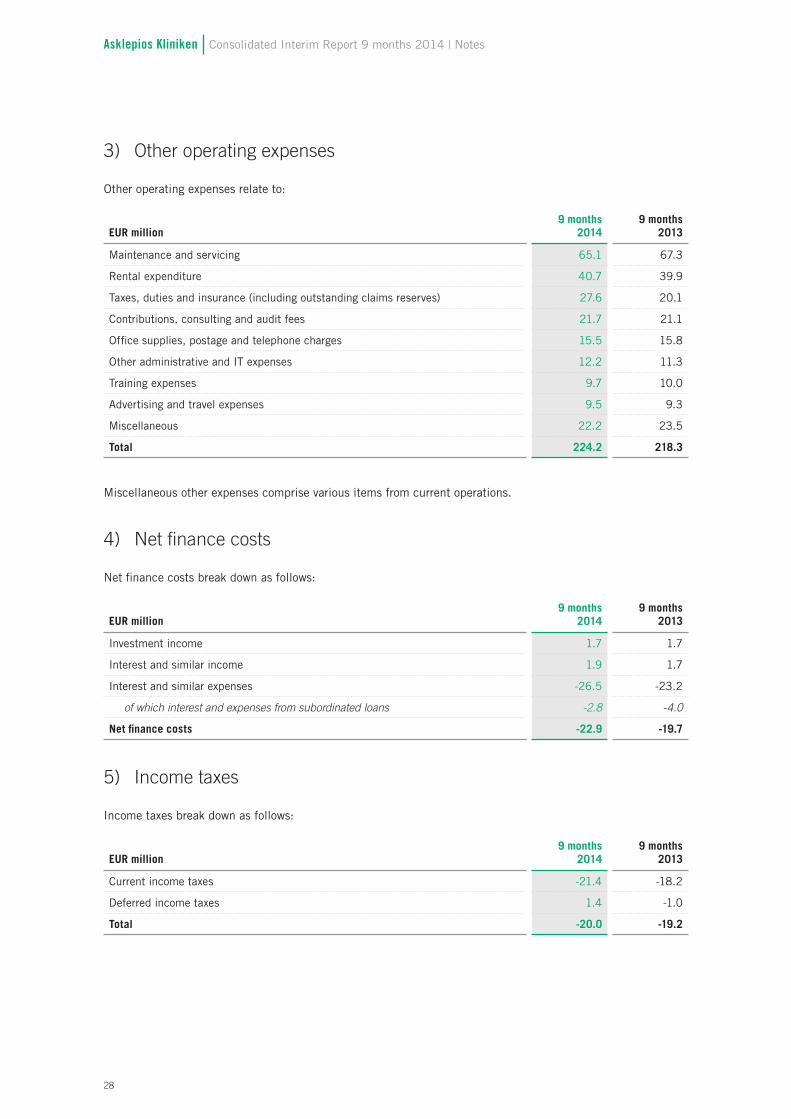
3) Other operating expenses
Other operating expenses relate to:
EUR million9 months
20149 months
2013
Maintenance and servicing 65.1 67.3
Rental expenditure 40.7 39.9
Taxes, duties and insurance (including outstanding claims reserves) 27.6 20.1
Contributions, consulting and audit fees 21.7 21.1
Office supplies, postage and telephone charges 15.5 15.8
Other administrative and IT expenses 12.2 11.3
Training expenses 9.7 10.0
Advertising and travel expenses 9.5 9.3
Miscellaneous 22.2 23.5
Total 224.2 218.3
Miscellaneous other expenses comprise various items from current operations.
4) Net finance costs
Net finance costs break down as follows:
EUR million9 months
20149 months
2013
Investment income 1.7 1.7
Interest and similar income 1.9 1.7
Interest and similar expenses -26.5 -23.2
of which interest and expenses from subordinated loans -2.8 -4.0
Net finance costs -22.9 -19.7
5) Income taxes
Income taxes break down as follows:
EUR million9 months
20149 months
2013
Current income taxes -21.4 -18.2
Deferred income taxes 1.4 -1.0
Total -20.0 -19.2

29
Notes
VII. Selected notes to the consolidated interim statement of financial position
1) Goodwill and other intangible assets
2014EUR’000 Goodwill
Other intan-gible assets
Prepayments for intangible assets Total
Cost
As of 1 January 2014 367,664 79,260 14,893 461,817
Additions 1,053 2,861 500 4,414
Disposals -709 -278 0 -987
Reclassification 136 826 -733 229
As of 30 September 2014 368,144 82,669 14,660 465,473
Cumulative depreciation, amortisation and impairment
As of 1 January 2014 -15,565 -45,585 0 -61,150
Additions 0 -5,837 0 -5,837
Disposals 525 269 0 794
Reclassification 0 0 0 0
As of 30 September 2014 -15,040 -51,153 0 -66,193
Residual carrying amounts
As of 31 December 2013 352,099 33,675 14,893 400,667
As of 30 September 2014 353,104 31,516 14,660 399,280

Asklepios Kliniken Consolidated Interim Report 9 months 2014 | Notes
30
2) Property, plant and equipment
2014EUR’000
Land and buildings including buildings on third-party land
Technical equipment and machi-nery
Operating and office equipment
Assets under construction Total
Cost
As of 1 January 2014 1,438,989 97,973 407,328 55,353 1,999,643
Additions 7,083 3,809 34,313 50,489 95,694
Disposals -428 -2,522 -5,465 -37 -8,452
Reclassification 5,013 3,473 2,134 -10,850 -231
As of 30 September 2014 1,450,657 102,733 438,310 94,955 2,086,654
Cumulative depreciation, amortisation and impairment
As of 1 January 2014 -419,801 -43,200 -234,611 0 -697,612
Additions -33,873 -5,770 -37,151 0 -76,794
Disposals 489 2,509 4,340 0 7,338
Reclassification 0 0 0 0 0
As of 30 September 2014 -453,185 -46,461 -267,422 0 -767,068
Residual carrying amounts
As of 31 December 2013 1,019,188 54,773 172,717 55,353 1,302,031
As of 30 September 2014 997,472 56,272 170,888 94,955 1,319,587
3) Equity
In accordance with IAS 1, the development of equity is presented in a statement of changes in consolidated equity, which is a separate component of the interim financial statements. A remeasurement in accordance with IAS 19.8 in conjunction with a multiemployer plan led to actuarial losses of EUR 17.8 million in the third quarter of 2014.
4) Subordinated capital
Participation certificates issued by the company with an average term to maturity of around nine years are recognised in subordinated capital. These are subordinated to all non-subordinated creditors but have the same standing as other participation certificate holders and rank above the shareholders, including shareholder loans made in lieu of equity.
The holder of the participation certificates can change the interest rate depending on the form of a key financial covenant for a portion of the participation capital if certain key financial covenants are not complied with. EUR 47.0 million of the participation capital is subject to a fixed interest rate. Participation capital is subject to a nominal and effective interest rate of 7.3 %.
The subordinated shareholder loan of EUR 20.9 million was already repaid in full in the second quarter of 2014.

31
Notes
5) Cash and cash equivalents
Cash and short-term deposits are subject to variable interest rates. Short-term deposits are made for different periods of time depending on the Group’s liquidity requirements. Interest is charged at the respective inte-rest rates applicable for short-term deposits. The fair value of cash and cash equivalents corresponds to their carrying amount.
6) Additional information on financial instruments
Determination of fair valueThe following table shows financial instruments measured at fair value analysed in terms of in terms of measu-rement method. The different levels are as follows:
• Level 1 shows market prices (unadjusted) used on the active market for identical assets and liabilities.
• Level 2 shows inclusive data, apart from the level 1 market prices, that are observable for the assets and liabilities either directly (i.e. as price) or indirectly (i.e. derived from price).
• Level 3 shows inclusive data for assets and liabilities not based on market data (on this level, the Group’s investments are reported at amortised cost, as no market price can be determined for them).
The fair value of financial instruments that are traded on the active market is based on the quoted market bid price at the close of business at the end of the reporting period. The market is considered active if quoted prices are readily and regularly available from an exchange, dealer, industry group, pricing service or regulato-ry agency, and those prices represent current and regularly occurring market transactions on an arm’s length basis.
The fair value of financial instruments that are not traded on an active market is calculated using a valuation technique. Fair value is thus estimated on the basis of the results of a valuation technique that makes maxi-mum use of market inputs, and relies as little as possible on entity-specific inputs. If all inputs required for measuring fair value are observable, the instrument is assigned to level 2.
If one or more significant factors are not based on observable market data, the instrument is assigned to level 3. In the reporting period, there were no changes (additions, disposals, gains and losses or items to be recogni-sed in OCI) to the financial assets assigned to level 3.
There were no transfers between the different measurement levels.
30 September 2014EUR million Level 1 Level 2 Level 3 Net total
Financial assets 0.0 0.0 1.4 1.4
Securities 166.1 0.0 0.0 166.1
Financial liabilities 0.0 2.1 0.0 2.1
31 December 2013EUR million Level 1 Level 2 Level 3 Net total
Financial assets 0.0 1.9 1.4 3.3
Securities 147.6 0.0 0.0 147.6
Financial liabilities 0.0 1.9 0.0 1.9

Asklepios Kliniken Consolidated Interim Report 9 months 2014 | Notes
32
Carrying amounts, amounts recognised and fair values by class and measurement category
Amount recognised in statement of financial position as per IAS 39
2014EUR’000
Measu-rement category as per IAS 39
Carrying amount 30 Sep 2014
Amorti-sed cost Cost
Fair value not recog-nised in profit or loss
Fair value re-cognised in profit or loss
Amount recog-nised in state-ment of financial position as per IAS 17
Fair value 30 Sep2014
ASSETS 976,124 809,982 0 166,142 0 0 976,124
Cash and cash equivalents LaR 289,387 289,387 0 0 0 0 289,387
Trade receivables LaR 371,129 371,129 0 0 0 0 371,129
Other financial assets AfS 166,142 0 0 166,142 0 0 166,142
Other financial assets (derivatives) n.a. 0 0 0 0 0 0 0
Other financial assets LaR 149,466 149,466 0 0 0 0 149,466
EQUITY AND LIABILITIES 1,056,699 1,054,611 0 2,088 0 9,005 1,082,503
Trade payables FLAC 61,231 61,231 0 0 0 0 61,231
Financial liabilities FLAC 705,985 705,985 0 0 0 0 714,908
Participation ca-pital/subordinated capital FLAC 47,000 47,000 0 0 0 0 47,000
Finance lease liabilities n.a. 9,005 9,005 0 0 0 9,005 9,005
Other financial liabi-lities (derivatives) n.a. 2,088 0 0 2,088 0 0 2,088
Other financial liabilities FLAC 231,390 231,390 0 0 0 0 248,271
Of which: aggregated by measurement category according to IAS 39:
Loans and receivables LaR 809,982 809,982 0 0 0 0 809,982
Available-for-sale financial assets AfS 166,142 0 0 166,142 0 0 166,142
Financial liabilities measured at amortised cost FLAC 1,045,606 1,045,606 0 0 0 0 1,071,410

33
Notes
Amount recognised in statement of financial position as per IAS 39
2013EUR’000
Measu-rement category as per IAS 39
Carrying amount 31 Dec 2013
Amorti-sed cost Cost
Fair value not recog-nised in profit or loss
Fair value re-cognised in profit or loss
Amount recog-nised in state-ment of financial position as per IAS 17
Fair value 31 Dec 2013
ASSETS 891,461 741,902 0 147,635 1,924 0 891,461
Cash and cash equivalents LaR 204,142 204,142 0 0 0 0 204,142
Trade receivables LaR 379,538 379,538 0 0 0 0 379,538
Other financial assets AfS 149,074 1,439 0 147,635 0 0 149,074
Other financial as-sets (derivatives) n.a. 1,924 0 0 0 1,924 0 1,924
Other financial assets LaR 156,783 156,783 0 0 0 0 156,783
EQUITY AND LIABILITIES 1,103,922 1,102,008 0 1,914 0 9,327 1,106,405
Trade payables FLAC 73,714 73,714 0 0 0 0 73,714
Financial liabilities FLAC 734,934 734,934 0 0 0 0 734,934
Participation capital/subordinated capital FLAC 67,900 67,900 0 0 0 0 70,383
Finance lease liabilities n.a. 9,327 9,327 0 0 0 9,327 9,327
Other financial liabi-lities (derivatives) n.a. 1,914 0 0 1,914 0 0 1,914
Other financial liabilities FLAC 216,133 216,133 0 0 0 0 216,133
Of which: aggregated by measurement category according to IAS 39:
Loans and receivables LaR 740,463 740,463 0 0 0 0 740,463
Available-for-sale financial assets AfS 149,074 1,439 0 147,635 0 0 149,074
Financial liabilities measured at amortised cost FLAC 1,092,681 1,092,681 0 0 0 0 1,092,681

Asklepios Kliniken Consolidated Interim Report 9 months 2014 | Notes
34
Other notes
1) Contingent liabilities and other financial obligations
Other financial obligations break down as follows:
EUR’000 30 Sep 2014 31 Dec 2013
Rental and lease agreements 483,617 472,073
Capital commitments 38,671 46,498
Maintenance and supply agreements 38,013 35,639
Purchase commitments 31,576 38,145
Insurance contracts 2,041 2,171
Miscellaneous 18,453 17,440
Total 612,371 611,966
The obligation arising from rental and lease agreements primarily relates to the real property of MediClin AG that is rented on a long-term basis, excluding obligations already recognised during purchase price allocation. The underlying rental agreements have a term until 31 December 2027. The agreements provide for an annual rent adjustment in the amount of the change in the German Consumer Price Index, but in any case no more than 2 % p.a.
All other financial obligations are carried at their nominal amount and are due as follows:
EUR’000
Less than one year 117,876
Between 2 and 5 years 165,573
More than 5 years 328,922
Total 612,371

35
Notes
2) Related party disclosures
For Asklepios Kliniken Gesellschaft mit beschränkter Haftung, related parties within the meaning of IAS 24.20 include entities controlled by the Group and/or entities over which the Group has a significant influence and vice versa. In particular, subsidiaries and equity investments are therefore defined as related parties.
Transactions with these companies are conducted at arm’s-length conditions.
Dr Bernard gr. Broermann, Königstein-Falkenstein, is the sole shareholder of Asklepios Kliniken Gesellschaft mit beschränkter Haftung.
Compared with the consolidated financial statements as at 31 December 2013, there has been no change to the group of related parties and transactions with these parties in terms of the transaction type and the amount of the proportionate business volume. The same applies to the financial receivables and liabilities that existed with related parties.
To be mentioned in particular is the fact that Asklepios Kliniken Verwaltungsgesellschaft mbH has received a purchase offer for financial assets held by the company from a related party. The related party is contractually obliged to commit to the purchase offer indefinitely. However, the related party can call on AKV in writing at any time to declare acceptance within a period of 30 days. Thereafter, the offer lapses without a requirement for further clarification. The hedging transaction is classified as a fair value hedge.
3) Consolidated statement of cash flows
In the third quarter of 2014, cash and cash equivalents increased by EUR 85.3 million to EUR 289.4 million compared to 31 December 2013. Net cash from operating activities amounted to EUR 261.5 million and was considerably (EUR +76.7 million) higher than the previous year.
Net cash used in investing activities in the amount of EUR 100.4 million related primarily to capital expenditure on equipment for the hospitals. In addition, net cash used in financing activities amounted to EUR 75.9 million, largely as a result of repayments of financial liabilities.
Disclaimer
This interim report includes forward-looking statements. Such forward-looking statements are based on certain assumptions and expectations at the time of publication of this report. They therefore involve risks and uncertainties, and the actual results may diverge considerably from those described in the forward-looking statements. Many of these risks and uncertainties are affected by factors that lie beyond Asklepios Kliniken GmbH’s sphere of influence and that cannot be estimated with certainty from today’s perspective. This includes future market conditions and economic developments, the conduct of other market participants, the achievement of expected synergy effects as well as decisions by legislators and policy makers. Asklepios Kliniken GmbH is not obliged to publish corrections to these forward-looking statements in order to reflect events or conditions occurring after the publication date of this material.
Asklepios Kliniken GmbH
Investor Relations
Debusweg 3
61462 Königstein-Falkenstein
Tel.: + 49 (0) 61 74 90-11 92
Fax.: + 49 (0) 61 74 90-11 10
www.asklepios.com