Consolidated Financial Statements As of and for the year...
68
Gazprom Neft Group Consolidated Financial Statements As of and for the year ended 31 December 2017
Transcript of Consolidated Financial Statements As of and for the year...

Gazprom Neft Group
Consolidated Financial Statements
As of and for the year ended 31 December 2017

AO PricewaterhouseCoopers Audit White Square Office Center 10 Butyrsky Val Moscow, Russia, 125047 T: +7 (495) 967-6000, F:+7 (495) 967-6001, www.pwc.ru
Independent Auditor’s Report
To the Shareholders and Board of Directors of PJSC Gazprom Neft: Our opinion In our opinion, the consolidated financial statements present fairly, in all material respects, the consolidated financial position of PJSC Gazprom Neft (the “Company”) and its subsidiaries (together - the “Group”) as at 31 December 2017, and its consolidated financial performance and its consolidated cash flows for the year then ended in accordance with International Financial Reporting Standards (IFRS).
What we have audited
The Group’s consolidated financial statements comprise:
the consolidated statement of financial position as at 31 December 2017;
the consolidated statement of profit and loss and other comprehensive income for the year then ended;
the consolidated statement of changes in equity for the year then ended;
the consolidated statement of cash flows for the year then ended; and
the notes to the consolidated financial statements, which include significant accounting policies and other explanatory information.
Basis for opinionWe conducted our audit in accordance with International Standards on Auditing (ISAs). Our responsibilities under those standards are further described in the Auditor’s Responsibilities for the Audit of the Consolidated Financial Statements section of our report.
We believe that the audit evidence we have obtained is sufficient and appropriate to provide a basis for our opinion.
Independence
We are independent of the Group in accordance with the International Ethics Standards Board for Accountants’ Code of Ethics for Professional Accountants (IESBA Code) together with the ethical requirements of the Auditor’s Professional Ethics Code and Auditor’s Independence Rules that are relevant to our audit of the consolidated financial statements in the Russian Federation. We have fulfilled our other ethical responsibilities in accordance with these requirements and the IESBA Code.

Our audit approach Overview
Materiality Overall group materiality: Russian Roubles (“RUB”) 13,700 million, which represents 2.5% of the adjusted EBITDA
Audit scope The Group has offices and operations in different countries with parent company and corporate centre located in Saint Petersburg (Russian Federation). We conducted audit work at 28 components in 5 countries.
The group engagement team visited the following locations: Saint Petersburg, Ekaterinburg and Omsk (Russian Federation) as well as Belgrade (Serbia). We also engaged PwC network offices in Serbia, Russia, Austria, Iraq and UAE to perform audit procedures at components.
Our audit scope addressed more than 80% of the Group’s revenues and more than 71% of the Group’s absolute value of underlying profit before tax.
Key audit matters Revenue recognition.
Impairment assessment of Iraqi assets.
We designed our audit by determining materiality and assessing the risks of material misstatement in the consolidated financial statements. In particular, we considered where management made subjective judgements; for example, in respect of significant accounting estimates that involved making assumptions and considering future events that are inherently uncertain. We also addressed the risk of management override of internal controls, including among other matters consideration of whether there was evidence of bias that represented a risk of material misstatement due to fraud.
Materiality
The scope of our audit was influenced by our application of materiality. An audit is designed to obtain reasonable assurance whether the financial statements are free from material misstatement. Misstatements may arise due to fraud or error. They are considered material if individually or in aggregate, they could reasonably be expected to influence the economic decisions of users taken on the basis of the consolidated financial statements.
Based on our professional judgement, we determined certain quantitative thresholds for materiality, including the overall Group materiality for the consolidated financial statements as a whole as set out in the table below. These, together with qualitative considerations, helped us to determine the scope of our audit and the nature, timing and extent of our audit procedures and to evaluate the effect of misstatements, if any, both individually and in aggregate, on the consolidated financial statements as a whole.

Overall group materiality RUB 13,700 million
How we determined it 2.5% of the adjusted EBITDA
Rationale for the materiality benchmark applied
We chose to apply adjusted EBITDA as the benchmark for establishing the materiality level, because we believe it is most commonly used to assess the Group’s performance (see Note 40 to the consolidated financial statements). Management uses adjusted EBITDA as a means of assessing the performance of the Group's ongoing operating activities, as it reflects the Group's earnings trends without showing the impact of certain charges. We established materiality at 2.5%, which is within the range of acceptable quantitative materiality thresholds for profit-oriented entities in this industry.
Key audit matters
Key audit matters are those matters that, in our professional judgment, were of most significance in our audit of the consolidated financial statements of the current period. These matters were addressed in the context of our audit of the consolidated financial statements as a whole, and in forming our opinion thereon, and we do not provide a separate opinion on these matters.
Key audit matter How our audit addressed the Key audit matter
Revenue recognition
Refer to note 2 (“Revenue recognition”) in the consolidated financial statements for the related disclosures of accounting policies.
This year we continued to focus on revenue recognition because of the users’ ongoing attention to this financial reporting line item as a performance measure, its sizable amount in value terms, diversity in sources and essential associated risks of material misstatement due to both fraud and error.
The Group’s revenue consists of different streams, comprising mainly sales of crude oil, petroleum products and other materials on domestic and international markets. The Group sells oil products to industrial customers, via small-scale wholesale distribution channels and via the Group’s own network of retail petrol stations in the Russian Federation and abroad.
This year we launched computer-assisted audit techniques (CAATs) for all hydrocarbons revenue transactions at corporate centre, and all revenue transactions from sales of petroleum and associated products through own retail network of petrol stations in the Russian Federation throughout the audited period. With the help of these techniques, we performed a verification of the calculation of each revenue transaction, based on the applicable price and quantity, as well as its reconciliation with accrued accounts receivable or payment received from the counterparty covering the total revenue population.
Similar to prior year, we evaluated the design and tested operating effectiveness of controls over revenue recognition across significant components (including review of relevant Information Technology controls).

Key audit matter How our audit addressed the Key audit matter
These revenue streams have different terms underlying revenue recognition, including price determination and risks and rewards transfer. Due to the same high volume of transactions, possible manual intervention, different management accounting systems and the interfaces of these with the accounting records, there is the potential for deliberate manipulation or error.
We assessed the risk of fraud and error for each individual revenue stream and tailored audit strategy based on internal control reliance expected for all full-scope significant components audits. Previously established substantive audit approach was reengineered this year with the implementation of computer-assisted audit techniques at corporate centre and the retail component.
At petrol stations, we validated controls over price setting and reconciliation of data between operating and accounting systems in both quantitative and monetary terms.
We performed disaggregated analytics over remaining streams not covered by CAATs and based investigation on contract details and reconciliation of inventory movement starting from production through to final sale.
Our audit plan of substantive procedures this year was limited to detailed testing of selected operations leading to revenue recognition, confirmation of selected accounts receivable balances at the year-end, and check of appropriateness of the timing of revenue recognition by comparing the dates of the transfer of risks and rewards of ownership of goods per contract arrangement against the corresponding dates of revenue recognition. We performed substantive procedures for 80% of the Group’s revenue including all significant and certain other components selected on risk or rotation basis.
Our detailed testing included verification whether the Group was entitled to, and appropriately recognised, revenue in line with their contractual obligations and the Group’s revenue recognition policy. We assessed the consistency in the application of the revenue recognition accounting policy against various sources of the Group’s revenues. We also tested manual journal entries posted to revenue and reconciled actual selling prices to the contractual terms as well as amounts shipped to source shipping documents.
No significant exceptions were noted as the result of our procedures performed.

Key audit matter How our audit addressed the Key audit matter
Impairment assessment of Iraqi assets Refer to notes 2, 3 and 12 in the consolidated financial statements.
The assets located in Iraq have been impaired and written down to recoverable amounts during both 2015 and 2016. We continued to focus on this area in 2017 due to the significant remaining carrying value of these assets. Furthermore, estimation of the ‘value in use’ recoverable amount for these assets requires management to make subjective judgements and estimates about the future results of the business and production volumes, commodity prices and discount rates.
Those assets relate to upstream oil and gas assets located in Kurdistan and Badra, which are governed by the terms of the Production Sharing Agreement (PSA) and the Development and Production Service Contract (PDSC). The Group entered the Iraqi business in 2012. Performance since then has been impacted by a general deterioration in the macroeconomic environment both globally and in Iraq, and by the PSA and DPSC terms and conditions, resulting in the recognition of impairment in the preceding years. Current year impairment testing results and carrying value of the assets related to Iraqi projects are disclosed in N0te 12 Property, plant and equipment.
Management process to determine the ‘value in use’ did not change comparing to previous periods. High volatility of macroeconomic parameters supplemented by political instability in the region together with sensitivity of the model to management assumptions significantly increase estimation uncertainty for this accounting estimate.
We evaluated and challenged the composition of management’s future cash flow forecasts, and the process by which they were prepared confirming validity of any changes implemented from the prior year.
We compared the current year actual results to the figures included in the prior year forecast, to consider whether any forecasts included assumptions that, with hindsight, had been overly optimistic. We extended the use of our internal valuation experts and external data from independent sources in assessing and obtaining audit evidence to support the revised assumptions used in impairment testing. The most significant assumptions relate to future oil prices and discount rates depending on Iraq’s country risk. For the purpose of the analysis of future market prices we have used Brent crude oil quotations as per Bloomberg, IHS, Wood Mackenzie and PIRA Energy Group’s data. We also challenged the discount rate applied by assessing the cost of capital for comparable entities, as well as considering country/territory specific factors. In relation to production volumes, we performed reconciliation of input data to prior year amounts and information received from science and technology center engaged with geological studies within the Group. We found information to be consistent and the assumptions being within the acceptable range. No significant exceptions were noted.
How we tailored our group audit scope
We tailored the scope of our audit in order to perform sufficient work to be able to give an opinion on the consolidated financial statements as a whole, taking into account the geographic and management structure of the Group, the accounting processes and controls and the industry in which the Group operates.

When scoping our group audit we determined the nature of audit procedures and the scope of work to be performed at significant components in order to ensure that we obtain sufficient audit evidence to enable us to provide an opinion on the consolidated financial statements as a whole.
When determining our audit approach we considered materiality of the Group components for the consolidated financial statements, our risk assessment for each component, volume of evidence received from our audit procedures at the level of the Group as a whole as well as risks associated with non-significant components for which no full scope audit procedures were performed.
Based on the above we determined the nature and scope of audit procedures at the level of significant entities as well as at the level of the group as a whole. There were no components with significant risk of material misstatement to the Group consolidated financial statements. However we identified the following significant components where we performed full-scope audit procedures: PJSC Gazprom Neft (parent holding company, corporate centre located in Saint Petersburg, Russian Federation), Gazprom Neft Regional Sales LLC (Russian subsidiary responsible for regional oil products wholesale) and Gazpromneft-Centre LLC (Russian subsidiary responsible for retail oil product sales). Naftna Industrija Srbije a.d. was determined as the fourth significant component where PwC network office in Serbia performed full-scope audit procedures based on our instructions.
In addition to audit evidence obtained at the group level and significant components, we performed specified procedures over selected financial line items of several not significant components. Our selection aimed to cover both oil production and refining entities as well as premium channel sales on a rotational basis. In addition, we evaluated controls over reporting at Gazprom Neft Business Service LLC (Russian subsidiary with divisions located in Saint Petersburg, Omsk, Noyabrsk and Ekaterinburg responsible for accounting and bookkeeping services for all Russian entities). We also leveraged audit evidence obtained by PwC network offices in Russia, Iraq, Austria and UAE during statutory audits of selected components.
Other information Management is responsible for the other information. The other information comprises “Management’s discussion and analysis of financial condition and results of operations for the three months ended December 31 and September 30, 2017 and years ended December 31, 2017 and 2016” (but does not include the consolidated financial statements and our auditor’s report thereon), which we obtained prior to the date of this auditor’s report, and the PJSC Gazprom Neft Annual Report and 1st quarter 2018 Quarterly Issuer’s Report, which are expected to be made available to us after that date.
Our opinion on the consolidated financial statements does not cover the other information, and we do not and will not express any form of assurance conclusion thereon.
In connection with our audit of the consolidated financial statements, our responsibility is to read the other information identified above and, in doing so, consider whether the other information is materially inconsistent with the consolidated financial statements or our knowledge obtained in the audit, or otherwise appears to be materially misstated. If, based on the work we have performed on the other information that we obtained prior to the date of this auditor’s report, we conclude that there is a material misstatement of this other information, we are required to report that fact. We have nothing to report in this regard.

Responsibilities of management and those charged with governance for the consolidated financial statements Management is responsible for the preparation and fair presentation of the consolidated financial statements in accordance with IFRS, and for such internal control as management determines is necessary to enable the preparation of consolidated financial statements that are free from material misstatement, whether due to fraud or error.
In preparing the consolidated financial statements, management is responsible for assessing the Group’s ability to continue as a going concern, disclosing, as applicable, matters related to going concern and using the going concern basis of accounting unless management either intends to liquidate the Group or to cease operations, or has no realistic alternative but to do so.
Those charged with governance are responsible for overseeing the Group’s financial reporting process.
Auditor’s responsibilities for the audit of the consolidated financial statements Our objectives are to obtain reasonable assurance about whether the consolidated financial statements as a whole are free from material misstatement, whether due to fraud or error, and to issue an auditor’s report that includes our opinion. Reasonable assurance is a high level of assurance, but is not a guarantee that an audit conducted in accordance with ISAs will always detect a material misstatement when it exists. Misstatements can arise from fraud or error and are considered material if, individually or in the aggregate, they could reasonably be expected to influence the economic decisions of users taken on the basis of these consolidated financial statements.
As part of an audit in accordance with ISAs, we exercise professional judgment and maintain professional scepticism throughout the audit. We also:
Identify and assess the risks of material misstatement of the consolidated financial statements, whether due to fraud or error, design and perform audit procedures responsive to those risks, and obtain audit evidence that is sufficient and appropriate to provide a basis for our opinion. The risk of not detecting a material misstatement resulting from fraud is higher than for one resulting from error, as fraud may involve collusion, forgery, intentional omissions, misrepresentations, or the override of internal control.
Obtain an understanding of internal control relevant to the audit in order to design audit procedures that are appropriate in the circumstances, but not for the purpose of expressing an opinion on the effectiveness of the Group’s internal control.
Evaluate the appropriateness of accounting policies used and the reasonableness of accounting estimates and related disclosures made by management.
Conclude on the appropriateness of management’s use of the going concern basis of accounting and, based on the audit evidence obtained, whether a material uncertainty exists related to events or conditions that may cast significant doubt on the Group’s ability to continue as a going concern. If we conclude that a material uncertainty exists, we are required to draw attention in our auditor’s report to the related disclosures in the consolidated financial statements or, if such disclosures are inadequate, to modify our opinion. Our conclusions are based on the audit evidence obtained up to the date of our auditor’s report. However, future events or conditions may cause the Group to cease to continue as a going concern.
Evaluate the overall presentation, structure and content of the consolidated financial statements, including the disclosures, and whether the consolidated financial statements represent the underlying transactions and events in a manner that achieves fair presentation.


Gazprom Neft Group
Consolidated Financial Statements As of and for the year ended 31 December 2017
Contents Consolidated Statement of Financial Position ..................................................................................... 2 Consolidated Statement of Profit and Loss and Other Comprehensive Income ................................... 3 Consolidated Statement of Changes in Shareholders’ Equity .............................................................. 4 Consolidated Statement of Cash Flows ............................................................................................... 5
Notes to the Consolidated Financial Statements
1. General ........................................................................................................................................ 6 2. Summary of significant accounting policies .................................................................................. 6 3. Critical accounting estimates, assumptions and judgments ........................................................ 16 4. Application of new IFRS ............................................................................................................. 19 5. New accounting standards ......................................................................................................... 19 6. Cash and cash equivalents ........................................................................................................ 22 7. Short-term financial assets ......................................................................................................... 22 8. Trade and other receivables ....................................................................................................... 22 9. Inventories .................................................................................................................................. 22 10. Other taxes receivable................................................................................................................ 23 11. Other current assets ................................................................................................................... 23 12. Property, plant and equipment .................................................................................................... 23 13. Goodwill and other intangible assets .......................................................................................... 25 14. Investments in associates and joint ventures .............................................................................. 26 15. Joint operations .......................................................................................................................... 28 16. Long-term financial assets .......................................................................................................... 28 17. Deferred income tax assets and liabilities ................................................................................... 28 18. Other non-current assets ............................................................................................................ 29 19. Short-term debt and current portion of long-term debt ................................................................ 29 20. Trade and other payables ........................................................................................................... 30 21. Other current liabilities ................................................................................................................ 30 22. Other taxes payable ................................................................................................................... 30 23. Provisions and other accrued liabilities ....................................................................................... 31 24. Long-term debt ........................................................................................................................... 31 25. Finance lease ............................................................................................................................. 33 26. Other non-current financial liabilities ........................................................................................... 33 27. Share capital and treasury shares .............................................................................................. 34 28. Employee costs .......................................................................................................................... 34 29. Other loss / gain, net .................................................................................................................. 34 30. Net foreign exchange loss / gain ................................................................................................ 35 31. Finance income .......................................................................................................................... 35 32. Finance expense ........................................................................................................................ 35 33. Income tax expense ................................................................................................................... 36 34. Cash flow hedges ....................................................................................................................... 36 35. Financial risk management ......................................................................................................... 37 36. Operating leases ........................................................................................................................ 47 37. Commitments and contingencies ................................................................................................ 48 38. Group entities ............................................................................................................................. 49 39. Related party transactions .......................................................................................................... 50 40. Segment information .................................................................................................................. 52 41. Subsequent events ..................................................................................................................... 54 Supplementary information on oil and gas activities (unaudited) ....................................................... 55


Gazprom Neft Group Consolidated Statement of Profit and Loss and Other Comprehensive Income
Currency – RUB millions (except per share data)
The accompanying notes are an integral part of these Consolidated Financial Statements
3
Notes
Year ended 31 December 2017
Year ended 31 December 2016
Sales 2,003,575 1,695,764 Less export duties and sales related excise tax (145,644) (150,156)
Total revenue from sales 40 1,857,931 1,545,608 Costs and other deductions
Purchases of oil, gas and petroleum products (456,037) (351,294) Production and manufacturing expenses (216,530) (201,862) Selling, general and administrative expenses (106,629) (108,981) Transportation expenses (141,982) (132,984) Depreciation, depletion and amortisation (140,998) (129,845) Taxes other than income tax 22 (492,269) (381,131) Exploration expenses (963) (1,195)
Total operating expenses (1,555,408) (1,307,292) Operating profit 302,523 238,316
Share of profit of associates and joint ventures 14 45,504 34,116 Net foreign exchange (loss) / gain 30 (241) 28,300 Finance income 31 10,098 11,071 Finance expense 32 (25,127) (34,282) Other loss, net 29 (7,557) (17,982)
Total other income 22,677 21,223 Profit before income tax 325,200 259,539
Current income tax expense (43,695) (21,290) Deferred income tax expense (11,827) (28,524)
Total income tax expense 33 (55,522) (49,814) Profit for the period 269,678 209,725 Other comprehensive income / (loss)
Currency translation differences 15,603 (48,319) Cash flow hedge, net of tax 34 18,434 31,501 Other comprehensive income / (loss) 28 (166)
Other comprehensive income / (loss) for the period 34,065 (16,984) Total comprehensive income for the period 303,743 192,741 Profit attributable to:
- Gazprom Neft shareholders
253,274 200,179 - Non-controlling interest 16,404 9,546
Profit for the period 269,678 209,725 Total comprehensive income / (loss) attributable to:
- Gazprom Neft shareholders 279,461 198,945 - Non-controlling interest 24,282 (6,204)
Total comprehensive income for the period 303,743 192,741 Earnings per share attributable to Gazprom Neft shareholders
Basic earnings (RUB per share) 53.68 42.43 Diluted earnings (RUB per share) 53.68 42.43 Weighted-average number of common shares
outstanding (millions) 4,718 4,718

Gaz
prom
Nef
t Gro
up
Con
solid
ated
Sta
tem
ent o
f Cha
nges
in S
hare
hold
ers’
Equ
ity
Cur
renc
y –
RU
B m
illio
ns
The
acco
mpa
nyin
g no
tes
are
an in
tegr
al p
art o
f the
se C
onso
lidat
ed F
inan
cial
Sta
tem
ents
4
At
trib
utab
le to
Gaz
prom
Nef
t sha
reho
lder
s
Sh
are
capi
tal
Trea
sury
sh
ares
Ad
ditio
nal
paid
-in c
apita
l R
etai
ned
earn
ings
O
ther
re
serv
es
Tota
l N
on-
cont
rolli
ng
inte
rest
Tota
l eq
uity
Bal
ance
as
of 1
Jan
uary
201
7 98
(1
,170
) 51
,047
1,
276,
210
33,9
55
1,36
0,14
0 84
,027
1,
444,
167
Prof
it fo
r the
per
iod
- -
- 25
3,27
4 -
253,
274
16,4
04
269,
678
Oth
er c
ompr
ehen
sive
inco
me
Cur
renc
y tra
nsla
tion
diffe
renc
es
- -
- -
7,72
5 7,
725
7,87
8 15
,603
C
ash
flow
hed
ge, n
et o
f tax
-
- -
- 18
,434
18
,434
-
18,4
34
Oth
er c
ompr
ehen
sive
inco
me
- -
- -
28
28
- 28
To
tal c
ompr
ehen
sive
inco
me
for t
he p
erio
d -
- -
253,
274
26,1
87
279,
461
24,2
82
303,
743
Tran
sact
ions
with
sha
reho
lder
s, re
cord
ed in
equ
ity
Div
iden
ds d
ecla
red
to e
quity
hol
ders
-
- -
(97,
553)
-
(97,
553)
(2
,433
) (9
9,98
6)
Tran
sact
ion
unde
r com
mon
con
trol (
Not
e 26
) -
- 11
,209
-
- 11
,209
-
11,2
09
Tota
l tra
nsac
tions
with
sha
reho
lder
s -
- 11
,209
(9
7,55
3)
- (8
6,34
4)
(2,4
33)
(88,
777)
B
alan
ce a
s of
31
Dec
embe
r 201
7 98
(1
,170
) 62
,256
1,
431,
931
60,1
42
1,55
3,25
7 10
5,87
6 1,
659,
133
At
trib
utab
le to
Gaz
prom
Nef
t sha
reho
lder
s
Sh
are
capi
tal
Trea
sury
sh
ares
Ad
ditio
nal
paid
-in c
apita
l R
etai
ned
earn
ings
O
ther
re
serv
es
Tota
l N
on-
cont
rolli
ng
inte
rest
Tota
l eq
uity
Bal
ance
as
of 1
Jan
uary
201
6 98
(1
,170
) 44
,326
1,
078,
626
35,1
89
1,15
7,06
9 91
,420
1,
248,
489
Prof
it fo
r the
per
iod
- -
- 20
0,17
9 -
200,
179
9,54
6 20
9,72
5 O
ther
com
preh
ensi
ve (l
oss)
/ in
com
e
C
urre
ncy
trans
latio
n di
ffere
nces
-
- -
- (3
2,56
9)
(32,
569)
(1
5,75
0)
(48,
319)
C
ash
flow
hed
ge, n
et o
f tax
-
- -
- 31
,501
31
,501
-
31,5
01
Oth
er c
ompr
ehen
sive
loss
-
- -
- (1
66)
(166
) -
(166
) To
tal c
ompr
ehen
sive
inco
me
/ (lo
ss) f
or th
e pe
riod
- -
- 20
0,17
9 (1
,234
) 19
8,94
5 (6
,204
) 19
2,74
1 Tr
ansa
ctio
ns w
ith s
hare
hold
ers,
reco
rded
in e
quity
D
ivid
ends
dec
lare
d to
equ
ity h
olde
rs
- -
- (2
,595
) -
(2,5
95)
(1,2
73)
(3,8
68)
Tran
sact
ion
unde
r com
mon
con
trol
- -
6,83
5 -
- 6,
835
- 6,
835
Acqu
isiti
on th
roug
h bu
sine
ss c
ombi
natio
n -
- (1
14)
- -
(114
) 84
(3
0)
Tota
l tra
nsac
tions
with
sha
reho
lder
s -
- 6,
721
(2,5
95)
- 4,
126
(1,1
89)
2,93
7 B
alan
ce a
s of
31
Dec
embe
r 201
6 98
(1
,170
) 51
,047
1,
276,
210
33,9
55
1,36
0,14
0 84
,027
1,
444,
167

Gazprom Neft Group Consolidated Statement of Cash Flows
Currency – RUB millions
The accompanying notes are an integral part of these Consolidated Financial Statements
5
Notes
Year ended 31 December 2017
Year ended 31 December 2016
Cash flows from operating activities Profit before income tax 325,200 259,539 Adjustments for: Share of profit of associates and joint ventures 14 (45,504) (34,116) Loss / (gain) on foreign exchange differences 30 241 (28,300) Finance income 31 (10,098) (11,071) Finance expense 32 25,127 34,282 Depreciation, depletion and amortisation 12,13 140,998 129,845 Net impairment of receivables and other assets - 7,587 Other non-cash items 3,355 3,801
Operating cash flow before changes in working capital 439,319 361,567 Changes in working capital: Accounts receivable 13,655 (30,397) Inventories (20,672) (3,462) Taxes receivable (2,502) 4,218 Other assets (1,752) 8,999 Accounts payable 33,002 12,288 Taxes payable 15,600 19,729 Other liabilities 15,478 3,841
Total effect of working capital changes 52,809 15,216 Income taxes paid (36,530) (22,158) Interest paid (39,449) (36,476) Dividends received 5,551 3,148
Net cash provided by operating activities 421,700 321,297 Cash flows from investing activities
Acquisition of subsidiaries, net of cash acquired - (1,040) Acquisition of investments in joint ventures (8,345) (505) Disposal of investments in joint ventures 476 (483) Bank deposits placement (8,462) (1,425) Repayment of bank deposits 2,529 49,942 Proceeds from sales of other investments 670 3,241 Short-term loans issued (200) (6,940) Repayment of short-term loans issued 33,295 10,815 Long-term loans issued (1,875) (21,904) Repayment of long-term loans issued 13,048 12,684 Purchases of property, plant and equipment and intangible assets (357,090) (384,817) Proceeds from sale of property, plant and equipment, intangible assets 2,210 1,008 Proceeds from sale of other non-current assets 1,706 11,186 Interest received 9,149 4,384
Net cash used in investing activities (312,889) (323,854) Cash flows from financing activities
Proceeds from short-term borrowings 2,210 81,319 Repayment of short-term borrowings (9,207) (95,656) Proceeds from long-term borrowings 354,160 142,947 Repayment of long-term borrowings (343,607) (192,539) Transaction costs directly attributable to the borrowings received (260) (649) Dividends paid to Gazprom Neft shareholders (50,382) (2,598) Dividends paid to non-controlling interest (2,542) (1,254) Repayment of finance lease liabilities (893) -
Net cash used in financing activities (50,521) (68,430) Increase / (decrease) in cash and cash equivalents 58,290 (70,987)
Effect of foreign exchange on cash and cash equivalents (1,303) (9,590) Cash and cash equivalents as of the beginning of the period 33,621 114,198 Cash and cash equivalents as of the end of the period 90,608 33,621

Gazprom Neft Group Notes to the Consolidated Financial Statements As of and for the year ended 31 December 2017
Currency – RUB millions (unless otherwise stated)
6
1. General
Description of business
PJSC Gazprom Neft (the “Company”) and its subsidiaries (together referred to as the “Group”) is a vertically integrated oil company operating in the Russian Federation, CIS and internationally. The Group’s principal activities include exploration, production and development of crude oil and gas, production of refined petroleum products and distribution and marketing operations through its retail outlets.
The Company was incorporated in 1995 and is domiciled in the Russian Federation. The Company is a public joint stock company and was set up in accordance with Russian regulations. PJSC Gazprom (“Gazprom”, a state controlled entity), the Group’s ultimate parent company, owns 95.7% of the shares in the Company.
2. Summary of significant accounting policies
Basis of preparation
The Group maintains its books and records in accordance with accounting and taxation principles and practices mandated by legislation in the countries in which it operates (primarily the Russian Federation). The accompanying Consolidated Financial Statements were primarily derived from the Group’s statutory books and records with adjustments and reclassifications made to present them in accordance with International Financial Reporting Standards ("IFRS").
Subsequent events occurring after 31 December 2017 were evaluated through 26 February 2018, the date these Consolidated Financial Statements were authorised for issue.
Basis of measurement
The consolidated financial statements are prepared on the historical cost basis except that derivative financial instruments, financial investments classified as available-for-sale, and obligations under the Stock Appreciation Rights plan (SAR) are stated at fair value.
Foreign currency translation
The functional currency of each of the Group’s consolidated entities is the currency of the primary economic environment in which the entity operates. In accordance with IAS 21 the Group has analysed several factors that influence the choice of functional currency and, based on this analysis, has determined the functional currency for each entity of the Group. For the majority of the entities the functional currency is the local currency of the entity.
Monetary assets and liabilities have been translated into the functional currency at the exchange rate as of reporting date. Non-monetary assets and liabilities have been translated at historical rates. Revenues, expenses and cash flows are translated into functional currency at average rates for the period or exchange rates prevailing on the transaction dates where practicable. Gains and losses resulting from the re-measurement into functional currency are included in profit and loss, except when deferred in other comprehensive income as qualifying cash flow hedges.
The presentation currency for the Group is the Russian Rouble. Gains and losses resulting from the re-measurement into presentation currency are included in a separate line of equity in the Consolidated Statement of Financial Position.
The translation of local currency denominated assets and liabilities into functional currency for the purpose of these Consolidated Financial Statements does not indicate that the Group could realise or settle, in functional currency, the reported values of these assets and liabilities. Likewise, it does not indicate that the Group could return or distribute the reported functional currency value of capital to its shareholders.

Gazprom Neft Group Notes to the Consolidated Financial Statements As of and for the year ended 31 December 2017
Currency – RUB millions (unless otherwise stated)
7
Principles of consolidation
The Consolidated Financial Statements include the accounts of subsidiaries in which the Group has control. Control implies rights or exposure to variable returns from the involvement with the investee and the ability to affect those returns through the power over the investee. An investor has power over an investee when the investor has existing rights that give it the current ability to direct the relevant activities, i.e. the activities that significantly affect the investee’s returns. An investor is exposed, or has the rights to variable returns from its involvement with investee when the investor’s return from its involvement has the potential to vary as a result of the investee’s performance. The financial statements of subsidiaries are included in the consolidated financial statements of the Group from the date when control commences until the date when control ceases.
In assessing control, the Group takes into consideration potential voting rights that are substantive. Investments in entities that the Group does not control, but where it has the ability to exercise significant influence over operating and financial policies, are accounted for under the equity method except for investments that meet criteria of joint operations, which are accounted for on the basis of the Group’s interest in the assets, liabilities, expenses and revenues of the joint operation. All other investments are classified either as held-to-maturity or as available for sale.
Business combinations
The Group accounts for its business combinations according to IFRS 3 Business Combinations. The Group applies the acquisition method of accounting and recognises identifiable assets acquired and liabilities and contingent liabilities assumed in the acquiree at the acquisition date, measured at their fair values as of that date. Determining the fair value of assets acquired and liabilities assumed requires Management’s judgment and often involves the use of significant estimates and assumptions. Non-controlling interest is measured at fair value (if shares of acquired company have public market price) or at the non-controlling interest’s proportionate share of the acquiree’s net identifiable assets (if shares of acquired company do not have public market price).
Goodwill
Goodwill is measured by deducting the fair value net assets of the acquiree from the aggregate of the consideration transferred for the acquiree, the amount of non-controlling interest in the acquiree and the fair value of an interest in the acquiree held immediately before the acquisition date. Any negative amount (“bargain purchase”) is recognised in profit or loss, after Management identified all assets acquired and all liabilities and contingent liabilities assumed and reviewed the appropriateness of their measurement.
The consideration transferred does not include amounts related to the settlement of pre-existing relationships. Such amounts are generally recognised in profit or loss. Transaction costs, other than those associated with the issue of debt or equity securities, that the Group incurs in connection with a business combination, are expensed as incurred.
Non-controlling interest
Ownership interests in the Group’s subsidiaries held by parties other than the Group entities are presented separately in equity in the Consolidated Statement of Financial Position. The amount of consolidated net income attributable to the parent and the non-controlling interest are both presented on the face of the Consolidated Statement of Profit and Loss and Other Comprehensive Income.

Gazprom Neft Group Notes to the Consolidated Financial Statements As of and for the year ended 31 December 2017
Currency – RUB millions (unless otherwise stated)
8
Changes in ownership interests in subsidiaries without change of control
Transactions with non-controlling interests that do not result in loss of control are accounted for as equity transactions – that is, as transactions with the owners in their capacity as owners. The difference between fair value of any consideration paid and the relevant share acquired of the carrying value of net assets of the subsidiary is recorded in equity. Gains or losses on disposals to non-controlling interests are also recorded in equity.
Disposals of subsidiaries
When the Group ceases to have control any retained interest in the entity is remeasured to its fair value at the date when control is lost, with the change in carrying amount of the investment to the entity recognised in profit or loss. The fair value is the initial carrying amount for the purposes of subsequent accounting for the retained interest as an associate, joint venture or financial asset. In addition, any amounts previously recognised in other comprehensive income in respect of that entity are accounted for as if the Group had directly disposed of the related assets or liabilities. This may mean that amounts previously recognised in other comprehensive income are reclassified to profit or loss.
Acquisitions from entities under common control
Business combinations involving entities under common control are accounted for by the Group using the predecessor accounting approach from the acquisition date. The Group uses predecessor carrying values for assets and liabilities, which are generally the carrying amounts of the assets and liabilities of the acquired entity from the consolidated financial statements of the highest entity that has common control for which consolidated financial statements are prepared. These amounts include any goodwill recorded at the consolidated level in respect of the acquired entity. When these transactions represent transactions with owners in their capacity as owners, the effect on such transactions is included in Additional paid-in capital in Equity.
Investments in associates
An associate is an entity over which the investor has significant influence. Investments in associates are accounted for using the equity method and are recognised initially at cost. The consolidated financial statements include the Group’s share of the profit or loss and other comprehensive income of equity accounted investees, after adjustments to align accounting policies with those of the Group, from the date that significant influence commences until the date that significant influence ceases.
Joint operations and joint ventures
A joint operation is a joint arrangement whereby the parties that have joint control of the arrangement have rights to the assets, and obligations for the liabilities, relating to the arrangement.
A joint venture is a joint arrangement whereby the parties that have joint control of the arrangement have rights to the net assets of the arrangement.
Where the Group acts as a joint operator, the Group recognises in relation to its interest in a joint operation:
- Its assets, including its share of any assets held jointly; - Its liabilities, including its share of any liabilities incurred jointly; - Its revenue from the sale of its share of the output arising from the joint operation; - Its share of the revenue from the sale of the output by the joint operation; and - Its expenses, including its share of any expenses incurred jointly.
With regards to joint arrangements, where the Group acts as a joint venturer, the Group recognises its interest in a joint venture as an investment and accounts for that investment using the equity method.

Gazprom Neft Group Notes to the Consolidated Financial Statements As of and for the year ended 31 December 2017
Currency – RUB millions (unless otherwise stated)
9
Transactions eliminated on consolidation
Intra-group balances and transactions, and any unrealised income and expenses arising from intra-group transactions, are eliminated in preparing the consolidated financial statements. Unrealised gains arising from transactions with equity accounted investees are eliminated against the investment to the extent of the Group’s interest in the investee. Unrealised losses are eliminated in the same way as unrealised gains, but only to the extent that there is no evidence of impairment.
Cash and cash equivalents
Cash represents cash on hand and in bank accounts, that can be effectively withdrawn at any time without prior notice. Cash equivalents include all highly liquid short-term investments that can be converted to a certain cash amount and mature within three months or less from the date of purchase. They are initially recognised based on the cost of acquisition which approximates fair value.
Non-derivative financial assets
The Group has the following non-derivative financial assets: financial assets at fair value through profit or loss, held-to-maturity financial assets, loans and receivables and available-for-sale financial assets.
The Group initially recognises loans and receivables on the date that they are originated. All other financial assets (including assets designated as at fair value through profit or loss) are recognised initially on the trade date, which is the date that the Group becomes a party to the contractual provisions of the instrument.
The Group derecognises a financial asset when the contractual rights to the cash flows from the asset expire, or it transfers the rights to receive the contractual cash flows in a transaction in which substantially all the risks and rewards of ownership of the financial asset are transferred. Any interest in such transferred financial assets that is created or retained by the Group is recognised as a separate asset or liability.
Financial assets at fair value through profit or loss
A financial asset is classified at fair value through profit or loss category if it is classified as held for trading or is designated as such upon initial recognition. Financial assets are designated at fair value through profit or loss if the Group manages such investments and makes purchase and sale decisions based on their fair value in accordance with the Group’s documented risk management or investment strategy. Financial assets at fair value through profit or loss are measured at fair value, and changes therein are recognised in profit and loss.
Held-to-maturity financial assets
If the Group has the positive intent and ability to hold to maturity debt securities that are quoted in an active market, then such financial assets are classified to held-to-maturity category. Held-to-maturity financial assets are recognised initially at fair value. Subsequent to initial recognition held-to-maturity financial assets are measured at amortised cost using the effective interest method, less any impairment losses. Any sale or reclassification of a more than insignificant amount of held-to-maturity investments not close to their maturity would result in the reclassification of all held-to-maturity investments as available-for-sale, and prevent the Group from classifying investment securities as held-to-maturity for the current and the following two financial years.

Gazprom Neft Group Notes to the Consolidated Financial Statements As of and for the year ended 31 December 2017
Currency – RUB millions (unless otherwise stated)
10
Loans and receivables
Loans and receivables is a category of financial assets with fixed or determinable payments that are not quoted in an active market. Such assets are recognised initially at fair value. Subsequent to initial recognition loans and receivables are measured at amortised cost using the effective interest method, less any impairment losses. Allowances are provided for doubtful debts based on estimates of uncollectible amounts. These estimates are based on the aging of the receivable, the past history of settlements with the debtor and current economic conditions. Estimates of allowances require the exercise of judgment and the use of assumptions.
Available-for-sale financial assets
Available-for-sale financial assets are non-derivative financial assets that are designated as available-for-sale or are not classified in any of the above categories of financial assets. Such assets are recognised initially at fair value. Subsequent to initial recognition, they are measured at fair value and changes therein, other than impairment losses and foreign currency differences on available-for-sale debt instruments, are recognised in other comprehensive income and presented within equity in the other reserves line. When an investment is derecognised or impaired, the cumulative gain or loss in equity is reclassified to profit and loss.
Non-derivative financial liabilities
The Group initially recognises debt securities issued and liabilities on the date that they are originated. All other financial liabilities are recognised initially on the trade date on which the Group becomes a party to the contractual provisions of the instrument. The Group derecognises a financial liability when its contractual obligations are discharged, cancelled or expired. The Group classifies non-derivative financial liabilities into the other financial liabilities category. Financial liabilities are recognised initially at fair value. Subsequent to initial recognition, these financial liabilities are measured at amortised cost using the effective interest method. Other financial liabilities comprise loans and borrowings, bank overdrafts, trade and other payables and finance lease liabilities.
Derivative financial instruments
Derivative instruments are recorded at fair value in the Consolidated Statement of Financial Position in either financial assets or liabilities. Realised and unrealised gains and losses are presented in profit and loss on a net basis, except for those derivatives, where hedge accounting is applied.
The estimated fair values of derivative financial instruments are determined with reference to various market information and other valuation methodologies as considered appropriate, however significant judgment is required in interpreting market data to develop these estimates. Accordingly, the estimates are not necessarily indicative of the amounts that the Group could realise in a current market situation.
Hedge accounting
The Group applies hedge accounting policy for those derivatives that are designated as a hedging instrument (currency exchange forwards and interest-rate swaps).
The Group has designated only cash flow hedges – hedges against the exposure to the variability of cash flow currency exchange rates on a highly probable forecast transaction.
The effective portion of changes in the fair value of derivatives that are designated and qualify as cash flow hedges is recognised in other comprehensive income. Changes in the fair value of certain derivative instruments that do not qualify for hedge accounting are recognised immediately in profit and loss.

Gazprom Neft Group Notes to the Consolidated Financial Statements As of and for the year ended 31 December 2017
Currency – RUB millions (unless otherwise stated)
11
When a hedging instrument expires or is sold, or when a hedge no longer meets the criteria for hedge accounting, any cumulative gain or loss existing in equity at that time remains in equity until the forecast transaction occurs. Any ineffective portion is directly recognised in profit and loss. When a forecast transaction is no longer expected to occur, the cumulative gain or loss on any associated hedging instrument that was reported in equity is immediately transferred to profit and loss.
The fair value of the hedge instrument is determined at the end of each reporting period with reference to the market value, which is typically determined by the credit institutions.
Inventories
Inventories, consisting primarily of crude oil, refined oil products and materials and supplies are stated at the lower of cost and net realisable value. The cost of inventories is assigned on a weighted average basis, and includes expenditure incurred in acquiring the inventories, production or conversion costs, and other costs incurred in bringing them to their existing location and condition. Net realisable value is the estimated selling price in the ordinary course of business, less the estimated costs of completion and selling expenses.
Intangible assets
Goodwill that arises on the acquisition of subsidiaries is included in intangible assets. Subsequently goodwill is measured at cost less accumulated impairment losses.
Other intangible assets that are acquired by the Group, which have finite useful lives, are measured at cost less accumulated amortisation and accumulated impairment loss.
Intangible assets that have limited useful lives are amortised on a straight-line basis over their useful lives. Useful lives with respect to intangible assets are determined as follows:
Intangible asset group Average useful life Licenses and software 1-5 years Land rights 25 years
Property, plant and equipment
Property, plant and equipment is stated at cost, net of accumulated depreciation and any impairment. The cost of maintenance, repairs and replacement of minor items of property, plant and equipment are expensed when incurred; renewals and improvements of assets are capitalised. Costs of turnarounds and preventive maintenance performed with respect to oil refining assets are expensed when incurred if turnaround does not involve replacement of assets or installation of new assets. Upon sale or retirement of property, plant and equipment, the cost and related accumulated depreciation and impairment losses are eliminated from the accounts. Any resulting gains or losses are recorded in profit and loss.
Oil and gas properties
Exploration and evaluation assets
Acquisition costs include amounts paid for the acquisition of exploration and development licenses.

Gazprom Neft Group Notes to the Consolidated Financial Statements As of and for the year ended 31 December 2017
Currency – RUB millions (unless otherwise stated)
12
Exploration and evaluation assets include:
- Costs of topographical, geological, and geophysical studies and rights of access to properties to conduct those studies, that are directly attributable to exploration activity;
- Costs of carrying and retaining undeveloped properties; - Bottom hole contribution; - Dry hole contribution; - Costs of drilling and equipping exploratory wells.
The costs incurred in finding, acquiring, and developing reserves are capitalised on a ‘field by field' basis.
Costs of topographical, geological, and geophysical studies, rights of access to properties to conduct those studies are considered as part of oil and gas assets until it is determined that the reserves are proved and are commercially viable. On discovery of a commercially-viable mineral reserve, the capitalised costs are allocated to the discovery.
If no reserves are found, the exploration asset is tested for impairment. If extractable hydrocarbons are found then it should be subject to further appraisal activity, which may include drilling of further wells. If they are likely to be developed commercially (including dry holes), the costs continue to be carried as oil and gas asset as long as some sufficient/continued progress is being made in assessing the commerciality of the hydrocarbons. All such carried costs are subject to technical, commercial and Management review as well as review for impairment at least once a year to confirm the continued intent to develop or otherwise extract value from the discovery. When this is no longer the case, the costs are written off.
Other exploration costs are charged to expense when incurred.
An exploration and evaluation asset is reclassified to property, plant and equipment and intangible assets when the technical feasibility and commercial viability of extracting a mineral resource are demonstrable. Exploration and evaluation assets are assessed for impairment, and any impairment loss is recognised, before reclassification. Exploration and development licenses are classified as property, plant and equipment after transfer from exploration and evaluation assets.
Development costs
Development costs are incurred to obtain access to proved reserves and to provide facilities for extracting, treating, gathering and storing oil and gas. They include the costs of development wells to produce proved reserves as well as costs of production facilities such as lease flow lines, separators, treaters, heaters, storage tanks, improved recovery systems, and nearby gas processing facilities.
Expenditures for the construction, installation, or completion of infrastructure facilities such as platforms, pipelines and the drilling of development wells are capitalised within oil and gas assets.
Depreciation, depletion and amortisation
Depletion of acquisition and development costs of proved oil and gas properties is calculated using the unit-of-production method based on proved reserves and proved developed reserves. Acquisition costs of unproved properties are not amortised.

Gazprom Neft Group Notes to the Consolidated Financial Statements As of and for the year ended 31 December 2017
Currency – RUB millions (unless otherwise stated)
13
Depreciation and amortisation with respect to operations other than oil and gas producing activities is calculated using the straight-line method based on estimated economic lives. Depreciation rates are applied to similar types of buildings and equipment having similar economic characteristics, as shown below:
Asset group Average useful life Buildings and constructions 8-35 years Machinery and equipment 8-20 years Vehicles and other equipment 3-10 years
Catalysts and reagents mainly used in the refining operations are treated as other assets.
Capitalisation of borrowing costs
Borrowing costs directly attributable to the acquisition, construction or production of assets (including oil and gas properties) that necessarily take a substantial time to get ready for intended use or sale (qualifying assets) are capitalised as part of the costs of those assets. Exchange differences arising from foreign currency borrowings to the extent that they are regarded as an adjustment to interest costs are included in the borrowing costs eligible for capitalisation.
Impairment of non-current assets
The carrying amounts of the Group’s non-current assets, other than assets arising from goodwill, inventories, long-term financial assets and deferred tax assets, are reviewed at each reporting date to determine whether there is any indication of impairment.
Goodwill is tested for impairment annually or more frequently if impairment indicators arise. An impairment loss recognised for goodwill is not reversed in a subsequent period.
If any indication of impairment exists, the group makes an estimate of the asset’s recoverable amount. Individual assets are grouped for impairment assessment purposes at the lowest level at which there are identifiable cash flows that are largely independent of the cash flows of other groups of assets (cash-generated units - CGUs). The carrying amount of the CGUs (including goodwill) is compared with their recoverable amount. The recoverable amount of CGUs to which goodwill is allocated is the higher of value in use and fair value less costs of disposal. Where the recoverable amount of the CGUs to which goodwill has been allocated is less than the carrying amount, an impairment loss is recognised.
An impairment loss is recognised in profit and loss. Prior impairments of non-financial assets (other than goodwill) are reviewed for possible reversal at each reporting date.
Impairment of non-derivative financial assets
Financial assets are assessed at each reporting date to determine whether there is any objective evidence of impairment. A financial asset is impaired if objective evidence indicates that a loss event has occurred after the initial recognition of the asset, and that the loss event had a negative effect on the estimated future cash flows of that asset that can be estimated reliably.
The Group considers evidence of impairment for loans and receivables and held-to-maturity investments at both a specific asset and collective level. All individually significant loans and receivables and held-to-maturity investments are assessed for specific impairment. Loans and receivables and held-to-maturity investments that are not individually significant are collectively assessed for impairment by grouping together loans and receivables and held-to-maturity investments with similar risk characteristics.
An impairment loss in respect of a financial asset measured at amortised cost is calculated as the difference between its carrying amount, and the present value of the estimated future cash flows discounted at the asset’s original effective interest rate. Losses are recognised in profit and loss and reflected in an allowance account against loans and receivables or held-to-maturity investments.

Gazprom Neft Group Notes to the Consolidated Financial Statements As of and for the year ended 31 December 2017
Currency – RUB millions (unless otherwise stated)
14
Decommissioning obligations
The Group has decommissioning obligations associated with its core activities. The nature of the assets and potential obligations is as follows:
Exploration and production: the Group’s activities in exploration, development and production of oil and gas in the deposits are related to the use of such assets as wells, well equipment, oil gathering and processing equipment, oil storage tanks and infield pipelines. Generally, licenses and other permissions for mineral resources extraction require certain actions to be taken by the Group in respect of liquidation of these assets after oil field closure. Such actions include well plugging and abandonment, dismantling equipment, soil recultivation, and other remediation measures. When an oil field is fully depleted, the Group will incur costs related to well retirement and associated environmental protection measures.
Refining, marketing and distribution: the Group’s oil refining operations are carried out at large manufacturing facilities that have been operated for several decades. The nature of these operations is such that the ultimate date of decommissioning of any sites or facilities is unclear. Current regulatory and licensing rules do not provide for liabilities related to the liquidation of such manufacturing facilities or of retail fuel outlets. Management therefore believes that there are no legal or contractual obligations related to decommissioning or other disposal of these assets.
Management makes provision for the future costs of decommissioning oil and gas production facilities, wells, pipelines, and related support equipment and for site restoration based on the best estimates of future costs and economic lives of the oil and gas assets. Estimating future asset retirement obligations is complex and requires Management to make estimates and judgments with respect to removal obligations that will occur many years in the future. The Group applies risk-free rate adjusted for specific risks of the liability for the purpose of estimating asset retirement obligations.
Changes in the measurement of existing obligations can result from changes in estimated timing, future costs or discount rates used in valuation.
The amount recognised as a provision is the best estimate of the expenditures required to settle the present obligation at the reporting date based on current legislation in each jurisdiction where the Group’s operating assets are located, and is also subject to change because of revisions and changes in laws and regulations and their interpretation. As a result of the subjectivity of these provisions there is uncertainty regarding both the amount and estimated timing of such costs.
The estimated costs of dismantling and removing an item of property, plant and equipment are added to the cost of the item either when an item is acquired or as the item is used during a particular period. Changes in the measurement of an existing decommissioning obligation that result from changes in the estimated timing or amount of any cash outflows, or from changes in the discount rate are reflected in the cost of the related asset in the current period.
Income taxes
Currently some Group companies including PJSC Gazprom Neft exercise the option to pay taxes as a consolidated tax-payer and are subject to taxation on a consolidated basis. The majority of the Group companies do not exercise such an option and current income taxes are provided on the taxable profit of each subsidiary. Most subsidiaries are subject to the Russian Federation Tax Code, under which income taxes are payable at a rate of 20% after adjustments for certain items, that are either not deductible or not taxable for tax purposes. In some cases income tax rate could be set at lower level as a tax concession stipulated by regional legislation. Subsidiaries operating in countries other than the Russian Federation are subject to income tax at the applicable statutory rate in the country in which these entities operate.

Gazprom Neft Group Notes to the Consolidated Financial Statements As of and for the year ended 31 December 2017
Currency – RUB millions (unless otherwise stated)
15
Deferred income tax assets and liabilities are recognised in the accompanying Consolidated Financial Statements in the amounts determined by the Group using the balance sheet liability method in accordance with IAS 12 Income Taxes. This method takes into account future tax consequences attributable to temporary differences between the carrying amounts of existing assets and liabilities for the purpose of the consolidated financial statements and their respective tax bases and in respect of operating loss and tax credit carry-forwards. Deferred income tax assets and liabilities are measured using the enacted tax rates that are expected to apply to taxable income in the years in which those temporary differences are expected to reverse and the assets recovered and liabilities settled. Deferred tax assets for deductible temporary differences and tax loss carry forwards are recorded only to the extent that it is probable that sufficient future taxable profit will be available against which the deductions can be utilised.
Mineral extraction tax and excise duties
Mineral extraction tax and excise duties, which are charged by the government on the volumes of oil and gas extracted or refined by the Group, are included in operating expenses. Taxes charged on volumes of goods sold are recognised as a deduction from sales.
Share capital
Share capital represents the authorised capital of the Company, as stated in its charter document. The common shareholders are allowed one vote per share. Dividends paid to shareholders are determined by the Board of Directors and approved at the annual shareholders’ meeting.
Treasury stock
Common shares of the Company owned by the Group as of the reporting date are designated as treasury shares and are recorded at cost using the weighted-average method. Gains on resale of treasury shares are credited to additional paid-in capital whereas losses are charged to additional paid-in capital to the extent that previous net gains from resale are included therein or otherwise to retained earnings.
Dividends
Dividends are recorded as a liability and deducted from equity in the period in which they are declared and approved. Any dividends declared after the reporting period and before the Consolidated Financial Statements are authorised for issue are disclosed in the subsequent events note.
Earnings per share
Basic and diluted earnings per common share are determined by dividing the available income to common shareholders by the weighted average number of shares outstanding during the period. There are no potentially dilutive securities.
Stock-based compensation
The Group accounts for its best estimate of the obligation under cash-settled stock-appreciation rights (“SAR”) granted to employees at fair value on the date of grant. The estimate of the final liability is re-measured to fair value at each reporting date and the compensation charge recognised in respect of SAR in profit and loss is adjusted accordingly. Expenses are recognised over the vesting period.
Retirement and other benefit obligations
The Group and its subsidiaries do not have any substantial pension arrangements separate from the State pension scheme of the Russian Federation, which requires current contributions by the employer calculated as a percentage of current gross salary payments; such contributions are charged to expense as incurred. The Group has no significant employee-benefit programs requiring accrual.

Gazprom Neft Group Notes to the Consolidated Financial Statements As of and for the year ended 31 December 2017
Currency – RUB millions (unless otherwise stated)
16
Leases
Leases under the terms of which the Group assumes substantially all the risks and rewards of ownership are classified as finance leases. Upon initial recognition the leased asset is measured at an amount equal to the lower of its fair value and the present value of the minimum lease payments. Subsequent to initial recognition, the asset is accounted for in accordance with the accounting policy applicable to that asset.
Other leases are operating leases and the leased assets are not recognised in the Group’s consolidated statement of financial position. The total lease payments are charged to profit and loss for the year on a straight-line basis over the lease term.
Recognition of revenues
Revenues from the sales of crude oil, petroleum products, gas and all other products are recognised when deliveries are made to final customers, title passes to the customer, collection is reasonably assured, and the sales price to final customers is fixed or determinable. Specifically, domestic crude oil sales and petroleum product and materials sales are recognised when they are shipped to customers, which is generally when title passes. For export sales, title generally passes at the border of the Russian Federation and the Group is responsible for transportation, duties and taxes on those sales.
Revenue is recognised net of value added tax (VAT), excise taxes calculated on revenues based on the volumes of goods sold, customs duties and other similar compulsory payments.
Sales include revenue, export duties and sales related excise tax.
Buy / sell transactions
Purchases and sales under the same contract with a specific counterparty (buy-sell transaction) are eliminated under IFRS. The purpose of the buy-sell operation, i.e. purchase and sale of same type of products in different locations during the same reporting period from / to the same counterparty, is to optimise production capacities of the Group rather than generate profit. After elimination, any positive difference is treated as a decrease in transportation costs and any negative difference is treated as an increase in transportation costs.
Transportation costs
Transportation expenses recognised in profit and loss represent expenses incurred to transport crude oil and oil products through the PJSC “AK “Transneft” pipeline network, costs incurred to transport crude oil and oil products by maritime vessel and railway and all other shipping and handling costs.
Other comprehensive income / loss
All other comprehensive income / loss is presented by the items that are or may be reclassified subsequently to profit or loss, net of related income tax.
3. Critical accounting estimates, assumptions and judgments
Preparing these Consolidated Financial Statements in accordance with IFRS requires Management to make judgements on the basis of estimates and assumptions. These judgements affect the reported amounts of assets and liabilities and the disclosure of contingent assets and liabilities at the reporting date, and the reported amounts of revenues and expenses during the reporting period.

Gazprom Neft Group Notes to the Consolidated Financial Statements As of and for the year ended 31 December 2017
Currency – RUB millions (unless otherwise stated)
17
Management reviews the estimates and assumptions on a continuous basis, by reference to past experiences and other factors that can reasonably be used to assess the book values of assets and liabilities. Adjustments to accounting estimates are recognised in the period in which the estimate is revised if the change affects only that period or in the period of the revision and subsequent periods, if both periods are affected.
Actual results may differ from the judgements, estimates made by the Management if different assumptions or circumstances apply.
Judgments and estimates that have the most significant effect on the amounts reported in these Consolidated Financial Statements and have a risk of causing a material adjustment to the carrying amount of assets and liabilities are described below.
Impairment of non-current assets
The following are examples of impairment indicators, which are reviewed by the Management: changes in the Group’s business plans, changes in oil and commodity prices leading to sustained unprofitable performance, low plant utilisation, evidence of physical damage or, for oil and gas assets, significant downward revisions of estimated reserves or increases in estimated future development expenditure or decommissioning costs. In case any of such indicators exist the Group makes an assessment of recoverable amount.
The long-term business plans (models), which are approved by the Management, are the primary source of information for the determination of value in use. They contain forecasts for oil and gas production, refinery throughputs, sales volumes for various types of refined products, revenues, costs and capital expenditure.
As an initial step in the preparation of these plans, various market assumptions, such as oil prices, refining margins, refined product margins and inflation rates, are set by the Management. These market assumptions take into account long-term oil price forecasts by the research institutions, macroeconomic factors such as inflation rate and historical trends. In assessing value in use, the estimated future cash flows are adjusted for the risks specific to the asset group or CGU and are discounted to their present value using a pre-tax discount rate that reflects current market assessments of the time value of money.
Estimation of oil and gas reserves
Engineering estimates of oil and gas reserves are inherently uncertain and are subject to future revisions on annual basis. The Group estimates its oil and gas reserves in accordance with rules promulgated by the US Securities and Exchange Commission (SEC) for proved reserves. Oil and gas reserves are determined with use of certain assumptions made by the Group, for future capital and operational expenditure, estimates of oil in place, recovery factors, number of wells and cost of drilling. Accounting measures such as depreciation, depletion and amortisation charges that are based on the estimates of proved reserves are subject to change based on future changes to estimates of oil and gas reserves.
Proved reserves are defined as the estimated quantities of oil and gas which geological and engineering data demonstrate recoverability in future years from known reservoirs under existing economic conditions with reasonable certainty. In some cases, substantial new investment in additional wells and related support facilities and equipment will be required to recover such proved reserves. Due to the inherent uncertainties and the limited nature of reservoir data, estimates of underground reserves are subject to change over time as additional information becomes available.

Gazprom Neft Group Notes to the Consolidated Financial Statements As of and for the year ended 31 December 2017
Currency – RUB millions (unless otherwise stated)
18
Oil and gas reserves have a direct impact on certain amounts reported in the consolidated financial statements, most notably depreciation, depletion and amortisation as well as impairment expenses. Depreciation rates on oil and gas assets using the units-of-production method for each field are based on proved developed reserves for development costs, and total proved reserves for costs associated with the acquisition of proved properties. Moreover, estimated proved reserves are used to calculate future cash flows from oil and gas properties, which serve as an indicator in determining whether or not property impairment is present.
Useful lives of property, plant and equipment
Management assesses the useful life of an asset by considering the expected usage, estimated technical obsolescence, residual value, physical wear and tear and the operating environment in which the asset is located. Differences between such estimates and actual results may have a material impact on the amount of the carrying values of the property, plant and equipment and may result in adjustments to future depreciation rates and expenses for the period.
Contingencies
Certain conditions may exist as of the date of these Consolidated Financial Statements are issued that may result in a loss to the Group, but one that will only be realised when one or more future events occur or fail to occur. Management makes an assessment of such contingent liabilities that is based on assumptions and is a matter of judgement. In assessing loss contingencies relating to legal or tax proceedings that involve the Group or unasserted claims that may result in such proceedings, the Group, after consultation with legal and tax advisors, evaluates the perceived merits of any legal or tax proceedings or unasserted claims as well as the perceived merits of the amount of relief sought or expected to be sought therein.
If the assessment of a contingency indicates that it is probable that a loss will be incurred and the amount of the liability can be estimated, then the estimated liability is accrued in the Group’s Consolidated Financial Statements. If the assessment indicates that a potentially material loss contingency is not probable, but is reasonably possible, or is probable but cannot be estimated, then the nature of the contingent liability, together with an estimate of the range of possible loss if determinable and material, is disclosed. If loss contingencies can not be reasonably estimated, Management recognises the loss when information becomes available that allows a reasonable estimation to be made. Loss contingencies considered remote are generally not disclosed unless they involve guarantees, in which case the nature of the guarantee is disclosed. However, in some instances in which disclosure is not otherwise required, the Group may disclose contingent liabilities of an unusual nature which, in the judgment of Management and its legal counsel, may be of interest to shareholders or others.
Joint arrangements
Upon adopting of IFRS 11 the Group applied judgement when assessing whether its joint arrangements represent a joint operation or a joint venture. The Group determined the type of joint arrangement in which it is involved by considering its rights and obligations arising from the arrangement including the assessment of the structure and legal form of the arrangement, the terms agreed by the parties in the contractual arrangement and, when relevant, other facts and circumstances.
Leases
Leases under the terms of which the Group assumes substantially all the risks and rewards of ownership are classified as finance leases. Risks include the possibilities of losses from idle capacities or technological obsolence and of variations in return because of changing economic conditions. Rewards may be represented by the expectation of profitable operation over the assets’s economic life and of gain from appreciation in value or realization of a residual value.
Other leases are classified as operating leases. In most cases leasing of vessels under time-charter agreements are accounted for as operating leases under IAS 17 Leases.

Gazprom Neft Group Notes to the Consolidated Financial Statements As of and for the year ended 31 December 2017
Currency – RUB millions (unless otherwise stated)
19
4. Application of new IFRS
The following standards or amended standards became effective for the Group from 1 January 2017, but did not have any material impact on the Group:
Disclosure Initiative – Amendments to IAS 7 (issued on 29 January 2016 and effective for annual periods beginning on or after 1 January 2017). The new disclosures are included in Note 35.
Recognition of Deferred Tax Assets for Unrealised Losses – Amendment to IAS 12 (issued on 19 January 2016 and effective for annual periods beginning on or after 1 January 2017).
Amendments to IFRS 12 included in Annual Improvements to IFRSs 2014-2016 Cycle (issued on 8 December 2016 and effective for annual periods beginning on or after 1 January 2017).
5. New accounting standards
Certain new standards and interpretations have been issued that are mandatory for the annual periods beginning on or after 1 January 2018 or later, and that the Group has not early adopted.
IFRS 9 – Financial Instruments (amended in July 2014 and effective for annual periods beginning on or after 1 January 2018). Key features of the new standard are:
Financial assets are required to be classified into three measurement categories: those to be measured subsequently at amortised cost, those to be measured subsequently at fair value through other comprehensive income (FVOCI) and those to be measured subsequently at fair value through profit or loss (FVPL). The decision is to be made at initial recognition.
An instrument is subsequently measured at amortised cost only if it is a debt instrument and both (i) the objective of the entity’s business model is to hold the asset to collect the contractual cash flows, and (ii) the asset’s contractual cash flows represent solely payments of principal and interest only. All other debt instruments are to be measured at fair value through profit or loss.
All equity instruments are to be measured subsequently at fair value. Equity instruments that are held for trading will be measured at fair value through profit or loss. For all other equity investments, an irrevocable election can be made at initial recognition, to recognise unrealised and realised fair value gains and losses through other comprehensive income rather than profit or loss. There is no recycling of fair value gains and losses to profit or loss.
Based on an analysis of the Group’s financial assets and financial liabilities as at 31 December 2017 and on the basis of the facts and circumstances those exist at that date, the main changes expected from adoption of IFRS 9 since 1 January 2018 are the following:
Current classification of the Group’s financial assets will be changed into three measurement categories: those to be measured subsequently at fair value (either through profit and loss or other comprehensive income), and at amortised cost. For the debt instruments the decision is to be made depending on (i) the objective of the entity’s business model and (ii) either the asset’s contractual cash flows represent solely payments of principal and interest.
Current model for recognition of impairment losses will be changed into the expected credit losses (ECL) model. However, the Group does not expect any significant changes in impairment amount as current model is based on expert opinion which covers all possible data.
The new standard also introduces expanded disclosure requirements and changes in presentation. These are expected to change the nature and extent of the Group’s disclosures about its financial instruments particularly in the year of the adoption of the new standard.
Changes in the fair value of financial liabilities designated at FVTPL that are attributable to changes in the instrument's credit risk, which will be presented in other comprehensive income rather than profit or loss.
The Group continues to apply IAS 39 for hedge accounting. The management of the Group is not expecting a significant impact on its Consolidated Financial Statements from the adoption of the new standard on 1 January 2018.

Gazprom Neft Group Notes to the Consolidated Financial Statements As of and for the year ended 31 December 2017
Currency – RUB millions (unless otherwise stated)
20
IFRS 15 – Revenue from Contracts with Customers (issued on 28 May 2014 and effective for annual periods beginning on or after 1 January 2018). The new standard introduces the core principle that revenue must be recognised when the goods or services are transferred to the customer, at the transaction price. Any bundled goods or services that are distinct must be separately recognized, and any discounts or rebates on the contract price must generally be allocated to the separate elements. When the consideration varies for any reason, minimum amounts must be recognized if they are not at significant risk of reversal. Costs incurred to secure contracts with customers have to be capitalized and amortized over the period when the benefits of the contract are consumed.
Amendments to IFRS 15, Revenue from Contracts with Customers (issued on 12 April 2016 and effective for annual periods beginning on or after 1 January 2018). The amendments do not change the underlying principles of the Standard but clarify how those principles should be applied. The amendments clarify how to identify a performance obligation (the promise to transfer a good or a service to a customer) in a contract; how to determine whether a company is a principal (the provider of a good or service) or an agent (responsible for arranging for the good or service to be provided); and how to determine whether the revenue from granting a licence should be recognised at a point in time or over time. In addition to the clarifications, the amendments include two additional reliefs to reduce cost and complexity for a company when it first applies the new Standard.
The Group plans to apply the practical expedient available for simplified transition method: IFRS 15 is retrospectively applied only to the contracts that are not completed at the date of initial application (1 January 2018).
Based on the analysis of the Group’s revenue streams for the year ended 31 December 2017 and individual contracts’ terms and on the basis of the facts and circumstances that exist at that date, an impact on the Consolidated Financial Statements from the adoption of the new standard on 1 January 2018 is not significant.
IFRIC 22 "Foreign currency transactions and advance consideration” (issued on 8 December 2016 and effective for annual periods beginning on or after 1 January 2018). This interpretation considers how to determine the date of the transaction when applying the standard on foreign currency transactions, IAS 21. The interpretation applies where an entity either pays or received consideration in advance for foreign currency-denominated contracts. The interpretation specifies that the date of transaction is the date on which the entity initially recognizes the non-monetary asset or non-monetary liability arising from the payment or receipt of advance consideration. If there are multiple payments or receipts in advance, the Interpretation requires an entity to determine the date of transaction for each payment or receipt of advance consideration. This interpretation will not have any material impact on the Group.
IFRS 16, Leases (issued on 13 January 2016 and effective for annual periods beginning on or after 1 January 2019). The new standard sets out the principles for the recognition, measurement, presentation and disclosure of leases. All leases result in the lessee obtaining the right to use an asset at the start of the lease and, if lease payments are made over time, also obtaining financing. Accordingly, IFRS 16 eliminates the classification of leases as either operating leases or finance leases as is required by IAS 17 and, instead, introduces a single lessee accounting model. Lessees will be required to recognise: (a) assets and liabilities for all leases with a term of more than 12 months, unless the underlying asset is of low value; and (b) depreciation of lease assets separately from interest on lease liabilities in the statement of profit and loss and other comprehensive income. IFRS 16 substantially carries forward the lessor accounting requirements in IAS 17. Accordingly, a lessor continues to classify its leases as operating leases or finance leases, and to account for those two types of leases differently. The Group is currently assessing the impact of the new standard on its Consolidated Financial Statements.

Gazprom Neft Group Notes to the Consolidated Financial Statements As of and for the year ended 31 December 2017
Currency – RUB millions (unless otherwise stated)
21
IFRS 17 "Insurance Contracts" (issued on 18 May 2017 and effective for annual periods beginning on or after 1 January 2021). IFRS 17 replaces IFRS 4, which has given companies dispensation to carry on accounting for insurance contracts using existing practices. IFRS 17 is a single principle-based standard to account for all types of insurance contracts, including reinsurance contracts that an insurer holds. New standard will not have any material impact on the Group.
IFRIC 23 "Uncertainty over Income Tax Treatments" (issued on 7 June 2017 and effective for annual periods beginning on or after 1 January 2019). IAS 12 specifies how to account for current and deferred tax, but not how to reflect the effects of uncertainty. The interpretation clarifies how to apply the recognition and measurement requirements in IAS 12 when there is uncertainty over income tax treatments. An entity should determine whether to consider each uncertain tax treatment separately or together with one or more other uncertain tax treatments based on which approach better predicts the resolution of the uncertainty. An entity should assume that a taxation authority will examine amounts it has a right to examine and have full knowledge of all related information when making those examinations. If an entity concludes it is not probable that the taxation authority will accept an uncertain tax treatment, the effect of uncertainty will be reflected in determining the related taxable profit or loss, tax bases, unused tax losses, unused tax credits or tax rates, by using either the most likely amount or the expected value, depending on which method the entity expects to better predict the resolution of the uncertainty. An entity will reflect the effect of a change in facts and circumstances or of new information that affects the judgments or estimates required by the interpretation as a change in accounting estimate. The Group is currently assessing the impact of the interpretation on its Consolidated Financial Statements.
The following other new pronouncements are not expected to have any material impact on the Group when adopted:
Sale or Contribution of Assets between an Investor and its Associate or Joint Venture – Amendments to IFRS 10 and IAS 28 (issued on 11 September 2014 and effective for annual periods beginning on or after a date to be determined by the IASB).
Amendments to IFRS 2, Share-based Payment (issued on 20 June 2016 and effective for annual periods beginning on or after 1 January 2018).
Applying IFRS 9 Financial Instruments with IFRS 4 Insurance Contracts - Amendments to IFRS 4 (issued on 12 September 2016 and effective, depending on the approach, for annual periods beginning on or after 1 January 2018 for entities that choose to apply temporary exemption option, or when the entity first applies IFRS 9 for entities that choose to apply the overlay approach).
Transfers of Investment Property - Amendments to IAS 40 (issued on 8 December 2016 and effective for annual periods beginning on or after 1 January 2018).
Annual Improvements to IFRSs 2014-2016 cycle ‒ Amendments to IFRS 1 an IAS 28 (issued on 8 December 2016 and effective for annual periods beginning on or after 1 January 2018).
Prepayment Features with Negative Compensation - Amendments to IFRS 9 (issued on 12 October 2017 and effective for annual periods beginning on or after 1 January 2019).
Long-term Interests in Associates and Joint Ventures - Amendments to IAS 28 (issued on 12 October 2017 and effective for annual periods beginning on or after 1 January 2019).
Annual Improvements to IFRSs 2015-2017 cycle - Amendments to IFRS 3, IFRS 11, IAS 12 and IAS 23 (issued on 12 December 2017 and effective for annual periods beginning on or after 1 January 2019).

Gazprom Neft Group Notes to the Consolidated Financial Statements As of and for the year ended 31 December 2017
Currency – RUB millions (unless otherwise stated)
22
6. Cash and cash equivalents
Cash and cash equivalents as of 31 December 2017 and 2016 comprise the following:
31 December 2017 31 December 2016
Cash on hand 946 882 Cash in bank 46,107 21,284 Deposits with original maturity of less than three months 28,816 8,647 Other cash equivalents 14,739 2,808
Total cash and cash equivalents 90,608 33,621
7. Short-term financial assets
Short-term financial assets as of 31 December 2017 and 2016 comprise the following:
31 December 2017 31 December 2016 Deposits with original maturity more than 3 months less than 1 year 5,779 886 Short-term loans issued 4,670 41,136 Forward contracts - cash flow hedge - 91
Total short-term financial assets 10,449 42,113
The loans issued as of 31 December 2017 and 2016 mainly comprise loans issued to a joint venture. 8. Trade and other receivables
Trade and other receivables as of 31 December 2017 and 2016 comprise the following:
Notes 31 December 2017 31 December 2016 Trade receivables 107,758 121,229 Other financial receivables 2,071 6,604 Less impairment provision 35 (7,567) (12,274)
Total trade and other receivables 102,262 115,559 Trade receivables represent amounts due from customers in the ordinary course of business and are short-term by nature.
9. Inventories
Inventories as of 31 December 2017 and 2016 consist of the following:
31 December 2017 31 December 2016 Petroleum products and petrochemicals 55,828 47,467 Crude oil and gas 28,200 20,059 Materials and supplies 23,143 26,277 Other 12,239 8,378 Less provision (1,088) (1,480)
Total inventory 118,322 100,701

Gazprom Neft Group Notes to the Consolidated Financial Statements As of and for the year ended 31 December 2017
Currency – RUB millions (unless otherwise stated)
23
10. Other taxes receivable
Other taxes receivable as of 31 December 2017 and 2016 comprise the following:
31 December 2017 31 December 2016 Value added tax receivable 50,163 44,936 Prepaid custom duties 5,076 6,419 Other taxes prepaid 3,120 2,127
Total other taxes receivable 58,359 53,482 11. Other current assets
Other current assets as of 31 December 2017 and 2016 comprise the following:
Notes 31 December 2017 31 December 2016 Advances paid 24,503 27,671 Prepaid expenses 1,955 1,104 Other assets 35 13,589 11,728
Total other current assets, net 40,047 40,503 The movement in impairment provision in respect of other current assets is presented in Note 35. 12. Property, plant and equipment
Movement in property, plant and equipment for the years ended 31 December 2017 and 2016 is presented below:
Cost
O&G properties
Refining assets
Marketing and
distribution
Other assets
Assets under
constru-ction
Total
As of 1 January 2017 1,569,525 308,192 152,871 23,531 369,304 2,423,423 Additions 2,921 1,572 - - 403,860 408,353 Changes in decommissioning obligations 20,152 - - - - 20,152 Capitalised borrowing costs - - - - 29,562 29,562 Transfers 191,205 32,548 34,120 3,562 (261,435) - Internal movement (1,230) (724) (72) 591 1,435 - Disposals (7,101) (699) (1,913) (1,329) (2,212) (13,254) Translation differences (3,369) 6,849 4,597 283 (1,549) 6,811
As of 31 December 2017 1,772,103 347,738 189,603 26,638 538,965 2,875,047 Depreciation and impairment
As of 1 January 2017 (553,140) (89,106) (49,052) (5,780) - (697,078) Depreciation charge (107,119) (14,787) (11,140) (2,336) - (135,382) Impairment 256 - - - - 256 Internal movement 444 157 (44) (557) - - Disposals 4,611 601 1,110 1,313 - 7,635 Translation differences 5,011 (1,955) (1,164) (95) - 1,797
As of 31 December 2017 (649,937) (105,090) (60,290) (7,455) - (822,772) Net book value
As of 1 January 2017 1,016,385 219,086 103,819 17,751 369,304 1,726,345 As of 31 December 2017 1,122,166 242,648 129,313 19,183 538,965 2,052,275
Capitalised borrowing costs for the year ended 31 December 2017 include interest expense in the amount of RUB 25.0 billion and exchange losses arising from foreign currency borrowings in the amount of RUB 4.6 billion.

Gazprom Neft Group Notes to the Consolidated Financial Statements As of and for the year ended 31 December 2017
Currency – RUB millions (unless otherwise stated)
24
Cost
O&G properties
Refining assets
Marketing and
distribution
Other assets
Assets under
constru-ction
Total
As of 1 January 2016 1,355,282 308,037 152,795 17,933 369,274 2,203,321 Additions 2,280 1,365 - - 319,426 323,071 Acquisitions through business combinations - 38 - 452 16 506 Changes in decommissioning obligations 9,626 - - - - 9,626 Capitalised borrowing costs - - - - 13,840 13,840 Transfers 248,107 21,528 10,280 4,473 (284,388) - Internal movement 25,813 (6,474) 6,192 1,711 (27,242) - Disposals (5,588) (1,250) (1,753) (604) (4,530) (13,725) Translation differences (65,995) (15,052) (14,643) (434) (17,092) (113,216)
As of 31 December 2016 1,569,525 308,192 152,871 23,531 369,304 2,423,423 Depreciation and impairment
As of 1 January 2016 (489,288) (81,461) (41,440) (3,479) - (615,668) Depreciation charge (83,199) (13,083) (11,305) (1,918) - (109,505) Impairment (14,763) - - - - (14,763) Internal movement 828 1,558 (1,240) (1,146) - - Disposals 5,222 221 1,050 561 - 7,054 Translation differences 28,060 3,659 3,883 202 - 35,804
As of 31 December 2016 (553,140) (89,106) (49,052) (5,780) - (697,078) Net book value
As of 1 January 2016 865,994 226,576 111,355 14,454 369,274 1,587,653 As of 31 December 2016 1,016,385 219,086 103,819 17,751 369,304 1,726,345
Capitalisation rate for the borrowing costs related to the acquisition of property, plant and equipment equals to 7% for the year ended 31 December 2017 (6% for the year ended 31 December 2016).
The information regarding Group’s exploration and evaluation assets (part of O&G properties) is presented below:
2017 2016 Net book value as of 1 January 75,343 83,005
Additions 22,283 13,670 Impairment - (9,362) Unsuccessful exploration expenditures derecognised (337) (628) Transfer to proved property (2,522) (2,214) Disposals (143) (268) Translation differences (597) (8,860)
Net book value as of 31 December 94,027 75,343 During 2017 the Group performed impairment testing and recognised net reversal of impairment in relation to upstream oil and gas assets located in Iraq region in the amount of RUB 0.3 billion (an impairment in relation to upstream oil and gas assets and exploration and evaluation assets in the amount of RUB 14.4 billion was recognised for the year ended 31 December 2016). Net reversal of impairment consists of an impairment loss in the amount of RUB 2.0 billion and reversal of impairment in the amount of RUB 2.3 billion. The impairment reversal is included in Depreciation, depletion and amortisation line item in the Consolidated Statement of Profit and Loss and Other Comprehensive Income. The accumulated impairment as at 31 December 2017 in the amount of RUB 13.9 billion is presented within net book value of property, plant and equipment (RUB 14.8 billion as at 31 December 2016).
The Group recognized the net reversal of impairment for the amount by which recoverable amount of these assets of RUB 81.7 billion (translated into Roubles at the exchange rate as of date of impairment testing) exceeded its book value. Revision of the expected economic and technical performance of the assets in result of changes in exploration information, development programs, investment plans and international oil prices affected estimated value in use of Iraq assets.

Gazprom Neft Group Notes to the Consolidated Financial Statements As of and for the year ended 31 December 2017
Currency – RUB millions (unless otherwise stated)
25
The recoverable amount was determined as the present value of estimated future cash flows using available forecasts of oil prices from globally recognised research institutions and production quantities based on reserve reports and long-term strategic plans. The pre-tax discount rate reflects current market assessments of the time value of money and the risks specific to the asset and amounts to 11% per annum in real terms (similar to prior year). 13. Goodwill and other intangible assets
The information regarding movements in Group’s intangible assets is presented below:
Cost Goodwill Software Land
rights Other IA Total
As of 1 January 2017 32,106 26,979 17,521 16,006 92,612 Additions - 4,659 9 3,038 7,706 Internal movement - 1,202 27 (1,229) - Disposals - (68) (2) (900) (970) Translation differences 1,994 604 56 97 2,751
As of 31 December 2017 34,100 33,376 17,611 17,012 102,099 Amortisation and impairment
As of 1 January 2017 (180) (13,060) (5,214) (4,007) (22,461) Amortisation charge - (3,770) (702) (1,400) (5,872) Internal movement - 519 - (519) - Disposals - - - 767 767 Translation differences (21) (397) - 72 (346)
As of 31 December 2017 (201) (16,708) (5,916) (5,087) (27,912) Net book value
As of 1 January 2017 31,926 13,919 12,307 11,999 70,151 As of 31 December 2017 33,899 16,668 11,695 11,925 74,187
Cost Goodwill Software Land
rights Other IA Total
As of 1 January 2016 36,537 24,243 17,582 15,451 93,813 Additions - 3,556 9 2,238 5,803 Acquisitions through business combinations - 7 - 865 872 Internal movement - 1,250 31 (1,281) - Disposals - (520) - (1,007) (1,527) Translation differences (4,431) (1,557) (101) (260) (6,349)
As of 31 December 2016 32,106 26,979 17,521 16,006 92,612 Amortisation and impairment
As of 1 January 2016 (228) (11,030) (4,457) (3,008) (18,723) Amortisation charge - (3,528) (759) (1,290) (5,577) Internal movement - 35 - (35) - Disposals - 318 - 149 467 Translation differences 48 1,145 2 177 1,372
As of 31 December 2016 (180) (13,060) (5,214) (4,007) (22,461) Net book value
As of 1 January 2016 36,309 13,213 13,125 12,443 75,090 As of 31 December 2016 31,926 13,919 12,307 11,999 70,151
Goodwill acquired through business combination has been allocated to Upstream and Downstream in the amounts of RUB 27.0 billion and RUB 6.9 billion as of 31 December 2017 (RUB 25.1 billion and RUB 6.8 billion as of 31 December 2016). Goodwill was tested for impairment and no impairment was identified.

Gazprom Neft Group Notes to the Consolidated Financial Statements As of and for the year ended 31 December 2017
Currency – RUB millions (unless otherwise stated)
26
14. Investments in associates and joint ventures
The carrying values of the investments in associates and joint ventures as of 31 December 2017 and 2016 are summarised below:
Ownership percentage 31 December 2017 31 December 2016
Slavneft Joint venture 49.9 111,679 97,084 SeverEnergy Joint venture 46.7 105,157 86,599 Northgas Joint venture 50.0 12,568 11,517 Messoyakha Joint venture 50.0 17,965 353 Others 9,389 5,995
Total investments 256,758 201,548
The principal place of business of the most significant joint ventures and associates disclosed above is the Russian Federation.
The total amount of dividends received from joint ventures in 2017 amounts to RUB 5,531 million (RUB 3,144 million in 2016). Slavneft
OAO NGK Slavneft and it’s subsidiaries (Slavneft) are engaged in exploration, production and development of crude oil and gas and production of refined petroleum products. The control over Slavneft is divided equally between the Group and PJSC NK Rosneft.
SeverEnergy
The Group’s investment in SeverEnergy LLC (SeverEnergy) is held through Yamal Razvitie LLC (Yamal Razvitie, an entity jointly controlled by the Group and PJSC NOVATEK). SeverEnergy, through its subsidiary JSC Arctic Gas Company (Arcticgas), is developing the Samburgskoye, Urengoiskoe and Yaro-Yakhinskoye oil and gas condensate fields and some other small oil and gas condensate fields located in the Yamalo-Nenetskiy autonomous region of the Russian Federation.
The carrying amount of the Group’s investment exceeds the Group's share in the underlying net assets of SeverEnergy by RUB 17.0 billion as of 31 December 2017 due to complex holding structure, current financing scheme and goodwill arising on acquisition (RUB 18.2 billion as of 31 December 2016).
Northgas
The Group’s investment in CJSC Northgas (Northgas) is held through Gazprom Resource Northgas LLC which is controlled by the Group based on signed Management agreement and charter documents. Gazprom Resource Northgas LLC owns a 50% share in Northgas. Northgas is engaged in development of natural gas and oil field.
Messoyakha
JSC Messoyakhaneftegas (Messoyakha) is developing the Vostochno-Messoyakhskoe and Zapadno-Messoyakhskoe oil and gas condensate fields. The control over Messoyakha is divided equally between the Group and PJSC NK Rosneft. During the year ended 31 December 2017 the Group performed additional contribution to share capital in the amount of RUB 7.6 billion.

Gazprom Neft Group Notes to the Consolidated Financial Statements As of and for the year ended 31 December 2017
Currency – RUB millions (unless otherwise stated)
27
The summarised financial information for the significant associates and joint ventures as of 31 December 2017 and 2016 and for the years ended 31 December 2017 and 2016 is presented in the table below.
31 December 2017 Slavneft SeverEnergy Northgas Messoyakha
Cash and cash equivalents 4,153 8,658 1,409 1 Other current assets 54,479 133,617 3,256 18,654 Non-current assets 344,997 259,175 54,065 152,469 Current financial liabilities (34,054) (49,851) (6,379) (4,913) Other current liabilities (30,229) (18,495) (77) (4,812) Non-current financial liabilities (88,198) (91,811) (21,109) (116,815) Other non-current liabilities (41,229) (52,465) (4,656) (9,072)
Net assets 209,919 188,828 26,509 35,512
31 December 2016 Slavneft SeverEnergy Northgas Messoyakha
Cash and cash equivalents 4,333 13,530 277 98 Other current assets 22,505 16,506 3,280 15,684 Non-current assets 312,935 357,480 52,986 114,347 Current financial liabilities (46,727) (53,439) (2,677) (82,745) Other current liabilities (25,368) (12,368) (54) (3,512) Non-current financial liabilities (42,876) (123,252) (24,990) (37,920) Other non-current liabilities (36,587) (51,995) (4,415) (5,665)
Net assets 188,215 146,462 24,407 287
Year ended 31 December 2017 Slavneft SeverEnergy Northgas Messoyakha
Revenue 241,253 147,204 23,079 61,030 Depreciation and amortisation (37,984) (23,357) (2,561) (12,489) Finance income 989 966 1,153 3 Finance expense (6,781) (17,759) (2,784) (6,559) Total income tax expense (4,429) (7,210) (1,726) (4,615) Profit for the period 21,648 42,365 6,868 19,952 Total comprehensive income for the period 21,707 42,365 6,868 19,952
Year ended 31 December 2016 Slavneft SeverEnergy Northgas Messoyakha
Revenue 214,509 133,229 25,692 12,097 Depreciation and amortisation (33,732) (23,445) (2,600) (1,905) Finance income 1,652 1,080 1,332 50 Finance expense (6,593) (26,100) (3,697) (6,493) Total income tax (expense) / benefit (6,224) (3,447) (1,608) 4,027 Profit for the period 29,101 30,877 6,019 1,889 Total comprehensive income for the period 28,698 30,877 6,019 1,889
Others
The aggregate carrying amount of all individually immaterial joint ventures and associates as well as the Group’s share of those joint ventures’ and associates’ profit or loss and other comprehensive income is not significant.

Gazprom Neft Group Notes to the Consolidated Financial Statements As of and for the year ended 31 December 2017
Currency – RUB millions (unless otherwise stated)
28
15. Joint operations
Under IFRS 11 Joint Arrangements the Group assessed the nature of its 50% share in joint arrangements and determined investments in Tomskneft and Salym Petroleum Development as Joint operations. Tomskneft and Salym Petroleum Development are engaged in production of oil and gas in the Russian Federation and all of the production is required to be sold to the parties of the joint arrangement (that is, the Group and its partners).
16. Long-term financial assets
Long-term financial assets as of 31 December 2017 and 2016 comprise the following:
31 December 2017 31 December 2016 Long-term loans issued 27,895 34,015 Available for sale financial assets 2,911 7,549 Deposits with original maturity more than 1 year 1,181 - Less impairment provision (694) (1,397)
Total long-term financial assets 31,293 40,167 17. Deferred income tax assets and liabilities
Recognised deferred tax assets and liabilities are attributable to the following:
As of 31 December 2017 Assets Liabilities Net Property, plant and equipment 4,965 (126,842) (121,877) Intangible assets 1 (3,536) (3,535) Investments 358 (340) 18 Inventories 828 (1,369) (541) Trade and other receivables 2,838 (28) 2,810 Loans and borrowings - (276) (276) Provisions 6,598 (24) 6,574 Tax loss carry-forwards 23,255 - 23,255 Finance lease 4,866 - 4,866 Other 4,938 (948) 3,990 Net-off (30,780) 30,780 -
Tax assets / (liabilities) 17,867 (102,583) (84,716) As of 31 December 2016
Property, plant and equipment 5,424 (96,586) (91,162) Intangible assets 1 (3,662) (3,661) Investments 719 (988) (269) Inventories 894 (962) (68) Trade and other receivables 2,321 (30) 2,291 Loans and borrowings - (2,152) (2,152) Provisions 7,258 (8) 7,250 Tax loss carry-forwards 14,152 - 14,152 Other 2,857 (2,546) 311 Net-off (25,587) 25,587 -
Tax assets / (liabilities) 8,039 (81,347) (73,308)

Gazprom Neft Group Notes to the Consolidated Financial Statements As of and for the year ended 31 December 2017
Currency – RUB millions (unless otherwise stated)
29
Movement in temporary differences during the period:
As of 1 January
2017
Recognised in profit or
loss
Recognised in other
comprehensive income
Acquired/ disposed of
As of 31 December
2017
Property, plant and equipment (91,162) (31,087) 372 - (121,877) Intangible assets (3,661) 126 - - (3,535) Investments (269) 267 20 - 18 Inventories (68) (473) - - (541) Trade and other receivables 2,291 460 59 - 2,810 Loans and borrowings (2,152) 1,876 - - (276) Provisions 7,250 (736) 60 - 6,574 Tax loss carry-forwards 14,152 9,146 (43) - 23,255 Finance lease - 4,866 - - 4,866 Other 311 3,728 (49) - 3,990
(73,308) (11,827) 419 - (84,716)
As of 1 January 2016
Recognised in profit or
loss
Recognised in other
comprehensive income
Acquired/ disposed of
As of 31 December
2016
Property, plant and equipment (81,818) (12,029) 2,684 1 (91,162) Intangible assets (3,881) 290 - (70) (3,661) Investments 102 (108) (263) - (269) Inventories (250) 182 - - (68) Trade and other receivables 584 1,827 (120) - 2,291 Loans and borrowings (1,066) (1,086) - - (2,152) Provisions 5,469 1,911 (130) - 7,250 Tax loss carry-forwards 32,896 (18,587) (164) 7 14,152 Other 1,311 (924) (78) 2 311
(46,653) (28,524) 1,929 (60) (73,308)
18. Other non-current assets
Other non-current assets are primarily comprised of advances provided on capital expenditures (RUB 69.3 billion and RUB 97.2 billion as of 31 December 2017 and 2016, respectively).
19. Short-term debt and current portion of long-term debt
As of 31 December 2017 and 2016 the Group has short-term loans and current portion of long-term debt outstanding as follows:
31 December 2017 31 December 2016 Current portion of long-term debt 131,360 72,805 Bank loans - 6,321 Other borrowings 400 1,061
Total short-term debt and current portion of long-term debt 131,760 80,187
Short-term bank loans and other borrowings include interest payable on short-term debt. Current portion of long-term debt includes interest payable on long-term borrowings.

Gazprom Neft Group Notes to the Consolidated Financial Statements As of and for the year ended 31 December 2017
Currency – RUB millions (unless otherwise stated)
30
20. Trade and other payables
Accounts payable as of 31 December 2017 and 2016 comprise the following:
31 December 2017 31 December 2016 Trade accounts payable 118,151 78,161 Dividends payable 49,520 2,115 Forward contracts - cash flow hedge 16,758 11,358 Other accounts payable 10,009 3,990
Total trade and other payables 194,438 95,624 Other accounts payable are mainly represented by short-term part of liability to PJSC Gazprom for assets relating to Prirazlomnoye project.
21. Other current liabilities
Other current liabilities as of 31 December 2017 and 2016 comprise the following:
31 December 2017 31 December 2016 Advances received 21,972 21,293 Payables to employees 3,182 2,627 Other non-financial payables 7,346 4,760
Total other current liabilities 32,500 28,680 22. Other taxes payable
Other taxes payable as of 31 December 2017 and 2016 comprise the following:
31 December 2017 31 December 2016 Mineral extraction tax 31,807 25,261 VAT 27,515 20,140 Excise tax 13,201 11,389 Social security contributions 6,974 4,721 Other taxes 5,336 5,748
Total other taxes payable 84,833 67,259 Tax expense other than income tax expense for the years ended 31 December 2017 and 2016 comprise the following:
Year ended
31 December 2017 Year ended
31 December 2016 Mineral extraction tax 329,579 237,300 Excise tax 128,229 112,102 Social security contributions 20,433 18,530 Other taxes 14,028 13,199
Total taxes other than income tax 492,269 381,131

Gazprom Neft Group Notes to the Consolidated Financial Statements As of and for the year ended 31 December 2017
Currency – RUB millions (unless otherwise stated)
31
23. Provisions and other accrued liabilities
Movement in provisions and other accrued liabilities for the years ended 31 December 2017 and 2016 is below:
Decommissioning provision
Other Total
Carrying amount as of 1 January 2016 26,097 18,906 45,003 Short-term part 121 13,817 13,938 Long-term part 25,976 5,089 31,065 New obligation incurred 5,783 13,134 18,917 Utilisation of provision / accrual (182) (5,665) (5,847) Change in estimates 3,987 - 3,987 Unwind of discount 2,308 - 2,308 Translation differences (1,632) (1,388) (3,020) Carrying amount as of 31 December 2016 36,361 24,987 61,348 Short-term part 151 15,255 15,406 Long-term part 36,210 9,732 45,942 New obligation incurred 5,790 11,711 17,501 Utilisation of provision / accrual (684) (3,301) (3,985) Change in estimates 14,326 - 14,326 Unwind of discount 2,785 - 2,785 Translation differences 23 449 472 Carrying amount as of 31 December 2017 58,601 33,846 92,447 Short-term part 151 29,722 29,873 Long-term part 58,450 4,124 62,574
Change in estimates was mainly caused by revision of discount and inflation rates.
24. Long-term debt
As of 31 December 2017 and 2016 the Group has long-term outstanding loans and borrowings as follows:
31 December 2017 31 December 2016 Bank loans 303,173 348,142 Loan participation notes 226,110 231,250 Bonds 143,007 81,879 Other borrowings 7,724 7,755 Less current portion of long-term debt (131,360) (72,805)
Total long-term debt 548,654 596,221 Bank loans
In July 2012 the Group signed EUR 258 million ECA-covered term loan facility with the group of international banks (facility agent – HSBC) at an interest rate of Euribor+1.45% per annum and final maturity date in December 2022. During 2017 the Group performed principal repayment in the total amount of EUR 25.8 million (RUB 1.8 billion) according to the payment schedule. The outstanding balance as of 31 December 2017 is EUR 129.0 million (RUB 8.9 billion).
In April 2013 the Group signed USD 700 million club term loan facility with the group of international banks (facility agent – Commerzbank) at an interest rate of Libor+1.75% per annum and final maturity date in October 2018. In March and September 2017 the Group performed partial principal repayment in the total amount of USD 200 million (RUB 11.5 billion) according to the payment schedule. The outstanding balance as of 31 December 2017 is USD 200 million (RUB 11.5 billion).

Gazprom Neft Group Notes to the Consolidated Financial Statements As of and for the year ended 31 December 2017
Currency – RUB millions (unless otherwise stated)
32
In November 2013 the Group signed USD 2,150 million club term loan facility with the group of international banks (facility agent – Mizuho) at an interest rate of Libor+1.50% per annum and final maturity date in March 2019. In March and September 2017 the Group performed partial principal repayment in the total amount of USD 614 million (RUB 35.8 billion) according to the payment schedule. The outstanding balance as of 31 December 2017 is USD 921 million (RUB 53.1 billion).
In September 2014 the Group signed RUB 35.0 billion term loan facilities with Sberbank of Russia with final maturity date in September 2019. In May 2017 the Group performed pre-scheduled principal repayment in the total amount of RUB 35.0 billion. The loan is fully repaid.
In first half 2015 the Group signed several long-term facility agreements with final settlement in August 2019. As of 31 December 2017 the amount outstanding is RUB 57.6 billion.
In August 2015 the Group signed a long-term facility agreement in the amount of RUB 13.9 billion with Sberbank of Russia. The final maturity date is August 2025. The outstanding balance as of 31 December 2017 is RUB 7.2 billion.
In February, October and November 2016 the Group signed several long-term facility agreements with Bank VTB (PJCS) with the due dates in June 2021 - June 2022. In 2017 the Group performed pre-scheduled principal repayment in the total amount of RUB 92.0 billion. The loans are fully repaid.
In November 2016 the Group signed long-term loan facilities with Sberbank of Russia with final maturity date in November 2021. In June 2017 the Group performed pre-scheduled principal repayment in the total amount of RUB 30.0 billion. The loans are fully repaid.
In November 2016 the Group signed a long-term facility agreement with Sberbank of Russia with the final maturity date in November 2022. As of 31 December 2017 the outstanding balance is RUB 15.7 billion.
In April 2017 the Group signed long-term loan facilities with “Bank “ROSSIYA” in the amount of RUB 15.0 billion with final maturity date in April 2022. The outstanding balance as of 31 December 2017 is RUB 15.0 billion.
In December 2017 the Group signed several long-term facility agreements with final maturity date in December 2022 – June 2023. As of 31 December 2017 the outstanding balance is RUB 98.8 billion.
The loan agreements contain one financial covenant that limits the Group's ratio of “Consolidated financial indebtedness to Consolidated EBITDA”. The Group is in compliance with the covenant as of 31 December 2017 and 2016 and during the year ended 31 December 2017 and 31 December 2016.
Bonds
In April 2017 the Group placed five-year Rouble exchange traded Bonds (001P-01R series) with the total par value of RUB 15 billion. The bonds bear interest of 8.7% per annum.
In August 2017 the Group placed seven-year Rouble Bonds (001P-02R series) with the total par value of RUB 15 billion. The bonds bear interest of 8.25% per annum.
In October 2017 the Group placed five-year Rouble Bonds (001P-03R series) with the total par value of RUB 25 billion. The bonds bear interest of 7.85% per annum.
In December 2017 the Group placed two seven-year Rouble Bonds (001P-04R and 001P-05R series) with the total par value of RUB 10 billion and RUB 5 billion respectively. The bonds bear interest of 7.7% per annum.

Gazprom Neft Group Notes to the Consolidated Financial Statements As of and for the year ended 31 December 2017
Currency – RUB millions (unless otherwise stated)
33
As of 31 December 2017 the outstanding balance of Rouble Bonds placed in 2009, 2011, 2016 and 2017 is RUB 140.0 billion. The bonds bear interest of 7.7-10.65% per annum and are due for repayment in 2018-2024.
Loan Participation Notes
In years 2012 and 2013 the Group raised USD 3,000 million and EUR 750 million by issuing 10 years USD and 5 years EUR Loan Participation Notes. The outstanding balance as of 31 December 2017 is RUB 224.0 billion.
25. Finance lease
In 2016 the Group entered into agreements to lease vessels and the contracts were classified as a finance lease. During the year ended 31 December 2017 the Group became entitled to exercise the right to use the assets. The net book value of the leased assets as of 31 December 2017 is RUB 24.8 billion (none as of 31 December 2016). At the end of lease term ownership title to the vessels transfers to the Group. The lease contract also contains an option for early purchase of the assets by the Group.
Net book value of other items of PPE under finance lease contracts is non significant.
The reconciliation between future minimum lease payments and their present value as of 31 December 2017 is presented in the table below:
Minimum lease payments
Present value of minimum lease
payments 31 December 2017
Due within one year 2,784 2,693 Between one and five years 11,204 9,273 More than five years 17,355 10,257
Total minimum lease payments 31,343 22,223 The difference between the minimum lease payments and their present value represents future finance charges on finance lease liabilities.
26. Other non-current financial liabilities
Other non-current financial liabilities as of 31 December 2017 and 31 December 2016 comprise the following:
31 December 2017 31 December 2016 Deferred consideration 47,245 60,384 Forward contracts - cash flow hedge 1,295 28,015 Other liabilities 29 1,345
Total other non-current financial liabilities 48,569 89,744 Deferred consideration represents liability to PJSC Gazprom for assets relating to Prirazlomnoye project. In 2017 the payment schedule was revised and the effect of the change in carrying value of liability due to the contract term revision in amount of RUB 11.2 billion was reflected in additional paid-in capital as of 31 December 2017.

Gazprom Neft Group Notes to the Consolidated Financial Statements As of and for the year ended 31 December 2017
Currency – RUB millions (unless otherwise stated)
34
27. Share capital and treasury shares
Share capital as of 31 December 2017 and 2016 comprise the following:
Ordinary shares Treasury shares
31 December
2017 31 December
2016 31 December
2017 31 December
2016 Number of shares (million) 4,741 4,741 23 23 Authorised shares (million) 4,741 4,741 23 23 Par value (RUB per share) 0.0016 0.0016 0.0016 0.0016 On issue as of 31 December, fully paid (RUB million) 8 8 (1,170) (1,170)
The nominal value of share capital differs from its carrying value due to the effect of inflation.
On 15 December 2017 the general shareholders’ meeting of PJSC Gazprom Neft approved an interim dividend on the ordinary shares for the nine months ended 30 September 2017 in the amount of RUB 10.00 per share.
On 9 June 2017 the annual general shareholders’ meeting of PJSC Gazprom Neft approved a dividend on the ordinary shares for 2016 in the amount of RUB 10.68 per share.
On 10 June 2016 the annual general shareholders’ meeting of PJSC Gazprom Neft approved a dividend on the ordinary shares for 2015 in the amount of RUB 6.47 per share including an interim dividend on the ordinary shares in the amount of RUB 5.92 per share.
28. Employee costs
Employee costs for the years ended 31 December 2017 and 2016 comprise the following:
Year ended
31 December 2017 Year ended
31 December 2016 Wages and salaries 75,153 66,987 Other costs and compensations 11,357 10,481
Total employee costs 86,510 77,468 Social security contributions (social taxes) 20,433 18,530
Total employee costs (with social taxes) 106,943 95,998 29. Other loss / gain, net
Other loss / gain, net for the years ended 31 December 2017 and 2016 comprise the following:
Year ended
31 December 2017 Year ended
31 December 2016 Write-off of assets (3,727) (4,456) Impairment of advances and other receivables (345) (11,546) Penalties 595 277 Write-off payables 234 243 Other losses, net (4,314) (2,500)
Total other loss, net (7,557) (17,982)
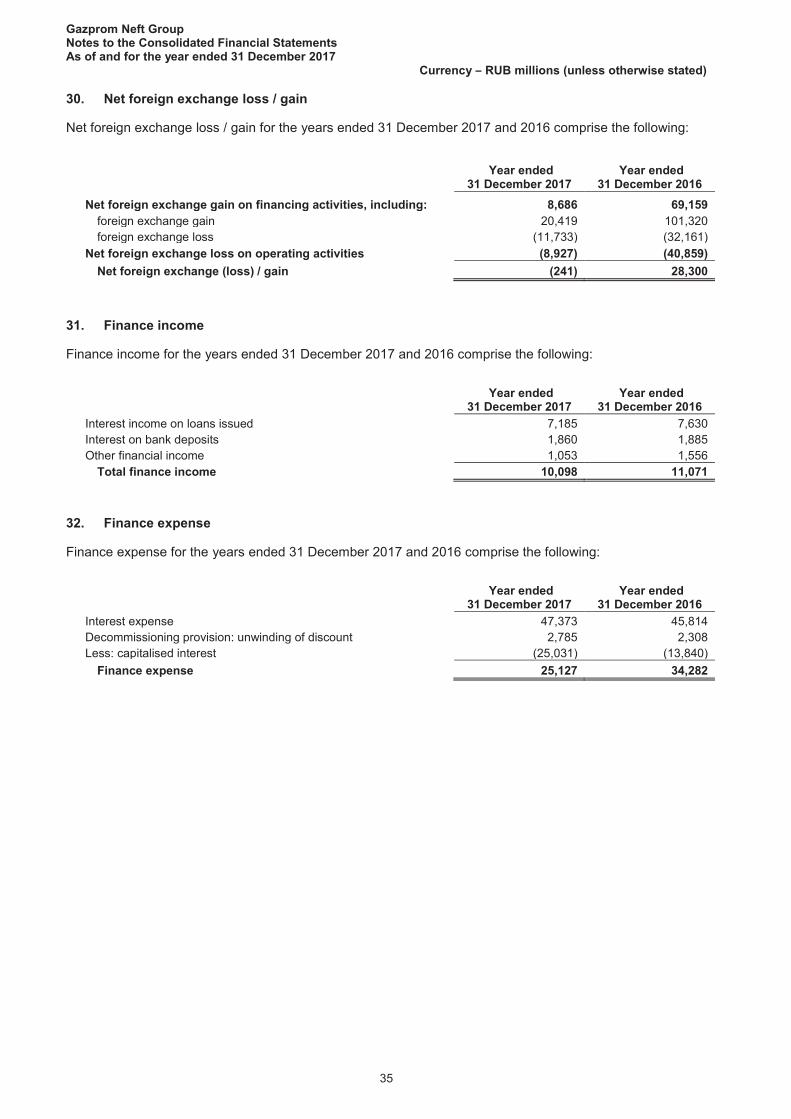
Gazprom Neft Group Notes to the Consolidated Financial Statements As of and for the year ended 31 December 2017
Currency – RUB millions (unless otherwise stated)
35
30. Net foreign exchange loss / gain
Net foreign exchange loss / gain for the years ended 31 December 2017 and 2016 comprise the following:
Year ended 31 December 2017
Year ended 31 December 2016
Net foreign exchange gain on financing activities, including: 8,686 69,159 foreign exchange gain 20,419 101,320 foreign exchange loss (11,733) (32,161)
Net foreign exchange loss on operating activities (8,927) (40,859) Net foreign exchange (loss) / gain (241) 28,300
31. Finance income
Finance income for the years ended 31 December 2017 and 2016 comprise the following:
Year ended 31 December 2017
Year ended 31 December 2016
Interest income on loans issued 7,185 7,630 Interest on bank deposits 1,860 1,885 Other financial income 1,053 1,556
Total finance income 10,098 11,071
32. Finance expense
Finance expense for the years ended 31 December 2017 and 2016 comprise the following:
Year ended 31 December 2017
Year ended 31 December 2016
Interest expense 47,373 45,814 Decommissioning provision: unwinding of discount 2,785 2,308 Less: capitalised interest (25,031) (13,840)
Finance expense 25,127 34,282

Gazprom Neft Group Notes to the Consolidated Financial Statements As of and for the year ended 31 December 2017
Currency – RUB millions (unless otherwise stated)
36
33. Income tax expense
The Group’s applicable income tax rate for the companies located in the Russian Federation is 20%.
Year ended
31 December 2017 Year ended
31 December 2016
RUB
million % RUB
million % Total income tax expense 64,558 20 55,751 21
Profit before income tax excluding share of profit before tax of associates and joint ventures 279,696 225,423
Profit before income tax of associates and joint ventures 51,988 37,720 Profit before income tax 331,684 263,143
Tax at applicable domestic tax rate (20%) 66,337 20 52,629 20 Effect of tax rates in foreign jurisdictions (388) - 2,363 1 Difference in statutory tax rate in domestic entities (2,918) (1) (4,290) (2) Non-deductible and deductible items (including Intragroup) (2,813) (1) 3,220 1 Adjustment for prior years 3,934 2 (232) - Change in tax rate 428 - 714 - Foreign exchange (gain) / loss of foreign non-operating units (22) - 1,347 1
Total income tax expense 64,558 20 55,751 21 Reconciliation of effective tax rate:
Year ended 31 December 2017
Year ended 31 December 2016
Current income tax expense Current year 40,053 19,318 Adjustment for prior years 3,642 1,972
43,695 21,290 Deferred income tax expense
Origination and reversal of temporary differences 11,399 27,810 Change in tax rate 428 714
11,827 28,524 Total income tax expense 55,522 49,814
Share of tax of associates and joint ventures 9,036 5,937 Total income tax expense including share of tax of associates and joint ventures 64,558 55,751
34. Cash flow hedges
The following table indicates the periods in which the cash flows associated with cash flow hedges are expected to occur and the fair value of the related hedging instrument:
Fair value Less than 6 month
From 6 to 12 months
From 1 to 3 years
Over 3 years
As of 31 December 2017 Forward exchange contracts and interest rate swaps Liabilities (17,928) (16,758) - - (1,170)
Total (17,928) (16,758) - - (1,170) As of 31 December 2016 Forward exchange contracts and interest rate swaps Assets 91 91 - - - Liabilities (39,373) (692) (10,667) (25,232) (2,782)
Total (39,282) (601) (10,667) (25,232) (2,782)

Gazprom Neft Group Notes to the Consolidated Financial Statements As of and for the year ended 31 December 2017
Currency – RUB millions (unless otherwise stated)
37
As of 31 December 2017 and 2016 the Group has outstanding forward currency exchange contracts and interest rate swaps for a total notional value of USD 1,742 million and USD 2,166 million respectively. During the year ended 31 December 2017 loss in the amount of RUB 9,984 million was reclassified from equity to net foreign exchange (loss) / gain in the Consolidated Statement of Profit and Loss and Other Comprehensive Income (RUB 26,281 million for the year ended 31 December 2016).
The impact of foreign exchange cash flow hedges recognized in other comprehensive income is set out below:
2017 2016
Before
income tax Income
tax Net of tax Before
income tax Income
tax Net of tax
Total recognised in other comprehensive (loss) / income as of the beginning of the year (39,282) 5,023 (34,259) (76,258) 10,498 (65,760) Foreign exchange effects recognised during the year 11,370 (1,914) 9,456 10,695 (2,025) 8,670 Recycled to Net foreign exchange loss on operating activities 9,984 (1,006) 8,978 26,281 (3,450) 22,831
Total recognised in other comprehensive income / (loss) for the year 21,354 (2,920) 18,434 36,976 (5,475) 31,501
Total recognised in other comprehensive (loss) / income as of the closing of the year (17,928) 2,103 (15,825) (39,282) 5,023 (34,259)
A schedule of the expected reclassification of the accumulated foreign exchange loss from other comprehensive income / (loss) to profit and loss as of 31 December 2017 is presented below:
Year 2018 2022 Total
Total, net of tax (14,638) (1,187) (15,825) The Group uses an estimation of the fair value of forward currency exchange contracts prepared by independent financial institutes. Valuation results are regularly reviewed by the Management. No significant ineffectiveness occurred during the reporting period.
35. Financial risk management
Risk Management Framework
Gazprom Neft Group has a risk management policy that defines the goals and principles of risk management in order to make the Group’s business more secure in both the short and the long term.
The Group’s goal in risk management is to increase effectiveness of Management decisions through detailed analysis of related risks.
The Group’s Integrated Risk Management System (IRMS) is a systematic continuous process that identifies, assesses and manages risks. Its key principle is that responsibility to manage different risks is assigned to different management levels depending on the expected financial impact of those risks. The Group is working continuously to improve its approach to basic IRMS processes, with special focus on efforts to assess risks and integrate the risk management process into such key corporate processes as business planning, project management and mergers and acquisitions.

Gazprom Neft Group Notes to the Consolidated Financial Statements As of and for the year ended 31 December 2017
Currency – RUB millions (unless otherwise stated)
38
Financial Risk Management
Management of the Group’s financial risks is the responsibility of employees acting within their respective professional spheres. The Group’s Financial Risk Management Panel defines a uniform approach to financial risk management at the Company and its subsidiaries. Activities performed by the Group’s employees and the Financial Risk Management Panel minimise potential financial losses and help to achieve corporate targets.
In the normal course of its operations the Group has exposure to the following financial risks: market risk (including currency risk, interest rate risk and commodity price risk); credit risk; and liquidity risk.
Market risk
Currency Risk
The Group is exposed to currency risk primarily on borrowings that are denominated in currencies other than the respective functional currencies of Group entities, which are primarily the local currencies of the Group companies, for instance the Russian Rouble for companies operating in Russia. The currencies in which these borrowings are denominated in are mainly USD and EUR.
The Group’s currency exchange risk is considerably mitigated by its foreign currency assets and liabilities: the current structure of revenues and liabilities acts as a hedging mechanism with opposite cash flows offsetting each other. The Group applies hedge accounting to manage volatility in profit and loss with its cash flows in foreign currency and hedges predominantly its borrowings.

Gazprom Neft Group Notes to the Consolidated Financial Statements As of and for the year ended 31 December 2017
Currency – RUB millions (unless otherwise stated)
39
The carrying amounts of the Group's financial instruments by currencies they are denominated in are as follows:
As of 31 December 2017
Russian Rouble
USD EURO Serbian dinar
Other currencies
Financial assets Current
Cash and cash equivalents 38,700 34,902 6,540 6,679 3,787 Bank deposits 1,323 - 13 4,443 - Loans issued 4,669 - - 1 - Trade and other financial receivables 41,240 43,484 3,117 12,433 1,988
Non-current Trade and other financial receivables 901 - - - - Bank deposits - - - 1,181 - Loans issued 27,695 - 200 - - Available for sale financial assets 2,157 - - 60 -
Financial liabilities Current
Short-term debt (28,630) (48,360) (54,751) - (19) Trade and other financial payables (145,576) (16,008) (5,478) (9,191) (1,427) Forward exchange contracts - (16,758) - - - Finance lease liability - (1,367) (30) - -
Non-current Long-term debt (240,920) (257,377) (50,196) - (161) Forward exchange contracts (126) (1,169) - - - Finance lease liability (23) (20,582) (114) - (107) Other non-current financial liabilities (47,271) - - - (3)
Net exposure (345,861) (283,235) (100,699) 15,606 4,058
As of 31 December 2016
Russian Rouble
USD EURO Serbian dinar
Other currencies
Financial assets Current
Cash and cash equivalents 10,811 12,024 3,061 5,685 2,040 Bank deposits 56 341 215 - 274 Loans issued 41,007 16 113 - - Forward exchange contracts - 91 - - - Trade and other financial receivables 39,243 55,595 6,341 12,495 1,885
Non-current Trade and other financial receivables 797 - 4,332 - - Loans issued 33,895 - 120 - - Available for sale financial assets 6,083 - - 69 -
Financial liabilities Current
Short-term debt (18,353) (50,981) (10,826) - (13) Trade and other financial payables (59,004) (11,750) (6,071) (6,072) (1,369) Forward exchange contracts - (11,358) - - -
Non-current Long-term debt (191,103) (329,248) (75,418) - (287) Forward exchange contracts - (28,015) - - - Other non-current financial liabilities (61,728) - (1) - -
Net exposure (198,296) (363,285) (78,134) 12,177 2,530
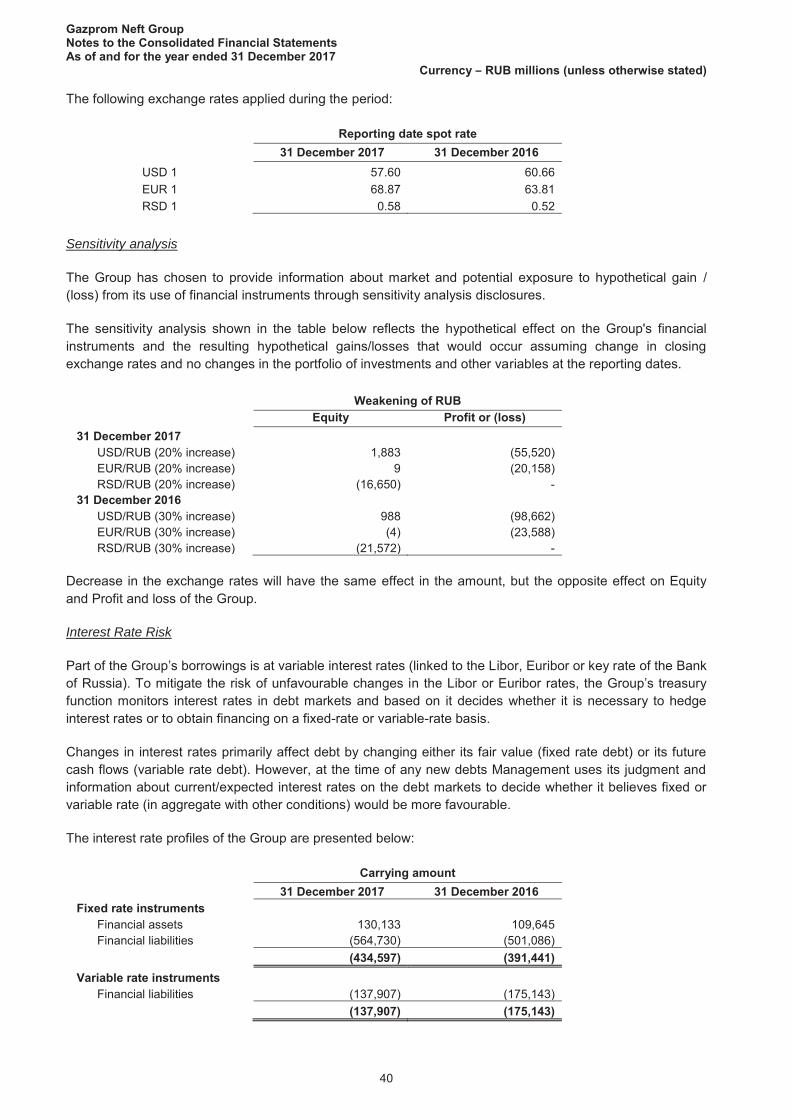
Gazprom Neft Group Notes to the Consolidated Financial Statements As of and for the year ended 31 December 2017
Currency – RUB millions (unless otherwise stated)
40
The following exchange rates applied during the period:
Reporting date spot rate 31 December 2017 31 December 2016
USD 1 57.60 60.66 EUR 1 68.87 63.81 RSD 1 0.58 0.52
Sensitivity analysis
The Group has chosen to provide information about market and potential exposure to hypothetical gain / (loss) from its use of financial instruments through sensitivity analysis disclosures.
The sensitivity analysis shown in the table below reflects the hypothetical effect on the Group's financial instruments and the resulting hypothetical gains/losses that would occur assuming change in closing exchange rates and no changes in the portfolio of investments and other variables at the reporting dates.
Weakening of RUB Equity Profit or (loss) 31 December 2017
USD/RUB (20% increase) 1,883 (55,520) EUR/RUB (20% increase) 9 (20,158) RSD/RUB (20% increase) (16,650) -
31 December 2016 USD/RUB (30% increase) 988 (98,662) EUR/RUB (30% increase) (4) (23,588) RSD/RUB (30% increase) (21,572) -
Decrease in the exchange rates will have the same effect in the amount, but the opposite effect on Equity and Profit and loss of the Group.
Interest Rate Risk
Part of the Group’s borrowings is at variable interest rates (linked to the Libor, Euribor or key rate of the Bank of Russia). To mitigate the risk of unfavourable changes in the Libor or Euribor rates, the Group’s treasury function monitors interest rates in debt markets and based on it decides whether it is necessary to hedge interest rates or to obtain financing on a fixed-rate or variable-rate basis.
Changes in interest rates primarily affect debt by changing either its fair value (fixed rate debt) or its future cash flows (variable rate debt). However, at the time of any new debts Management uses its judgment and information about current/expected interest rates on the debt markets to decide whether it believes fixed or variable rate (in aggregate with other conditions) would be more favourable.
The interest rate profiles of the Group are presented below:
Carrying amount 31 December 2017 31 December 2016 Fixed rate instruments
Financial assets 130,133 109,645 Financial liabilities (564,730) (501,086) (434,597) (391,441)
Variable rate instruments Financial liabilities (137,907) (175,143) (137,907) (175,143)

Gazprom Neft Group Notes to the Consolidated Financial Statements As of and for the year ended 31 December 2017
Currency – RUB millions (unless otherwise stated)
41
Cash flow sensitivity analysis for variable rate instruments
The Group's financial results and equity are sensitive to changes in interest rates. If the interest rates applicable to floating debt increase by 100 basis points (bp) at the reporting dates, assuming all other variables remain constant, it is estimated that the Group's profit before taxation will change by the amounts shown below:
Profit or (loss) 31 December 2017
Increase by 100 bp (1,379) 31 December 2016
Increase by 100 bp (1,751) A decrease by 100 bp in the interest rates will have the same effect in the amount, but the opposite effect on Profit and loss of the Group.
Commodity Price Risk
The Group’s financial performance relates directly to prices for crude oil and petroleum products. The Group is unable to fully control the prices of its products, which depend on the balance of supply and demand on global and domestic markets for crude oil and petroleum products, and on the actions of supervisory agencies.
The Group’s business planning system calculates different scenarios for key performance factors depending on global oil prices. This approach enables Management to adjust cost by reducing or rescheduling investment programs and other mechanisms.
Such activities help to decrease risks to an acceptable level.
Credit risk
Credit risk is the risk of financial loss to the Group if a customer or counterparty fails to meet its contractual obligations, and arises principally from the Group’s receivables from customers and in connection with investment securities.
The Group’s trade and other receivables relate to a large number of customers, spread across diverse industries and geographical areas. Gazprom Neft has taken a number of steps to manage credit risk, including: counterparty solvency evaluation; individual credit limits and payment conditions depending on each counterparty’s financial situation; controlling advance payments; controlling accounts receivable by lines of business, etc.
The carrying amount of financial assets represents the maximum credit exposure.
Trade and Other Receivables
The Group’s exposure to credit risk is influenced mainly by the individual characteristics of each counterparty.
Credit limit is established for each customer individually as maximum amount of credit risk taking into account a number of characteristics, such as:
- financial statements of the counterparty; - history of relationships with the Group; - credit profile of the customer; - duration of relationships with the Group, including ageing profile.
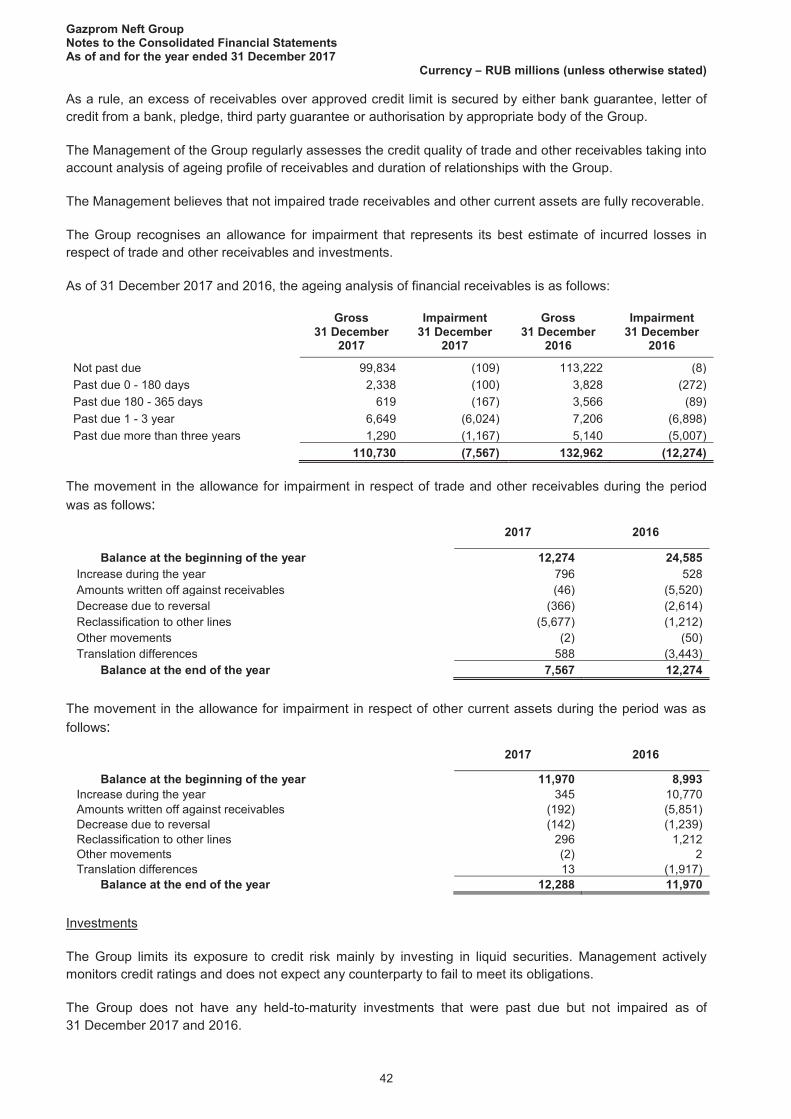
Gazprom Neft Group Notes to the Consolidated Financial Statements As of and for the year ended 31 December 2017
Currency – RUB millions (unless otherwise stated)
42
As a rule, an excess of receivables over approved credit limit is secured by either bank guarantee, letter of credit from a bank, pledge, third party guarantee or authorisation by appropriate body of the Group.
The Management of the Group regularly assesses the credit quality of trade and other receivables taking into account analysis of ageing profile of receivables and duration of relationships with the Group.
The Management believes that not impaired trade receivables and other current assets are fully recoverable.
The Group recognises an allowance for impairment that represents its best estimate of incurred losses in respect of trade and other receivables and investments.
As of 31 December 2017 and 2016, the ageing analysis of financial receivables is as follows:
Gross Impairment Gross Impairment
31 December
2017 31 December
2017 31 December
2016 31 December
2016
Not past due 99,834 (109) 113,222 (8) Past due 0 - 180 days 2,338 (100) 3,828 (272) Past due 180 - 365 days 619 (167) 3,566 (89) Past due 1 - 3 year 6,649 (6,024) 7,206 (6,898) Past due more than three years 1,290 (1,167) 5,140 (5,007)
110,730 (7,567) 132,962 (12,274) The movement in the allowance for impairment in respect of trade and other receivables during the period was as follows:
2017 2016
Balance at the beginning of the year 12,274 24,585 Increase during the year 796 528 Amounts written off against receivables (46) (5,520) Decrease due to reversal (366) (2,614) Reclassification to other lines (5,677) (1,212) Other movements (2) (50) Translation differences 588 (3,443)
Balance at the end of the year 7,567 12,274 The movement in the allowance for impairment in respect of other current assets during the period was as follows:
2017 2016
Balance at the beginning of the year 11,970 8,993 Increase during the year 345 10,770 Amounts written off against receivables (192) (5,851) Decrease due to reversal (142) (1,239) Reclassification to other lines 296 1,212 Other movements (2) 2 Translation differences 13 (1,917)
Balance at the end of the year 12,288 11,970 Investments
The Group limits its exposure to credit risk mainly by investing in liquid securities. Management actively monitors credit ratings and does not expect any counterparty to fail to meet its obligations.
The Group does not have any held-to-maturity investments that were past due but not impaired as of 31 December 2017 and 2016.
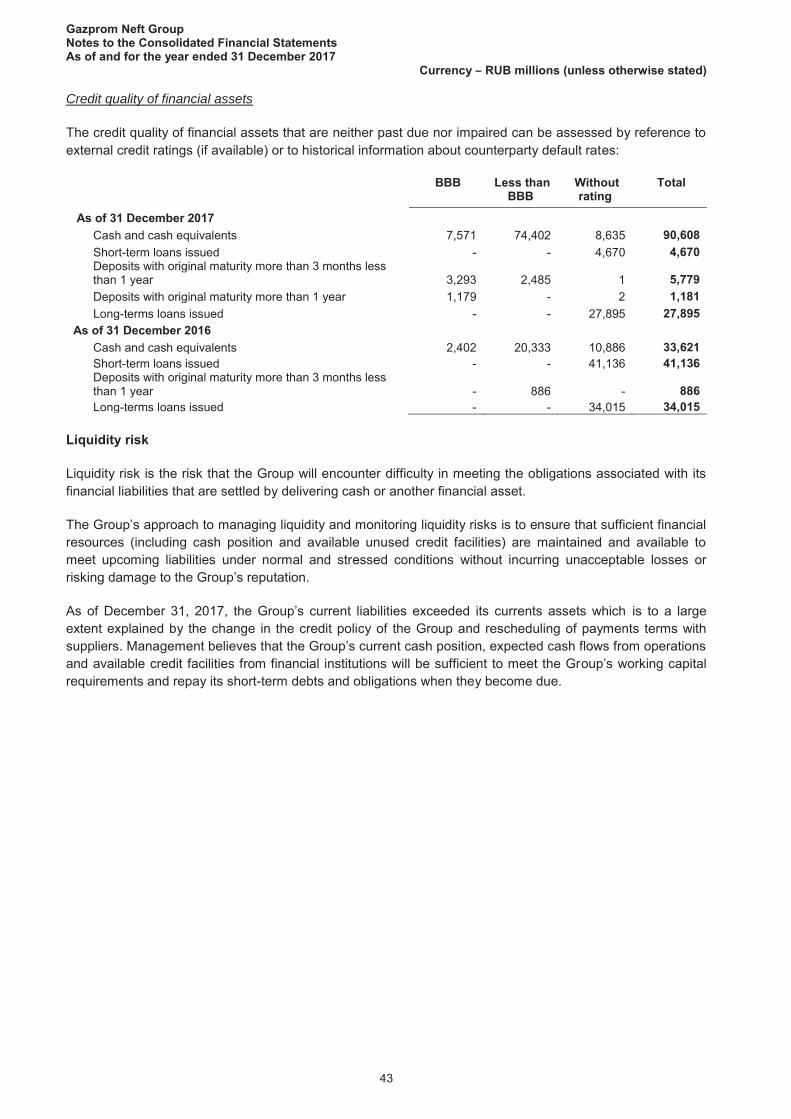
Gazprom Neft Group Notes to the Consolidated Financial Statements As of and for the year ended 31 December 2017
Currency – RUB millions (unless otherwise stated)
43
Credit quality of financial assets
The credit quality of financial assets that are neither past due nor impaired can be assessed by reference to external credit ratings (if available) or to historical information about counterparty default rates:
BBB Less than BBB
Without rating
Total
As of 31 December 2017 Cash and cash equivalents 7,571 74,402 8,635 90,608 Short-term loans issued - - 4,670 4,670
Deposits with original maturity more than 3 months less than 1 year 3,293 2,485 1 5,779
Deposits with original maturity more than 1 year 1,179 - 2 1,181 Long-terms loans issued - - 27,895 27,895 As of 31 December 2016 Cash and cash equivalents 2,402 20,333 10,886 33,621 Short-term loans issued - - 41,136 41,136
Deposits with original maturity more than 3 months less than 1 year - 886 - 886
Long-terms loans issued - - 34,015 34,015 Liquidity risk
Liquidity risk is the risk that the Group will encounter difficulty in meeting the obligations associated with its financial liabilities that are settled by delivering cash or another financial asset.
The Group’s approach to managing liquidity and monitoring liquidity risks is to ensure that sufficient financial resources (including cash position and available unused credit facilities) are maintained and available to meet upcoming liabilities under normal and stressed conditions without incurring unacceptable losses or risking damage to the Group’s reputation.
As of December 31, 2017, the Group’s current liabilities exceeded its currents assets which is to a large extent explained by the change in the credit policy of the Group and rescheduling of payments terms with suppliers. Management believes that the Group’s current cash position, expected cash flows from operations and available credit facilities from financial institutions will be sufficient to meet the Group’s working capital requirements and repay its short-term debts and obligations when they become due.

Gazprom Neft Group Notes to the Consolidated Financial Statements As of and for the year ended 31 December 2017
Currency – RUB millions (unless otherwise stated)
44
The following are the contractual maturities of financial liabilities, including estimated interest payments:
Carrying amount
Contractual cash flows
Less than 6 months
6 - 12 months
1 - 2 years
2 - 5 years
Over 5 years
As of 31 December 2017 Bank loans 303,173 363,557 31,966 32,262 104,621 191,009 3,699 Bonds 143,007 192,023 26,665 5,681 20,856 104,049 34,772 Loan Participation Notes 226,110 277,970 57,052 4,482 8,965 113,295 94,176 Other borrowings 8,124 9,929 369 590 285 6,403 2,282 Other non-current financial liabilities 47,274 74,384 - - 11,580 14,173 48,631 Finance lease liabilities 22,223 31,307 1,385 1,386 5,511 5,564 17,461 Trade and other payables 177,680 177,680 173,660 4,020 - - -
927,591 1,126,850 291,097 48,421 151,818 434,493 201,021 As of 31 December 2016 Bank loans 354,463 423,818 38,717 57,491 117,135 191,904 18,571 Bonds 81,879 107,991 6,063 14,155 16,431 71,342 - Loan Participation Notes 231,250 298,019 8,252 4,720 58,029 28,322 198,696 Other borrowings 8,637 11,182 398 988 5,269 1,942 2,585 Other non-current financial liabilities 61,729 83,110 - - 5,853 77,257 - Trade and other payables 84,266 84,266 81,736 2,362 20 148 -
822,224 1,008,386 135,166 79,716 202,737 370,915 219,852 Net debt reconciliation
The table below sets out an analysis of net debt and the movements in the Group’s liabilities from financing activities for each of the years presented. The items of these liabilities are those that are reported as financing in the statement of cash flows:
Short-term and long-term
debt
Finance lease
Other liabilities from financing
activities
Total
As of 1 January 2017 676,408 - 41,397 717,805 Cash flows, including: (24,957) (1,955) (63,058) (89,970) Proceeds from borrowings 356,370 - - 356,370 Repayment of borrowings (342,680) - (10,134) (352,814) Repayment of finance lease liabilities - (893) - (893) Interest paid (38,387) (1,062) - (39,449) Transaction costs directly attributable to the borrowings received (260) - - (260) Dividends paid - - (52,924) (52,924) Finance expense 40,713 1,062 - 41,775 Dividends declared - - 99,986 99,986 Changes in fair values, cash flow hedge - - (10,097) (10,097) Gain on foreign exchange differences (16,062) 419 - (15,643) Currency translation differences 4,312 - 342 4,654 Assets received under finance lease - 22,410 - 22,410 Other non-cash movements - 287 (997) (710) As of 31 December 2017 680,414 22,223 67,573 770,210

Gazprom Neft Group Notes to the Consolidated Financial Statements As of and for the year ended 31 December 2017
Currency – RUB millions (unless otherwise stated)
45
Short-term and long-term
debt
Finance lease
Other liabilities from financing
activities
Total
As of 1 January 2016 818,098 - 81,059 899,157 Cash flows, including: (72,632) - (32,274) (104,906) Proceeds from borrowings 224,266 - - 224,266 Repayment of borrowings (259,773) - (28,422) (288,195) Interest paid (36,476) - - (36,476) Transaction costs directly attributable to the borrowings received (649) - - (649) Dividends paid - - (3,852) (3,852) Finance expense 38,843 - - 38,843 Dividends declared - - 3,868 3,868 Changes in fair values, cash flow hedge - - (10,695) (10,695) Gain on foreign exchange differences (97,767) - - (97,767) Currency translation differences (10,259) - (561) (10,820) Business combinations 125 - - 125 As of 31 December 2016 676,408 - 41,397 717,805
Capital management
The Group’s objectives when managing capital are to safeguard the Group’s ability to continue as a going concern, to provide sufficient return for shareholders and benefits for other stakeholders and to maintain an optimal capital structure to reduce the cost of capital. In order to maintain or adjust the capital structure the Group may revise its investment program, attract new or repay existing loans or sell certain non-core assets.
On the Group level capital is monitored on the basis of the net debt to EBITDA ratio and return on the capital on the basis of return on average capital employed ratio (ROACE). Net debt to EBITDA ratio is calculated as net debt divided by EBITDA. Net debt is calculated as total debt, which includes long and short term loans, less cash and cash equivalents and short term deposits. EBITDA is defined as earnings before interest, income tax expense, depreciation, depletion and amortisation, foreign exchange gain (loss), other non-operating expenses and includes the Group’s share of profit of equity accounted investments. ROACE is calculated in general as Operating profit adjusted for income tax expense divided by the average for the period figure of Capital Employed. Capital Employed is defined as total equity plus net debt.
The Group’s net debt to EBITDA ratios at the end of the reporting periods were as follows:
Year ended
31 December 2017 Year ended
31 December 2016 Long-term debt 548,654 596,221 Short-term debt and current portion of long-term debt 131,760 80,187 Less: cash, cash equivalents and deposits (96,387) (34,507)
Net debt 584,027 641,901 Total EBITDA 489,025 402,277
Net debt to EBITDA ratio at the end of the reporting period 1.2 1.6 Operating profit 302,523 238,316 Operating profit adjusted for income tax expenses 242,470 185,653 less share of profit of associates and joint ventures 45,504 34,116 Average capital employed 2,164,614 1,994,626
ROACE 13.3% 11.0% There were no changes in the Group’s approach to capital management during the period.

Gazprom Neft Group Notes to the Consolidated Financial Statements As of and for the year ended 31 December 2017
Currency – RUB millions (unless otherwise stated)
46
Fair value measurement
Fair value is the price that would be received to sell an asset or paid to transfer a liability in an ordinary transaction between market participants at the measurement date.
The different levels of fair value hierarchy have been defined as follows:
Level 1: quoted prices (unadjusted) in active markets for identical assets or liabilities Level 2: inputs other than quoted prices included within Level 1 that are observable for the asset or
liability, either directly (i.e., as prices) or indirectly (i.e., derived from prices) Level 3: inputs for the asset or liability that are not based on observable market data (unobservable
inputs).
The following assets and liabilities are measured at fair value in the Group’s Consolidated Financial Statements:
Derivative financial instruments (forward exchange contracts and interest-rate swaps used as hedging instruments),
Stock Appreciation Rights plan (SAR), Financial investments classified as available for sale except for unquoted equity instruments whose
fair value cannot be measured reliably that are carried at cost less any impairment losses.
Derivative financial instruments and SAR refer to Level 2 of the fair value measurement hierarchy, i.e. their fair value is determined on the basis of inputs that are observable for the asset or liability either directly (as prices) or indirectly (derived from prices). There were no transfers between the levels of the fair value hierarchy during the year ended 31 December 2017 and 2016. There are no significant assets or liabilities measured at fair value categorised within Level 1 or Level 3 of the fair value hierarchy. The fair value of the foreign exchange contracts is determined by using forward exchange rates at the reporting date with the resulting value discounted back to present value.
As of 31 December 2017 the fair value of bonds and loan participation notes is RUB 378,085 million (RUB 315,488 million as of 31 December 2016). The fair value is derived from quotations in active market and related to Level 1 of the fair value hierarchy. The carrying value of other financial assets and liabilities approximates their fair value.
The table below analyses financial instruments carried at fair value, which refer to Level 2 of the fair value hierarchy.
Level 2 As of 31 December 2017 Forward exchange contracts (17,928) Other financial liabilities (5,726)
Total liabilities (23,654) As of 31 December 2016 Forward exchange contracts 91
Total assets 91 Forward exchange contracts (39,373) Other financial liabilities (3,730)
Total liabilities (43,103)

Gazprom Neft Group Notes to the Consolidated Financial Statements As of and for the year ended 31 December 2017
Currency – RUB millions (unless otherwise stated)
47
The Company implements a cash-settled stock appreciation rights (SAR) compensation plan. The plan forms part of the long term growth strategy of the Group and is designed to reward Management for increasing shareholder value over a specified period. Shareholder value is measured by reference to the Group’smarket capitalisation. The plan is open to selected Management provided certain service conditions are met. The awards are fair valued at each reporting date. The awards are subject to certain market and service conditions that determine the amount that may ultimately be accrued to eligible employees. The expense recognised is based on the vesting period.
The fair value of the liability under the plan is estimated using the Black-Scholes-Merton option-pricing model by reference primarily to the Group’s share price, historic volatility in the share price, dividend yield and interest rates for periods comparable to the remaining life of the award. Any changes in the estimated fair value of the liability award will be recognised in the period the change occurs subject to the vesting period. During the reporting period there were no changes in conditions for SAR compensation plan.
The following assumptions are used in the Black-Scholes-Merton model as of 31 December 2017 and 2016:
31 December 2017 31 December 2016Volatility 3.7% 3.6%Risk-free interest rate 8.0% 8.7%Dividend yield 5.4% 5.5%
In the Consolidated Statement of Profit and Loss and Other Comprehensive Income for the years ended 31 December 2017 and 2016 the Group accrued expenses related to SAR provision due to the growth in the value of Company’s shares in the amount of RUB 5,727 million and RUB 3,730 million, respectively. This expense is presented within selling, general and administrative expenses. In the Consolidated Statement of Financial Position as of 31 December 2017 and 31 December 2016 the Group recognised provision in amount of RUB 10,114 million and RUB 4,387 million, respectively.
36. Operating leases
Non-cancellable operating lease rentals are payable as follows:
31 December 2017 31 December 2016Less than one year 12, 12,Between one and five years 37, 3 ,8More than five years 9 , 9 ,
14 , 1 ,
The Group rents mainly land plots under pipelines, office premises and vessels under time-charter agreements.

Gazprom Neft Group Notes to the Consolidated Financial Statements As of and for the year ended 31 December 2017
Currency – RUB millions (unless otherwise stated)
48
37. Commitments and contingencies
Taxes
Russian tax and customs legislation is subject to frequent changes and varying interpretations. Management’s treatment of such legislation as applied to the transactions and activity of the Group, including calculation of taxes payable to federal, regional and municipal budgets, may be challenged by the relevant authorities. The Russian tax authorities may take a more assertive position in their treatment of legislation and assessments, and there is a risk that transactions and activities that have not been challenged in the past may be challenged later. As a result, additional taxes, penalties and interest may be accrued. Generally, taxpayers are subject to tax audits for a period of three calendar years immediately preceding the year in which the decision to carry out a tax audit has been taken. Under certain circumstances tax audits may cover longer periods. The field tax audit with regard to the years 2013 and 2014 is performing now, the years 2015 - 2017 are currently open for tax audit. Management believes it has adequately provided for any probable additional tax accruals that might arise from these tax audits.
The Russian transfer pricing legislation is generally aligned with the international transfer pricing principles developed by the Organisation for Economic Cooperation and Development (OECD), although it has specific features. This legislation provides for the possibility of additional tax assessments for controlled transactions (transactions between related parties and certain transactions between unrelated parties) if such transactions are not on an arm’s-length basis. The Management has implemented internal controls to be in compliance with this transfer pricing legislation.
The compliance of the prices of the Group’s controllable transactions with related parties with the transfer pricing rules is subject to regular internal control. Management believes that the transfer pricing documentation that the Group has prepared to confirm its compliance with the transfer pricing rules provides sufficient evidence to support the Group’s tax positions and related tax returns. In addition in order to mitigate potential risks, the Group regularly negotiates approaches to defining prices used for tax purposes for major controllable transactions with tax authorities in advance. Fifteen pricing agreements between the Group and tax authorities regarding major intercompany transactions have been concluded in 2012-2017.
As Russian tax legislation does not provide definitive guidance in certain areas, the Group adopts, from time to time, interpretations of such uncertain areas that reduce the overall tax rate of the Group. While Management currently estimates that the tax positions and interpretations that it has taken can probably be sustained, there is a possible risk that an outflow of resources will be required should such tax positions and interpretations be challenged by the tax authorities. The impact of any such challenge cannot be reliably estimated; however, it may be significant to the financial position and/or the overall operations of the Group.
Economic environment in the Russian Federation
The Russian Federation displays certain characteristics of an emerging market. Its economy is particularly sensitive to oil and gas prices. The legal, tax and regulatory frameworks continue to develop and are subject to frequent changes and varying interpretations. The Russian economy was growing in 2017, after overcoming the economic recession of 2015 and 2016. The economy is negatively impacted by low oil prices, ongoing political tension in the region and international sanctions against certain Russian companies and individuals. The financial markets continue to be volatile. This operating environment has a significant impact on the Group’s operations and financial position. Management is taking necessary measures to ensure sustainability of the Group’s operations. However, the future effects of the current economic situation are difficult to predict and management’s current expectations and estimates could differ from actual results.
In 2014 the U.S., the EU and certain other countries imposed sanctions on the Russian energy sector that partially apply to the Group. The information on the main restrictions related to sanctions was disclosed in the consolidated financial statements as of and for the year ended 31 December 2014. In August 2017 the U.S. signed an act to impose further sanctions against the Russian Federation, North Korea and Iran. The Group assessed that the new sanctions don’t have significant impact on its activities.

Gazprom Neft Group Notes to the Consolidated Financial Statements As of and for the year ended 31 December 2017
Currency – RUB millions (unless otherwise stated)
49
Environmental matters
The enforcement of environmental regulation in the Russian Federation is evolving and the enforcement posture of government authorities is continually being reconsidered. The Group periodically evaluates its potential obligations under environmental regulation. Management is of the opinion that the Group has met the government’s requirements concerning environmental matters, and therefore the Group does not have any material environmental liabilities.
Capital commitments
As of 31 December 2017 the Group has entered into contracts to purchase property, plant and equipment for RUB 328,697 million (RUB 300,978 million as of 31 December 2016).
38. Group entities
The most significant subsidiaries of the Group and the ownership interest are presented below:
Ownership interest
Subsidiary Country of incorporation
31 December 2017 31 December 2016
Exploration and Production JSC Gazpromneft-NNG Russian Federation 100% 100% Gazpromneft-Orenburg LLC Russian Federation 100% 100% Zapolyarneft LLC Russian Federation 100% 100% Gazprom Neft Shelf LLC Russian Federation 100% 100% Gazpromneft-Khantos LLC Russian Federation 100% 100% Gazpromneft-Vostok LLC Russian Federation 100% 100% Gazpromneft-Yamal LLC Russian Federation 90% 90% JSC Uzhuralneftegaz Russian Federation 87.5% 87.5% Refining JSC Gazpromneft Omsk Refinery Russian Federation 100% 100% JSC Gazpromneft Moscow Refinery Russian Federation 100% 100% Marketing Gazpromneft-Centre LLC Russian Federation 100% 100% Gazpromneft Regional Sales LLC Russian Federation 100% 100% JSC Gazpromneft-Aero Russian Federation 100% 100% Gazpromneft Marin Bunker LLC Russian Federation 100% 100% Gazpromneft Corporate Sales LLC Russian Federation 100% 100% Other Operations Gazpromneft-Lubricants LLC Russian Federation 100% 100% Gazpromneft-Bitumen Materials LLC Russian Federation 100% 100% Gazpromneft-NTC LLC Russian Federation 100% 100% GPN-Finance LLC Russian Federation 100% 100% GPN-Invest LLC Russian Federation 100% 100% Gazpromneft Shipping LLC Russian Federation 100% 100% Multibusiness companies Naftna industrija Srbije A.D. Serbia 56.2% 56.2%
The following table summarises the information relating to the non-contrilling interest of Naftna industrija Srbije A.D. and its subsidiaries and Gazprom Resource Northgas LLC. The carrying amount of non-controlling interests of all other subsidiaries is not significant individually.
Carrying amount of non-controlling interest
Profit for the period attributable to non-controlling interest
31 December 2017
31 December 2016
Year ended 31 December 2017
Year ended 31 December 2016
Naftna industrija Srbije A.D. and its subsidiaries 71,599 58,792 6,132 3,273
Gazprom Resource Northgas LLC 22,672 19,502 5,614 3,304

Gazprom Neft Group Notes to the Consolidated Financial Statements As of and for the year ended 31 December 2017
Currency – RUB millions (unless otherwise stated)
50
The table below summarises financial information for Naftna industrija Srbije A.D. and its subsidiaries and Gazprom Resource Northgas LLC as of 31 December 2017 and 2016 and for the years ended 31 December 2017 and 2016:
Naftna industrija Srbije A.D. and its subsidiaries
Gazprom Resource Northgas LLC
31 December 2017 31 December 2016 31 December 2017 31 December 2016 Current assets 61,658 48,388 15,171 12,346 Non-current assets 218,321 195,271 12,568 11,517 Current liabilities (36,160) (35,641) (23) (22) Non-current liabilities (61,812) (57,136) - - Naftna industrija Srbije A.D. and its
subsidiaries Gazprom Resource Northgas LLC
Year ended 31 December 2017
Year ended 31 December 2016
Year ended 31 December 2017
Year ended 31 December 2016
Revenue 195,130 189,781 - - Profit 13,997 7,483 6,863 4,039
Dividends paid in 2017 by Naftna industrija Srbije A.D. to the non-controlling share comprised RUB 0.9 billion (RUB 1.0 billion in 2016).
Dividends paid in 2017 by Gazprom Resource Northgas LLC to the non-controlling share comprised RUB 0.5 billion (none in 2016).
39. Related party transactions
For the purpose of these Consolidated Financial Statements parties are considered to be related if one party has the ability to control or jointly control the other party or exercise significant influence over the other party in making financial and operational decisions as defined by IAS 24 Related Party Disclosures. Related parties may enter into transactions which unrelated parties might not, and transactions between related parties may not be effected on the same terms, conditions and amounts as transactions between unrelated parties.
The Group has applied the exemption as allowed by IAS 24 not to disclose all government related transactions, as the parent of the Company is effectively being controlled by the Russian Government. In the course of its ordinary business the Group enters into transactions with natural monopolies, transportation companies and other government-related entities. Such purchases and sales are individually insignificant and are generally entered into on market or regulated prices. Transactions with the state also include taxes which are detailed in Notes 10, 22 and 33. The Group also leases vessels under time-charter agreements with a government related entity (lease expenses amounted RUB 5.3 billion for the year ended 31 December 2017). The tables below summarise transactions in the ordinary course of business with either the parent company or associates and joint ventures.
The Group enters into transactions with related parties based on market or regulated prices. Short-term and long-term loans provided as well as debt are based on market conditions available for not related entities. The tables below summarise transactions in the ordinary course of business with either the parent company or parent’s subsidiaries and associates or associates and joint ventures of the Group.

Gazprom Neft Group Notes to the Consolidated Financial Statements As of and for the year ended 31 December 2017
Currency – RUB millions (unless otherwise stated)
51
As of 31 December 2017 and 2016 the outstanding balances with related parties were as follows:
31 December 2017 Parent company Parent's subsidiaries and
associates
Associates and joint ventures
Cash and cash equivalents - 37,203 - Short-term financial assets - 1,322 - Trade and other receivables 4,567 4,172 9,813 Other current assets 23 2,708 783 Long-term financial assets - - 27,673 Other non-current assets - 309 -
Total assets 4,590 45,714 38,269 Short-term debt and other current financial
liability - - 367 Trade and other payables 52,970 2,257 38,173 Other current liabilities 130 318 137 Long-term debt and other non-current financial
liability 47,480 57,600 - Other non-current liabilities 6,394 - -
Total liabilities 106,974 60,175 38,677
31 December 2016 Parent company Parent's subsidiaries and
associates
Associates and joint ventures
Cash and cash equivalents - 7,723 - Short-term financial assets - 860 40,381 Trade and other receivables 3,693 4,160 13,212 Other current assets 614 3,406 1,224 Long-term financial assets - - 30,273 Other non-current assets - 884 -
Total assets 4,307 17,033 85,090 Short-term debt and other current financial
liability - - 1,029 Trade and other payables 1,921 3,236 8,066 Other current liabilities 772 392 201 Long-term debt and other non-current financial
liability 60,276 60,657 - Total liabilities 62,969 64,285 9,296
For the years ended 31 December 2017 and 2016 the following transactions occurred with related parties:
Year ended 31 December 2017
Parent company Parent's subsidiaries and
associates
Associates and joint ventures
Crude oil, gas and oil products sales 36,721 39,507 53,398 Other revenue 103 6,613 9,226 Purchases of crude oil, gas and oil products - 40,895 137,919 Production related services 33 23,371 21,185 Transportation costs 9,776 1,692 10,115 Interest expense 5,585 2,871 39 Interest income - 302 6,484

Gazprom Neft Group Notes to the Consolidated Financial Statements As of and for the year ended 31 December 2017
Currency – RUB millions (unless otherwise stated)
52
Year ended 31 December 2016
Parent company Parent's subsidiaries and
associates
Associates and joint ventures
Crude oil, gas and oil products sales 28,680 35,165 48,407 Other revenue 29 6,349 5,571 Purchases of crude oil, gas and oil products - 41,457 98,508 Production related services 29 20,317 18,749 Transportation costs 7,557 1,753 7,106 Interest expense 6,616 3,627 142 Interest income - 167 6,770
Transactions with key management personnel
For the years ended 31 December 2017 and 2016 remuneration of key management personnel (members of the Board of Directors and Management Committee) such as salary and other contributions amounted RUB 2,934 million and RUB 2,384 million, respectively. Key management remuneration includes salaries, bonuses, quarterly accruals of SAR and other contributions.
40. Segment information
Presented below is information about the Group’s operating segments for the years ended 31 December 2017 and 2016. Operating segments are components that engage in business activities that may earn revenues or incur expenses, whose operating results are regularly reviewed by the chief operating decision maker (CODM), and for which discrete financial information is available.
The Group manages its operations in 2 operating segments: Upstream and Downstream.
Upstream segment (exploration and production) includes the following Group operations: exploration, development and production of crude oil and natural gas (including joint ventures results), oil field services. Downstream segment (refining and marketing) processes crude into refined products and purchases, sells and transports crude and refined petroleum products. Corporate centre expenses are presented within the Downstream segment.
Eliminations and other adjustments section encompasses elimination of inter-segment sales and related unrealised profits, mainly from the sale of crude oil and products, and other adjustments.
Intersegment revenues are based upon prices effective for local markets and linked to market prices.
Adjusted EBITDA represents the Group’s EBITDA and its share in associates and joint ventures’ EBITDA. Management believes that adjusted EBITDA represents useful means of assessing the performance of the Group's ongoing operating activities, as it reflects the Group's earnings trends without showing the impact of certain charges. EBITDA is defined as earnings before interest, income tax expense, depreciation, depletion and amortisation, foreign exchange gain (loss), other non-operating expenses and includes the Group’s share of profit of associates and joint ventures. EBITDA is a supplemental non-IFRS financial measure used by Management to evaluate operations.
Year ended 31 December 2017 Upstream Downstream Eliminations Total Revenue from sales: External customers 214,811 1,643,120 - 1,857,931 Inter-segment 617,838 27,531 (645,369) -
Total revenue from sales 832,649 1,670,651 (645,369) 1,857,931 Adjusted EBITDA 433,036 117,931 - 550,967 Depreciation, depletion and amortisation, including: 108,087 32,911 - 140,998 Impairment of assets (256) - - (256) Capital expenditure 208,133 148,957 - 357,090

Gazprom Neft Group Notes to the Consolidated Financial Statements As of and for the year ended 31 December 2017
Currency – RUB millions (unless otherwise stated)
53
Year ended 31 December 2016 Upstream Downstream Eliminations Total
Revenue from sales: External customers 131,242 1,414,366 - 1,545,608 Inter-segment 523,155 18,463 (541,618) -
Total revenue from sales 654,397 1,432,829 (541,618) 1,545,608 Adjusted EBITDA 337,085 119,113 - 456,198 Depreciation, depletion and amortisation, including: 98,110 31,735 - 129,845
Impairment of assets 14,763 - - 14,763 Capital expenditure 245,994 138,823 - 384,817
The geographical segmentation of the Group’s revenue and capital expenditures for the years ended 31 December 2017 and 2016 is presented below:
Year ended 31 December 2017
Russian Federation
CIS Export and international operations
Total
Sales of crude oil 83,393 30,117 436,142 549,652 Sales of petroleum products 868,225 77,154 409,149 1,354,528 Sales of gas 36,351 - 1,237 37,588 Other sales 47,698 2,130 11,979 61,807 Less custom duties and sales related excises - (1,641) (144,003) (145,644)
Revenues from external customers, net 1,035,667 107,760 714,504 1,857,931 Year ended 31 December 2016
Sales of crude oil 94,809 23,657 279,344 397,810 Sales of petroleum products 743,721 72,969 391,084 1,207,774 Sales of gas 30,116 - 1,853 31,969 Other sales 45,050 2,050 11,111 58,211 Less custom duties and sales related excises - (1,260) (148,896) (150,156)
Revenues from external customers, net 913,696 97,416 534,496 1,545,608
Russian
Federation CIS Export and
international operations
Total
Non-current assets as of 31 December 2017 2,159,510 11,097 318,947 2,489,554 Capital expenditures for the year ended 31 December 2017 330,916 1,464 24,710 357,090 Impairment of assets for the year ended 31 December 2017 - - (256) (256) Non-current assets as of 31 December 2016 1,822,912 11,396 310,132 2,144,440 Capital expenditures for the year ended 31 December 2016 354,392 898 29,527 384,817 Impairment of assets for the year ended 31 December 2016 - - 14,763 14,763

Gazprom Neft Group Notes to the Consolidated Financial Statements As of and for the year ended 31 December 2017
Currency – RUB millions (unless otherwise stated)
54
Adjusted EBITDA for the years ended 31 December 2017 and 2016 is reconciled below:
Year ended
31 December 2017 Year ended
31 December 2016
Profit for the period 269,678 209,725 Total income tax expense 55,522 49,814 Finance expense 25,127 34,282 Finance income (10,098) (11,071) Depreciation, depletion and amortisation 140,998 129,845 Net foreign exchange (loss) / gain 241 (28,300) Other loss, net 7,557 17,982
EBITDA 489,025 402,277 less share of profit of associates and joint ventures (45,504) (34,116) add share of EBITDA of associates and joint ventures 107,446 88,037
Total adjusted EBITDA 550,967 456,198
41. Subsequent events
In January 2018 the Group borrowed RUB 51.3 billion under long-term facility agreements due payable in January 2023.

Gazprom Neft Group Supplementary Information on Oil and Gas Activities (Unaudited) For the year ended 31 December 2017
Currency – RUB millions
55
Supplementary information on oil and gas activities (unaudited)
The accompanying Consolidated Financial Statements have been prepared in accordance with International Financial Reporting Standards (“IFRS”). In the absence of specific IFRS guidance, the Group has reverted to other relevant disclosure standards, mainly US GAAP, that are consistent with practices established for the oil and gas industry. While not required under IFRS, this section provides unaudited supplemental information on oil and gas exploration and production activities.
The Group makes certain supplemental disclosures about its oil and gas exploration and production that are consistent with practices. While this information was developed with reasonable care and disclosed in good faith, it is emphasised that some of the data is necessarily imprecise and represents only approximate amounts because of the subjective judgments involved in developing such information. Accordingly, this information may not necessarily represent the current financial condition of the Group or its expected future results.
The Group voluntarily uses the SEC definition of proved reserves to report proved oil and gas reserves and disclose certain unaudited supplementary information associated with the Group’s consolidated subsidiaries, share in joint operations, associates and joint ventures.
The proved oil and gas reserve quantities and related information regarding standardised measure of discounted future net cash flows do not include reserve quantities or standardised measure information related to the Group's Serbian subsidiary, NIS, as disclosure of such information is prohibited by the Government of the Republic of Serbia. The disclosures regarding capitalised costs relating to and results of operations from oil and gas activities do not include the relevant information related to NIS.
Presented below are capitalised costs relating to oil and gas producing activities:
31 December
2017 31 December
2016 Consolidated subsidiaries and share in joint operations Unproved oil and gas properties 89,558 68,046 Proved oil and gas properties 1,584,543 1,423,745 Less: Accumulated depreciation, depletion and amortisation (628,226) (537,277) Net capitalised costs of oil and gas properties 1,045,875 954,514 Group's share of associates and joint ventures Proved oil and gas properties 553,553 538,829 Less: Accumulated depreciation, depletion and amortisation (168,373) (135,809) Net capitalised costs of oil and gas properties 385,180 403,020 Total capitalised costs consolidated and equity interests 1,431,055 1,357,534
Presented below are costs incurred in acquisition, exploration and development of oil and gas reserves for the years ended 31 December:
Year ended 31 December
2017
Year ended 31 December
2016 Consolidated subsidiaries and share in joint operations Exploration costs 20,281 11,711 Development costs 193,540 223,214 Costs incurred 213,821 234,925 Group's share of associates and joint ventures Exploration costs 608 16 Development costs 59,877 65,882 Total costs incurred consolidated and equity interests 274,306 300,823

Gazprom Neft Group Supplementary Information on Oil and Gas Activities (Unaudited) For the year ended 31 December 2017
Currency – RUB millions
56
Results of operations from oil and gas producing activities for the years ended:
Year ended
31 December 2017
Year ended 31 December
2016 Consolidated subsidiaries and share in joint operations Revenues: Sales 235,645 165,153 Transfers 438,921 432,301 Total revenues 674,566 597,454 Production costs (103,739) (96,835) Exploration expenses (963) (1,195) Depreciation, depletion and amortisation (107,119) (83,199) Taxes other than income tax (345,160) (251,711) Pretax income from producing activities 117,585 164,514 Income tax expenses (39,708) (32,430) Results of oil and gas producing activities 77,877 132,084 Group's share of associates and joint ventures Total revenues 214,960 172,288 Production costs (23,133) (21,607) Exploration expenses (495) (533) Depreciation, depletion and amortisation (34,446) (27,636) Taxes other than income tax (87,038) (65,619) Pretax income from producing activities 69,848 56,893 Income tax expenses (6,188) (4,301) Results of oil and gas producing activities 63,660 52,592 Total consolidated and equity interests in results of oil and gas producing activities 141,537 184,676
Proved oil and gas reserve quantities
Proved reserves are defined as the estimated quantities of oil and gas, which geological and engineering data demonstrate with reasonable certainty to be recoverable in future years from known reservoirs under existing economic and operating conditions. In some cases, substantial new investment in additional wells and related support facilities and equipment will be required to recover such proved reserves. Due to the inherent uncertainties and the limited nature of reservoir data, estimates of underground reserves are subject to change over time as additional information becomes available.
Proved developed reserves are those reserves, which are expected to be recovered through existing wells with existing equipment and operating methods. Proved undeveloped reserves are those reserves which are expected to be recovered as a result of future investments to drill new wells, to recomplete existing wells and/or install facilities to collect and deliver the production from existing and future wells.

Gazprom Neft Group Supplementary Information on Oil and Gas Activities (Unaudited) For the year ended 31 December 2017
Currency – RUB millions
57
As determined by the Group's independent reservoir engineers, DeGolyer and MacNaughton, the following information presents the balances of proved oil and gas reserve quantities (in millions of barrels and billions of cubic feet respectively):
Proved Oil Reserves Quantities - in MMBbl 31 December 2017
31 December 2016
Consolidated subsidiaries and share in joint operations Beginning of year 4,853 4,842 Production (357) (343) Purchases of minerals in place - - Revision of previous estimates 353 354 End of year 4,849 4,853 Minority’s share included in the above proved reserves (35) (30) Proved reserves, adjusted for minority interest 4,814 4,823
Proved developed reserves 2,660 2,707 Proved undeveloped reserves 2,189 2,146
Group's share of associates and joint ventures Beginning of year 1,451 1,414 Production (99) (95) Purchases of minerals in place - - Revision of previous estimates 93 132 End of year* 1,445 1,451
Proved developed reserves 680 707 Proved undeveloped reserves 765 744
Total consolidated and equity interests in reserves - end of year 6,294 6,304
Proved Gas Reserves Quantities - in Bcf 31 December 2017
31 December 2016
Consolidated subsidiaries and share in joint operations Beginning of year 6,387 6,137 Production (579) (516) Purchases of minerals in place - - Revision of previous estimates 2,977 766 End of year 8,785 6,387 Minority’s share included in the above proved reserves (314) (41) Proved reserves, adjusted for minority interest 8,471 6,346
Proved developed reserves 4,150 4,261 Proved undeveloped reserves 4,635 2,126
Group's share of associates and joint ventures Beginning of year 13,201 13,357 Production (602) (622) Purchases of minerals in place - - Revision of previous estimates 373 466 End of year* 12,972 13,201
Proved developed reserves 7,612 7,254 Proved undeveloped reserves 5,360 5,947
Total consolidated and equity interests in reserves - end of year 21,757 19,588
*Including 82% NCI share in Gazprom Resource Northgas

Gazprom Neft Group Supplementary Information on Oil and Gas Activities (Unaudited) For the year ended 31 December 2017
Currency – RUB millions
58
Standardised measure of discounted future net cash flows relating to proved oil and gas reserves
Estimated future cash inflows from production are computed by applying average first-day-of-the-month price for oil and gas for each month within the 12 month period before the balance sheet date to year-end quantities of estimated proved reserves. Adjustment in this calculation for future price changes is limited to those required by contractual arrangements in existence at the end of each reporting period. Future development and production costs are those estimated future expenditures necessary to develop and produce year-end proved reserves based on year-end cost indices, assuming continuation of year-end economic conditions. Estimated future income taxes are calculated by applying appropriate year-end statutory tax rates. These rates reflect allowable deductions and tax credits and are applied to estimated future pre-tax cash flows, less the tax bases of related assets. Discounted future net cash flows have been calculated using a 10% discount factor. Discounting requires a year-by-year estimate of when future expenditures will be incurred and when reserves will be produced.
The information provided in tables set out below does not represent Management’s estimate of the Group’s expected future cash flows or of the value Group’s proved oil and gas reserves. Estimates of proved reserves quantities are imprecise and change over time, as new information becomes available. Moreover, probable and possible reserves, which may become proved in the future, are excluded from the calculations. The calculations should not be relied upon as an indication of the Group’s future cash flows or of the value of its oil and gas reserves.
31 December 2017
31 December 2016
Consolidated subsidiaries and share in joint operations Future cash inflows 10,303,365 9,962,668 Future production costs (5,945,717) (5,236,343) Future development costs (832,377) (771,656) Future income tax expenses (479,352) (545,985) Future net cash flow 3,045,919 3,408,684 10% annual discount for estimated timing of cash flow (1,584,751) (1,759,813) Standardised measure of discounted future net cash flow 1,461,168 1,648,871 Group's share of associates and joint ventures Future cash inflows 2,662,993 2,550,475 Future production costs (1,468,966) (1,346,581) Future development costs (217,726) (217,170) Future income tax expenses (157,227) (156,342) Future net cash flow 819,074 830,382 10% annual discount for estimated timing of cash flow (308,142) (330,733) Standardised measure of discounted future net cash flow 510,932 499,649 Total consolidated and equity interests in the standardised measure of discounted future net cash flow 1,972,100 2,148,520
Gazprom Neft Group Contact Information
59
The Group’s office is
3-5 Pochtamtskaya St., St. Petersburg, Russian Federation 190000
Telephone: +7 (812) 363-31-52 Hotline: 8-800-700-31-52 Fax: +7 (812) 363-31-51
www.gazprom-neft.ru
Investor Relations
Tel.: +7 (812) 385-95-48 Email: [email protected]


![Registrar’S office23.5 F, Fa, Fe U 23.1 23.2 23.3 24 Audit 24.1 Audit Audit 23.1 Audit 24.3 Audit Audit Audit Aud. 24.6 Audit 80 Audit 80 25 25.1 C 80 25.2 26 26.1 3.5 îlLt_Jðth]](https://static.fdocuments.us/doc/165x107/60922293f5299d6df61fd513/registraras-office-235-f-fa-fe-u-231-232-233-24-audit-241-audit-audit-231.jpg)