Consolidated Financial Results for the Fiscal Year Ended ...Supplementary material on financial...
21
April 28, 2014 Consolidated Financial Results for the Fiscal Year Ended March 31, 2014 [under Japanese GAAP] Company name: Mitsubishi UFJ Securities Holdings Co., Ltd. URL: http://www.hd.sc.mufg.jp/ Representative: Toshiro Toyoizumi, President & CEO Contact: Mitsugu Enjoji, General Manager, Financial Planning Division TEL: (03) 6213-2550 Scheduled date of General Shareholders’ Meeting: June 26, 2014 Scheduled date to file Securities Report: June 26, 2014 Supplementary material on financial results: Yes Financial results presentation meeting: None (Millions of yen with fractional amounts disregarded) 1. Consolidated performance for the fiscal year 2013 (from April 1, 2013 to March 31, 2014) (1) Consolidated operating results (Percentages indicate year-on-year changes.) Operating revenue Net operating revenue Operating income Ordinary income Millions of yen % Millions of yen % Millions of yen % Millions of yen % FY2013 487,796 39.2 450,633 47.2 133,923 172.2 163,304 93.9 FY2012 350,524 14.2 306,082 28.3 49,201 – 84,228 120.6 Net income Net income per share Diluted net income per share Net income /equity Millions of yen % Yen Yen % FY2013 97,781 108.3 132.68 – 13.5 FY2012 46,946 183.1 63.70 – 7.4 (Note) Comprehensive income FY2013: 191,284 million yen (61.4 %) FY2012: 118,517 million yen (471.6 %) (Reference) Equity in earnings (losses) of affiliates FY2013: 24,506 million yen FY2012: 24,221 million yen (2) Consolidated financial position Total assets Net assets Equity ratio Net assets per share Millions of yen Millions of yen % Yen As of March 31, 2014 30,418,476 1,068,092 2.6 1,065.74 As of March 31, 2013 26,506,478 924,400 2.5 904.31 (Reference) Equity As of March 31, 2014: 785,437 million yen As of March 31, 2013: 666,461 million yen (Note) “Equity ratio” is computed under the formula shown below: (Total net assets – Subscription rights to shares – Minority interests) / Total assets This English version is a translation of the original Japanese document and is only for reference purposes. In the case where any differences occur between the English version and the original Japanese version, the Japanese version will prevail. The financial results written in the original Japanese document is not audited by independent auditors.
Transcript of Consolidated Financial Results for the Fiscal Year Ended ...Supplementary material on financial...

April 28, 2014
Consolidated Financial Results for the Fiscal Year Ended March 31, 2014
[under Japanese GAAP] Company name: Mitsubishi UFJ Securities Holdings Co., Ltd. URL: http://www.hd.sc.mufg.jp/ Representative: Toshiro Toyoizumi, President & CEO Contact: Mitsugu Enjoji, General Manager, Financial Planning Division TEL: (03) 6213-2550 Scheduled date of General Shareholders’ Meeting: June 26, 2014 Scheduled date to file Securities Report: June 26, 2014 Supplementary material on financial results: Yes Financial results presentation meeting: None
(Millions of yen with fractional amounts disregarded) 1. Consolidated performance for the fiscal year 2013
(from April 1, 2013 to March 31, 2014) (1) Consolidated operating results (Percentages indicate year-on-year changes.) Operating revenue Net operating revenue Operating income Ordinary income
Millions of yen % Millions of yen % Millions of yen % Millions of yen %FY2013 487,796 39.2 450,633 47.2 133,923 172.2 163,304 93.9FY2012 350,524 14.2 306,082 28.3 49,201 – 84,228 120.6
Net income Net income per share Diluted net income
per share Net income
/equity Millions of yen % Yen Yen %FY2013 97,781 108.3 132.68 – 13.5FY2012 46,946 183.1 63.70 – 7.4
(Note) Comprehensive income FY2013: 191,284 million yen (61.4 %) FY2012: 118,517 million yen (471.6 %) (Reference) Equity in earnings (losses) of affiliates FY2013: 24,506 million yen FY2012: 24,221 million yen (2) Consolidated financial position Total assets Net assets Equity ratio Net assets per share Millions of yen Millions of yen % YenAs of March 31, 2014 30,418,476 1,068,092 2.6 1,065.74
As of March 31, 2013 26,506,478 924,400 2.5 904.31
(Reference) Equity As of March 31, 2014: 785,437 million yen As of March 31, 2013: 666,461 million yen (Note) “Equity ratio” is computed under the formula shown below:
(Total net assets – Subscription rights to shares – Minority interests) / Total assets
This English version is a translation of the original Japanese document and is only for reference purposes. In the case where any differences occur between the English version and the original Japanese version, the Japanese version will prevail. The financial results written in the original Japanese document is not audited by independent auditors.

(3) Consolidated cash flows (Millions of yen)
Cash flows from operating activities
Cash flows from investing activities
Cash flows from financing activities
Cash and cash equivalents at end of
period FY2013 (2,397) (40,280) 434,373 1,124,995FY2012 (130,199) 82,043 335,014 717,806
<* Notes> (1) Changes in significant subsidiaries during the period (changes in specified subsidiaries
resulting in the change in scope of consolidation): None
(2) Changes in accounting policies, changes in accounting estimates, and restatement of prior period financial statements after error corrections a. Changes in accounting policies due to revisions to accounting standards and other regulations:
Yes b. Changes in accounting policies due to other reasons: None c. Changes in accounting estimates: None d. Restatement of prior period financial statements after error corrections: None (Note) For details, please refer to “4. Changes in accounting policies” on page 11 of the “Attached Material.”
(3) Number of issued shares (common stock)
a. Total number of issued shares at the end of the period (including treasury stock)
As of March 31, 2014 736,985,496 shares
As of March 31, 2013 736,985,496 shares
b. Number of shares of treasury stock at the end of the period
As of March 31, 2014 – shares
As of March 31, 2013 – shares
c. Average number of shares during the period
Fiscal year ended March 31, 2014 736,985,496 shares
Fiscal year ended March 31, 2013 736,985,496 shares <* Indication regarding execution of audit procedures >
This financial results report is exempt from the audit procedures pursuant to the Financial Instruments and Exchange Act. At the time of disclosure of this financial results report, the audit procedures for consolidated financial statements are in progress.
<* Other special matters > None

Attached Material
Index
1. Consolidated financial statements (1) Consolidated balance sheets ........................ P. 1 (2) Consolidated statements of income and Consolidated statements of comprehensive income Consolidated statements of income ........................ P. 4 Consolidated statements of comprehensive income ........................ P. 6 (3) Consolidated statements of changes in net assets ........................ P. 7 (4) Consolidated statements of cash flows ........................ P. 8
2. Notes on premise of going concern ........................ P. 10 3. Key items forming the basis of preparation of consolidated financial
statements ························ P. 10 4. Changes in accounting policies ........................ P. 11 5. Notes to consolidated financial statements
(Segment information) ........................ P. 12 (Per share information) ........................ P. 14
<Reference> Consolidated Financial Results for the Fiscal Year Ended March 31, 2014 1. Commission received
(1) Breakdown by item ........................ P. 15 (2) Breakdown by product ........................ P. 15
2. Net trading income ........................ P. 15 Quarterly Trends in Consolidated Statements of Income ........................ P. 16 <Reference> Non-consolidated Financial Results of Mitsubishi UFJ Morgan Stanley Securities Co., Ltd. for the Fiscal Year Ended March 31, 2014
(1) Non-consolidated operating results ........................ P. 17 (2) Non-consolidated financial position ........................ P. 18
1
1. Consolidated financial statements (1) Consolidated balance sheets
(Millions of yen)
As of March 31, 2013 As of March 31, 2014
ASSETS Current assets
Cash and deposits 719,879 1,133,772 Cash segregated as deposits 148,307 157,946 Trading products 15,530,676 14,867,140
Trading securities and other 6,006,975 7,245,497 Derivatives 9,523,700 7,621,642
Trade date accrual – 151,952 Margin transaction assets 56,470 71,272
Loans on margin transactions 49,520 66,431 Cash collateral pledged for securities borrowing on margin transactions 6,950 4,840
Loans secured by securities 8,194,267 12,176,027 Cash collateral pledged for securities borrowed 3,283,734 5,006,564
Loans on Gensaki transactions 4,910,532 7,169,463 Advances paid 7,634 5,968 Short-term guarantee deposits 782,160 751,608 Short-term loans receivable 117 10,312 Short-term investment securities 181,082 277,088 Income taxes receivable 3,110 10,690 Deferred tax assets 22,909 32,071 Other current assets 107,521 107,300 Allowance for doubtful accounts (21) (11)Total current assets 25,754,116 29,753,141
Noncurrent assets Property, plant and equipment 27,777 31,372
Buildings 14,415 16,276 Equipment 8,114 10,098 Land 5,017 4,921 Construction in progress 230 75
Intangible assets 43,783 60,208 Software 24,168 30,427 Other 19,615 29,780
Investments and other assets 680,800 573,754 Investment securities 661,497 548,765 Long-term loans receivable 437 282 Net defined benefit asset – 2,529 Deferred tax assets 1,096 1,226 Other 18,805 21,889 Allowance for doubtful accounts (1,035) (938)
Total noncurrent assets 752,361 665,335 Total assets 26,506,478 30,418,476
2
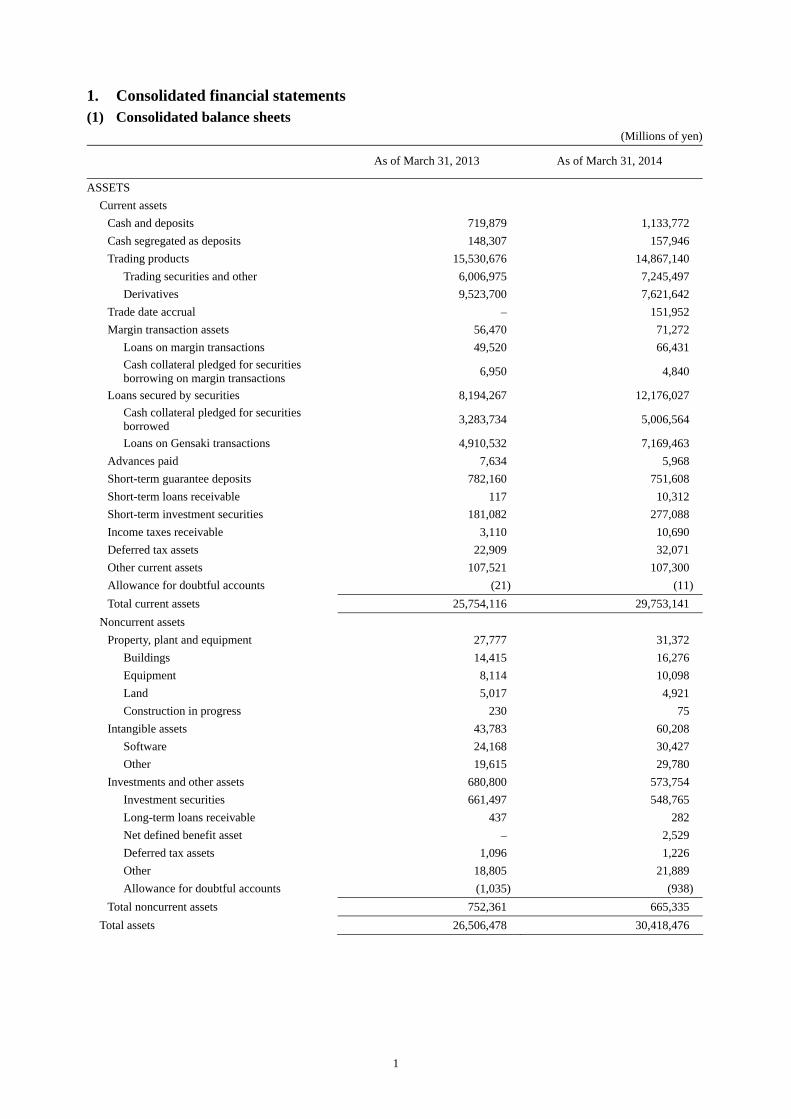
(Millions of yen)
As of March 31, 2013 As of March 31, 2014
LIABILITIES
Current liabilities
Trading products 12,471,740 11,501,377
Trading securities and other 2,864,481 3,993,318
Derivatives 9,607,258 7,508,058
Trade date accrual 68,720 –
Margin transaction liabilities 18,911 26,519
Borrowings on margin transactions 6,394 2,547 Cash received for securities lending on margin transactions 12,517 23,972
Loans payable secured by securities 9,142,300 13,148,960 Cash received on debt credit transaction of securities 3,924,370 5,637,029
Borrowings on Gensaki transactions 5,217,930 7,511,931
Deposits received 167,420 195,430
Guarantee deposits received 772,533 987,929
Short-term loans payable 996,569 1,047,667
Current portion of long-term loans payable 26,046 70,139
Commercial papers 446,700 553,800
Current portion of bonds 161,719 109,812
Income taxes payable 8,700 13,289
Provision for bonuses 28,560 38,430
Asset retirement obligations 278 276
Other current liabilities 61,930 85,656
Total current liabilities 24,372,132 27,779,290
Noncurrent liabilities
Bonds payable 803,310 1,124,031
Long-term loans payable 379,572 428,566
Deferred tax liabilities 10,284 9,298
Provision for retirement benefits 10,960 –
Net defined benefit liability – 2,539
Provision for directors’ retirement benefits 489 212
Asset retirement obligations 4,093 4,765
Other noncurrent liabilities 214 347
Total noncurrent liabilities 1,208,924 1,569,761
Reserves under the special laws Reserve for financial products transaction liabilities 1,021 1,332
Total reserves under the special laws 1,021 1,332
Total liabilities 25,582,077 29,350,384

3
(Millions of yen)
As of March 31, 2013 As of March 31, 2014
NET ASSETS
Shareholders’ equity
Capital stock 75,518 75,518
Capital surplus 426,948 426,948
Retained earnings 185,613 266,850
Total shareholders’ equity 688,081 769,317
Accumulated other comprehensive income Valuation difference on available-for-sale securities 6,067 4,893
Deferred gains or losses on hedges 36 (38)
Foreign currency translation adjustment (27,724) 8,872
Remeasurements of defined benefit plans – 2,391
Total accumulated other comprehensive income (21,620) 16,119
Minority interests 257,939 282,654
Total net assets 924,400 1,068,092
Total liabilities and net assets 26,506,478 30,418,476

4
(2) Consolidated statements of income and Consolidated statements of comprehensive income Consolidated statements of income
(Millions of yen)
For the fiscal year ended
March 31, 2013 (From April 1, 2012 to March 31, 2013)
For the fiscal year ended March 31, 2014
(From April 1, 2013 to March 31, 2014)
Operating revenue Commission received 171,957 242,578 Net trading income 107,329 210,448 Net gain on private equity and other securities (4,735) (1,045)Other net gain on goods trading 125 123 Financial revenue 75,846 35,692 Total operating revenue 350,524 487,796
Financial expenses 44,441 37,163 Net operating revenue 306,082 450,633 Selling, general and administrative expenses
Trading related expenses 74,326 98,794 Personnel expenses 110,469 133,373 Real estate expenses 20,931 22,227 Office cost 25,974 30,910 Depreciation 14,301 13,727 Taxes and dues 4,462 9,510 Other 6,415 8,166 Total selling, general and administrative expenses 256,881 316,710
Operating income 49,201 133,923 Non-operating income
Interest income 6,967 5,144 Equity in earnings of affiliates 24,221 24,506 Other 5,529 2,470 Total non-operating income 36,717 32,121
Non-operating expenses Loss on valuation of investment securities – 788 Foreign exchange losses 1,066 587 Loss on investments in limited liability investment partnerships and others 1 575
Other 623 788 Total non-operating expenses 1,690 2,740
Ordinary income 84,228 163,304

5
(Millions of yen)
For the fiscal year ended
March 31, 2013 (From April 1, 2012 to March 31, 2013)
For the fiscal year ended March 31, 2014
(From April 1, 2013 to March 31, 2014)
Extraordinary income Gain on sales of investment securities 4,697 8,475 Gain on sales of subsidiaries and affiliates’ stocks – 103
Gain on redemption of investment securities – 226 Gain on sales of noncurrent assets 457 1 Total extraordinary income 5,154 8,807
Extraordinary loss Loss on sales of investment securities 238 189 Loss on sales of stocks of subsidiaries and affiliates 1,322 –
Loss on valuation of investment securities 110 57 Loss on sales of noncurrent assets 29 26 Impairment loss 1,420 2,359 Provision of reserve for financial products transaction liabilities 3 311
Extra retirement payments 321 – Other 84 318 Total extraordinary losses 3,531 3,263
Income before income taxes and minority interests 85,851 168,848 Income taxes-current 9,746 21,790 Income taxes-deferred (6,829) (9,403)Total income taxes 2,916 12,386 Income before minority interests 82,935 156,461 Minority interests in income 35,988 58,679 Net income 46,946 97,781

6
Consolidated statements of comprehensive income (Millions of yen)
For the fiscal year ended March 31, 2013
(From April 1, 2012 to March 31, 2013)
For the fiscal year ended March 31, 2014
(From April 1, 2013 to March 31, 2014)
Income before minority interests 82,935 156,461 Other comprehensive income
Valuation difference on available-for-sale securities 13,239 (2,457)
Deferred gains or losses on hedges 935 (74)Foreign currency translation adjustment 21,388 37,357 Share of other comprehensive income of associates accounted for using equity method 19 (3)
Total other comprehensive income 35,582 34,822 Comprehensive income 118,517 191,284
(Comprehensive income attributable to) Comprehensive income attributable to owners of the parent 78,102 133,130
Comprehensive income attributable to minority interests 40,415 58,153

7
(3) Consolidated statements of changes in net assets For the fiscal year ended March 31, 2013 (From April 1, 2012 to March 31, 2013) (Millions of yen)
Shareholders’ equity Accumulated other comprehensive income
Capital stock
Capital surplus
Retained earnings
Total shareholders’
equity
Valuation difference
on available-for-sale
securities
Deferred gains or losses on hedges
Foreign currency
translation adjustment
Remeasurements of defined benefit
plans
Total accumulated
other comprehensive
income
Minority interests
Total net assets
Balance at the beginning of current period
75,518 426,948 145,830 648,297 (4,166) (898) (47,709) – (52,775) 224,128 819,651
Changes of items during the period
Dividends from surplus (7,163) (7,163) (7,163)
Net income 46,946 46,946 46,946Net changes of items other than shareholders’ equity
10,234 935 19,985 – 31,155 33,810 64,965
Total changes of items during the period
– – 39,783 39,783 10,234 935 19,985 – 31,155 33,810 104,749
Balance at the end of current period
75,518 426,948 185,613 688,081 6,067 36 (27,724) – (21,620) 257,939 924,400
For the fiscal year ended March 31, 2014 (From April 1, 2013 to March 31, 2014) (Millions of yen)
Shareholders’ equity Accumulated other comprehensive income
Capital stock
Capital surplus
Retained earnings
Total shareholders’
equity
Valuation difference
on available-for-sale
securities
Deferred gains or losses on hedges
Foreign currency
translation adjustment
Remeasurements of defined benefit
plans
Total accumulated
other comprehensive
income
Minority interests
Total net assets
Balance at the beginning of current period
75,518 426,948 185,613 688,081 6,067 36 (27,724) – (21,620) 257,939 924,400
Changes of items during the period
Dividends from surplus (16,545) (16,545) (16,545)
Net income 97,781 97,781 97,781Net changes of items other than shareholders’ equity
(1,174) (74) 36,597 2,391 37,739 24,715 62,455
Total changes of items during the period
– – 81,236 81,236 (1,174) (74) 36,597 2,391 37,739 24,715 143,691
Balance at the end of current period
75,518 426,948 266,850 769,317 4,893 (38) 8,872 2,391 16,119 282,654 1,068,092

8
(4) Consolidated statements of cash flows (Millions of yen)
For the fiscal year ended March 31, 2013
(From April 1, 2012 to March 31, 2013)
For the fiscal year ended March 31, 2014
(From April 1, 2013 to March 31, 2014)
Cash flows from operating activities Income before income taxes and minority interests 85,851 168,848
Depreciation and amortization 14,301 13,727 Amortization of goodwill 243 1,140 Increase (decrease) in provision for retirement benefits (728) –
Increase (decrease) in provision for directors’ retirement benefits (81) (276)
Increase (decrease) in allowance for doubtful accounts (128) (106)
Increase (decrease) in reserve for financial products transaction liabilities 3 311
Increase (decrease) in net defined benefit liability – (2,534)Interest and dividends income (84,585) (41,598)Interest expenses 44,441 37,163 Equity in (earnings) losses of affiliates (24,221) (24,506)Loss (gain) on sales of investment securities (4,458) (9,040)Loss (gain) on sales of stocks of subsidiaries and affiliates 1,322 (103)
Loss (gain) on redemption of investment securities – (226)
Loss (gain) on valuation of investment securities (1,926) 846 Loss (gain) on sales of noncurrent assets (427) 24 Impairment loss 1,420 2,359 Extra retirement payments 321 – Decrease (increase) in cash segregated as deposits for customers (36,902) (10,184)
Decrease (increase) in trading products-assets (liabilities) (1,620,931) (151,742)
Decrease (increase) in trade date accrual 300,578 (226,622)Decrease/increase in assets/liabilities for margin transaction (13,250) (7,193)
Decrease/increase in loans/borrowings secured by securities 1,185,728 34,419
Decrease/increase in advance paid/deposits received 68,206 30,871
Decrease (increase) in short-term guarantee deposits (75,190) 138,178
Increase (decrease) in guarantee deposits received (76,445) 52,958
Other, net 44,235 (46,104)Subtotal (192,624) (39,390)Interest and dividends income received 102,668 94,960 Interest expenses paid (38,891) (32,859)Head office transfer cost paid (464) – Early extra retirement payments paid (742) – Extra retirement payments paid (282) (47)Income taxes paid (8,575) (28,311)Income taxes refund 8,713 3,250 Net cash provided by (used in) operating activities (130,199) (2,397)

9
(Millions of yen)
For the fiscal year ended March 31, 2013
(From April 1, 2012 to March 31, 2013)
For the fiscal year ended March 31, 2014
(From April 1, 2013 to March 31, 2014)
Cash flows from investing activities Payments into time deposits (2,302) (10,442)Proceeds from withdrawal of time deposits 35,317 3,754 Purchase of short-term investment securities (718,479) (288,590)Proceeds from sales and redemption of securities 654,890 305,640 Purchase of investment securities (159,344) (152,023)Proceeds from sales and redemption of investment securities 289,256 149,635
Purchase of property, plant and equipment (2,725) (8,381)Proceeds from sales of property, plant and equipment 1,001 12
Payments for retirement of property, plant and equipment (1,155) (629)
Purchase of intangible assets (9,281) (14,779)Proceeds from sales of intangible assets 91 1 Decrease (increase) in call and other loans 9,731 (10,039)Purchase of investments in subsidiaries – (14,439)Purchase of investments in subsidiaries resulting in change in scope of consolidation (14,986) –
Proceeds from sales of investments in subsidiaries resulting in change in scope of consolidation
17 –
Other, net 13 – Net cash provided by (used in) investing activities 82,043 (40,280)
Cash flows from financing activities Net increase (decrease) in short-term loans payable 349,439 53,918
Increase (decrease) in commercial papers (83,400) 107,100 Proceeds from long-term loans payable 169,600 165,508 Repayment of long-term loans payable (184,573) (70,357)Proceeds from issuance of bonds 380,468 710,566 Redemption of bonds (281,524) (485,639)Cash dividends paid (7,163) (16,545)Payments of cash dividends to minority shareholders (7,902) (19,724)
Repayments to minority shareholders – (10,454)Proceeds from stock issuance to minority shareholders 70 1
Net cash provided by (used in) financing activities 335,014 434,373
Effect of exchange rate change on cash and cash equivalents 8,425 15,493
Net increase (decrease) in cash and cash equivalents 295,284 407,189 Cash and cash equivalents at beginning of period 422,521 717,806 Cash and cash equivalents at end of period 717,806 1,124,995

10
2. Notes on premise of going concern None
3. Key items forming the basis of preparation of consolidated financial statements 1. Scope of consolidation
Number of consolidated subsidiaries: 15 companies (previous year: 21 companies) Names of consolidated subsidiaries Mitsubishi UFJ Morgan Stanley Securities Co., Ltd. Mitsubishi UFJ Morgan Stanley PB Securities Co., Ltd. (Note) KOKUSAI Asset Management Co., Ltd. MUS Business Service Co., Ltd. MUS Information Systems Co., Ltd. Mitsubishi UFJ Securities International plc Mitsubishi UFJ Wealth Management Bank (Switzerland), Ltd. Mitsubishi UFJ Securities (USA), Inc. Mitsubishi UFJ Securities (HK) Holdings, Limited Mitsubishi UFJ Securities (HK), Limited Mitsubishi UFJ Securities (Singapore), Limited Ling Zheng Investment Consulting (Shanghai) Co., Ltd. TMI Nominees Limited MM Partnership Corporate Value Up Fund Investment Limited Liability Partnership (Note) Mitsubishi UFJ Morgan Stanley PB Securities Co., Ltd. has changed its trade name of
company from Mitsubishi UFJ Merrill Lynch PB Securities Co., Ltd. (Exclusion)
MUS Principal Investments Co., Ltd. MU Hands-on Capital Ltd.
The above two companies were excluded from the scope of consolidation due to an absorption-type merger with the Company.
MUS Facility Service Co., Ltd. The above company was excluded from the scope of consolidation due to an absorption-type merger with MUS Business Service Co., Ltd., a consolidated subsidiary of the Company.
MFHK Nominees Limited Hands-on No.1 Venture Capital Investment Limited Partnership Hands-on No.1-2 Venture Capital Investment Limited Partnership
The above three companies were excluded from the scope of consolidation due to completion of liquidation.

11
2. Application of equity method Two affiliates are under the equity method (previous year: three companies) Names of affiliates under equity method Morgan Stanley MUFG Securities Co., Ltd. Marunouchi Capital Co., Ltd. (Exclusion) Maybank Asset Management Singapore Pte. Ltd.
The above company was excluded from the scope of affiliates under equity method since the Company sold its shares.
3. Financial closing dates and other details of consolidated subsidiaries
The financial closing dates of consolidated subsidiaries are as follows. End of December 10 subsidiaries End of March 5 subsidiaries
Of the consolidated subsidiaries whose financial closing date differs from the consolidated financial closing date, 10 subsidiaries for which the difference in closing dates was three months or less were accounted for based on the financial statements as of the financial closing date of each subsidiary. However, necessary adjustments were made to the consolidated financial statements for any significant transactions that took place between the end of the fiscal year of each subsidiary and the end of the consolidated fiscal year.
Disclosure of the items other than above was omitted because there were no significant changes from the latest Securities Report (submitted on June 26, 2013).
4. Changes in accounting policies Application of accounting standard for retirement benefits The Company has applied the “Accounting Standard for Retirement Benefits” (ASBJ Statement No. 26, May 17, 2012) and “Guidance on Accounting Standard for Retirement Benefits” (ASBJ Guidance No. 25, May 17, 2012), except for the provisions of the main clauses of Paragraph 35 of the Accounting Standard for Retirement Benefits and Paragraph 67 of Guidance on Accounting Standard for Retirement Benefits, effective from the end of the fiscal year ended March 31, 2014. Accordingly, the Company has changed its accounting policy to one that recognizes the difference between retirement benefit obligations and plan assets as net defined benefit liability (asset) and recorded unrecognized actuarial gain or loss and unrecognized past service cost under net defined benefit liability (asset). Application of the Accounting Standard for Retirement Benefits and Guidance on Accounting Standard for Retirement Benefits is in line with the transitional measures provided in Paragraph 37 of the Accounting Standard for Retirement Benefits. In accordance with such measures, the effect of the change has been added to or deducted from remeasurements of defined benefit plans under accumulated other comprehensive income. As a result of the change, as of the end of the fiscal year ended March 31, 2014, net defined benefit asset of 2,529 million yen and net defined benefit liability of 2,539 million yen were recorded. And accumulated other comprehensive income increased by 2,391 million yen and minority interests increased by 1,604 million yen. The effect of this application on per share information is immaterial.
12
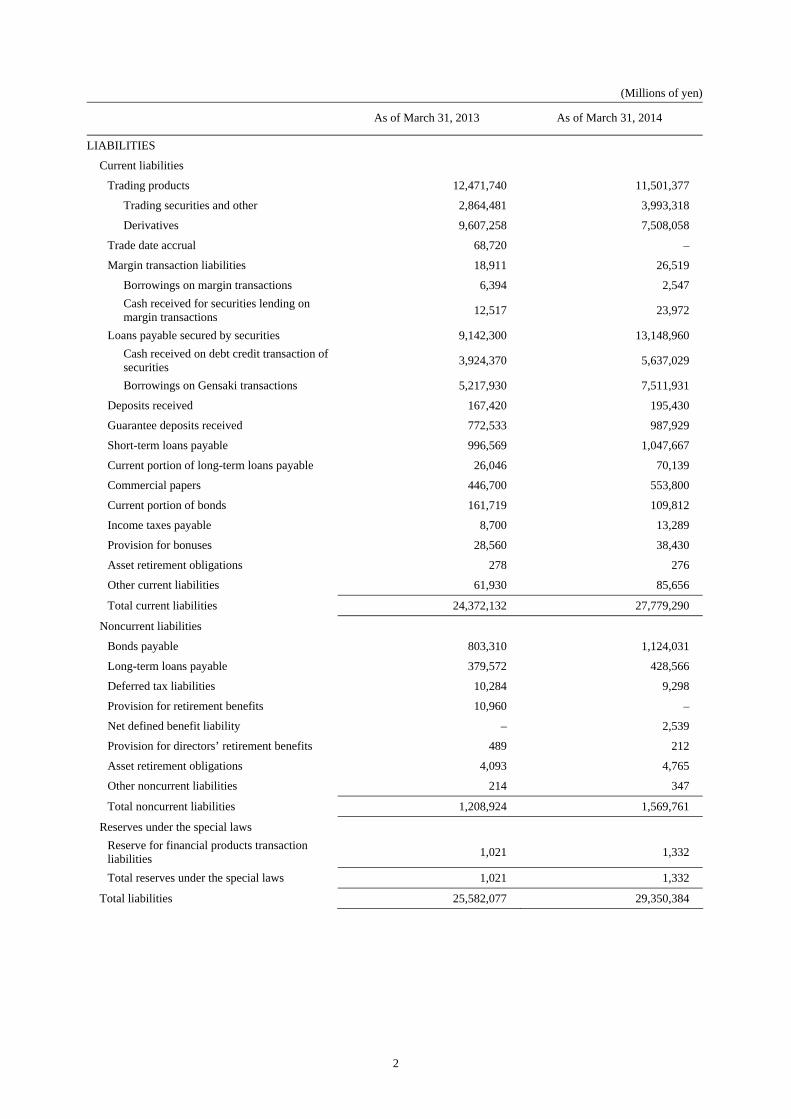
5. Notes to consolidated financial statements (Segment information) For the fiscal year ended March 31, 2014 (From April 1, 2013 to March 31, 2014)
1. Overview of reportable segments The Company and its consolidated subsidiaries (the “Group”) identify the reportable segment as a component unit that constitutes a business for which discrete financial information is available and is regularly reviewed by the Board of Directors to make decisions about the allocation of resources to the segment and assess its performance. The Group is engaged in business activities centered on financial instruments business in many areas and provides services relating to investment and financing services. While promoting cooperation among group companies under control, the Company, as a holding company of securities companies, makes decisions about the allocation of resources and assesses the performance of each group company by type of service. Therefore, the Group’s segments are distinguished by the service and the geographical area, and thus the following items are identified as reportable segments: “Securities Brokerage (Japan),” “Securities Brokerage (U.K.),” “Securities Brokerage (U.S.A.)” and “Asset Management.” “Securities Brokerage” provides customers with broader investment and financing services from both funding and investment aspects and “Asset Management” mainly provides with services of establishment and management of investment trusts targeting various assets as investments.
2. The calculation method of net operating revenue, profit or loss, assets and other items by
reportable segment Accounting policy for business segment reported is consistent with “Key items forming the basis of preparation of consolidated financial statements.” Reportable segment profit or loss is the amount based on the profit or loss after applicable taxes. Inter-segment net operating revenue and transfers are based on actual market prices.
13
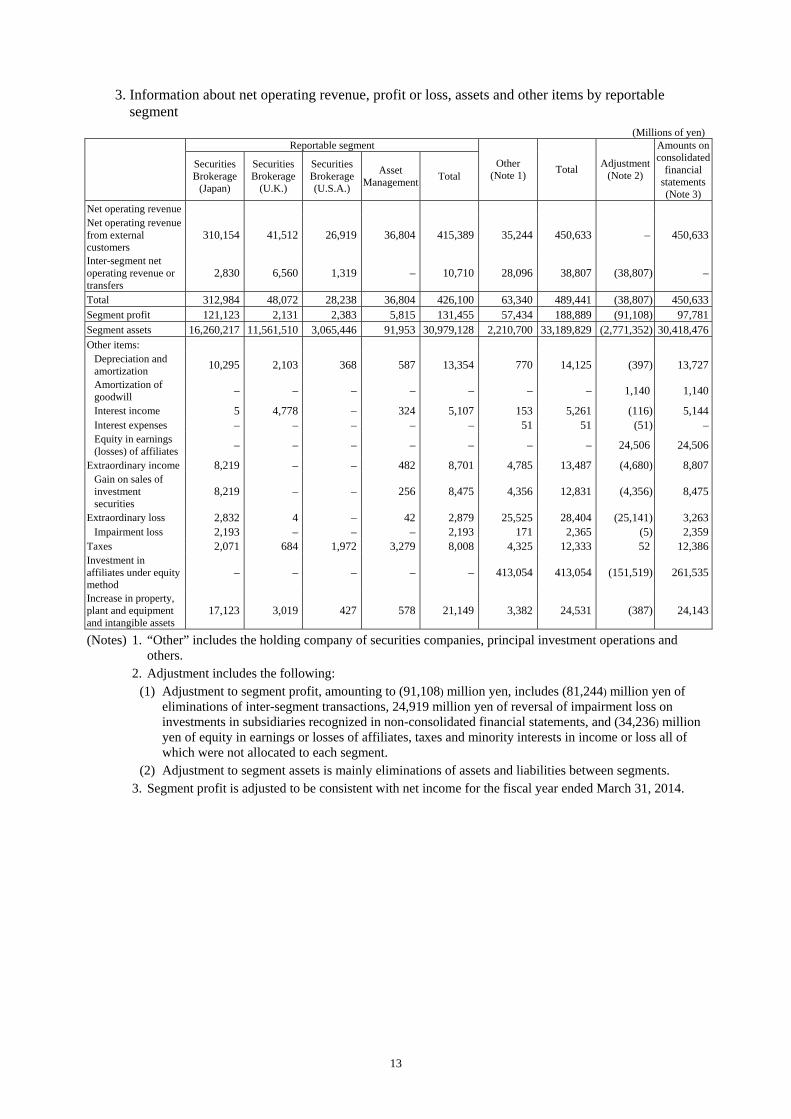
3. Information about net operating revenue, profit or loss, assets and other items by reportable segment
(Millions of yen) Reportable segment
Securities Brokerage
(Japan)
Securities Brokerage
(U.K.)
Securities Brokerage(U.S.A.)
Asset Management Total
Other (Note 1) Total Adjustment
(Note 2)
Amounts on consolidated
financial statements(Note 3)
Net operating revenue Net operating revenue from external customers
310,154 41,512 26,919 36,804 415,389 35,244 450,633 – 450,633
Inter-segment net operating revenue or transfers
2,830 6,560 1,319 – 10,710 28,096 38,807 (38,807) –
Total 312,984 48,072 28,238 36,804 426,100 63,340 489,441 (38,807) 450,633Segment profit 121,123 2,131 2,383 5,815 131,455 57,434 188,889 (91,108) 97,781Segment assets 16,260,217 11,561,510 3,065,446 91,953 30,979,128 2,210,700 33,189,829 (2,771,352) 30,418,476Other items:
Depreciation and amortization 10,295 2,103 368 587 13,354 770 14,125 (397) 13,727
Amortization of goodwill – – – – – – – 1,140 1,140
Interest income 5 4,778 – 324 5,107 153 5,261 (116) 5,144Interest expenses – – – – – 51 51 (51) –Equity in earnings (losses) of affiliates – – – – – – – 24,506 24,506
Extraordinary income 8,219 – – 482 8,701 4,785 13,487 (4,680) 8,807Gain on sales of investment securities
8,219 – – 256 8,475 4,356 12,831 (4,356) 8,475
Extraordinary loss 2,832 4 – 42 2,879 25,525 28,404 (25,141) 3,263Impairment loss 2,193 – – – 2,193 171 2,365 (5) 2,359
Taxes 2,071 684 1,972 3,279 8,008 4,325 12,333 52 12,386Investment in affiliates under equity method
– – – – – 413,054 413,054 (151,519) 261,535
Increase in property, plant and equipment and intangible assets
17,123 3,019 427 578 21,149 3,382 24,531 (387) 24,143
(Notes) 1. “Other” includes the holding company of securities companies, principal investment operations and others.
2. Adjustment includes the following: (1) Adjustment to segment profit, amounting to (91,108) million yen, includes (81,244) million yen of
eliminations of inter-segment transactions, 24,919 million yen of reversal of impairment loss on investments in subsidiaries recognized in non-consolidated financial statements, and (34,236) million yen of equity in earnings or losses of affiliates, taxes and minority interests in income or loss all of which were not allocated to each segment.
(2) Adjustment to segment assets is mainly eliminations of assets and liabilities between segments. 3. Segment profit is adjusted to be consistent with net income for the fiscal year ended March 31, 2014.

14
(Per share information)
FY2013
(From April 1, 2013 to March 31, 2014)
Net assets per share (Yen) 1,065.74
Basic net income per share (Yen) 132.68 (Notes) 1. Diluted net income per share is not presented since there were no potential shares.
2. The basis of calculation for basic net income per share is as follows. (Millions of yen)
FY2013
(From April 1, 2013 to March 31, 2014)
Net income 97,781 Net income not attributable to common stockholder –
Net income attributable to common stock 97,781 Average number of shares (Thousands of shares) 736,985
3. The basis of calculation for net assets per share is as follows.
(Millions of yen)
As of March 31, 2014
Total net assets 1,068,092
Amount to be deducted from total net assets 282,654
Minority interests 282,654 Net assets at end of year attributable to common stock 785,437
Number of common shares outstanding at end of year used to calculate net assets per share (Thousands of shares)
736,985

15
<Reference> Consolidated Financial Results
for the Fiscal Year Ended March 31, 2014 1. Commission received
(1) Breakdown by item (Millions of yen)
FY2012 (From April 1, 2012 to March 31, 2013)
FY2013 (From April 1, 2013 to March 31, 2014)
Increase (Decrease)
Commission to consignees 22,694 44,950 22,256 Stocks 22,242 44,006 21,763 Bonds 163 242 79
Commission for underwriting, secondary distribution and solicitation for selling and others for professional investors
29,233 43,207 13,973
Stocks 7,261 18,856 11,594 Bonds 21,971 24,350 2,379
Fee for offering, secondary distribution and solicitation for selling and others for professional investors
47,470 62,948 15,477
Beneficiary certificates 46,792 61,864 15,071 Other fees received 72,559 91,472 18,912
Beneficiary certificates 46,927 53,724 6,797 Total 171,957 242,578 70,620
(2) Breakdown by product
(Millions of yen) FY2012
(From April 1, 2012 to March 31, 2013)
FY2013 (From April 1, 2013 to March 31, 2014)
Increase (Decrease)
Stocks 31,624 68,757 37,133 Bonds 23,991 26,925 2,934 Beneficiary certificates 93,970 116,225 22,254 Other 22,371 30,669 8,298 Total 171,957 242,578 70,620
2. Net trading income
(Millions of yen) FY2012
(From April 1, 2012 to March 31, 2013)
FY2013 (From April 1, 2013 to March 31, 2014)
Increase (Decrease)
Stocks 8,502 64,676 56,174 Bonds 122,490 151,234 28,743 Other (23,663) (5,463) 18,200 Total 107,329 210,448 103,119

16
<Reference> Quarterly Trends in Consolidated Statements of Income
(Millions of yen)
4Q of FY2012
(January 1 to March 31, 2013)
1Q of FY2013(April 1 to
June 30, 2013)
2Q of FY2013(July 1 to
September 30, 2013)
3Q of FY2013 (October 1 to
December 31, 2013)
4Q of FY2013(January 1 to
March 31, 2014)
Operating revenue 119,164 134,808 111,276 120,817 120,894 Commission received 63,393 69,814 56,340 56,072 60,350 Commission to consignees 10,334 16,254 9,734 11,312 7,648
Stocks 10,158 16,035 9,482 11,087 7,401 Bonds 52 35 98 53 54
Commission for underwriting, secondary distribution and solicitation for selling and others for professional investors
9,762 8,867 8,543 10,521 15,273
Stocks 2,602 3,469 3,527 4,311 7,548 Bonds 7,159 5,398 5,016 6,210 7,725
Fee for offering, secondary distribution and solicitation for selling and others for professional investors
21,714 21,294 13,783 13,581 14,288
Beneficiary certificates 21,170 21,124 13,552 13,483 13,703 Other fees received 21,582 23,398 24,278 20,656 23,139
Beneficiary certificates 13,210 14,265 13,415 13,377 12,666 Net trading income 33,617 55,031 52,153 53,915 49,347 Net trading income from securities (stocks) 8,845 16,645 19,340 19,604 9,085
Net trading income from bonds 34,218 42,911 38,808 39,063 30,450 Other net trading income (9,446) (4,525) (5,995) (4,752) 9,810
Net gain on private equity and other securities (2,659) (2,000) (572) 1,661 (134)
Other net gain on goods trading 30 105 3 14 – Financial revenue 24,782 11,856 3,350 9,153 11,332
Financial expenses 12,212 8,662 7,554 8,565 12,380 Net operating revenue 106,951 126,145 103,722 112,251 108,514 Selling, general and administrative expenses 80,896 83,623 72,558 75,681 84,846
Trading related expenses 24,982 25,833 23,041 22,557 27,361 Personnel expenses 36,833 33,525 29,913 33,758 36,176 Real estate expenses 5,363 5,102 5,705 5,443 5,975 Office cost 6,840 6,902 7,708 7,649 8,650 Depreciation 3,949 3,249 3,363 3,385 3,728 Taxes and dues 617 7,308 849 863 488 Other 2,309 1,701 1,975 2,023 2,466
Operating income 26,054 42,521 31,163 36,570 23,667 Non-operating income 12,855 15,032 5,775 7,373 3,940 Non-operating expenses 1,018 487 51 1,054 1,146 Ordinary income 37,891 57,066 36,887 42,888 26,461 Extraordinary income 1,270 8,043 118 387 257 Extraordinary loss 1,930 136 402 444 2,279 Income before income taxes and minority interests 37,230 64,972 36,603 42,831 24,439
Income taxes-current 5,393 6,726 4,815 5,723 4,524 Income taxes-deferred (3,008) (1,331) (9,191) (1,731) 2,851 Total income taxes 2,384 5,395 (4,376) 3,992 7,375 Income before minority interests 34,846 59,577 40,979 38,839 17,064 Minority interests in income 15,999 20,010 17,377 15,034 6,258 Net income 18,846 39,567 23,602 23,805 10,806
17
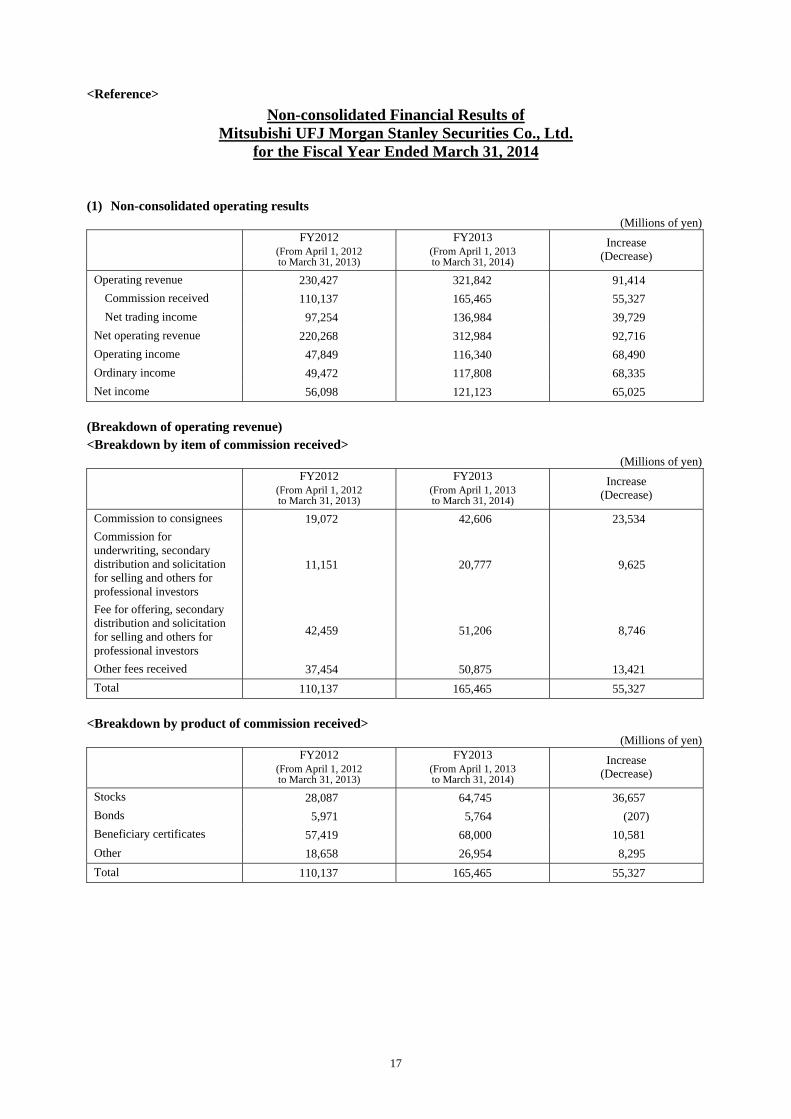
<Reference> Non-consolidated Financial Results of
Mitsubishi UFJ Morgan Stanley Securities Co., Ltd. for the Fiscal Year Ended March 31, 2014
(1) Non-consolidated operating results
(Millions of yen) FY2012
(From April 1, 2012 to March 31, 2013)
FY2013 (From April 1, 2013 to March 31, 2014)
Increase (Decrease)
Operating revenue 230,427 321,842 91,414 Commission received 110,137 165,465 55,327 Net trading income 97,254 136,984 39,729
Net operating revenue 220,268 312,984 92,716 Operating income 47,849 116,340 68,490 Ordinary income 49,472 117,808 68,335 Net income 56,098 121,123 65,025
(Breakdown of operating revenue) <Breakdown by item of commission received>
(Millions of yen) FY2012
(From April 1, 2012 to March 31, 2013)
FY2013 (From April 1, 2013 to March 31, 2014)
Increase (Decrease)
Commission to consignees 19,072 42,606 23,534 Commission for underwriting, secondary distribution and solicitation for selling and others for professional investors
11,151 20,777 9,625
Fee for offering, secondary distribution and solicitation for selling and others for professional investors
42,459 51,206 8,746
Other fees received 37,454 50,875 13,421 Total 110,137 165,465 55,327
<Breakdown by product of commission received>
(Millions of yen) FY2012
(From April 1, 2012 to March 31, 2013)
FY2013 (From April 1, 2013 to March 31, 2014)
Increase (Decrease)
Stocks 28,087 64,745 36,657 Bonds 5,971 5,764 (207) Beneficiary certificates 57,419 68,000 10,581 Other 18,658 26,954 8,295 Total 110,137 165,465 55,327

18
<Net trading income> (Millions of yen)
FY2012 (From April 1, 2012 to March 31, 2013)
FY2013 (From April 1, 2013 to March 31, 2014)
Increase (Decrease)
Stocks 19,555 48,288 28,732 Bonds 85,539 96,180 10,641 Other (7,840) (7,484) 355 Total 97,254 136,984 39,729
(2) Non-consolidated financial position
(Millions of yen) As of March 31, 2013 As of March 31, 2014 Increase
(Decrease) Total assets 14,139,614 16,260,217 2,120,602 Net assets 288,524 378,939 90,415
Note: The net capital adequacy ratio as of March 31, 2014 is 292%.


![[Overview of the consolidated financial results]...[Overview of the consolidated financial results] We posted revenue of 4,527.1 billion yen, up 2.6 billion yen from the previous year,](https://static.fdocuments.us/doc/165x107/5e2c1adca539961b0e2c7a89/overview-of-the-consolidated-financial-results-overview-of-the-consolidated.jpg)