Consolidated Balance Sheet - Welcome to Ahli United … United Bank of Kuwait PLC was incorporated...
33
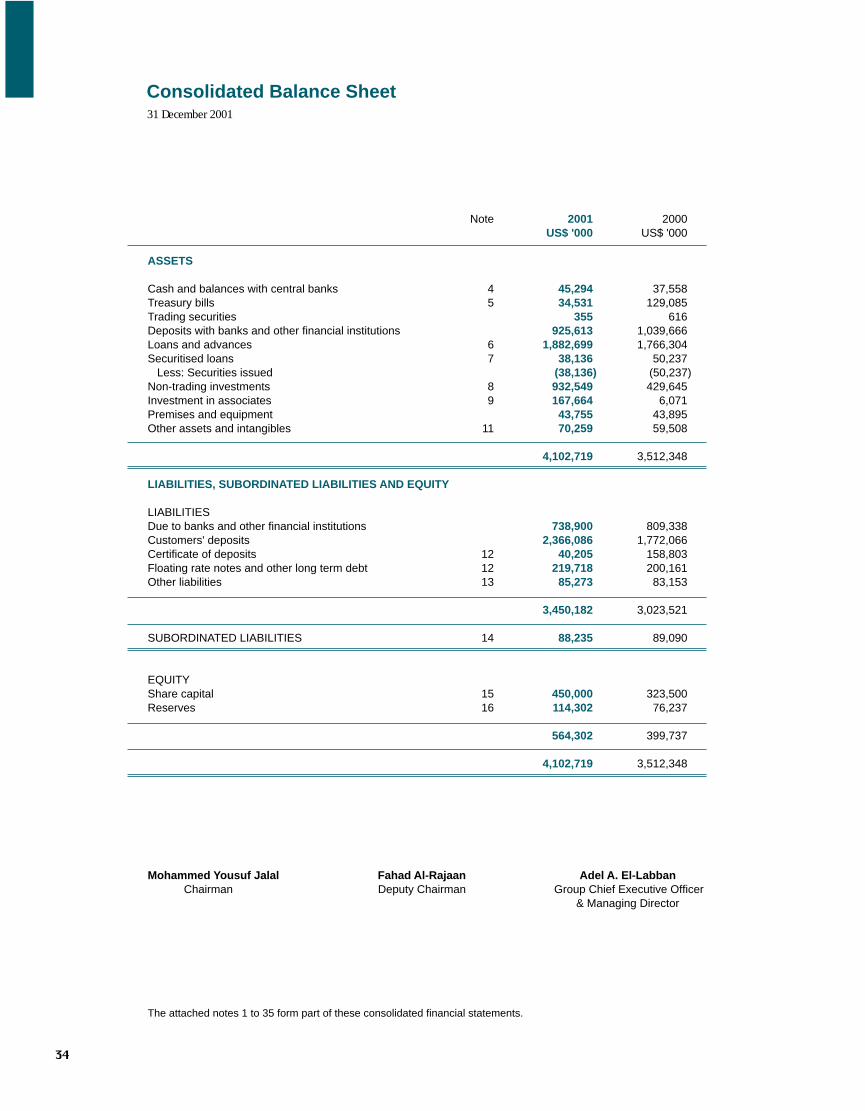
Consolidated Balance Sheet Note 2001 2000 US$ '000 US$ '000 ASSETS Cash and balances with central banks 4 45,294 37,558 Treasury bills 5 34,531 129,085 Trading securities 355 616 Deposits with banks and other financial institutions 925,613 1,039,666 Loans and advances 6 1,882,699 1,766,304 Securitised loans 7 38,136 50,237 Less: Securities issued (38,136) (50,237) Non-trading investments 8 932,549 429,645 Investment in associates 9 167,664 6,071 Premises and equipment 43,755 43,895 Other assets and intangibles 11 70,259 59,508 4,102,719 3,512,348 LIABILITIES, SUBORDINATED LIABILITIES AND EQUITY LIABILITIES Due to banks and other financial institutions 738,900 809,338 Customers' deposits 2,366,086 1,772,066 Certificate of deposits 12 40,205 158,803 Floating rate notes and other long term debt 12 219,718 200,161 Other liabilities 13 85,273 83,153 3,450,182 3,023,521 SUBORDINATED LIABILITIES 14 88,235 89,090 EQUITY Share capital 15 450,000 323,500 Reserves 16 114,302 76,237 564,302 399,737 4,102,719 3,512,348 Mohammed Yousuf Jalal Fahad Al-Rajaan Adel A. El-Labban Chairman Deputy Chairman Group Chief Executive Officer & Managing Director 31 December 2001 The attached notes 1 to 35 form part of these consolidated financial statements.
Transcript of Consolidated Balance Sheet - Welcome to Ahli United … United Bank of Kuwait PLC was incorporated...
Consolidated Balance Sheet
Note 2001 2000US$ '000 US$ '000
ASSETS
Cash and balances with central banks 4 45,294 37,558Treasury bills 5 34,531 129,085Trading securities 355 616Deposits with banks and other financial institutions 925,613 1,039,666Loans and advances 6 1,882,699 1,766,304Securitised loans 7 38,136 50,237 Less: Securities issued (38,136) (50,237)Non-trading investments 8 932,549 429,645Investment in associates 9 167,664 6,071Premises and equipment 43,755 43,895Other assets and intangibles 11 70,259 59,508
4,102,719 3,512,348
LIABILITIES, SUBORDINATED LIABILITIES AND EQUITY
LIABILITIESDue to banks and other financial institutions 738,900 809,338Customers' deposits 2,366,086 1,772,066Certificate of deposits 12 40,205 158,803Floating rate notes and other long term debt 12 219,718 200,161Other liabilities 13 85,273 83,153
3,450,182 3,023,521
SUBORDINATED LIABILITIES 14 88,235 89,090
EQUITYShare capital 15 450,000 323,500Reserves 16 114,302 76,237
564,302 399,737
4,102,719 3,512,348
Mohammed Yousuf Jalal Fahad Al-Rajaan Adel A. El-LabbanChairman Deputy Chairman Group Chief Executive Officer
& Managing Director
31 December 2001
The attached notes 1 to 35 form part of these consolidated financial statements.

Note 2001 2000US$ '000 US$ '000
OPERATING INCOME
Interest income 247,035 272,152Interest expense 160,865 196,288
Net interest income 86,170 75,864
Fees and commission - net 17 30,792 34,829Trading income 18 5,790 4,502Gain on sale of non-trading investments 14,223 15,418Share of profit from associates 6,671 1,108Other operating income 11,241 5,059
68,717 60,916
NET INTEREST AND OTHER INCOME 154,887 136,780
Provision for losses on loans and advances - net 6 17,735 11,905Provision for impairment of non-trading investments, other assets and contingencies 19 6,920 6,045
24,655 17,950
OPERATING INCOME AFTER PROVISIONS 130,232 118,830
OPERATING EXPENSESStaff expenses 38,695 35,062Depreciation and amortisation 6,635 5,486Other operating expenses 30,116 28,134
75,446 68,682
PROFIT BEFORE TAXATION 54,786 50,148Taxation 20 6,426 10,022
NET PROFIT FOR THE YEAR 48,360 40,126
Basic earnings per share (cents) 21 3.15 3.10
Weighted average number of shares outstanding (in millions) 1,537 1,294
The attached notes 1 to 35 form part of these consolidated financial statements.
Consolidated Statement of IncomeYear ended 31 December 2001
Ahli United Bank Annual Report and Accounts 2001

Consolidated Statement of Cash Flows
2001 2000US$ '000 US$ '000
OPERATING ACTIVITIES
Profit before taxation 54,786 50,148Adjustments for:
Depreciation and amortisation 6,635 5,486Gain on sale of non-trading investments (14,223) (15,418)Provision for losses on loans and advances - net 17,735 11,905Provision for impairment of non-trading investments, other assets and contingencies 6,920 6,045Share of profit from associates (6,671) (1,108)
Operating profit before changes in operating assets and liabilities 65,182 57,058Changes in:
Mandatory reserve deposits with central banks 12,761 -Trading securities 261 22,024Deposits with banks and other financial institutions 108,102 172,867Loans and advances 67,556 (26,804)Other assets 9,840 12,889Due to banks and other financial institutions (88,294) 169,188Customers' deposits 349,734 (161,616)Certificate of deposits (118,598) 125,735Other liabilities 3,834 (9,199)
Cash from operations 410,378 362,142
Tax paid (13,936) (288)
Net cash from operating activities 396,442 361,854
Year ended 31 December 2001
The attached notes 1 to 35 form part of these consolidated financial statements.

2001 2000US$ '000 US$ '000
INVESTING ACTIVITIES
Acquisition of a subsidiary (Note 10) (41,980) -Purchase of non-trading investments (704,102) (412,239)Proceeds from sale of non-trading investments 237,211 225,041Acquisition of an associate (154,922) -Proceeds from sale of associate - 52,940Redemption (purchase) of treasury bills over three months 19,401 (10,330)Purchase of premises and equipment (4,677) (5,890)Proceeds from sale of premises and equipment - 3,087Sale of treasury stock - 307
Net cash (used in) investing activities (649,069) (147,084)
FINANCING ACTIVITIES
Proceeds from issue of share capital 153,816 -Reduction of subordinated liabilities (855) (28,944)Floating rate notes and other long term debt 19,557 100,651Merger expenses (124) (2,529)Dividends (32,350) -
Net cash from financing activities 140,044 69,178
Foreign exchange translation adjustments (7,599) (17,785)
(DECREASE) INCREASE IN CASH AND CASH EQUIVALENTS (120,182) 266,163
Cash and cash equivalents at 1 January 1,043,302 777,139
CASH AND CASH EQUIVALENTS AT 31 DECEMBER (Note 22) 923,120 1,043,302
Consolidated Statement of Cash FlowsYear ended 31 December 2001
The attached notes 1 to 35 form part of these consolidated financial statements.
Ahli United Bank Annual Report and Accounts 2001

Consolidated Statement of Changes in Equity
Foreign exchange Cumulative
Share Share Capital Statutory translation Retained Proposed changes incapital premium reserve reserve adjustments earnings appropriations fair values Total
US$ '000 US$ '000 US$ '000 US$ '000 US$ '000 US$ '000 US$ '000 US$ '000 US$ '000
Issued during the year - 2000 323,500 56,118 - - - - - - 379,618Merger expenses - (2,529) - - - - - - (2,529)Movement in treasury stock in a subsidiary - - 307 - - - - - 307Net profit for the year - 2000 - - - - - 40,126 - - 40,126Foreign exchange translation adjustments - - - - (17,785) - - - (17,785)Transfer to statutory reserve - - - 4,013 - (4,013) - - -Proposed dividends - - - - - (32,350) 32,350 - -Proposed directors' remuneration - - - - - (33) 33 - -
Balance at 31 December 2000 323,500 53,589 307 4,013 (17,785) 3,730 32,383 - 399,737
Transition adjustment on adoption of IAS 39 - - - - - 4,482 - - 4,482Dividends and other appropriations paid - - - - - - (32,383) - (32,383)Merger expenses - (124) - - - - - - (124)Issue of share capital (Note 15) 126,500 27,316 - - - - - - 153,816Net profit for the year - 2001 - - - - - 48,360 - - 48,360Net gain on sale of available-for-sale investments (previously included in retained earnings on adoption of IAS 39) - - - - - (7,340) - - (7,340)Foreign exchange translation adjustments - - - - (7,599) - - - (7,599)Net fair value movements during the year - - - - - - - 5,353 5,353Transfer to statutory reserve - - - 4,836 - (4,836) - - -Proposed dividends - - - - - (41,400) 41,400 - -Proposed directors' remuneration - - - - - (210) 210 - -
Balance at 31 December 2001 450,000 80,781 307 8,849 (25,384) 2,786 41,610 5,353 564,302
The movements in foreign exchange translation adjustments represent losses arising from translating the net investment in a subsidiary into US dollars.
Year ended 31 December 2001
The attached notes 1 to 35 form part of these consolidated financial statements.

1 ACTIVITIES
The consolidated financial statements of Ahli United Bank B.S.C. for the year ended 31 December 2001 wereauthorised for issue in accordance with a resolution of the Board of Directors on 12 February 2002.
The parent company, Ahli United Bank B.S.C. (the 'Bank') was incorporated in the State of Bahrain on 31 May2000 originally as a closed company and changed on 12 July 2000 to a public shareholding company by AmiriDecree no. 16/2000, and carries out commercial and investment banking business, global fund management andprivate banking services through its subsidiaries. The Bank operates under an offshore banking unit licence issuedby the Bahrain Monetary Agency. The registered office of Ahli United Bank B.S.C. is located at 120 GovernmentAvenue, P.O. Box 2424, Manama, Bahrain.
The Bank, effective 1 January 2000, combined the businesses of Ahli United Bank (Bahrain) B.S.C. (c) [formerlyknown as Al-Ahli Commercial Bank B.S.C. (c)], a bank incorporated in the State of Bahrain, and The United Bankof Kuwait PLC, a bank incorporated in the United Kingdom. The combination was formally completed on 30 July2000 when shares in Ahli United Bank B.S.C. were distributed to the shareholders of the combining banks.
Ahli United Bank Bahrain B.S.C. (c) [formerly known as Al-Ahli Commercial Bank B.S.C. (c)] was incorporated inthe State of Bahrain in 1977 as a public shareholding company and on 2 August 2000 changed its legal statusto a closed shareholding company. The bank operates under a commercial banking licence issued by the BahrainMonetary Agency.
The United Bank of Kuwait PLC was incorporated in the United Kingdom in 1966 as a public shareholding companyand is an authorised institution under the U.K. Banking Act 1987. The Bank undertakes international commercialand investment banking business.
The number of staff employed by the Group as of 31 December 2001 was 503 (31 December 2000: 478).
2 BASIS OF CONSOLIDATION
The consolidated financial statements comprise the financial statements of Ahli United Bank B.S.C. and itssubsidiaries (the 'Group'). All material inter-group balances and transactions, including material unrealised gainsand losses on transactions, between Group companies have been eliminated on consolidation.
3 SIGNIFICANT ACCOUNTING POLICIES
Basis of preparationThe consolidated financial statements of Ahli United Bank B.S.C. are prepared in conformity with the BahrainCommercial Companies Law and the Bahrain Monetary Agency Law and in accordance with International AccountingStandards issued by the International Accounting Standards Committee (IASC), and interpretations issued by theStanding Interpretations Committee of the IASC.
The significant accounting policies adopted are as follows:
Accounting conventionThe consolidated financial statements are prepared under the historical cost convention as modified for themeasurement at fair value of derivatives, trading securities and investments 'available-for-sale'. In addition, asmore fully discussed below, assets and liabilities that are hedged are adjusted to the extent of the fair value ofthe risk being hedged.
The financial statements are presented in US dollars being the currency in which the share capital of the Bank isdenominated.
Change in accounting policiesThe Group has adopted International Accounting Standard (IAS) 39 "Financial Instruments: Recognition andMeasurement" with effect from 1 January 2001. This has resulted in significant changes in the accounting policiesof the Group with respect to recognition and measurement of financial instruments. In accordance with thetransitional provisions of this Standard, the Group has accounted for the changes in policies witheffect from 1 January 2001 and has not restated comparatives. The major changes are as follows:
31 December 2001
Notes to the Consolidated Financial Statements
Notes to the Consolidated Financial Statements31 December 2001
3 SIGNIFICANT ACCOUNTING POLICIES (continued)
Change in accounting policies (continued)
InvestmentsPreviously, the Group carried all non-trading investments at amortised cost, less provision for impairment. TheGroup has reclassified such investments as either "available-for-sale" or "originated by the Group". Those classifiedas available-for-sale have been remeasured at fair value with the resultant gain or loss taken to retained earningson 1 January 2001. Subsequent unrealised gains and losses are reported as a separate component of equity.On sale the cumulative gains or losses are recycled through the consolidated statement of income.
DerivativesAs at the beginning of the financial year, the Group has recognised for the first time the fair value of all derivativesin its consolidated balance sheet as either assets or liabilities at their fair values. Any gains or losses (net ofadjustments to related assets or liabilities) on fair value hedges at 31 December 2000, as well as those that did notmeet the criteria for hedge accounting were adjusted against the balance of retained earnings at1 January 2001.
Provision for impairment of financial assetsThe calculation of impairment provisions for loans and advances and other financial assets is now based on thenet present value of anticipated future cash flows discounted at original interest rates. Previously future recoverieswere not discounted. The difference arising from recalculating impairment based on the net present value of futurecash flows has been taken to retained earnings at 1 January 2001. On impaired loans, interest income is nowrecognised based on the rate of interest which was used to discount the future cash flows for the purpose ofmeasuring impairment.
Effect of the changes in accounting policiesThe adoption of the Standard has resulted in a credit adjustment to retained earnings at 1 January 2001 ofUS$ 4,482 thousand.
Trading securitiesTrading securities are carried at fair value with any gains or losses arising from a change in fair value being includedin the consolidated statement of income in the period in which it arises.
Deposits with banks and other financial institutionsDeposits with banks and other financial institutions are stated net of amounts written off and provision for impairment.
Loans and advancesLoans and advances are stated at cost less any amounts written off and provision for impairment. The carryingvalues of loans that are being effectively hedged for changes in fair value are adjusted to the extent of the changesin fair value being hedged. Resultant gains or losses are recognised in the consolidated statement of income.
Non-trading investmentsThese are classified as either available-for-sale or originated by the Group. All investments are initially recognisedat cost, being the fair value of the consideration given including acquisition costs associated with the investment.Premiums and discounts are amortised on a systematic basis to maturity using the effective interest method andtaken to interest income.
Available-for-saleAfter initial recognition, available-for-sale investments are remeasured at fair value. Unless unrealised gains andlosses on remeasurement to fair value are part of an effective hedging relationship, they are reported as a separatecomponent of equity until the investment is sold, collected or otherwise disposed of, or the investment is determinedto be impaired, at which time the cumulative gain or loss previously reported in equity is included in the consolidatedstatement of income for the period.
Any gain or loss arising from a change in fair value of available-for-sale investments, which are part of an effectivehedging relationship, is recognised directly in the consolidated statement of income to the extent of the changesin fair value being hedged.
Originated by the GroupInvestments in debt securities which are funded directly to the issuer are stated at cost less provision for impairment.An adjustment is made to such investments where effective fair value hedges have been made to adjust the valueof the investment for the fair value being hedged with the resultant gains or losses being recognised in theconsolidated statement of income.

31 December 2001
Notes to the Consolidated Financial Statements
3 SIGNIFICANT ACCOUNTING POLICIES (continued)
Investment in associatesAssociated companies are companies in which the Group has a long-term interest of between 20% and 50% inthe voting capital or over which it exerts significant influence. Investments in associated companies are accountedfor using the equity method.
Fair valuesFor investments actively traded in organised financial markets, fair value is determined by reference to quotedmarket bid prices at the close of business on the balance sheet date.
The fair value of interest-bearing financial assets and liabilities is estimated based on discounted cash flows usingcurrent market rates for financial instruments with similar terms and risk characteristics.
For investments where there is no quoted market price, a reasonable estimate of the fair value is determined byreference to the current market value of another instrument which is substantially the same, or is based on thenet present value of future cash flows.
The fair value of over-the-counter option is determined by option pricing models.
GoodwillGoodwill, representing the excess of the cost of an acquisition over the fair value of the Group's share of identifiablenet assets of a subsidiary or an associate at the date of acquisition, is amortised using the straight-line methodover its estimated useful life. At each balance sheet date, goodwill is reviewed for impairment.
Premises and equipmentPremises and equipment is stated at cost, less accumulated depreciation.
The cost of freehold land is not depreciated. Depreciation on other premises and equipment is provided on astraight-line basis over their estimated useful lives.
The estimated useful lives of the assets for the calculation of depreciation are as follows:
Freehold buildings 15 to 20 yearsLeasehold buildings Over the period of leaseOther premises and equipment 2 to 6 years
Collateral pending saleThe Group occasionally acquires real estate in settlement of certain loans and advances. Real estate is statedat the lower of the net realisable value of the related loans and advances and the current fair value of suchassets. Gains or losses on disposal, and unrealised losses on revaluation, are recognised in the consolidatedstatement of income.
DepositsAll money market and customer deposits are carried at amortised cost, less amounts repaid.
LiabilitiesLiabilities that are held for trading are subsequently remeasured at fair value and any gain or loss arising from achange in fair value is included in the consolidated statement of income in the period in which it arises.
TaxationThere is no tax on corporate income in the State of Bahrain. Taxation on income from foreign entities is providedin accordance with the fiscal regulations of the countries in which the respective Group entities operate.
Deferred taxation is provided using the liability method on all temporary differences calculated at the rate at whichit is expected to be payable. Deferred tax assets are only recognised if recovery is probable.
Notes to the Consolidated Financial Statements31 December 2001
3 SIGNIFICANT ACCOUNTING POLICIES (continued)
Employee Benefits
Pension schemeThe United Bank of Kuwait PLC operates a defined benefits scheme for employees who joined prior to 1 March2001. The pension costs for the scheme are recognised on a systematic basis so that the costs of providingretirement benefits to employees are evenly matched, so far as possible, to the service lives of the employeesconcerned. Any excess or deficency of the actuarial value of assets over the actuarial value of liabilities of thepension scheme is allocated over the average remaining service lives of the scheme members.
Defined contribution plansThe Bahraini employees of the parent and its subsidiary Ahli United Bank (Bahrain) B.S.C. (c) are covered underthe General Organisation of Social Insurance Scheme (GOSI) and the Group’s obligations are limited to the amountscontributed to the Scheme.
The United Bank of Kuwait PLC employees who joined after 28 February 2001 are not covered by the earlierpension scheme but are subject to a defined contribution scheme, the costs of which are recognised in the periodto which they relate.
Other defined benefit planIn accordance with the Bahrain Labour law the parent and its subsidiary Ahli United Bank (Bahrain) B.S.C. (c)provide for end of service benefits for its non-Bahraini employees. The provision is based on accumulated periodsof service and estimated salary at the time of leaving. Although the expected costs of these benefits are accruedover the period of employment they are only paid to employees on completion of their term of employment. Gainsand losses arising on actuarial computation of the end of service benefits are recognised and where material, areamortised over the expected average employment periods of the employees concerned.
ProvisionsProvisions are recognised when the Group has a present obligation arising from a past event, and costs to settlethe obligation are both probable and able to be reliably estimated.
DerivativesThe Group enters into derivative instruments including futures, forwards, swaps and options in the foreign exchangeand capital markets. Derivatives are stated at fair value. The fair value of a derivative is the equivalent of theunrealised gain or loss from marking to market the derivative at prevailing market rates. Derivatives with positivemarket values (unrealised gains) are included in other assets and derivatives with negative market values (unrealisedlosses) are included in other liabilities in the consolidated balance sheet.
For the purposes of hedge accounting, hedges are classified into two categories: (a) fair value hedges which hedgethe exposure to changes in the fair value of a recognised asset or liability; and (b) cash flow hedges which hedgeexposure to variability in cash flows that is attributable to a particular risk associated with a recognised asset orliability or a forecasted transaction.
In relation to fair value hedges which meet the conditions for hedge accounting, any gain or loss from remeasuringthe hedging instrument to fair value is recognised immediately in the consolidated statement of income. The hedgeditem is adjusted for fair value changes relating to the risk being hedged and the difference is recognised in theconsolidated statement of income.
In relation to cash flow hedges which meet the conditions for hedge accounting, the portion of the gain or loss inthe hedging instrument which is determined to be an effective hedge is recognised initially in equity. The gains orlosses on effective cash flow hedges recognised initially in equity are either transferred to the consolidated statementof income in the period in which the hedged transaction impacts the consolidated statement of income or includedin the initial measurement of the related asset or liability.
31 December 2001
Notes to the Consolidated Financial Statements
3 SIGNIFICANT ACCOUNTING POLICIES (continued)
Derivatives (continued)
For hedges which do not qualify for hedge accounting, any gains or losses arising from changes in the fair valueof the hedging instrument are taken directly to the consolidated statement of income for the period.
Hedge accounting is discontinued when the hedging instrument expires or is sold, terminated or exercised, or nolonger qualifies for hedge accounting. In the case of fair value hedges of interest-bearing financial instrumentsany adjustment relating to the hedged item is amortised over the remaining term to maturity. In the case of cashflow hedges, the cumulative gain or loss on the hedging instrument recognised in equity remains in equity untilthe forecasted transaction occurs, unless the hedged transaction is no longer expected to occur, in which casethe net cumulative gain or loss recognised in equity is transferred to the consolidated statement of income forthe period.
Fiduciary assetsAssets held in trust or in a fiduciary capacity are not treated as assets of the Group and, accordingly, are notincorporated in the consolidated balance sheet.
OffsettingFinancial assets and financial liabilities are only offset and the net amount reported in the consolidated balancesheet when there is a legally enforceable right to set off the recognised amounts and the Group intends to settleon a net basis.
Revenue recognitionInterest income is recognised on a time proportion basis, taking account of the principal outstanding and the rateapplicable. Loan interest that is 90 days or more overdue is excluded from income. Notional interest is recognisedon impaired loans and advances and other financial assets based on the rate used to discount future cash flowsto their net present values.
Fees and commission income are recognised when earned. Dividend income is recognised when the right toreceive payment is established.
Foreign currenciesMonetary assets and liabilities in foreign currencies are re-translated into US dollars at the rates of exchangeprevailing at the balance sheet date. Any gains or losses are taken to the consolidated statement of income.
The assets and liabilities of foreign entities are translated into US dollars at the rates of exchange prevailing atthe balance sheet date. Income and expense items are translated at average exchange rates prevailing for theperiod. Any exchange differences (including those which hedge such investments) are taken directly to a 'foreignexchange translation adjustments' which forms part of equity.
3 SIGNIFICANT ACCOUNTING POLICIES (continued)
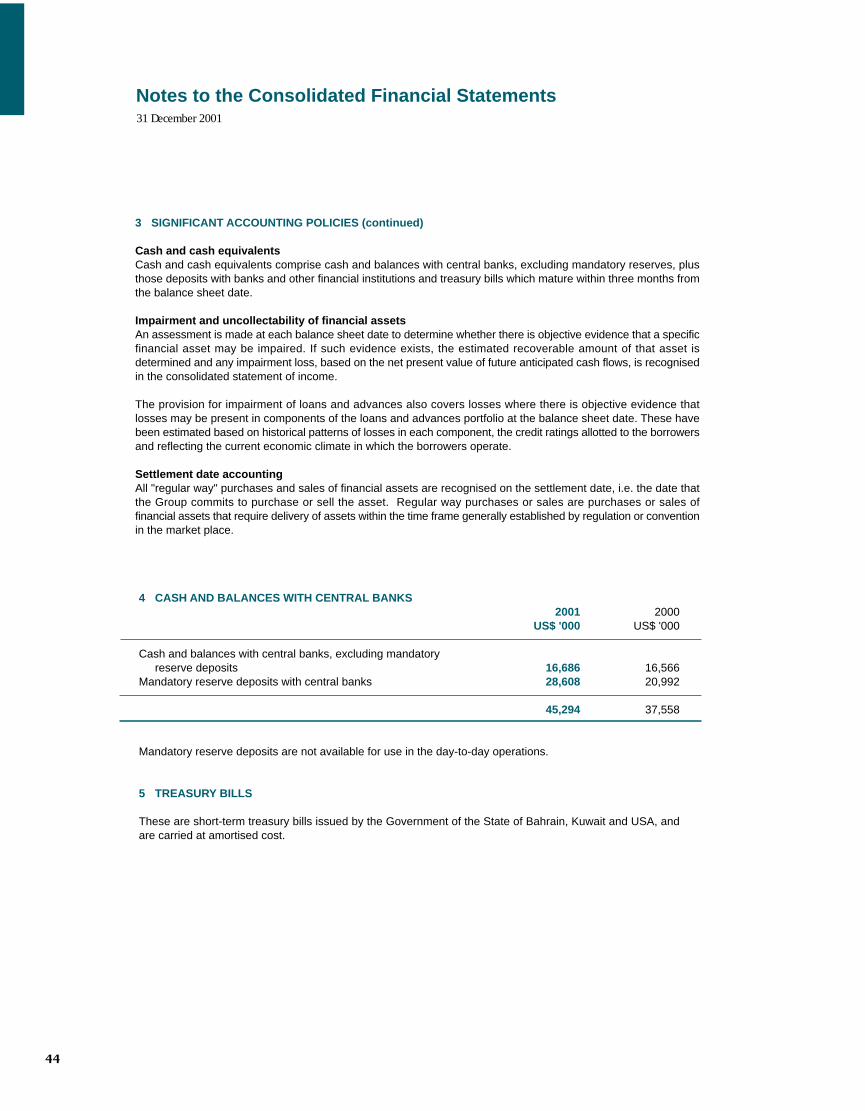
Cash and cash equivalentsCash and cash equivalents comprise cash and balances with central banks, excluding mandatory reserves, plusthose deposits with banks and other financial institutions and treasury bills which mature within three months fromthe balance sheet date.
Impairment and uncollectability of financial assetsAn assessment is made at each balance sheet date to determine whether there is objective evidence that a specificfinancial asset may be impaired. If such evidence exists, the estimated recoverable amount of that asset isdetermined and any impairment loss, based on the net present value of future anticipated cash flows, is recognisedin the consolidated statement of income.
The provision for impairment of loans and advances also covers losses where there is objective evidence thatlosses may be present in components of the loans and advances portfolio at the balance sheet date. These havebeen estimated based on historical patterns of losses in each component, the credit ratings allotted to the borrowersand reflecting the current economic climate in which the borrowers operate.
Settlement date accountingAll "regular way" purchases and sales of financial assets are recognised on the settlement date, i.e. the date thatthe Group commits to purchase or sell the asset. Regular way purchases or sales are purchases or sales offinancial assets that require delivery of assets within the time frame generally established by regulation or conventionin the market place.
Notes to the Consolidated Financial Statements31 December 2001
4 CASH AND BALANCES WITH CENTRAL BANKS2001 2000
US$ '000 US$ '000
Cash and balances with central banks, excluding mandatoryreserve deposits 16,686 16,566
Mandatory reserve deposits with central banks 28,608 20,992
45,294 37,558
Mandatory reserve deposits are not available for use in the day-to-day operations.
5 TREASURY BILLS
These are short-term treasury bills issued by the Government of the State of Bahrain, Kuwait and USA, andare carried at amortised cost.

Notes to the Consolidated Financial Statements31 December 2001
6 LOANS AND ADVANCES
The composition of the loans and advances portfolio, net of provisions, is as follows:
2001 2000Industry sector US$ '000 US$ '000
Trading and manufacturing 399,247 278,294Construction and real estate 615,140 610,043Government/public sector 4,647 8,048Banks and other financial institutions 160,684 108,414Others 817,928 852,412
1,997,646 1,857,211Less: Provisions (114,947) (90,907)
1,882,699 1,766,304
Geographic region
Middle East 772,912 630,750United States of America 98,408 197,498United Kingdom 731,309 527,654South America - 17,225Europe 166,145 226,863Asia 64,881 90,189Others 163,991 167,032
1,997,646 1,857,211Less: Provisions (114,947) (90,907)
1,882,699 1,766,304
The movements in provisions during the year were as follows:
2001 2000US$ '000 US$ '000
At 1 January 90,907 90,892Adjustment arising from the application of IAS 39 2,897 -Arising from acquisition of a subsidiary 13,549 -Amounts written off during the year (17,690) (15,014)Charge for the year 21,072 17,603Recoveries (3,337) (5,698)Interest suspended during the year 7,935 5,673Exchange rate adjustments/ other (386) (2,549)
At 31 December 114,947 90,907
At 31 December 2001 loans and advances on which interest is not being accrued, amounted to US$ 153,698thousand (2000: US$ 125,762 thousand).
Notes to the Consolidated Financial Statements31 December 2001
7 SECURITISED LOANS
During 1997, The United Bank of Kuwait PLC (UBK), a subsidiary, sold GBP 118 million of commercial loanssecured on UK investment properties, to a special purpose securitisation vehicle, ACRES (No. 3) PLC.
The special purpose securitisation vehicle is a wholly owned subsidiary of ACRES Holdings Limited whose sharesare held by Bankers Trust Limited on a discretionary trust for a charitable institution.
The special purpose securitisation vehicle paid for the loans through the issue of floating rate notes (the notes).The notes are solely the obligation of the securitisation vehicle. The noteholders and UBK have agreed that thenotes will be repaid only out of the proceeds of the loan portfolio, with no recourse to UBK in the event of any non-payment of principal or interest or other losses that may arise.
UBK advanced a subordinated loan of GBP 6 million to ACRES (No. 3) PLC for start up expenses and to establisha first loss fund. During 1997, UBK sold this subordinated loan to HECTARES (No.1) LIMITED, another specialpurpose vehicle wholly owned by ACRES Holdings Limited. HECTARES (No.1) LIMITED paid for the subordinatedloan through the issue of transferable loan certificates. UBK purchased GBP 4,014,000 of these transferable loancertificates and these have been included in the consolidated balance sheet.
All capital repayments on the loans are used to make capital repayments on the notes or transferable loancertificates, as appropriate. UBK has entered into interest rate swap agreements in connection with the securitisation,on arms length market related terms, to restore its interest hedge position in the light of the inclusion of certainfixed rate loans in the loan sales.
The loans purchased by ACRES (No. 3) PLC and HECTARES (No. 1) LIMITED are held on trust for the companiesby individual receivable trusts. Under the terms of the trusts, UBK is entitled to benefit from the excess of interestreceived on the loans over and above the amount required by the companies to satisfy their obligations to payinterest on the notes and other costs.

Notes to the Consolidated Financial Statements31 December 2001
8 NON-TRADING INVESTMENTS 2001
Available- Originated by Totalfor-sale the Group Total 2000
US$ '000 US$ '000 US$ '000 US$ '000
Quoted investmentsGovernment bonds and debt securities 64,607 1,746 66,353 40,597Floating rate notes and certificate of deposits:
- issued by banks and other financial institutions - 272,215 272,215 183,130 - issued by corporate bodies 327,753 17,451 345,204 29,456Equity shares 33,514 - 33,514 9,929
425,874 291,412 717,286 263,112
Unquoted investmentsGovernment bonds and debt securities 65,898 - 65,898 48,797Floating rate notes and certificate of deposits:
- issued by banks and other financial institutions - 59,476 59,476 74,200- issued by quasi government institutions - - - 3,501- issued by corporate bodies 45,090 10,743 55,833 6,417
Equity shares 3,156 - 3,156 3,236Other investments 36,671 - 36,671 38,709
150,815 70,219 221,034 174,860
Total 576,689 361,631 938,320 437,972
Less: Provisions for impairment - (5,771) (5,771) (8,327)
576,689 355,860 932,549 429,645
Included under available-for-sale investments are unquoted equity investments carried at a cost of US$ 3,342thousand due to the unpredictability of future cash flows and lack of suitable other methods for arriving at areliable fair value.
9 INVESTMENT IN SUBSIDIARIES AND ASSOCIATES
Name Country of Percentageincorporation holding
a) Principal subsidiariesAhli United Bank (Bahrain) B.S.C. (c) [Formerly known as Al-Ahli Commercial Bank B.S.C. (c)] State of Bahrain 100%The United Bank of Kuwait PLC United Kingdom 100%
b) Principal associatesBank of Kuwait and Middle East K.S.C. State of Kuwait 18%Man-Ahli Investment Bank E.C. State of Bahrain 50%
During the year the Bank acquired a 18% interest in Bank of Kuwait and Middle East K.S.C. (BKME), a Kuwaitbased commercial bank.

Notes to the Consolidated Financial Statements31 December 2001
10 ACQUISITION OF A SUBSIDIARY
The Group acquired 100% of the share capital of Commercial Bank of Bahrain B.S.C. (c) [CBB], a Bahrainbased commercial bank, with effect from 1 January 2001. The acquisition resulted in an additional net profitof US$ 2,586 thousand to the Group for the period 1 January 2001 to 30 September 2001. On 1 October2001 the operations were combined with those of Ahli United Bank (Bahrain) B.S.C. (c) and CBBbecame dormant.
The details of assets and liabilities acquired and goodwill arising are as follows:
US$ '000
Cash and balances with the Central Bank 20,377Treasury bills 6,498Deposits with banks and other financial institutions 32,700Loans and advances 203,803Non-trading investments 23,098Premises and equipment 1,347Other assets 2,206Due to banks and other financial institutions (17,856)Customers' deposits (244,286)Other liabilities (4,763)Goodwill 18,856
Total acquisition costs 41,980
Represented by:Purchase consideration 37,941Acquisition expenses 4,039
41,980
The purchase consideration was satisfied by payment of cash.
Goodwill:Arising on acquisition of a subsidiary 18,856Amortisation charge for the year (471)
18,385
Given that there is barrier to entry to commercial banking in Bahrain and the fact that Commercial Bank ofBahrain B.S.C. (c) was a strategic acquisition, goodwill is being amortised over a period of 40 years.
11 OTHER ASSETS AND INTANGIBLES2001 2000
US$ '000 US$ '000
Interest receivable 25,734 23,718Goodwill 18,385 -Positive fair value of derivatives (Note 26) 2,861 680Others 23,279 35,110
70,259 59,508

Notes to the Consolidated Financial Statements31 December 2001
12 CERTIFICATE OF DEPOSITS, FLOATING RATE NOTES AND OTHER LONG TERM DEBT
2001 2000Maturity US$ '000 US$ '000
Certificate of Deposits 2002 40,205 158,803
Floating rate notes 2002 - 2004 199,718 200,161Other long term debt
Term finance 2002 20,000 -
219,718 200,161
Floating rate notes are unsecured with interest payable semi-annually.
13 OTHER LIABILITIES2001 2000
US$ '000 US$ '000
Interest payable 25,641 27,061Negative fair value of derivatives (Note 26) 6,443 2,256Others 53,189 53,836
85,273 83,153
14 SUBORDINATED LIABILITIES
These borrowings are subordinated to the claims of all other creditors of the subsidiary, The United Bank ofKuwait PLC.
2001 2000US$ '000 US$ '000
(a) The United Bank of Kuwait PLC
Kuwaiti Dinars - interest at six months effective KIBID, repayable 2005 9,982 10,056US Dollars - interest at three months LIBOR plus 3/4%, repayable 2007 32,729 32,802
(b) UBK Finance BV
Great Britain Pounds - interest at six months LIBOR plus 3/4%, repayable 2006 10,213 -US Dollars - interest at three months LIBOR plus 3/4%, repayable 2006 9,923 -Great Britain Pounds - interest at six months LIBOR plus 3/4%, repayable 2005
(The loan stock is redeemable by holders giving notice of 5 years andone day. None of the holders have exercised their rights) 11,420 22,276
US Dollars - interest at three months LIBOR plus 3/4%(The loan stock is redeemable by holders giving notice of 5 years andone day. None of the holders have exercised their rights) 11,099 21,068
Kuwaiti Dinars - interest at six months KIBID, repayable 2005 2,869 2,888
TOTAL 88,235 89,090

Notes to the Consolidated Financial Statements31 December 2001
15 SHARE CAPITAL2001 2000
US$ '000 US$ '000
Authorised:
4,000 million shares of US$ 0.25 each 1,000,000 1,000,000
Issued and fully paid:
1,800 million shares (31 December 2000 : 1,294 million shares)of US$ 0.25 each 450,000 323,500
On 31 May 2000 Ahli United Bank B.S.C. was incorporated with an initial capital of Bahraini Dinars 7.56 million(equivalent to US$ 20 million). On 30 July 2000 the initial capital in Bahraini Dinars was converted into 80million ordinary shares of US$ 0.25 each, and a further 1,214 million shares of US$ 0.25 each was issuedto the shareholders of the subsidiary banks.
Pursuant to a resolution adopted by the shareholders, the Bank issued 506 million equity shares of US$ 0.25each at a premium on 10 July 2001.
16 RESERVES
a) Share premiumDuring the year the Bank increased its issued share capital at a premium of US$ 27,427 thousand, net ofretrocession. Additional merger expenses of US$ 124 thousand and share issue expenses of US$ 111 thousandhave been charged against the share premium.
b) Capital reserveAs required by the Bahrain Commercial Companies Law, any profit on sale of premises and equipment oron sale of treasury stock is transferred to capital reserve.
c) Statutory reserveAs required by the Bahrain Commercial Companies Law and the Bank's articles of association, 10% of theconsolidated net profit for the year has been transferred to a statutory reserve. The Bank may resolve todiscontinue such transfers when the reserve totals 25% of the paid up capital. The reserve is not distributableexcept in such circumstances as stipulated in the Bahrain Commercial Companies Law and following theapproval of the Bahrain Monetary Agency.
d) Proposed dividendThe directors have proposed a cash dividend of US$ 41,400 thousand being US 2.3 cents per share, whichwill be submitted for formal approval at the Annual General Meeting.
17 FEES AND COMMISSION - NET2001 2000
US$ '000 US$ '000
Fee and commission income 31,894 34,829Fee and commission expense (1,102) -
30,792 34,829
Notes to the Consolidated Financial Statements31 December 2001
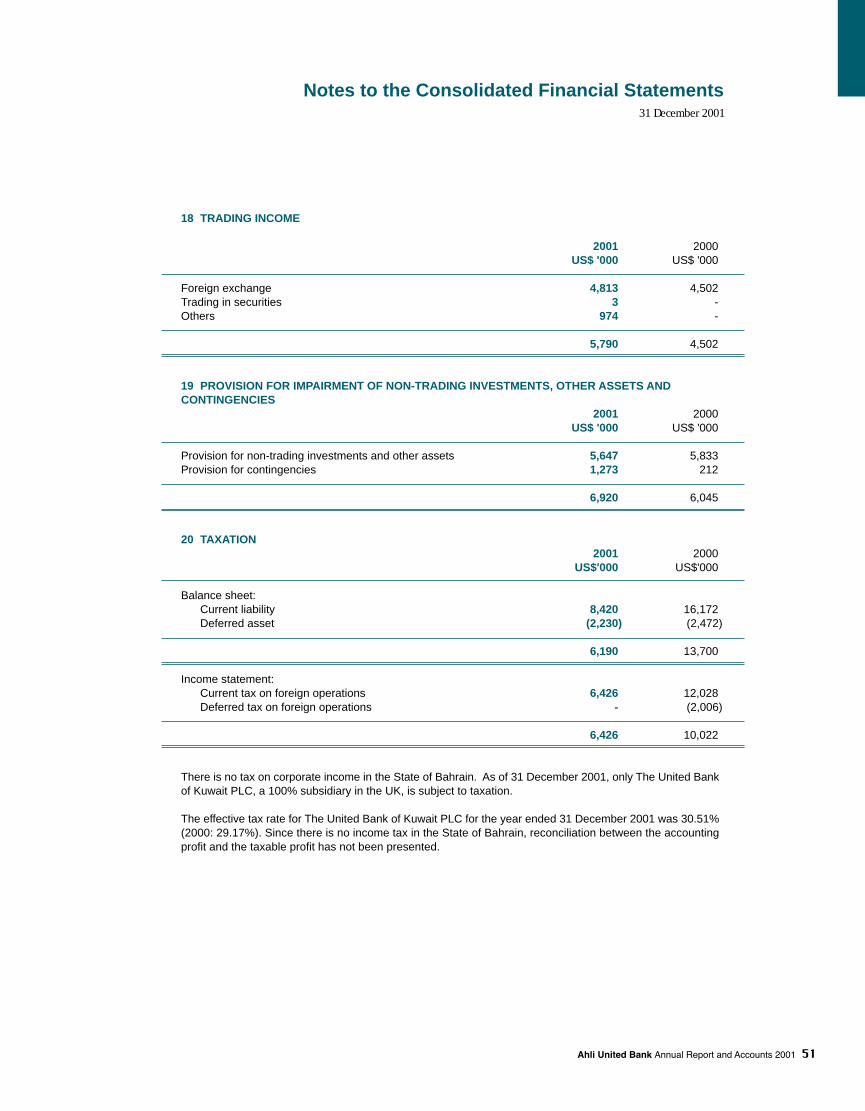
18 TRADING INCOME
2001 2000US$ '000 US$ '000
Foreign exchange 4,813 4,502Trading in securities 3 -Others 974 -
5,790 4,502
19 PROVISION FOR IMPAIRMENT OF NON-TRADING INVESTMENTS, OTHER ASSETS AND CONTINGENCIES
2001 2000US$ '000 US$ '000
Provision for non-trading investments and other assets 5,647 5,833Provision for contingencies 1,273 212
6,920 6,045
20 TAXATION2001 2000
US$'000 US$'000
Balance sheet: Current liability 8,420 16,172Deferred asset (2,230) (2,472)
6,190 13,700
Income statement:Current tax on foreign operations 6,426 12,028Deferred tax on foreign operations - (2,006)
6,426 10,022
There is no tax on corporate income in the State of Bahrain. As of 31 December 2001, only The United Bankof Kuwait PLC, a 100% subsidiary in the UK, is subject to taxation.
The effective tax rate for The United Bank of Kuwait PLC for the year ended 31 December 2001 was 30.51%(2000: 29.17%). Since there is no income tax in the State of Bahrain, reconciliation between the accountingprofit and the taxable profit has not been presented.
Notes to the Consolidated Financial Statements31 December 2001
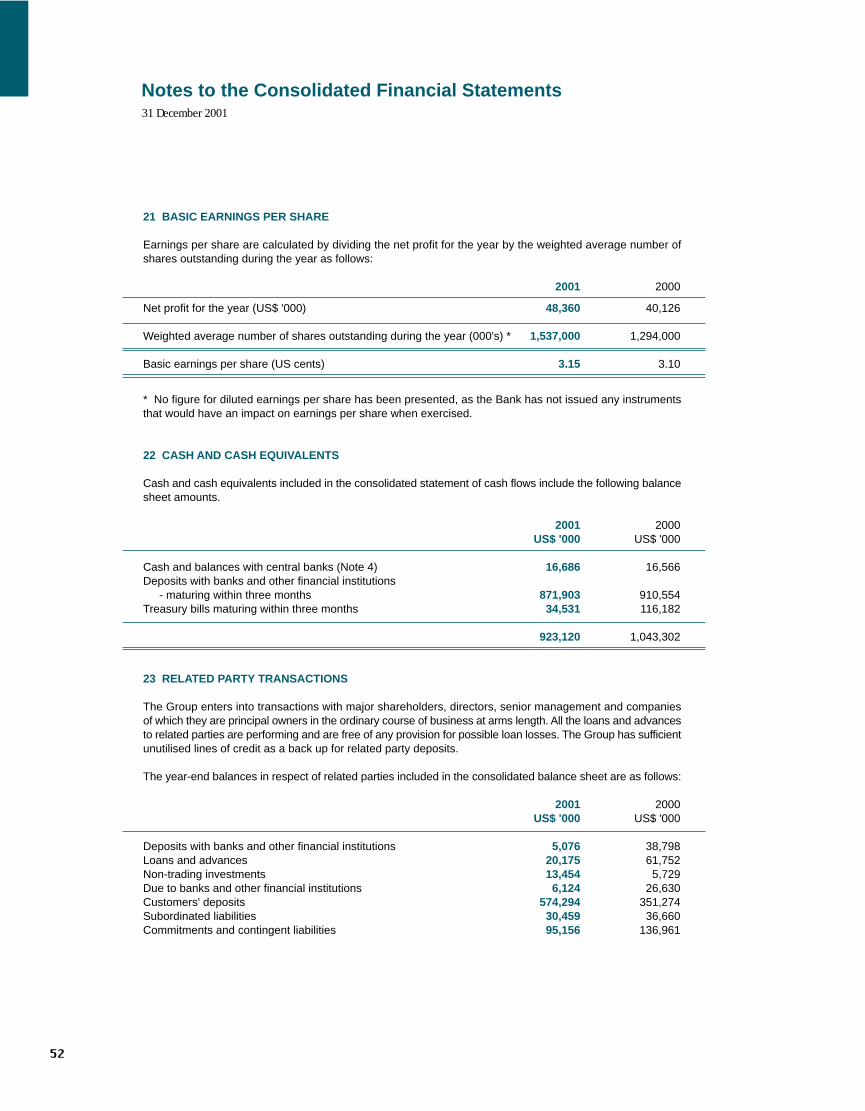
21 BASIC EARNINGS PER SHARE
Earnings per share are calculated by dividing the net profit for the year by the weighted average number ofshares outstanding during the year as follows:
2001 2000
Net profit for the year (US$ '000) 48,360 40,126
Weighted average number of shares outstanding during the year (000's) * 1,537,000 1,294,000 Basic earnings per share (US cents) 3.15 3.10
* No figure for diluted earnings per share has been presented, as the Bank has not issued any instrumentsthat would have an impact on earnings per share when exercised.
22 CASH AND CASH EQUIVALENTS
Cash and cash equivalents included in the consolidated statement of cash flows include the following balancesheet amounts.
2001 2000US$ '000 US$ '000
Cash and balances with central banks (Note 4) 16,686 16,566Deposits with banks and other financial institutions
- maturing within three months 871,903 910,554Treasury bills maturing within three months 34,531 116,182
923,120 1,043,302
23 RELATED PARTY TRANSACTIONS
The Group enters into transactions with major shareholders, directors, senior management and companiesof which they are principal owners in the ordinary course of business at arms length. All the loans and advancesto related parties are performing and are free of any provision for possible loan losses. The Group has sufficientunutilised lines of credit as a back up for related party deposits.
The year-end balances in respect of related parties included in the consolidated balance sheet are as follows:
2001 2000US$ '000 US$ '000
Deposits with banks and other financial institutions 5,076 38,798Loans and advances 20,175 61,752Non-trading investments 13,454 5,729Due to banks and other financial institutions 6,124 26,630Customers' deposits 574,294 351,274Subordinated liabilities 30,459 36,660Commitments and contingent liabilities 95,156 136,961
Notes to the Consolidated Financial Statements31 December 2001
23 RELATED PARTY TRANSACTIONS (continued)
Included in commitments and contingent liabilities are guarantees amounting to US$ 93 million (2000:US$ 130 million) in favour of the unit-holders of capital guaranteed funds launched by a subsidiary and anassociate. As of 31 December 2001 and 2000, the Group had a charge on the underlying US Treasury stripswhich on maturity would yield the amount guaranteed by the Group.
The income and expenses in respect of related party transactions included in the consolidated statement ofincome are as follows:
2001 2000US$ '000 US$ '000
Interest income 2,329 9,623Interest expense 20,845 26,776Gain on sale of non-trading investments - 5,106Fees and commission 1,493 1,314
24 EMPLOYEE BENEFITS
Pension schemeThe total pension costs of the Group relating to The United Bank of Kuwait PLC pension plan wereUS$ 1,627 thousand (2000: US$ 1,750 thousand).
The most recent actuarial valuation as at 30 June 2000 reflected an actuarial surplus of assets US$ 4,684thousand. The main assumptions used in the valuation were a future rate of investment return of 8% per annum,a future rate of salary progression of 6% per annum and a current contribution rate by the employer of 14.2%of the pensionable earnings.
Defined contribution plansThe contribution during the year for Bahraini employees on this account amounted to US$ 908 thousand (2000:US$ 600 thousand).
Other defined benefit plansThe charge to the consolidated statement of income on account of end of service benefits to non-Bahrainiemployees of the parent and its subsidiary Ahli United Bank (Bahrain) B.S.C. (c) for the year amountedto US$ 257 thousand (2000: US$ 119 thousand). There are no material differences between the carryingamount of the provision for end of service benefits and the amount arising from an actuarial computationthereof.
25 MANAGED FUNDS
Funds administrated on behalf of customers to which the Group does not have legal title are not included inthe consolidated balance sheet. The total market value of all such funds at 31 December 2001 was US$ 1,606million (2000 : US$ 1,785 million).
26 DERIVATIVES
In the ordinary course of business the Group enters into various types of transactions that involve derivativefinancial instruments. A derivative financial instrument is a financial contract between two parties where paymentsare dependent upon movements in price in one or more underlying financial instrument, reference rate or index.Derivative financial instruments include forwards, futures, swaps and options.
The table below shows the positive and negative fair values of derivative financial instruments, which areequivalent to the market values, together with the notional amounts analysed by the term to maturity. Thenotional amount is the amount of a derivative's underlying asset, reference rate or index and is the basis uponwhich changes in the value of derivatives are measured. The notional amounts indicate the volume oftransactions outstanding at year end and are neither indicative of the market risk nor credit risk.
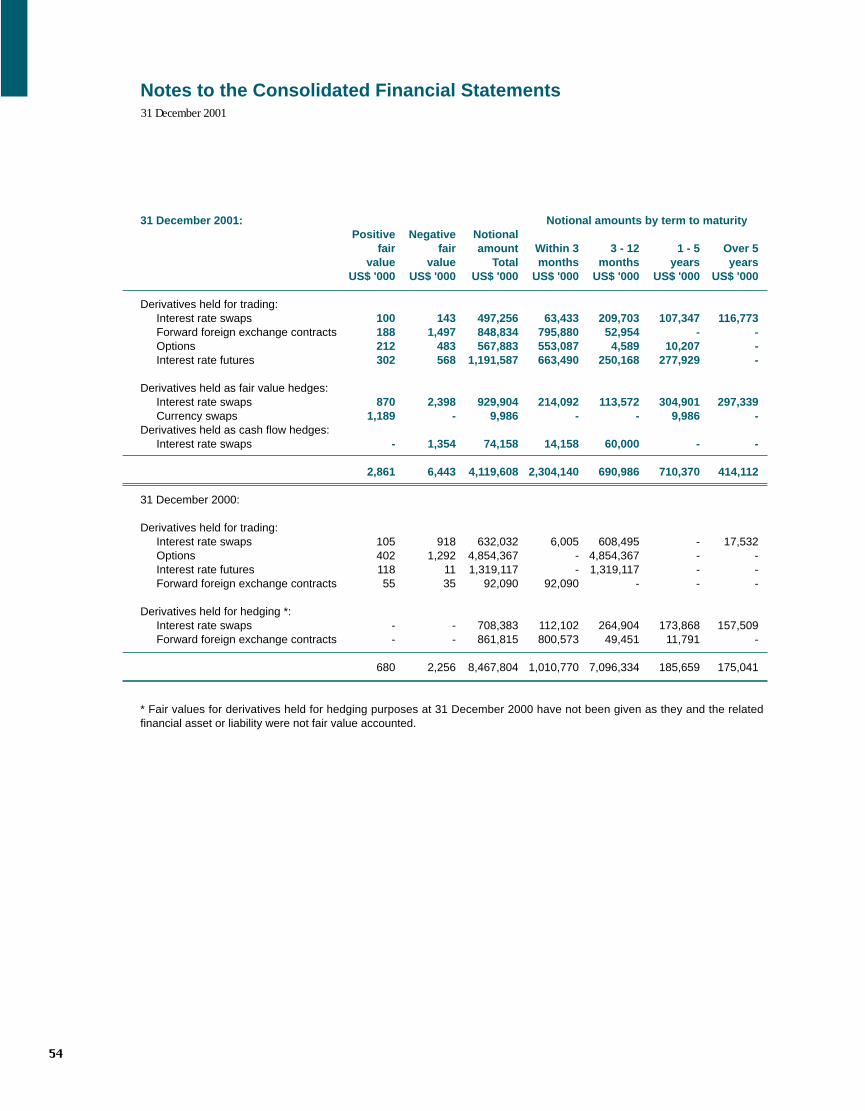
31 December 2001: Notional amounts by term to maturityPositive Negative Notional
fair fair amount Within 3 3 - 12 1 - 5 Over 5value value Total months months years years
US$ '000 US$ '000 US$ '000 US$ '000 US$ '000 US$ '000 US$ '000
Derivatives held for trading:Interest rate swaps 100 143 497,256 63,433 209,703 107,347 116,773Forward foreign exchange contracts 188 1,497 848,834 795,880 52,954 - -Options 212 483 567,883 553,087 4,589 10,207 -Interest rate futures 302 568 1,191,587 663,490 250,168 277,929 -
Derivatives held as fair value hedges:Interest rate swaps 870 2,398 929,904 214,092 113,572 304,901 297,339Currency swaps 1,189 - 9,986 - - 9,986 -
Derivatives held as cash flow hedges:Interest rate swaps - 1,354 74,158 14,158 60,000 - -
2,861 6,443 4,119,608 2,304,140 690,986 710,370 414,112
31 December 2000:
Derivatives held for trading:Interest rate swaps 105 918 632,032 6,005 608,495 - 17,532Options 402 1,292 4,854,367 - 4,854,367 - -Interest rate futures 118 11 1,319,117 - 1,319,117 - -Forward foreign exchange contracts 55 35 92,090 92,090 - - -
Derivatives held for hedging *:
Interest rate swaps - - 708,383 112,102 264,904 173,868 157,509Forward foreign exchange contracts - - 861,815 800,573 49,451 11,791 -
680 2,256 8,467,804 1,010,770 7,096,334 185,659 175,041
* Fair values for derivatives held for hedging purposes at 31 December 2000 have not been given as they and the relatedfinancial asset or liability were not fair value accounted.
Notes to the Consolidated Financial Statements31 December 2001
Notes to the Consolidated Financial Statements31 December 2001
26 DERIVATIVES (continued)
Derivative product typesForwards and futures are contractual agreements to either buy or sell a specified currency, commodity or financialinstrument at a specific price and date in the future. Forwards are customised contracts transacted in the over-the-counter market. Foreign currency and interest rate futures are transacted in standardised amounts on regulatedexchanges and are subject to daily cash margin requirements. Forward rate agreements are effectively tailor-made interest rate futures which fix a forward rate of interest on a notional loan, for an agreed period of timestarting on a specified future date.
Swaps are contractual agreements between two parties to exchange interest or foreign currency differentialsbased on a specific notional amount. For interest rate swaps, counterparties generally exchange fixed and floatingrate interest payments based on a notional value in a single currency. For currency swaps, fixed and floatinginterest payments as well as notional amounts are exchanged in different currencies.
Options are contractual agreements that convey the right, but not the obligation, to either buy or sell a specificamount of a commodity or financial instrument at a fixed price, either at a fixed future date or at any time withina specified period. The Group does not engage in the writing of options.
Derivative related credit riskCredit risk in respect of derivative financial instruments arises from the potential for a counterparty to default onits contractual obligations and is limited to the positive fair value of instruments that are favourable to the Group.
Derivatives held for trading purposesMost of the Group's derivative trading activities relate to positioning and arbitrage. Positioning involves managingpositions with the expectation of profiting from favorable movements in prices, rates or indices. Arbitrage involvesidentifying and profiting from price differentials between markets or products.
Derivatives held for hedging purposesThe Group has adopted a comprehensive system for the measurement and management of risk. Part of the riskmanagement process involves managing the Group's exposure to fluctuations in foreign exchange rates (currencyrisk) and interest rates through asset and liability management activities. It is the Group's policy to reduce itsexposure to currency and interest rate risks to acceptable levels as determined by the Board of Directors. TheBoard has established levels of currency risk by setting limits on counterparty and currency position exposures.Positions are monitored on a daily basis and hedging strategies used to ensure positions are maintained withinestablished limits. The Board has established levels of interest rate risk by setting limits on the interest rate gapsfor stipulated periods. Assets and liabilities interest rate gaps are reviewed on a weekly basis and hedging strategiesused to reduce the interest rate gaps to within the limits established by the Board.
As part of its asset and liability management the Group uses derivatives for hedging purposes in order to reduceits exposure to currency and interest rate risks. This is achieved by hedging specific financial instruments andforecasted transactions, as well as strategic hedging against overall balance sheet exposures.
The Group uses forward foreign exchange contracts, options and currency swaps to hedge against specificallyidentified currency risks. In addition, the Group uses interest rate swaps and interest rate futures to hedge againstthe interest rate risk arising from specifically identified fixed interest rate investments. The Group also uses interestrate swaps to hedge against the cash flow risks arising on certain floating rate deposits. In all such cases thehedging relationship and objective, including details of the hedged item and hedging instrument, are formallydocumented and the transactions are accounted for as fair value hedges.
For strategic interest rate risk, hedging is carried out by monitoring the duration of assets and liabilities and enteringinto interest rate swaps and futures to hedge a proportion of the interest rate exposure. Since strategic hedgingdoes not qualify for special hedge accounting, related derivatives are accounted for as trading instruments.
Notes to the Consolidated Financial Statements31 December 2001
27 COMMITMENTS AND CONTINGENT LIABILITIES
Credit-related commitmentsCredit-related commitments include commitments to extend credit, standby letters of credit, guarantees andacceptances which are designed to meet the requirements of the Group's customers.
Commitments to extend credit represents contractual commitments to make loans and revolving credits andgenerally have fixed expiration dates or other termination clauses. Since commitments may expire withoutbeing drawn upon, the total contract amounts do not necessarily represent future cash requirements.
Standby letters of credit, guarantees and acceptances (standbys) commit the Group to make payments onbehalf of customers contingent upon their failure to perform under the terms of the contract. Standbys wouldhave market risk if issued or extended at a fixed rate of interest. However, these contracts are primarily madeat a floating rate.
The Group has the following credit related commitments:
2001 2000US$ '000 US$ '000
Commitments on behalf of customers:Guarantees 250,461 222,731Acceptances 14,041 9,543Letters of credit 71,122 176,250
335,624 408,524
Irrevocable commitments:Undrawn irrevocable loan commitments 442,742 341,210Others 80 141
442,822 341,351
Operating lease commitmentsAt 31 December 2001 the Group had commitments under non-cancellable operating leases amounting toUS$ 3,439 thousand (2000: US$ 4,250 thousand).
28 SEGMENT INFORMATION
Primary segment information
For management purposes the Group is recognised into three major business segments:
Retail banking - principally handling individual customers' deposits, and providing consumertype loans, overdrafts, credit cards and fund transfer facilities.
Corporate banking, - principally handling loans and other credit facilities, and deposit and currenttreasury and investments accounts for corporate and institutional customers and providing money
market, trading and treasury services, as well as management of the Group'sfunding.
Private banking and wealth - principally servicing the high net worth clients through a range of investmentmanagement products, funds, credit facilities, trusts and alternative investments.

Notes to the Consolidated Financial Statements31 December 2001
28 SEGMENT INFORMATION (continued)
These segments are the basis on which the Group reports its primary segment information. Transactionsbetween segments are conducted at estimated market rates on an arm's length basis. Interest is charged/creditedto business segments based on a pool rate which approximates the cost of funds.
Segment information for the year ended 31 December 2001 was as follows:
Corporate Privatebanking, banking
Retail treasury and and wealthbanking investments management Total
US$ '000 US$ '000 US$ '000 US$ '000
Operating income before provisions 28,017 102,949 17,250 148,216
Segment result 12,993 55,666 4,111 72,770
Profit from operations 72,770Share of profit from associates 6,671
Profit for the year before provisions 79,441Provisions 24,655
Net profit for the year before tax 54,786Taxation 6,426
Net profit for the year 48,360
Other InformationSegment assets 271,414 3,466,397 38,899 3,776,710
Investment in associates 167,664Unallocated assets 158,345
Total assets 4,102,719
Segment liabilities 853,378 1,919,024 391,865 3,164,267
Unallocated liabilities 374,150
Total liabilities 3,538,417
Ahli United Bank Annual Report and Accounts 2001 45
Notes to the Consolidated Financial Statements31 December 2001
28 SEGMENT INFORMATION (continued)
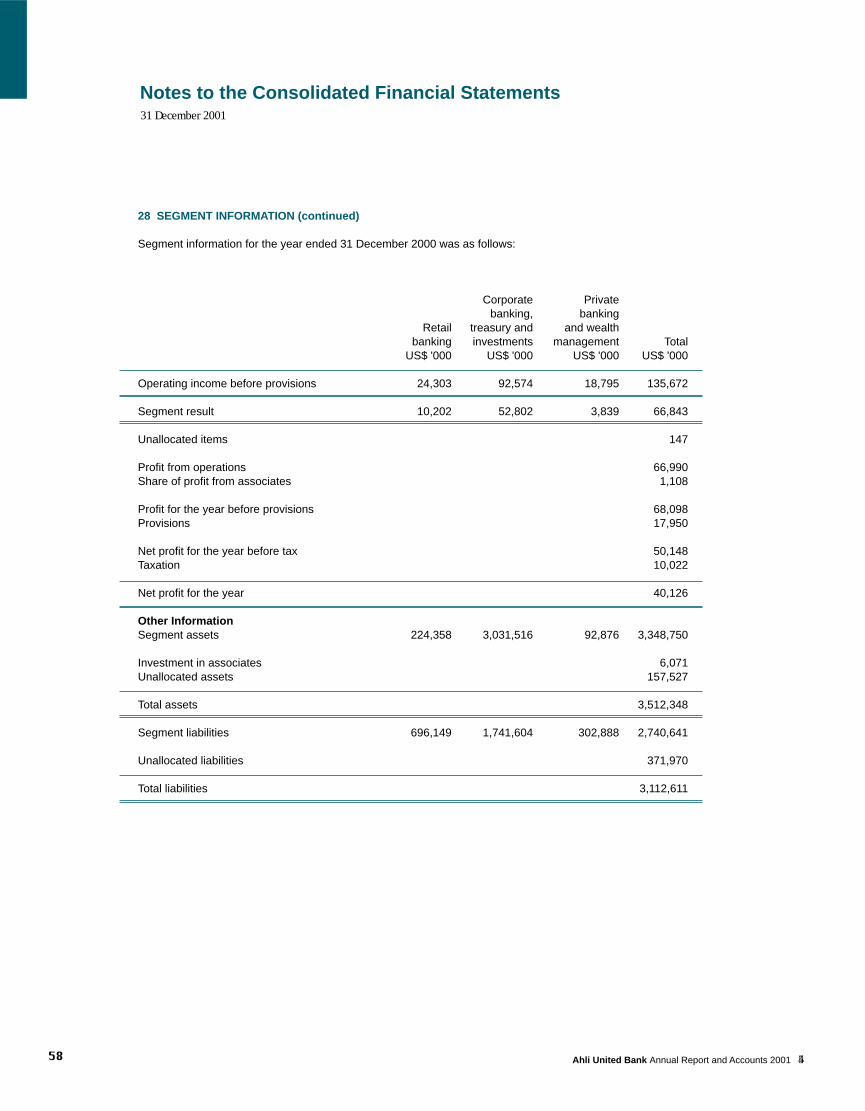
Segment information for the year ended 31 December 2000 was as follows:
Corporate Privatebanking, banking
Retail treasury and and wealthbanking investments management Total
US$ '000 US$ '000 US$ '000 US$ '000
Operating income before provisions 24,303 92,574 18,795 135,672
Segment result 10,202 52,802 3,839 66,843
Unallocated items 147
Profit from operations 66,990Share of profit from associates 1,108
Profit for the year before provisions 68,098Provisions 17,950
Net profit for the year before tax 50,148Taxation 10,022
Net profit for the year 40,126
Other InformationSegment assets 224,358 3,031,516 92,876 3,348,750
Investment in associates 6,071Unallocated assets 157,527
Total assets 3,512,348
Segment liabilities 696,149 1,741,604 302,888 2,740,641
Unallocated liabilities 371,970
Total liabilities 3,112,611

Notes to the Consolidated Financial Statements31 December 2001
28 SEGMENT INFORMATION (continued)
Secondary segment information
Although the management of the Group is based primarily on business segments, the Group operates in twogeographic markets; Middle East is designated as regional, and the remainder (Europe, the Far East and theUSA) is designated as international. The following table shows the distribution of the Group's operating incomeand total assets by geographical segment:
Regional International Total2001 2000 2001 2000 2001 2000
US$ '000 US$ '000 US$ '000 US$ '000 US$ '000 US$ '000
Operating income 83,559 45,312 71,328 91,468 154,887 136,780
Total assets 1,398,222 1,002,475 2,704,497 2,509,873 4,102,719 3,512,348
29 CREDIT RISK
Credit risk is the risk that one party to a financial instrument will fail to discharge a financial obligation andcause the other party to incur a financial loss. In case of derivatives this is limited to positive fair values. TheGroup attempts to control credit risk by monitoring credit exposures, limiting transactions with specificcounterparties, and continually assessing the creditworthiness of counterparties.
Concentrations of credit risk arise when a number of counterparties are engaged in similar business activities,or activities in the same geographic region, or have similar economic features that would cause their abilityto meet contractual obligations to be similarly affected by changes in economic, political or other conditions.Concentrations of credit risk indicate the relative sensitivity of the Group's performance to developments,affecting a particular industry or geographic location.
The Group seeks to manage its credit risk exposure through diversification of lending activities to avoid undueconcentrations of risks with individuals or groups of customers in specific locations or businesses. It alsoobtains security when appropriate.
Details of the composition of the loans and advances are set out in note 6.
Details of the industry sector analysis and the geographical distribution of assets, liabilities and off balancesheet items are set out in note 30.
Notes to the Consolidated Financial Statements31 December 2001
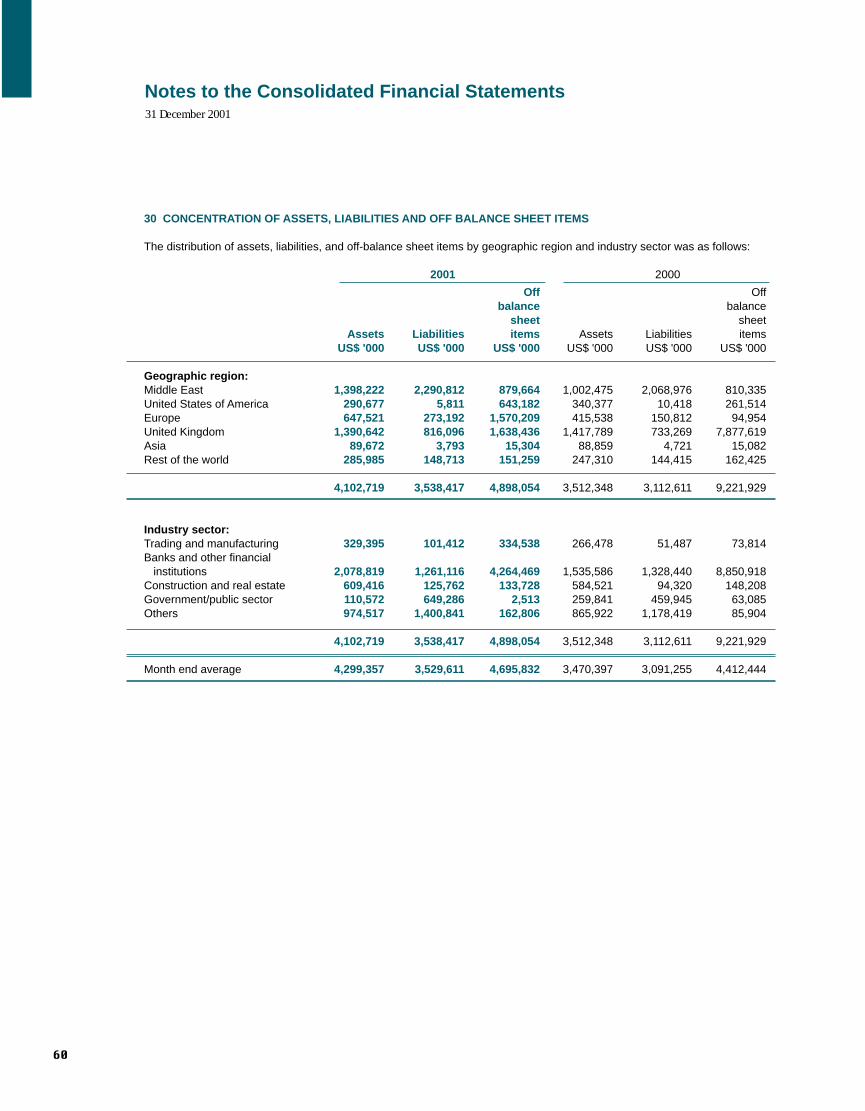
30 CONCENTRATION OF ASSETS, LIABILITIES AND OFF BALANCE SHEET ITEMS
The distribution of assets, liabilities, and off-balance sheet items by geographic region and industry sector was as follows:
2001 2000
Off Offbalance balance
sheet sheetAssets Liabilities items Assets Liabilities items
US$ '000 US$ '000 US$ '000 US$ '000 US$ '000 US$ '000
Geographic region:Middle East 1,398,222 2,290,812 879,664 1,002,475 2,068,976 810,335United States of America 290,677 5,811 643,182 340,377 10,418 261,514Europe 647,521 273,192 1,570,209 415,538 150,812 94,954United Kingdom 1,390,642 816,096 1,638,436 1,417,789 733,269 7,877,619Asia 89,672 3,793 15,304 88,859 4,721 15,082Rest of the world 285,985 148,713 151,259 247,310 144,415 162,425
4,102,719 3,538,417 4,898,054 3,512,348 3,112,611 9,221,929
Industry sector:Trading and manufacturing 329,395 101,412 334,538 266,478 51,487 73,814Banks and other financial institutions 2,078,819 1,261,116 4,264,469 1,535,586 1,328,440 8,850,918Construction and real estate 609,416 125,762 133,728 584,521 94,320 148,208Government/public sector 110,572 649,286 2,513 259,841 459,945 63,085Others 974,517 1,400,841 162,806 865,922 1,178,419 85,904
4,102,719 3,538,417 4,898,054 3,512,348 3,112,611 9,221,929
Month end average 4,299,357 3,529,611 4,695,832 3,470,397 3,091,255 4,412,444
Notes to the Consolidated Financial Statements31 December 2001
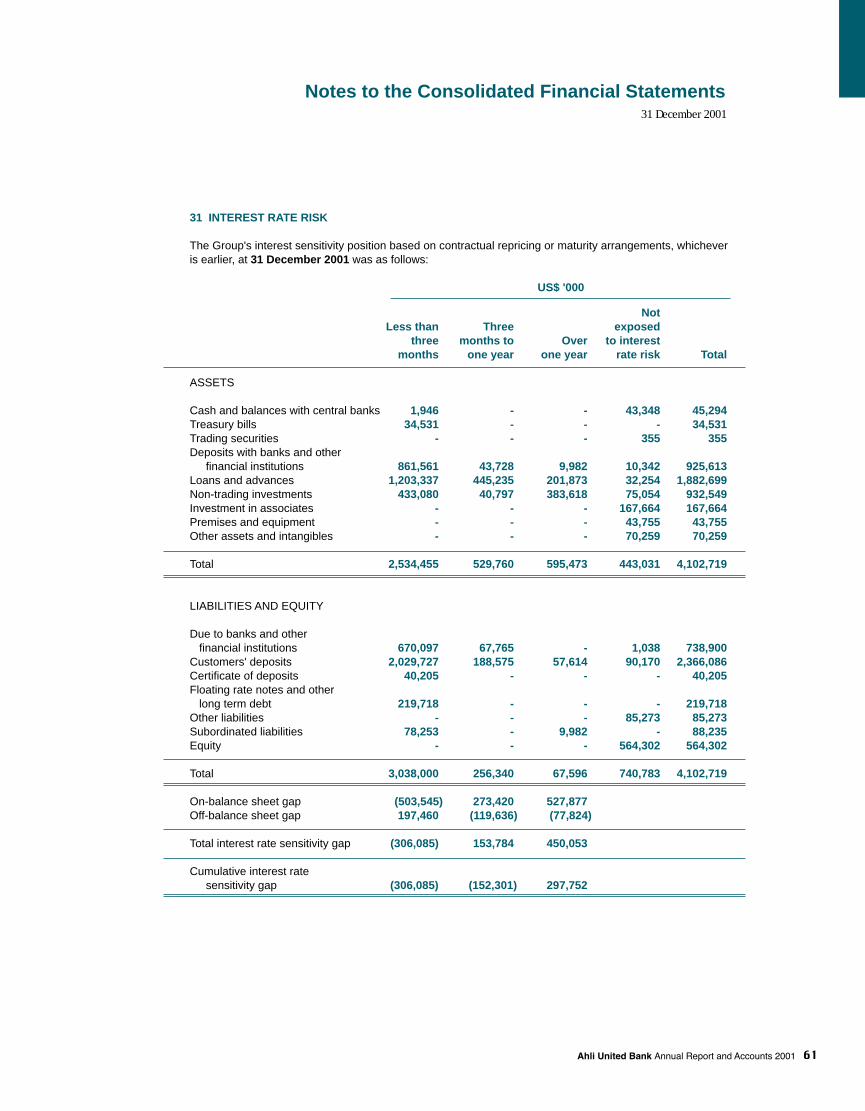
31 INTEREST RATE RISK
The Group's interest sensitivity position based on contractual repricing or maturity arrangements, whicheveris earlier, at 31 December 2001 was as follows:
US$ '000
NotLess than Three exposed
three months to Over to interestmonths one year one year rate risk Total
ASSETS
Cash and balances with central banks 1,946 - - 43,348 45,294Treasury bills 34,531 - - - 34,531Trading securities - - - 355 355Deposits with banks and other
financial institutions 861,561 43,728 9,982 10,342 925,613Loans and advances 1,203,337 445,235 201,873 32,254 1,882,699Non-trading investments 433,080 40,797 383,618 75,054 932,549Investment in associates - - - 167,664 167,664Premises and equipment - - - 43,755 43,755Other assets and intangibles - - - 70,259 70,259
Total 2,534,455 529,760 595,473 443,031 4,102,719
LIABILITIES AND EQUITY
Due to banks and other financial institutions 670,097 67,765 - 1,038 738,900Customers' deposits 2,029,727 188,575 57,614 90,170 2,366,086Certificate of deposits 40,205 - - - 40,205Floating rate notes and other long term debt 219,718 - - - 219,718Other liabilities - - - 85,273 85,273Subordinated liabilities 78,253 - 9,982 - 88,235Equity - - - 564,302 564,302
Total 3,038,000 256,340 67,596 740,783 4,102,719
On-balance sheet gap (503,545) 273,420 527,877Off-balance sheet gap 197,460 (119,636) (77,824)
Total interest rate sensitivity gap (306,085) 153,784 450,053
Cumulative interest ratesensitivity gap (306,085) (152,301) 297,752
Notes to the Consolidated Financial Statements31 December 2001
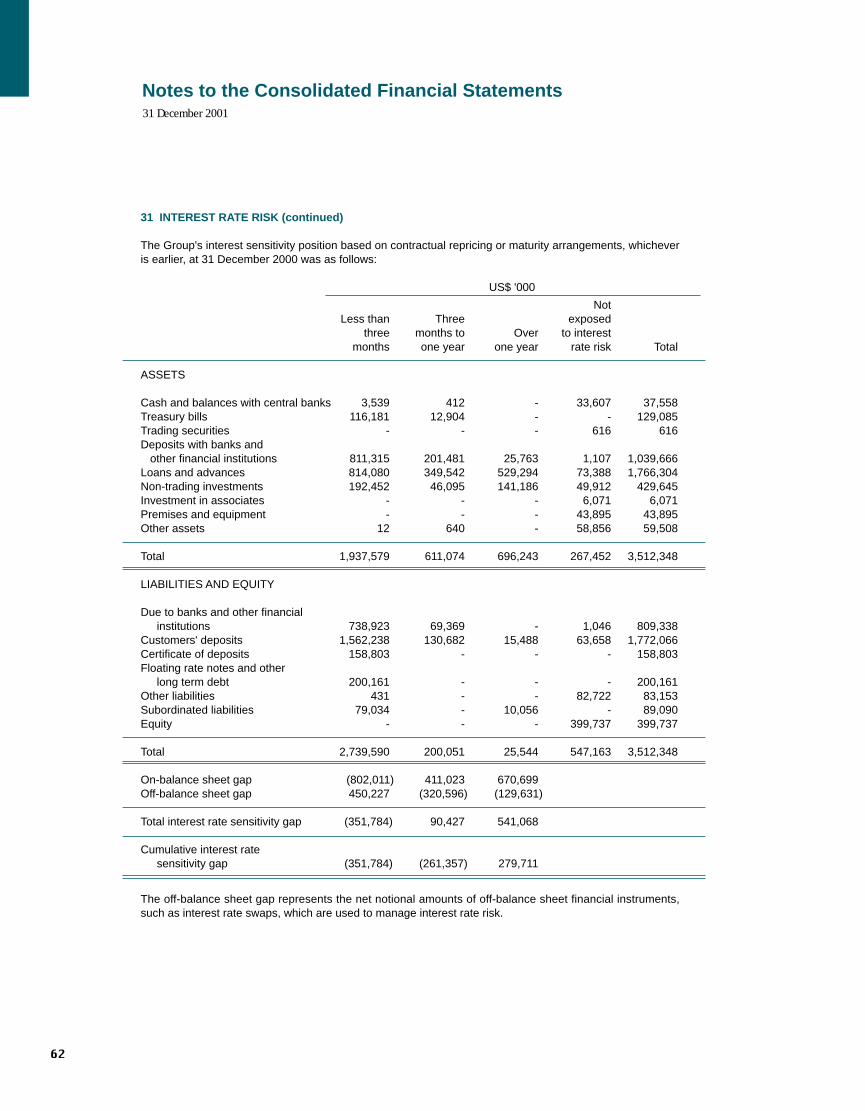
31 INTEREST RATE RISK (continued)
The Group's interest sensitivity position based on contractual repricing or maturity arrangements, whicheveris earlier, at 31 December 2000 was as follows:
US$ '000
NotLess than Three exposed
three months to Over to interestmonths one year one year rate risk Total
ASSETS
Cash and balances with central banks 3,539 412 - 33,607 37,558Treasury bills 116,181 12,904 - - 129,085Trading securities - - - 616 616Deposits with banks and other financial institutions 811,315 201,481 25,763 1,107 1,039,666Loans and advances 814,080 349,542 529,294 73,388 1,766,304Non-trading investments 192,452 46,095 141,186 49,912 429,645Investment in associates - - - 6,071 6,071Premises and equipment - - - 43,895 43,895Other assets 12 640 - 58,856 59,508
Total 1,937,579 611,074 696,243 267,452 3,512,348
LIABILITIES AND EQUITY
Due to banks and other financialinstitutions 738,923 69,369 - 1,046 809,338
Customers' deposits 1,562,238 130,682 15,488 63,658 1,772,066Certificate of deposits 158,803 - - - 158,803Floating rate notes and other
long term debt 200,161 - - - 200,161Other liabilities 431 - - 82,722 83,153Subordinated liabilities 79,034 - 10,056 - 89,090Equity - - - 399,737 399,737
Total 2,739,590 200,051 25,544 547,163 3,512,348
On-balance sheet gap (802,011) 411,023 670,699Off-balance sheet gap 450,227 (320,596) (129,631)
Total interest rate sensitivity gap (351,784) 90,427 541,068
Cumulative interest ratesensitivity gap (351,784) (261,357) 279,711
The off-balance sheet gap represents the net notional amounts of off-balance sheet financial instruments,such as interest rate swaps, which are used to manage interest rate risk.
Notes to the Consolidated Financial Statements31 December 2001
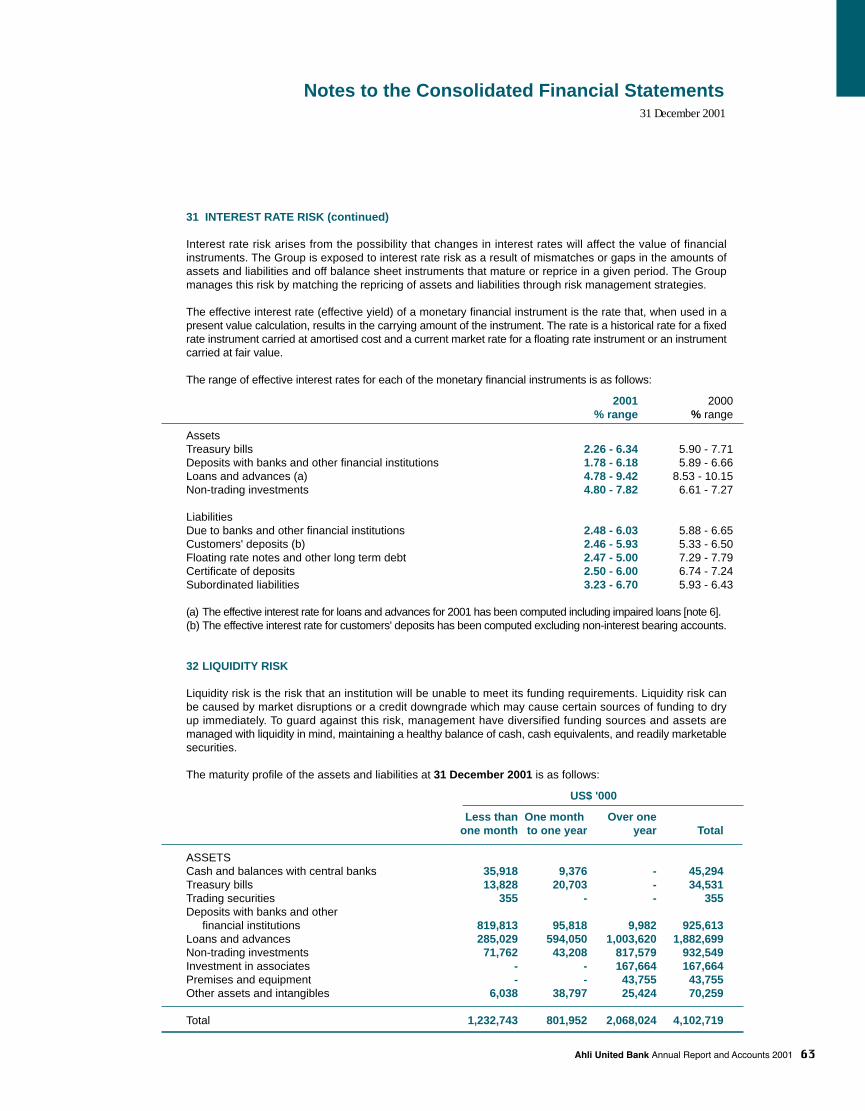
31 INTEREST RATE RISK (continued)
Interest rate risk arises from the possibility that changes in interest rates will affect the value of financialinstruments. The Group is exposed to interest rate risk as a result of mismatches or gaps in the amounts ofassets and liabilities and off balance sheet instruments that mature or reprice in a given period. The Groupmanages this risk by matching the repricing of assets and liabilities through risk management strategies.
The effective interest rate (effective yield) of a monetary financial instrument is the rate that, when used in apresent value calculation, results in the carrying amount of the instrument. The rate is a historical rate for a fixedrate instrument carried at amortised cost and a current market rate for a floating rate instrument or an instrumentcarried at fair value.
The range of effective interest rates for each of the monetary financial instruments is as follows:
2001 2000% range % range
AssetsTreasury bills 2.26 - 6.34 5.90 - 7.71Deposits with banks and other financial institutions 1.78 - 6.18 5.89 - 6.66Loans and advances (a) 4.78 - 9.42 8.53 - 10.15Non-trading investments 4.80 - 7.82 6.61 - 7.27
LiabilitiesDue to banks and other financial institutions 2.48 - 6.03 5.88 - 6.65Customers' deposits (b) 2.46 - 5.93 5.33 - 6.50Floating rate notes and other long term debt 2.47 - 5.00 7.29 - 7.79Certificate of deposits 2.50 - 6.00 6.74 - 7.24Subordinated liabilities 3.23 - 6.70 5.93 - 6.43
(a) The effective interest rate for loans and advances for 2001 has been computed including impaired loans [note 6].(b) The effective interest rate for customers' deposits has been computed excluding non-interest bearing accounts.
32 LIQUIDITY RISK
Liquidity risk is the risk that an institution will be unable to meet its funding requirements. Liquidity risk canbe caused by market disruptions or a credit downgrade which may cause certain sources of funding to dryup immediately. To guard against this risk, management have diversified funding sources and assets aremanaged with liquidity in mind, maintaining a healthy balance of cash, cash equivalents, and readily marketablesecurities.
The maturity profile of the assets and liabilities at 31 December 2001 is as follows:
US$ '000
Less than One month Over oneone month to one year year Total
ASSETSCash and balances with central banks 35,918 9,376 - 45,294Treasury bills 13,828 20,703 - 34,531Trading securities 355 - - 355Deposits with banks and other
financial institutions 819,813 95,818 9,982 925,613Loans and advances 285,029 594,050 1,003,620 1,882,699Non-trading investments 71,762 43,208 817,579 932,549Investment in associates - - 167,664 167,664Premises and equipment - - 43,755 43,755Other assets and intangibles 6,038 38,797 25,424 70,259
Total 1,232,743 801,952 2,068,024 4,102,719

32 LIQUIDITY RISK (continued)
US$ '000
Less than One month Over oneone month to one year year Total
LIABILITIES AND EQUITYDue to banks and other financial institutions 372,736 366,164 - 738,900Customers' deposits 1,661,956 646,504 57,626 2,366,086Certificate of deposits 2,996 37,209 - 40,205Floating rate notes and other long term debt - 119,860 99,858 219,718Other liabilities 11,101 30,003 44,169 85,273Subordinated liabilities - - 88,235 88,235Equity - 42,878 521,424 564,302
Total 2,048,789 1,242,618 811,312 4,102,719
The maturity profile of the assets and liabilities at 31 December 2000 was as follows:
US$ '000
Less than One month Over oneone month to one year year Total
ASSETSCash and balances with central banks 27,526 10,032 - 37,558Treasury bills 38,293 90,792 - 129,085Trading securities 616 - - 616Deposits with banks and other financial institutions 801,025 228,586 10,055 1,039,666Loans and advances 284,307 419,023 1,062,974 1,766,304Non-trading investments 9,020 26,808 393,817 429,645Investment in associates - - 6,071 6,071Premises and equipment - - 43,895 43,895Other assets 15,693 17,319 26,496 59,508
Total 1,176,480 792,560 1,543,308 3,512,348
LIABILITIES AND EQUITYDue to banks and other financial institutions 394,112 415,226 - 809,338Customers' deposits 1,049,931 706,647 15,488 1,772,066Certificate of deposits 59,047 99,756 - 158,803Floating rate notes and other long term debt - - 200,161 200,161Other liabilities 14,635 16,200 52,318 83,153Subordinated liabilities - - 89,090 89,090Equity - 32,383 367,354 399,737
Total 1,517,725 1,270,212 724,411 3,512,348
Notes to the Consolidated Financial Statements31 December 2001
Notes to the Consolidated Financial Statements31 December 2001
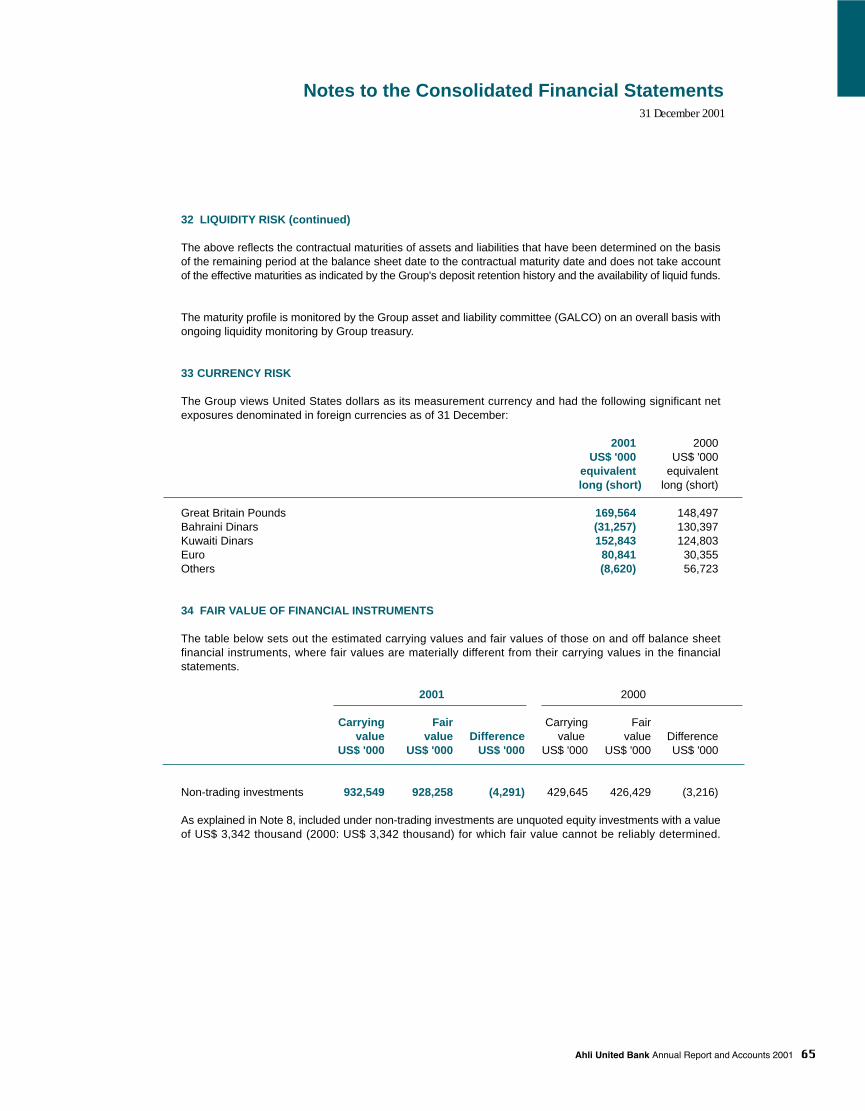
32 LIQUIDITY RISK (continued)
The above reflects the contractual maturities of assets and liabilities that have been determined on the basisof the remaining period at the balance sheet date to the contractual maturity date and does not take accountof the effective maturities as indicated by the Group's deposit retention history and the availability of liquid funds.
The maturity profile is monitored by the Group asset and liability committee (GALCO) on an overall basis withongoing liquidity monitoring by Group treasury.
33 CURRENCY RISK
The Group views United States dollars as its measurement currency and had the following significant netexposures denominated in foreign currencies as of 31 December:
2001 2000US$ '000 US$ '000
equivalent equivalentlong (short) long (short)
Great Britain Pounds 169,564 148,497Bahraini Dinars (31,257) 130,397Kuwaiti Dinars 152,843 124,803Euro 80,841 30,355Others (8,620) 56,723
34 FAIR VALUE OF FINANCIAL INSTRUMENTS
The table below sets out the estimated carrying values and fair values of those on and off balance sheetfinancial instruments, where fair values are materially different from their carrying values in the financialstatements.
2001 2000
Carrying Fair Carrying Fairvalue value Difference value value Difference
US$ '000 US$ '000 US$ '000 US$ '000 US$ '000 US$ '000
Non-trading investments 932,549 928,258 (4,291) 429,645 426,429 (3,216)
As explained in Note 8, included under non-trading investments are unquoted equity investments with a valueof US$ 3,342 thousand (2000: US$ 3,342 thousand) for which fair value cannot be reliably determined.

Notes to the Consolidated Financial Statements31 December 2001
35 CAPITAL ADEQUACY
The risk asset ratio, calculated in accordance with the capital adequacy guidelines approved by the BahrainMonetary Agency, for the Group is as follows:
2001 2000US$ '000 US$ '000
Capital base:Tier 1 capital 542,313 399,737Tier 2 capital 9,803 4,059 - Eligible subordinated debts 85,665 89,090
637,781 492,886Less: Investments in/loans to funds and subsidiaries (7,600) (26,858)
Total capital base (a) 630,181 466,028
Risk weighted assets:Credit risk 2,878,716 2,180,581Market risk 133,138 74,576
Total risk weighted assets (b) 3,011,854 2,255,157
Capital adequacy (a/b * 100) 21% 21%
Minimum requirement 12% 12%