CONSOLIDATED ANNUAL REPORT OF GLOBE TRADE CENTRE ... -...
157
CONSOLIDATED ANNUAL REPORT OF GLOBE TRADE CENTRE S.A. CAPITAL GROUP FOR THE FINANCIAL YEAR ENDED 31 DECEMBER 2015 Place and date of publication: Warsaw, 17 March 2016
-
Upload
nguyendieu -
Category
Documents
-
view
214 -
download
0
Transcript of CONSOLIDATED ANNUAL REPORT OF GLOBE TRADE CENTRE ... -...

CONSOLIDATED ANNUAL REPORT OF GLOBE TRADE CENTRE S.A. CAPITAL GROUP FOR THE FINANCIAL YEAR ENDED 31 DECEMBER 2015
Place and date of publication: Warsaw, 17 March 2016

2
List of contents: Letter of the Management Board Management Board’s report on the activities of Globe Trade Centre S.A. Capital Group in the financial year ended 31 December 2015 Report on the application of the principles of corporate governance for the financial year ended 31 December 2015 Management Board’s representations Consolidated financial statements for the financial year ended 31 December 2015 Opinion of the independent auditor

3
Ladies and Gentlemen,
2015 has been a challenging but also very rewarding year for GTC.
It marks a key milestone in GTC’s history. After a harsh, but overall highly successful restructuring program, GTC
has now completed its strategic repositioning and has once more revived as a major, profitable and acquisitive
market player in its CEE & SEE target markets.
Completion of repositioning and restructuring process
Having revised and communicated our new strategy to the market, we have successfully completed GTC’s
repositioning process. We have implemented a more efficient and focused management structure, including a
selective reallocation of management resources and responsibilities within the GTC Group. In parallel, GTC has
successfully restructured several loans connected to some of its non-core assets. The refinancing of selected
project loans combined with a more efficient interest hedging strategy has led to major savings in GTC’s
borrowing cost and provided headroom for further financing.
Completion of capital increase
We have presented GTC’s new strategy during various meetings with our shareholders, who showed strong
support for our capital increase through a rights issue by an overwhelming vote of confidence. The total proceeds
from the capital increase of approximately €140 million allowed us to immediately start executing on our two-pillar
growth strategy - acquisition of income-producing assets which offer value creation through improved asset
management and development of high-quality office and retail projects in GTC’s core regions.
Attractive asset portfolio and pipeline
During 2015, as a part of our restructuring process we disposed of a total of 5 non-core assets and freed up €15
million cash equity. In addition, we sold non-core land plots that were not earmarked for near-term, future
developments, to free-up unproductive capital for our growth strategy.
As at 31 December 2015, the Gross Asset Value (GAV) of our portfolio was approximately €1.3 billion, of which
79% were income producing and 8% were projects under construction. Our unique development portfolio
predominantly consists of landmark shopping centers and Class A office buildings with significant embedded Net
Asset Value (NAV) growth potential upon completion. Our development portfolio includes 3 projects at
construction stage and 5 projects at planning stage.
Improvement in key operating stats
In 2015, we worked intensively on our portfolio in order to keep our already impressive overall occupancy at the
level of 92%. In our office portfolio, we successfully let out a total of 68,400 sq. m, thus improving our office
occupancy rate by 100 bps to 93%. In our retail portfolio, our letting result was 39,100 sq. m, including 18,800 sq.
m of pre-letting in the newly developed Galeria Północna and planned Galeria Wilanów, which puts our
occupancy at the level of 89%.

4
Development projects on track
Aside from managing our core office and retail properties, we have also made significant progress in our
development portfolio. During 2015, we accelerated the development and pre-letting of our major projects:
Galeria Północna, a major shopping centre in Warsaw, with a total investment volume of €170 million, is under
construction and scheduled for completion in 2017, a second phase of University Business Park Office in Łódź,
with a total investment volume of €15 million, will be completed in the second quarter of 2016 and second phase
of Fortyone, an office building in Belgrade with a total investment cost of €11 million, will be completed in the third
quarter of 2016.
Implementing GTC acquisition strategy
In the fourth quarter of 2015, GTC re-entered the acquisition trail as outlined in its strategy. While the preceding
periods were primarily focused on strategic realignment and financial restructuring, in 2015 we were able to grow
our portfolio through selective value-enhancing acquisitions. In total, we completed 2 acquisitions with a total
volume of €84 million. GTC acquired Duna Tower in Budapest (a 31,250 sq. m office building) and in the
beginning of 2016 it acquired Pixel in Poznan (a 14,500 sq. m office building). Both assets are located in
attractive business locations and benefit from an improving office market environment. In addition, we increased
our stake in the City Gate, a landmark office project in Bucharest, to 100% by buying out our minority partner. All
our new add-on acquisitions were entirely focused on our target markets in line with our new growth strategy.
Improving operating performance and LTV
Positive developments in our operating business translated also into solid financial results in 2015. Our net
operating income (NOI) from leasing activities reached €80 million. This improvement, achieved despite a
significant reduction in our asset portfolio, underlines our asset management competencies and achievements. In
parallel, we were able to improve our debt profile. This comfortable level of financial leverage provides us with
enough headroom to pursue our opportunistic growth strategy whilst maintaining a defensive financing structure.
All these factors contributed to an increase in our Funds from Operations (FFO) from €28 million in 2014 to €38
million in 2015 which reflects significant operational progress and turnaround success achieved by GTC last year.
Our EPRA NAV currently stands at €779 million (or €1.69 per share) as of end of 2015.
Outperforming the market and listed peers
Our clear commitment to the revised growth strategy and our ability to execute have been widely appreciated by
our investors and translated into a positive GTC share price performance for the reported period. GTC shares
closed the year at PLN 7.15 on the Warsaw Stock Exchange - an increase of 36%. With this performance, we
significantly outperformed our key benchmark indices like the Warsaw Stock Exchange WIG Total Return Index
(“WIG”) or the WIG30.
2016 strategy update
In 2016, GTC will again focus on improving its core asset portfolio as well as further developing its development
projects. In line with our growth strategy, we also plan to further expand our core portfolio through selected
opportunistic acquisitions of value-add properties in our core markets. Ongoing construction projects such as
Galeria Północna in Warsaw, the University Business Park Office in Łódź and the Fortyone in Belgrade are

5
planned to be completed in 2016 and 2017. These activities give us a lot of confidence that GTC is well
positioned for 2016 and beyond to deliver superior growth to its all stakeholders.
Finally, we would like to take this opportunity to thank our employees, whose commitment and hard work
significantly contributed to our 2015 performance. We would also like to thank our shareholders for their support
and confidence in our strategy, as well as our business partners and tenants.
We are looking forward to a successful year 2016 and we are eager to further accelerate the implementation of
our growth strategy.
Thomas Kurzmann
President of the Management Board

6
MANAGEMENT BOARD’S REPORT ON THE ACTIVITIES OF GLOBE TRADE CENTRE S.A. CAPITAL GROUP IN THE FINANCIAL YEAR ENDED 31 DECEMBER 2015

7
Table of content Item 1. Introduction .................................................................................................................................................. 9 Item 2. Selected financial data .............................................................................................................................. 11 Item 3. Key risk factors .......................................................................................................................................... 13 Item 4. Presentation of the Group.......................................................................................................................... 36
Item 4.1. General information about the Group ................................................................................................. 36 Item 4.2. Structure of the Group ........................................................................................................................ 37 Item 4.3. Changes to the principal rules of the management of the Company and the Group .......................... 37 Item 4.4. The Group’s Strategy ......................................................................................................................... 38 Item 4.5. Business overview ............................................................................................................................. 41
Item 4.5.1. Overview of investment portfolio ................................................................................................. 42 Item 4.5.1.1. Overview of income generating assets ............................................................................... 42
Item 4.5.1.1.1. Overview of the office portfolio ................................................................................... 43 Item 4.5.1.1.1.1 Office portfolio in Poland ..................................................................................... 44 Item 4.5.1.1.1.2 Office portfolio in Hungary .................................................................................. 45 Item 4.5.1.1.1.3 Office portfolio in Serbia ...................................................................................... 45 Item 4.5.1.1.1.4 Office portfolio in Romania .................................................................................. 45 Item 4.5.1.1.1.5 Office portfolio in Croatia .................................................................................... 46 Item 4.5.1.1.1.6 Office portfolio in the Czech Republic ................................................................. 46
Item 4.5.1.1.2. Overview of retail portfolio .......................................................................................... 47 Item 4.5.1.1.2.1 Retail portfolio in Poland ..................................................................................... 47 Item 4.5.1.1.2.2 Retail portfolio in Croatia ..................................................................................... 48 Item 4.5.1.1.2.3 Retail portfolio in Bulgaria ................................................................................... 48 Item 4.5.1.1.2.4 Retail portfolio in Romania .................................................................................. 48 Item 4.5.1.1.2.5 Retail portfolio in the Czech Republic ................................................................. 49
Item 4.5.1.2 Overview of properties under construction ......................................................................... 49 Item 4.5.1.3. Overview of commercial landbank ...................................................................................... 50
Item 4.5.2. Residential inventory and landbank ............................................................................................ 50 Item 4.5.3. Assets held for sale..................................................................................................................... 51
Item 4.6. Overview of the markets on which the Group operates ...................................................................... 51 Item 4.6.1. Office market............................................................................................................................... 51 Item 4.6.2. Retail market ............................................................................................................................... 52 Item 4.6.3. Investment market ...................................................................................................................... 54
Item 4.7 Information on the Company’s policy on sponsorship, charity and other similar activities. ................. 55 Item 5. Operating and financial review .................................................................................................................. 55
Item 5.1. General factors affecting operating and financial results .................................................................... 55 Item 5.2. Specific factors affecting financial and operating results .................................................................... 58 Item 5.3.Presentation of differences between achieved financial results and published forecasts ................... 59 Item 5. 4. Statement of financial position .......................................................................................................... 59
Item 5.4.1. Key items of the statement of financial position .......................................................................... 59 Item 5.4.2. Financial position as of 31 December 2014 compared to 31 December 2013 ............................ 61
Item 5.5. Consolidated income statement ......................................................................................................... 62 Item 5.5.1. Key items of the consolidated income statement ........................................................................ 62 Item 5.5.2. Comparison of financial results for the 12 month period ended 31 December 2014 with the result for the corresponding period of 2013 ............................................................................................................ 64
Item 5. 6. Consolidated cash flow statement ..................................................................................................... 68 Item 5.6.1. Key items from consolidated cash flow statement ...................................................................... 68 Item 5.6.2. Cash flow analysis ...................................................................................................................... 69
Item 5.7. Future liquidity and capital resources ................................................................................................. 70 Item 6. Information on use of proceeds from the issuance of shares and bonds .................................................. 70 Item 7. Information on loans granted with a particular emphasis on related entities ............................................. 71 Item 8. Information on granted and received guarantees with a particular emphasis on guarantees granted to related entities ....................................................................................................................................................... 71

8
Item 9. Off balance liabilities .................................................................................................................................. 71 Item 10. Major investments, local and foreign (securities, financial instruments, intangible assets, real estate), including capital investments outside the Group and its financing method ............................................................ 72 Item 11. Information on market risks ..................................................................................................................... 72 Item 12. Remuneration policy and human resources management ...................................................................... 75
Item 12.1 Remuneration policy ......................................................................................................................... 75 Item 12.2 Number of employees as at 31 December 2015, .............................................................................. 75 Item 12.3 Incentive system ............................................................................................................................... 75 Item 12.4 Training policy ................................................................................................................................... 76 Item 12.5 Benefits for Supervisory and Management Board members ............................................................. 76 Item 12.6 Agreements concluded between GTC and Management Board members ....................................... 76 Item 12.7 Evaluation of the remuneration policy for the realization of its objectives ......................................... 76 Item 12.8 Remuneration of the Members of the Management Board and Supervisory Board .......................... 77 Item 12.9 Stock option plan ............................................................................................................................... 78 Item 13.2.1 Stock option control system ........................................................................................................... 79
Item 13. Shares in GTC held by members of the Management Board and the Supervisory Board ....................... 79 Item 14. Material transactions with related parties concluded on terms other than market terms ......................... 80 Item 15. Information on signed and terminated loan agreements within a given year ........................................... 80 Item 16. Information on contracts of which the Company is aware (including those concluded after the balance sheet date) which could result in a change in the shareholding structure in the future ......................................... 81 Item 17. Proceedings before a court or public authority involving Globe Trade Centre SA or its subsidiaries the total value of the liabilities or claims of which amount to at least 10% of the Group's equity ................................. 81 Item 18. Material contracts signed during the year, including insurance contracts and co-operation contracts ... 81 Item 19. Agreements with an entity certified to execute an audit of the financial statements ................................ 81

9
Item 1. Introduction The GTC Group is a leading developer and commercial real estate manager in CEE and SEE, operating in Poland, Romania, Hungary, Croatia, Serbia and Bulgaria. Additionally, it holds land in Ukraine and Russia and operates in the Czech Republic through its associates and joint ventures. The Group was established in 1994 and has been present in the real estate market for approximately 20 years.
The Group’s portfolio comprises: (i) completed commercial properties; (ii) commercial properties under construction; (iii) a commercial landbank intended for future development or for sale and (iv) residential projects and landbank.
Since its establishment and as at 31 December 2015 the Group: (i) has developed approximately 950 thousand sq. m of commercial space and approximately 300 thousand sq. m of residential space and (ii) has sold approximately 430 thousand sq. m of commercial space in completed commercial properties and approximately 299 thousand sq. m of residential space.
As of 31 December 2015, the Group`s property portfolio comprised the following properties:
25 completed commercial properties, including 20 office properties and 5 retail properties with a combined commercial space of approximately 524 thousand sq. m, of which the Group's proportional interest amounts to approximately 500 thousand sq. m of NRA;
3 commercial projects under construction, including 2 office projects and 1 retail project with total NRA of approximately 90 thousand sq. m, of which the Group's proportional interest amounts to 90 thousand of NRA;
commercial landbank designated for future development, with approximately 862 thousand sq. m NRA;
residential projects and landbank designated for approximately 369 thousand sq. m NRA designated for residential use; and
3 assets held for sale, 1 retail projects (Galleria Arad in Romania) and land plots in Serbia and Poland.
As of 31 December 2015, the book value of the Group’s portfolio amounts to €1.324.413 with: (i) the Group’s completed commercial properties accounting for 80% thereof; (ii) commercial properties under construction – 8%; (iii) a commercial landbank intended for future development or for sale - 10%; and (iv) residential projects and landbank accounting for 2%. Based on the Group’s assessment approximately 96% of the portfolio is core and remaining 4% is non-core assets, including assets held for sale and residential projects.
As of 31 December 2015, the Group’s completed properties in its three most significant markets, i.e. Poland, Hungary and Romania, constitute 39%, 20% and 14% of the total book value of all completed properties.
Additionally, the Group conducts operations in the Czech Republic, through its associates. The Group’s
proportional interest in assets in Czech Republic amounts to approximately 24 thousand sq. m of NRA in two
office buildings and a shopping mall. The Group also holds a land plot located in Russia, and a land plot
designated for Ana Tower located in Romania.
Additionally, the Group manages third party assets, including: one office building in Budapest and three office buildings in Warsaw.

10
The Company’s shares are listed on the WSE and included in the WIG30 index. The Company’s shares are also included in the international MSCI index and the Dow Jones STOXX Eastern Europe 300.
The Group’s headquarters are located in Warsaw, at 5 Wołoska Street.
In the Management Board’s report references to the Company or GTC are to Globe Trade Centre S.A. and all references to the Group or the GTC Group are references to Globe Trade Centre S.A. and its consolidated subsidiaries. Expressions such as: “Shares” relate to the shares in Globe Trade Centre S.A., which were introduced to public trading on the Warsaw Stock Exchange in May 2004 and later and are marked under the PLGTC0000037 code; “Bonds” refers to the bonds issued by Globe Trade Centre S.A. and introduced to alternative trading market and marked with the ISIN codes PLGTC0000144 and PLGTC0000177; „the Report” refers to the consolidated interim report prepared pursuant to art. 92 of the Decree of the Finance Minister of 19 February 2009 on current and periodical information published by issuers of securities and conditions of qualifying as equivalent the information required by the provisions of law of a country not being a member state; “CEE” refers to the group of countries that are within the region of Central and Eastern Europe (Czech Republic, Hungary, Poland); “SEE” refers to the group of countries that are within the region of South-eastern Europe (Bulgaria, Croatia, Romania and Serbia); “net rentable area”, “NRA”, or “net leasable area”, “NLA” refer to the metric of the area of a given property as indicated by the real property appraisal experts for the purposes of the preparation of the relevant real property valuations. With respect to commercial properties, net leasable (rentable) area is all the leasable area of a property exclusive of non-leasable space, such as hallways, building foyers, and areas devoted to heating and air conditioning installations, elevators and other utility areas. The specific methods of calculation of NRA may vary among particular properties, which is due to different methodologies and standards applicable in the various geographic markets on which the Group operates; “Commercial properties” refer to properties with respect to which GTC Group derives revenue from rent and includes both office and retail properties; “EUR”, “€” or “euro” refers to the single currency of the participating Member States in the Third Stage of European Economic and Monetary Union of the Treaty Establishing the European Community, as amended from time to time; “PLN” or “zloty” refers to the lawful currency of Poland.
Presentation of financial information
Unless indicated otherwise, the financial information presented in this Report was prepared pursuant to International Financial Reporting Standards (“IFRS”) as approved for use in the European Union.
All the financial data in this Report is presented in euro and expressed in thousands unless indicated otherwise.
Certain financial information in this Report was adjusted by rounding. As a result, certain numerical figures show as totals in this Report may not be exact arithmetic aggregations of the figures that precede them.
Presentation of property information
Information on properties is presented pro rata to the Group’s holdings in each of the properties and additionally includes the properties that the Group owns through it associate in the Czech Republic. The valuation of the properties is based on the value that the Group consolidates in it consolidated financial statements and does not include the properties that the Group owns through its associate in the Czech Republic. The occupancy rate given for each of the markets is as of 31 December 2015.

11
Industry and market data
In this Report the Group sets out information relating to its business and the markets in which it operates and in which its competitors operate. The information regarding the markets, their potential, macroeconomic situation, occupancy rates, rental rates and other industry data relating to the markets in which the Group operates are based on data and reports compiled by various third-party entities. The information included in that section is not expressed in thousand and is fully based on JLL research reports.
The Group believes that industry publications, surveys and forecasts that it uses to describe the markets on which the Group operates are reliable, but it has not independently verified them and cannot guarantee their accuracy or completeness.
Moreover, in numerous cases the Group has made statements in this Report regarding the industry in which it operates based on its own experience and its examination of market conditions. The Group cannot guarantee that any of these assumptions properly reflect the Group’s understanding of the markets on which it operates. Its internal surveys have not been verified by any independent sources.
Forward-looking statements
This Report contains forward-looking statements relating to future expectations regarding the Group’s business, financial condition and results of operations. You can find these statements by looking for words such as "may", "will", "expect", "anticipate", "believe", "estimate" and similar words used in this Report. By their nature, forward-looking statements are subject to numerous assumptions, risks and uncertainties. Accordingly, actual results may differ materially from those expressed or implied by forward-looking statements. The Group cautions you not to place undue reliance on such statements, which speak only as of the date of this Report.
The cautionary statements set out above should be considered in connection with any subsequent written or oral forward-looking statements that the Group or persons acting on its behalf may issue. The Group does not undertake any obligation to review or confirm analysts’ expectations or estimates or to release publicly any revisions to any forward-looking statements to reflect events or circumstances after the date of this Report.
The Group discloses important risk factors that could cause its actual results to differ materially from its expectations under Item 3. “Key risk factors”, Item 5. “Operating and financial review”, and elsewhere in this Report. These cautionary statements qualify all forward-looking statements attributable to us or persons acting on behalf of the Group. When the Group indicates that an event, condition or circumstance could or would have an adverse effect on the Group, it means to include effects upon its business, financial situation and results of operations.
Item 2. Selected financial data
The following tables present the Group’s selected historical financial data for the financial year ended 31 December 2015 and 2014. The historical financial data should be read in conjunction with Item 5. “Operating and Financial Review” and the consolidated financial statements for the financial year ended 31 December 2015 (including the notes thereto). The Group has derived the financial data presented in accordance with IFRS from the audited consolidated financial statements for the financial year ended 31 December 2015.
Selected financial data presented in PLN is derived from the consolidated financial statements for the 12-month period ended 31 December 2015 presented in accordance with IFRS and prepared in the Polish language and based on the Polish zloty.
The reader is advised not to view such conversions as a representation that such zloty amounts actually represent such euro amounts, or could be or could have been converted into euro at the rates indicated or at any other rate.

12
For the 12-month period ended 31 December
2015 2014
(in thousands) € PLN € PLN
Consolidated Income Statement
Revenues from operations 117,363 491,035 124,284 520,153
Cost of operations (37,333) (156,198) (43,155) (180,612)
Gross margin from operations 80,030 334,837 81,129 339,541
Selling expenses (2,721) (11,384) (2,884) (12,070)
Administrative expenses (11,045) (46,211) (8,781) (36,750) Profit/(loss) from revaluation/impairment of assets, net 26,222 111,717 (194,404) (821,742)
Share of profit/(loss) in associates (8,163) (34,153) (27,568) (115,378)
Financial income/(expense), net (29,356) (122,822) (42,537) (178,026)
Net profit / (loss) 43,639 184,158 (207,390) (876,628) Basic and diluted earnings per share (not in thousands)
0.12 0.50 (0.53) (2.22)
Weighted average number of issued ordinary shares (not in thousands)
371,301,287 371,301,287 349,822,797 349,822,797
Consolidated Cash Flow Statement
Net cash from operating activities 73,109 305,882 73,252 306,591
Net cash used in investing activities (22,835) (95,702) (13,911) (58,220) Net cash from/(used in) financing activities 37,372 165,863 (32,944) (140,318) Cash and cash equivalents at the end of the period
169,472 722,205 81,063 345,515
Consolidated statement of financial position
Investment property 1,288,529 5,491,066 1,221,319 5,205,628
Inventory 3,161 13,471 23,539 100,330
Cash and cash equivalents 169,472 722,205 81,063 345,515
Total assets 1,559,550 6,646,024 1,517,064 6,466,183
Non-current liabilities 806,969 3,438,897 944,680 4,026,509
Current liabilities 131,379 559,871 145,203 618,907
Equity 621,202 2,647,256 427,181 1,820,767
Share capital 10,410 46,022 7,849 35,131

13
Item 3. Key risk factors
Risk Factors Relating to the Group’s Business
The Group’s business could be affected if the general economic conditions in the countries in which the
Group operates continue or worsen
The deterioration of the general economic conditions and the real estate market in the countries where the Group
operates may adversely affect the willingness and ability of customers to secure financing and purchase or lease
property. If such demand falls, the Group may have to sell or let its projects at a loss or may not be able to sell or
let its projects at all. A potential downturn in the general economic conditions and the real estate market in Poland
or other countries in which the Group operates may also lead to a drop in the market value of the Group’s
properties. The crisis on the financial markets may also adversely affect the Group’s business in other ways, for
example if tenants of the Group or the financial institutions that provide the Group with financing go bankrupt.
For example, due to the worsening macroeconomic situation and strong competition (which has led to a reduction
in rents which were dependent, to a large degree, on the tenants’ turnover), the Group had to lease out the Avenue
Mall Osijek shopping centre at a loss for the period running from its completion date (i.e. from 2011) to its sale in
2015. This resulted in a substantial loss of value regarding that asset. Similarly, the Group was forced to lease out
the Galleria Arad shopping centre at a loss for the period running from its completion date (i.e. from 2011), due to
the worsening macroeconomic situation and the reduction in disposable income; this has also led to a reduction in
value.
Any of these results may have a material adverse effect on the Group’s business, financial condition and results of
operations.
The Group may fail to implement its strategy
The Group is in the process of implementing its growth strategy pursuant to which it plans to: (i) expand its portfolio
by acquiring and improving yielding properties in Poland and in capital cities of selected CEE and SEE counties
where the Group operates, supplemented by selected, most attractive development projects in the Group’s
Property Portfolio; (ii) improve the efficiency of its asset management activities and maximise operating
performance and efficiency; and (iii) sell its non-core assets which may allow the Group to reduce its financial
leverage or obtain funds to be used for new investments.
As a result, certain properties and qualities of the portfolio may change in terms of geographic split, the ratio of the
value of completed properties and the value of properties under construction, as well as the portfolio’s split by
asset classes (i.e. retail, office, residential and other properties). As a result, various metrics of the Group’s
business and recurring cash flows derived from rental income may change. Moreover, no assurance can be given
that the Group’s property portfolio or future investment strategies effected pursuant to the Group’s strategy will
enhance the value of its property portfolio and increase the Group’s profitability. In particular, the success of the
Group’s business strategy relies on assumptions and contingencies that may prove to be partially or wholly
incorrect and/or inaccurate. This includes assumptions with respect to the level of profitability of the acquisition

14
targets to be completed in the future and investment criteria which have been developed by the Group for the
purpose of achieving the expected level of returns on the acquired properties.
The Group may fail to achieve its major goals due to internal and external factors of a regulatory, legal, financial,
social or operational nature, some of which may be beyond the Group’s control. In particular, volatile market
conditions, a lack of capital resources needed for expansion and the changing price of available properties for sale
in the relevant markets may hinder or make it impossible for the Group to implement the core elements of its
strategy. Moreover, expanding its presence in the asset management sector may be hindered or even impossible
due to increasing competition from other real estate managers and investors in the real estate market.
Should the Group experience these or other challenges, the Group may be unable to implement its strategy fully or
at all; it may decide to change, suspend or withdraw from its strategy or development program, and it may be
unable to achieve, or it could encounter delays in achieving, the planned synergies and desired benefits from its
strategy and development program. This could have a material adverse effect on the Group’s business, financial
condition, results of operations.
The valuation of the Group’s properties is inherently uncertain, may be inaccurate and is subject to
fluctuation
The Group presents the vast majority of its real estate properties at a fair value, which has been estimated by
external real estate valuation experts.
The valuation of property is inherently subjective and uncertain since it is done on the basis of assumptions which
may differ from actual future developments. For example, the valuation reports were prepared on the basis of
certain forecasts and assumptions regarding the real estate market in geographic markets in which the Group
operates.
The fair value of investment properties and the undeveloped landbank is established semi-annually (i.e. as of 30
June and 31 December of each year) by independent certified appraisers based on discounted projected cash
flows from the investment properties using discount rates applicable for the relevant local real estate market or, in
case of some of the real properties, using the sales comparison approach. In most instances the independent
certified appraisers do not, however, prepare valuations for 31 March and 30 September of each year. Such
valuations are reviewed internally and, if necessary, verified by the Company’s management.
There can be no assurance that the valuations of the Group’s properties (undeveloped, in progress and completed)
will reflect the actual sale prices or that the estimated yield and annual rental revenue of any property will be
attained, or that such valuations will not be subject to be challenged by, among others, the regulatory authorities.
Forecasts may prove inaccurate as a result of the limited amount and quality of publicly available data and
research regarding Poland and other markets in which the Group operates compared to mature markets.
Additional factors that impact the valuation and, specifically, the planning of projects are the construction costs as
estimated by the Group and established on the basis of current prices and future price forecasts, whereas the
actual costs may be different. Moreover, some of the valuations are based on certain assumptions regarding future
zoning decisions. Such assumptions may turn out not to be fulfilled which may result in the Group not being able to
develop certain property in line with the plan. This may adversely impact the valuation of such properties in the
future.

15
If the forecasts and assumptions on which the valuations of the projects in the Group’s portfolio are based prove to
be inaccurate, the actual value of the projects in the Group’s portfolio may differ materially from that stated in the
valuation reports. Inaccurate valuations of the Group’s properties and fluctuations in valuations may have a
material adverse effect on the Group’s business, financial condition and results of operations.
For instance, the value of some investment properties (those generating an operational loss, e.g. Galleria Arad and
Avenue Mall Osijek) and some land plots (mostly in Hungary) were adjusted to their transaction price as at 31
December 2014, which resulted in the recognition of €160,300 of net revaluation losses and the impairment of
assets in terms of investment properties and €34,100 in terms of residential projects in the twelve-month period
ended 31 December 2014.
The decrease in the value of the above-mentioned real properties negatively affected the Group’s covenants to
maintain certain levels of loan-to-value ratios established in connection with the Group’s loan agreements, and led
to breach of its obligations under the loan agreements.
In addition, a decrease in the value of the real estate properties of the Group may also negatively affect the
Group’s covenants to maintain certain levels of loan-to-value ratios established in connection with the Group’s
loans incurred to finance projects and the ability of the Group to raise and service its debt funding. Each such event
may have a material adverse effect on the Group’s business, financial condition, results of operations.
The Group’s consolidated balance sheet and income statement may be significantly affected by
fluctuations in the fair market value of its properties as a result of revaluations
The Group’s income generating properties and properties under development are independently revalued on at
least semi-annual basis in accordance with its accounting policy. Consequently, in accordance with IAS 40
“Investment Property” as adopted by the EU, any increase or decrease in the value of its properties accounted for
in accordance with fair value models recorded as a revaluation gain or loss in the Company’s consolidated income
statement for the period during which the revaluation occurs. Moreover, projects under construction which cannot
be reliably valued at fair value are valued at historical cost decreased by impairment, if any. Such properties are
tested for impairment on, at least, a semi-annual basis. If the criteria for impairment are satisfied, a loss is
recognized in the Group’s consolidated income statement.
As a result, the Group can have significant non-cash revenue gains or losses from period to period depending on
the changes in the fair value of its investment properties, whether or not such properties are sold. For instance, the
Group may recognize revaluation losses and impairment of assets and residential projects as well as profits in
other years.
If market conditions and the prices of comparable commercial real properties continue to be volatile, the Group
may continue to experience significant revaluation gains or losses from the Group’s existing properties in the
future. If a substantial decrease in the fair market value of its properties occurs, over the longer term, this may have
a material adverse effect on the Group’s business, financial condition, results of operations.
The Group’s business is dependent on its ability to actively manage its assets
A core part of the Group’s operations is the active management of its assets, which includes the management of
vacancy rates and rent levels and the terms of executed lease agreements in the case of all commercial
properties, as well as achieving the desired tenant mix in the case of retail properties. This is particularly relevant

16
with respect to the Group’s large scale commercial properties, such as Galeria Jurajska, City Gate and Avenue
Mall Zagreb. In addition to legal constraints, the Group’s ability to reduce vacancies, renegotiate rents and create a
desired tenant mix is partly subject to market-related factors. Some of these factors, such as the general economic
environment, consumer confidence, inflation and interest rates, and others are beyond the Group’s control. During
periods of recession or downturns in the economy it is more challenging for developers to attract new tenants and
to retain existing ones, and the competition between developers for each tenant is much stronger. If the Group is
unable to create or capture demand for its properties by, for example, improving tenant services or motivating its
external sales agents, it may not be able to reduce vacancy rates or renegotiate rents as desired.
A prolonged period of higher vacancy rates could lower the rents tenants generally pay and make it more difficult to
increase the average rent that the Group expects to charge. Higher vacancy rates would also increase the Group’s
overall operating costs, as it would have to cover expenses generated by empty properties or units. Any such
decrease in rental revenue or increase in operating costs could have a material adverse effect on the Group’s
business, financial condition, results of operations.
The Group’s growth and profitability will depend on the Group’s ability to identify and acquire attractive
income-generating properties, efficiently manage its portfolio and develop selected projects
In accordance with its strategy, the Group intends to expand its business through: (i) the acquisition of yielding
properties; (ii) asset management focused on unlocking value from the Group’s portfolio; and (iii) the development
of selected projects. Accordingly, the growth and profitability of the Group and the success of its proposed
business strategy depend, to a significant extent, on its continued ability to locate and acquire yielding properties at
attractive prices and on favourable terms and conditions.
The ability to identify and secure accretive value-added acquisition opportunities involves uncertainties and risks,
including the risk that the acquisition is not an income-generating one after the Group has carried out business,
technical, environmental, accounting and legal examinations of the property or project. In addition, the Group also
faces the risk that competitors may anticipate certain investment opportunities and compete for their acquisition.
Additionally, any potential acquisition of properties may give rise to pre-acquisition costs which have to be paid by
the Group even if the purchase of a property is not concluded. There can be no assurance that the Group will be
able to: (i) identify and secure investments that satisfy its rate of return objective and realise their values; and (ii)
acquire properties suitable for management in the future at attractive prices or on favourable terms and conditions.
As a part of its strategy, the Group intends to focus on maximising the operating performance and efficiency of the
active management of its income-generating commercial property portfolio. In pursuing this objective, the Group
may expend considerable resources (including funds and management time) on managing properties that do not
generate the expected returns and maintain certain ratios at the required level due to, for example, a decrease in
demand for rental units or in rental levels which are not possible to anticipate.
The failure of the Group to identify and acquire suitable properties, effectively manage its properties portfolio and
develop its projects could have a material adverse effect on the Company’s business, financial condition, results of
operations or prospects.
The Group might not receive adequate information on risks relating to, or might make errors in judgment
regarding, future acquisitions of real estate

17
The acquisition of real estate requires a precise analysis of the factors that create value, in particular the levels of
future rental values and the potential for the improvement of the NOI. Such an analysis is subject to a wide variety
of factors as well as subjective assessments and is based on various assumptions. It is possible that the Group or
its service providers will misjudge individual aspects of a given project when making acquisition decisions or that
assessments on which the Group bases its decision are inaccurate or based on assumptions that turn out to be
incorrect. Such judgment errors may lead to an inaccurate analysis and valuation of the properties by the Group in
connection with investment decisions that may only become apparent at a later stage and force us to revise the
Group’s valuation amounts downwards. The Group can also not guarantee that the service provider it chooses to
carry out its due diligence when purchasing property will identify all the risks related to the property in question. In
addition, the Group cannot guarantee that it will be able to have recourse to the seller of the property for not
disclosing such risks. If the Group does not find out about these risks, this could lead the Group to economic and
financial disadvantages. The Group cannot guarantee that it will be able to pursue remedies against the respective
seller for the non-disclosure of such risks. The occurrence of one or several of such risks could have a material
adverse effect on the Group’s business, financial condition, results of operations.
The Group cannot guarantee that it will continue to generate rental income at assumed levels
Rental levels of the Group’s properties are generally affected by overall conditions in the economy as well as the
conditions of the portfolio itself (including future acquisitions of properties and the performance of the existing
portfolio), the development of the selected existing projects, their infrastructure condition, the specific properties,
and the vacancy rates. All these elements are subject to various factors, some of which are outside the Group’s
control. In particular, due to increased competition and pressure on rents and the worsening of the financial
condition of tenants, the Group may not be able to renew the expiring leases of its current properties on favourable
terms and conditions (if at all) or find and retain tenants willing to enter into leases on terms that are at least as
favourable as those on which the Group has rented its properties thus far. Moreover, the Group’s portfolio has
included and will continue to include numerous properties with non-fixed rents tied to the turnover of the tenants.
Accordingly, if the turnover of such tenants declines, the rent payable by them will also decrease. In addition, the
Group has no impact on the operations of its tenants and may not be able to monitor on an ongoing basis the
tenants’ turnover in order to ensure that the level of turnover reflects the best and actual performance efforts of its
tenants. Consequently, the amounts of rental income generated by the Group's office and retail properties in the
past cannot be used to predict future rental income and there can be no assurance that rental income will develop
positively in the future.
Additionally, the Group’s rental income may also decrease as a result of asset disposals (for instance, the Group
estimates that the sale of Kazimierz Office Centre will reduce the Group’s annual rental income by approximately
EUR 3.7 million) or acquisitions of properties with no or unsatisfactory income-generating capabilities. As part of its
strategy, the Group is reorienting its portfolio and intends to acquire accretive and value-added properties and sell
its non-core assets. In accordance with such strategy, that newly acquired properties are intended to be integrated
with the existing portfolio and rented out in order to generate rental income for the Group. If these properties are
not fully rented and/or the rental rates are agreed below the estimated rental values, the Group may not be able to
realise its expected rates of return on the new acquisitions.
A less positive or negative development of rental income and profits could have a material adverse effect on the
Group’s business, financial condition, results of operations.

18
The termination or expiration of lease agreements or the inability to rent out existing unoccupied space
could have lasting negative effects on the Group’s profitability and on the value of the Group’s portfolio
For the Group to be profitable over the long term, the income-generating properties it owns and intends to acquire
in the future must be rented out without interruptions to the greatest extent possible. The same applies to
maintaining the valuation of the properties the Group owns and thus the valuation of the overall portfolio. To the
extent that leases are terminated or expire, the Group can give no assurance that the properties in question can be
rented out again immediately. An increased vacancy rate would result in lower rental income from the management
of the existing portfolio and in a lower valuation of the Group’s properties and overall portfolio. Expected vacancies
are already reflected in the valuation reports as of 31 December 2015. The fixed costs for maintaining vacant
spaces and the lack of rental income generated by such spaces could have a material adverse effect on the
Group’s business, financial condition, results of operations.
The Group may be unable to fully recover the costs of operating the properties from the tenants
The majority of the Group’s lease contracts are structured in a way that allow to pass on certain of the costs related
to the leased property to the tenant, including marketing cost, electricity cost on common space, real estate taxes,
building insurance, and maintenance. However, the Group is not able to pass on all such costs to the tenants,
especially in a very competitive environment, where the Company has to offer the attractive conditions to be able to
compete with the other office buildings or has to improve the conditions offered to its tenants to be able to attract a
new tenant to its retail project. Deteriorating market conditions, increased competition and tenants’ requirements
may further limit the Group’s ability to transfer such costs, in full or in part, to the tenants. The service charges of
the properties may increase due to a number of factors, including an increase in the electricity costs or an increase
in the maintenance cost. Moreover, if vacancy rates increase, the Company has to cover the portion of the service
charge that is related to the vacant space. Some lease agreements provide for the maximum value combined
rental rate and service charged paid by the tenant. In such cases, if the maintenance charges increase, the Group
is unable to pass on such costs to the tenants. For example, in the case of Galleria Arad and Avenue Mall Osijek,
due to the worsening macroeconomic conditions and strong competition, the Group was unable to pass on all the
maintenance costs to the tenants in the period running from their completion to their sale, and had to lease out
those commercial properties at a loss.
Any significant increase in the property costs that cannot be compensated by increasing the level of costs incurred
by the tenants may have an adverse effect on the Group’s business, financial condition and results of operations.
The Group may be materially affected by the loss of attractive tenants
The presence of reputable tenants, especially anchor tenants, in the Group’s retail projects is important for its
commercial success. Such tenants play an important part in generating customer traffic and making a building a
desirable location for other tenants. It may be more difficult for the Group to attract tenants to enter into leases
during periods when market rents are increasing or when general consumer activity is decreasing, or if there is
competition for such tenants from competing developments. In addition, the termination of a lease agreement by
any significant tenant may adversely affect the attractiveness of a project. The failure of such tenant to abide by
these agreements, or its bankruptcy or economic decline, may cause delays or result in a decrease in rental
income (temporary or long-term), the effect of which the Group may not be able to off-set due to difficulties in
finding a suitable replacement tenant. If the Group fails to renew the leases of important tenants, or to replace such

19
tenants in a timely manner, the Group may incur material additional costs or loss of revenues, which may, in turn,
have a material adverse effect on the Group’s business, financial condition and results of operations.
The Group faces competition from other owners, real estate managers and developers of commercial real
estate
The Group has faced and continues to face increased competition from other owners, local and international real
estate managers and developers of commercial real estate. Such competition may affect the Group’s ability to
attract and retain tenants and may reduce the rents that the Group is able to charge. Such competing properties
may have vacancy rates that are higher than the vacancy rates of the Group’s properties, which could result in their
owners being willing to make space available at lower rental rates than the Group would normally be prepared to
offer but which the Group may have to match. Competition in the real estate market may also lead to increased
marketing and development costs.
Given that the successful growth and profitability of the Group depend on: (i) the level of its vacancy rates; (ii) the
increase and maintenance of occupancy on best achievable market terms; (iii) the level of lease rent and rent
collection; (iv) optimisation of property maintenance costs; and (v) the acquisition of real estate at lowest available
prices, the increased competition from other owners, real estate managers and developers of commercial real
estate and surrounding factors could adversely affect the Group’s business, financial condition and results of
operations.
The Group may be subject to significant competition in seeking investments and may increase the
purchase price of properties to be acquired
The Company competes with a number of real estate companies and developers for properties, developments,
contractors and customers. Some of the Group’s competitors may be larger or have greater financial, technical and
marketing resources than the Group and therefore the Group may not be able to compete successfully for
investments or developments.
In addition, new acquisitions of existing properties at yields that the Company considers attractive may become
difficult to complete. Accordingly, the implementation of the Company’s strategy to make suitable investments in
prime locations may be delayed or, even, become impossible.
Competition in the real estate market may also lead to a significant increase in prices for real estate available for
sale, which could be potential targets for the Group. Each of these risks could have a material adverse effect on
the Group’s business, financial condition, results of operations.
The Group cannot assure profitability of its projects
The Group currently has a number of projects that are not profitable primarily due to insufficient occupancy rates
and rent levels, including Galleria Pietra Neamt and Galleria Arad in Romania. The Group is currently unable to
attract new tenants or increase rent levels due to factors beyond its control, in particular due to market conditions.
There can be no assurance that the Group will be able to dispose of such projects in a timely manner or restructure
such assets to limit its losses. It cannot be excluded that the Group will not consider the disposal or temporary
suspension of such projects as more commercially justifiable; in such cases, there can be no assurance that
following such actions the Group will limit its losses on a timely basis. The Group cannot exclude that it will be
forced to discontinue the realisation of such projects. Moreover, the Group's other projects may also start

20
generating losses in the future. Any such development may have a material adverse effect on the Group’s
business, financial condition, results of operations.
The Group may not be able to sell its properties on a timely basis
As part of its strategy, the Group intends to sell its non-core assets. The sale of a real estate project is usually a
complex and lengthy process. There may be situations, however, when it would be beneficial for the Group to be
able to sell one or more of its projects quickly. For example, the Group may wish to sell on short notice if it believes
that market conditions are optimal or if it is approached by a party interested in purchasing a particular property on
commercially attractive terms. The Group’s ability to sell its property quickly may, however, be hindered by a
number of factors beyond its control.
The Group’s properties may constitute collateral established in favour of entities providing external financing, which
may further restrict and/or delay their transferability if the lender’s consent must first be obtained. Several of the
Group’s projects are also held through joint ventures with third parties and may, as a result, be subject to legal
and/or contractual limitations on transferability, such as first refusal and co-sale rights, or a requirement to obtain
joint approval for any such sale. Such limitations could adversely affect the Group’s ability to complete a
transaction and to generate cash as needed through the timely sale of its projects at favourable prices or to vary its
portfolio in response to economic or other conditions impacting the property value. If the Group cannot sell a
particular project within a reasonable time, it may not be able to generate the cash flow it may require to service
ongoing operations or invest in new projects, or it may be unable to take advantage of favourable economic
conditions or mitigate the impact of unfavourable economic conditions should they arise, which could have a
material adverse effect on the Group’s business, financial condition, results of operations.
The Group's properties could suffer damage due to undiscovered defects or external influences
The Group's properties could suffer damage due to undiscovered or underestimated defects or from external
influences (e.g., earthquakes, floods, landslides or mining damage). In addition to the significant health risks and
related costs, the Group could also be required to pay for the removal and disposal of hazardous substances, as
well as the related maintenance and restoration work, without the ability to pass those costs onto third parties. The
occurrence of any such risk could have a material adverse effect on the Group’s business, financial condition,
results of operations.
If a given property is currently under renovation or modernisation, there can be no assurance that any space which
has not been pre-leased, can be let or otherwise marketed during or following the renovation or modernisation
phase on the appropriate terms and conditions. Such developments could have a material adverse effect on the
Group’s business, financial condition, results of operations.
Failure to obtain the required zoning or construction permits, or any other approvals in a timely manner or
at all may delay or prevent the development of certain of the Group’s projects
The Group cannot guarantee that any permits, consents or approvals required from various government entities in
connection with existing or new development projects will be obtained by the Group in a timely manner, or that they
will be obtained at all, or that any current or future permits, consents or approvals will not be withdrawn. For
example, as part of its operations in Poland, the Group, as is the case with other real estate developers, may
occasionally purchase land that is not zoned as commercial. Any commercial development on such properties
requires either a new local spatial development plan (miejscowy plan zagospodarowania przestrzennego) (“LSDP”)

21
or planning permission (decyzja o warunkach zabudowy). The adoption of a revised LSDP or the issuance of
favourable planning permission cannot be guaranteed, and the Group has encountered difficulties in the past in
effecting changes to LSDPs and in obtaining such permissions. In addition, civic and environmental groups as well
as owners of neighbouring properties and local residents may try to frustrate the obtainment of the necessary
permits, consents or approvals.
As a general rule, the Group purchases land which it designates for a specific purpose and for a specific project.
Nevertheless, there are instances when it is merely a possibility that property acquired thereby will be available for
any specific development. In such circumstances, it may be necessary for a new LPZP to be adopted or to obtain
the relevant planning permission. However, the Group may wish to alter certain projects in order to put them to a
more profitable use but may be unable to do so as a result of not being able to obtain the required approvals and
permits.
If the Group cannot obtain the required approvals and permits in a timely manner or at all, its projects will be
delayed or cancelled, which could have a material adverse effect on the Group’s business, financial condition,
results of operations.
The Group may be subject to increased costs or project delays or cancellations if it is unable to hire
general contractors to build its projects on commercially reasonable terms, or at all, or if the general
contractors it hires fail to build the Group’s projects to accepted standards, in a timely manner or within
budget
The Group outsources the construction of its projects to general contractors. The successful construction of the
Group’s projects depends on its ability to hire general contractors to build its projects to accepted standards of
quality and safety on commercially reasonable terms, within the limits of an agreed timeframe or an approved
budget. The Group’s failure to hire general contractors on commercially reasonable terms could result in increased
costs. Failure to hire general contractors at all could result in project delays or cancellations. Failure of the general
contractors to meet accepted standards of quality and safety or to complete the construction within the agreed
timeframe or within an approved budget may result in increased costs, project delays or claims against the Group.
In addition, it may damage the Group’s reputation and affect the marketability of the completed property. If the
Group is unable to enter into contracting arrangements with quality general contractors or subcontractors on
commercially reasonable terms, or their performance is substandard, this could have a material adverse effect on
the Group’s business, financial condition, results of operations.
The financial strength and liquidity of the Group’s general contractors may be insufficient in the case of a severe
downturn in the real estate market, which, in turn, could lead to their insolvency. Although most of the Subsidiaries’
agreements with general contractors provide for the indemnification of the Subsidiaries against any claims raised
by sub-contractors engaged by such general contractors, there can be no assurance that such indemnification
provisions will be fully effective, in particular if such indemnification is challenged in court. The Group endeavours
to require general contractors to secure the performance of their obligations under their respective agreements, in
particular by presenting bank guarantees. However, there can be no assurance that such guarantees will cover the
entire costs and damages incurred by the Group in connection with the non-performance of agreements entered
into with general contractors.
The Group’s reliance on general contractors and subcontractors exposes it to risks associated with the poor
performance of such contractors and their subcontractors and employees and construction defects. The Group

22
may incur losses as a result of being required to engage contractors to repair defective work or pay damages to
persons who have suffered losses as a result of such defective work. Furthermore, these losses and costs may not
be covered by the Group’s professional liability insurance, by the contractor or by any relevant subcontractor – in
particular in the case of the architects engaged by the general contractors as both the scope of their liability and
their financial strength is limited in comparison to the value of the Group’s projects. If the performance of the
Group’s general contractors or subcontractors is substandard, this could have a material adverse effect on the
Group’s business, financial condition, results of operations.
The Group may face claims for defective construction and risks associated with adverse publicity, which
could have an adverse effect on its competitive position
The construction, lease and sale of properties are subject to a risk of claims for defective construction, corrective or
other works and associated adverse publicity. There can be no assurance that such claims will not be asserted
against the Group in the future, or that such corrective or other works will not be necessary. Further, any claim
brought against the Group, and the surrounding negative publicity concerning the quality of the Group’s properties
or projects, irrespective of whether the claim is successful, could also have a material adverse effect on how its
business, properties and projects are perceived by target customers, tenants or investors. This could negatively
affect the Group’s ability to market, lease and sell its properties and projects successfully in the future, which could
have a material adverse effect on the Group’s business, financial condition, results of operations.
The construction of the Group’s projects may be delayed or otherwise negatively affected by factors over
which the Group has limited or no control
The construction of the Group’s projects may be delayed or otherwise negatively affected by, among others, the
following factors over which the Group has limited or no control:
increased material, labour or other costs, which may make completion of the project uneconomical;
acts of nature, such as harsh climate conditions, earthquakes and floods, that may damage or delay the
construction of properties;
industrial accidents, deterioration of ground conditions (for example, the presence of underground water)
and potential liability under environmental laws and other laws related to, for example, ground
contamination, archaeological findings or unexploded ordnance;
acts of terrorism, riots, strikes or social unrest;
building code violations or as yet undetected existing contamination, soil pollution, or construction
materials that are determined to be harmful to health;
changes in applicable laws, regulations, rules or standards that take effect after the commencement by
the Group of the planning or construction of a project that result in the incurrence of costs by the Group or
delays in the development of a project; and
defective building methods or materials.

23
The inability to complete the construction of a project on schedule, within budget or at all for any of the above or
other reasons may result in increased costs or cause the project to be delayed or cancelled, which could have a
material adverse effect on the Group’s business, financial condition, results of operations.
The Group is subject to general development risks that may increase costs and/or delay or prevent the
development of its projects
Development of certain of the Group’s projects has not yet begun and these projects do not as of the date of
delivery of this Report generate any revenues. The successful development of these projects is an important factor
for the Group’s future success, and involves a large number of highly variable factors which are complex and
inherently subject to risk. Development risks to which the Group is sensitive include, among others:
additional construction costs for a development project being incurred in excess of the amount originally
agreed with the general contractor;
liability to subcontractors related with bankruptcy of the general contractor;
changes in existing legislation or the interpretation or application thereof (e.g. an increase of the rate of
the goods and services tax, which impacts the demand for housing);
actions of governmental and local authorities resulting in unforeseen changes in urban planning, zoning
and architectural requirements;
potential defects or restrictions in the legal title to plots of land or buildings acquired by the Group, or
defects, qualifications or conditions related to approvals or other authorisations relating to plots of land
held by the Group;
the Group’s potential inability to obtain financing on favourable terms or at all for individual projects or in
the context of multiple projects being developed at the same time;
potential liabilities relating to acquired land, properties or entities owning properties with respect to which
the Group may have limited or no recourse;
tenants’ unwillingness to vacate a development site;
obligations regarding the development of adjacent properties;
inability to receive required zoning permissions for intended use;
discrepancies between the planned area and the post-construction area of developments; and
obligations relating to the preservation and protection of the environment and the historic and cultural
heritage of Poland and other jurisdictions in which the Group conducts its operations, as well as other
social obligations.
These factors, including factors over which the Group has little or no control, may increase costs, give rise to
liabilities or otherwise create difficulties or obstacles to the development of the Group’s projects. The inability to
complete the construction of a property on schedule or at all for any of the above reasons may result in increased

24
costs or cause the projects to be delayed or cancelled, which may have a material adverse effect on the Group’s
business, financial condition, results of operations.
Without sufficient local infrastructure and utilities, the construction of the Group’s projects may be
delayed or cancelled, or it may be unable to realise the full expected value of its completed projects
The Group’s projects can only be carried out if the sites on which they are located have access to the relevant
technical infrastructure required by law (e.g. internal roads, utility connections, and fire prevention equipment and
procedures). In cases where such sites do not have the required infrastructure, a use permit for the project may not
be issued until such infrastructure is assured. It is also possible that the relevant authorities may require the Group
to develop the relevant infrastructure as a part of the works related to the project, which may have a significant
impact on the costs of the construction works. The authorities may also demand that the investor develop technical
infrastructure that is not required from the project’s perspective, but may be expected by the authorities as a
contribution by the investor to the development of the local municipality.
In addition to the necessity of having adequate infrastructure during the construction process, the viability of the
Group’s projects, once completed, depends on the availability and sufficiency of the local infrastructure and utilities.
In some cases, utilities, communications and logistics networks have not been adequately funded or maintained in
recent decades and may be non-existent, obsolete or experience failures. To be sufficient, the existing local
infrastructure and utilities may need to be improved, upgraded or replaced. As a consequence of this lack of
maintenance, for example, the Group may from time to time experience shortages in the availability of energy and
other utilities. There can be no assurance that improvements to the infrastructure in and around the Group’s
projects, or the infrastructure integrated into its projects, will be completed prior to the completion of the projects or
that any such improvement will be sufficient to support the Group’s completed projects. This may have a material
adverse effect on the Group’s business, financial condition, results of operations.
The Group is reliant on partners and co-investment agreements for a portion of its developments and
faces counterparty risks
The Group sometimes acquires and/or develops properties in partnership with other investors, in particular, with
local and international developers, banks, landowners and other partners. In these investments, the Group may not
have exclusive control over the identification or acquisition of property or the development, financing, leasing,
management and other aspects of these investments, nor can it control the conduct of its joint venture partners nor
guarantee that they will be able to secure the optimum realisation of such projects. In addition, the partner may
have interests or aims that are inconsistent with, and which may impede, the Group’s interests or aims. In these
investments, the Group may rely on the resources of its partners and any disagreement with a partner could lead
to a significant disruption of a project or result in litigation, even if the Group is able to assume control of the
project. These circumstances may have an adverse effect on the Group’s business, financial condition, results of
operations.
Furthermore, a Subsidiary may be a party to a shareholders agreement imposing some restrictions on it, including,
inter alia, in relation to the disposal of its interest, and its income and capital distribution entitlements. Such a
shareholders agreement, other than a joint arrangement in the meaning of IFRS 11, may entitle the other
shareholders to preferential income or capital returns on, or other rights in relation to, the investment in certain
circumstances and/or pre-emption rights on the sale of the Subsidiary’s interest. Any such shareholders agreement
may also impose obligations on the Subsidiary that is party thereto. Any of these matters may affect the value of

25
the Group company’s investment in such properties. In addition, the Group company may be jointly and severally
liable for costs, taxes or liabilities with its co-investors and, in the event of their default, the Group company may be
exposed to more than its proportionate share of the cost, tax or liability in question. This could have an adverse
effect on the Group’s business, financial condition and results of operations.
The Group is also exposed to the credit risk of its counterparties in such partnership or co-investment agreements
and their ability to satisfy the terms of contracts Group Companies have with them. The relevant Group company
could experience delays in liquidating its position and suffer significant losses, including declines in the value of its
investment during the period in which it seeks to enforce its rights or an inability to realise any gains on its
investment during such period and may incur fees and expenses in enforcing its rights. There is a risk that control
cannot be exercised efficiently and quickly, especially in the event of the bankruptcy or insolvency of the partner.
The relevant Group company may have to continue financing the project even if the partner is in breach of its
agreement with the relevant Group company. This may have an adverse effect on the Group’s business, financial
condition, results of operations.
The Group may be subject to liability following the disposal of investments
When the Group disposes of its projects, it may be required to give certain representations, warranties and
undertakings which, if breached, could result in liability to pay damages. As a consequence, the Group may
become involved in disputes or litigation concerning such provisions and may be required to make payments to
third parties, which may have a material adverse effect on the Group’s business, financial condition, results of
operations.
The Group may be exposed to certain environmental liabilities and compliance costs
The environmental laws in CEE and SEE impose existing and potential requirements to conduct remedial action on
sites contaminated with hazardous or toxic substances. Such laws often impose liability without regard to whether
the owner of such site knew of, or was responsible for, the presence of such contaminating substances. In such
circumstances, the owner’s liability is generally not limited under such laws, and the costs of any required removal,
investigation or remediation can be substantial. The presence of such substances on any of the Group’s
properties, or the liability for the failure to remedy contamination from such substances, could adversely affect the
Group’s ability to sell or let such property or to borrow funds using such property as collateral. In addition, the
presence of hazardous or toxic substances on a property may prevent, delay or restrict the development or
redevelopment of such property, which could have a material adverse effect on the Group’s business, financial
condition, results of operations.
The Group may be subject to legal disputes and risks
The Group’s business involves the acquisition, rental, sale and administration of properties, including under
cooperation agreements that, as a matter of ordinary course of business, expose the Group to a certain amount of
small-scale litigation and other legal proceedings. Legal disputes which, taken individually, are relatively
immaterial, may be joined with disputes based on similar facts such that the aggregate exposure of the Group
might become material to its business. Furthermore, the Group may face claims and may be held liable in
connection with incidents occurring on its construction sites such as accidents, injuries or fatalities of its
employees, employees of its contractors or other visitors on the sites. It is standard practice in real estate
transactions for the seller to make representations and warranties in the purchase agreement concerning certain

26
features of the property. Typically, the assurances the seller gives regarding the property in the purchase
agreement do not cover all of the risks or potential problems that can arise for the Group in connection with the
purchase of property by the Group. In addition, the Group may be unable, for a variety of reasons, including, in
particular, the seller’s insolvency, to enforce its claims under these assurances. If this were to occur, the Group
may suffer a financial loss.
Moreover, if the Group's properties are subjected to legal claims by third parties and no resolution or agreement is
reached, these claims can delay, for significant periods of time, planned actions of the Group. Such situations may
include, for example, claims from third parties relating to plots of land where the Group has developed and
completed a real estate asset which it then intends to sell, as well as claims from third parties relating to specific
land plots the Group needs to acquire in order to complete a particular project (for example plots adjoining plots it
owned as of the date of the delivery of this Report), which could delay the acquisition by the Group of such plots.
The occurrence of one or several of the aforementioned risks could have a material adverse effect on the Group’s
business, financial condition, results of operations.
When leasing or selling real estate, the Group could be faced with claims for guarantees for which it does
not have adequate recourse
The Group provides different types of guarantees when it leases real estate, especially with regard to legal title and
the absence of defects in quality, as well as existing contamination and the portfolio of leases. The same applies to
the sale of real estate. Claims could be brought against the Group for breach of these guarantees. Defects of
which the Group was not aware, but of which it should have been aware, when it concluded the transaction pose a
particular risk. The Group's possible rights of recourse towards the sellers of properties could fail due to the inability
of the persons in question to demonstrate that they knew or should have known about the defects, due to the
expiration of the statute of limitations, due to the insolvency of the parties opposing the claim, or for other reasons.
The occurrence of one or several of the aforementioned risks could have a material adverse effect on the Group’s
business, financial condition, results of operations.
The Group’s insurance may be inadequate
The Group’s insurance policies may not cover it for all losses that may be incurred by the Group in the conduct of
its business, and certain types of insurance are not available on commercially reasonable terms or at all. As a
result, the Group’s insurance may not fully compensate it for losses associated with damage to its real estate
properties. In addition, there are certain types of risks, generally of a catastrophic nature, such as floods,
hurricanes, terrorism or acts of war that may be uninsurable or that are not economically insurable. Other factors
may also result in insurance proceeds being insufficient to repair or replace a property if it is damaged or
destroyed, such as inflation, changes in building codes and ordinances and environmental considerations. The
Group may incur significant losses or damage to its properties or business for which it may not be compensated
fully or at all. As a result, the Group may not have sufficient coverage against all losses that it may experience.
Should an uninsured loss or a loss in excess of insured limits occur, the Group could lose capital invested in the
affected developments as well as anticipated future revenues from such project. In addition, the Group could be
liable to repair damage caused by uninsured risks. The Group could also remain liable for any debt or other
financial obligation related to such damaged property. No assurance can be given that material losses in excess of
insurance coverage limits will not occur in the future. Any uninsured losses or losses in excess of insured limits
could have a material adverse effect on the Group’s business, financial condition, results of operations.

27
The Group is dependent on a limited number of key members of its management
The Group's success depends on the activities and expertise of the members of its management. If the Group is
unable to retain the key members of its management, this could result in a significant loss of expertise and could
have a material adverse effect on the Group’s business, financial condition, results of operations.
Shortages of qualified employees and other skilled professionals could delay the completion of the
projects of the Group or increase its costs
The Group relies on a skilled team of professionals, including its key management and project managers, mid-level
managers, accountants and other financial professionals, in the development of its projects. If the Group is unable
to hire the necessary employees, staffing shortages may adversely affect its ability to adequately manage the
completion of its projects and efficiently manage its assets or force it to pay increased salaries to attract skilled
professionals or the necessary employees. Furthermore, the future success of the Group depends on its ability to
hire senior personnel such as managers with extensive experience in the identification, acquisition, financing,
construction, marketing and management of development projects and investment properties. The failure by the
Group to recruit and retain appropriate personnel may have a material adverse effect on the Group’s business,
financial condition, results of operations.
Risk Factors Relating to the Group’s financial condition
The Group's substantial leverage and debt service obligations are significant and could increase,
adversely affecting its business, financial condition or results of operations
As of the date of the delivery of this Report the Group is highly leveraged and have significant debt service
obligations. The Group had approximately €1,089,883 and€938,348 of total non-current and current consolidated
liabilities (including hedging instruments) as of 31 December 2014 and 31 December 2015, respectively.
The Group anticipates that its high leverage could continue for the foreseeable future.
The Group's high leverage could have material consequences for investors, including, but not limited to, could lead
to the following:
increasing vulnerability to and simultaneously reducing flexibility to respond to downturns in the Group's
business or general adverse economic and industry conditions, including adverse economic conditions in
the jurisdictions in which the Group operates;
limiting the Group's ability to obtain additional financing to fund future operations, capital expenditures,
business opportunities, acquisitions and other general corporate purposes and increasing the cost of any
future borrowings;
forcing the Group to dispose of its properties in order to enable it to meet its financing obligations,
including compliance with certain covenants under loan agreements;
requiring the dedication of a substantial portion of the Group's cashflows from operations to the payment
of the principal of and interest on its indebtedness, meaning that these cashflows will not be available to
fund its operations, capital expenditures, acquisitions or other corporate purposes;

28
limiting the Group's flexibility in planning for, or reacting to, changes in its business, the competitive
environment and the real estate market; and
placing the Group at a competitive disadvantage compared to its competitors that are not as highly
leveraged.
Any of these or other consequences or events could have a material adverse effect on the Group's ability to satisfy
its obligations.
In addition, the Group may incur additional indebtedness in the future. The incurrence of additional indebtedness
would increase the leverage-related risks described in this Report and may have a material adverse effect on the
Group’s business, financial condition, results of operations.
The Group may incur substantial losses if it fails to meet the obligations and requirements of its debt
financing and, furthermore, the restrictions imposed by its debt financing may prevent it from selling its
projects
In order to secure its loans, the Group has in the past and/or may in the future mortgage its assets, pledge
participation interests in its subsidiaries, enter into guarantees and covenant to its creditors that it would not
establish any further mortgages or pledges on its present and/or future assets without their consent (negative
pledges provisions). In addition, the Group’s loans contain restrictions on its ability to dispose of certain key assets,
which in turn may be required in order to satisfy certain financial covenants. The Group could fail to make principal
and/or interest payments due under the Group’s loans or breach any of the covenants included in the loan
agreements to which the Group has entered. In some cases, the Group may breach these covenants due to
circumstances which may be beyond the control of the Group. These may include requirements to meet certain
loan-to-value ratio, debt service coverage and working capital requirements. A breach of such covenants by the
Group could result in the forfeiture of its mortgaged assets, the acceleration of its payment obligations, the
acceleration of payment guarantees, trigger cross-default clauses or make future borrowing difficult or impossible.
In these circumstances, the Group could also be forced in the long term to sell some of its assets to meet its loan
obligations or the completion of its affected projects could be delayed or curtailed.
In the past the Group breached certain covenants relating to the maintenance of the LTV ratios imposed by loan
agreements. Consequently, the Company was forced, inter alia, to: (i) reclassify its obligations under the loan
agreements from long-term liabilities to current liabilities because their recovery period was shorter than 12 months
(in the case of the Galleria Arad and Galleria Stara Zagora projects); (ii) renegotiate loan agreements and sign
restructuring agreements (in the case of the Galleria Piatra Neamt, Galleria Arad and Galleria Stara Zagora
projects); or (iii) dispose of real properties or projects (in the case of the Galleria Varna project). There can be no
assurance that such breaches will not repeat in the future or that the Group will be able to cure them promptly or at
all.
Any of the events described above could have a material adverse effect on the Group’s business, financial
condition, results of operations.

29
The Group might be unable to renew or refinance loans as they mature, or might be able to renew or
refinance such loans only on less favourable terms
All of the Group's real estate developments have been financed through loans, which have been provided for a
limited term. The Group might not be able to renew or refinance the remaining obligations in part or at all or might
have to accept less favourable terms in respect of such refinancing. If the Group is unable to renew a loan or
secure refinancing, the Group could be forced to sell one or more of its office properties in order to procure the
necessary liquidity. Additionally, if the Group is not able to renew certain loans, those properties which are financed
through loans will become low leveraged and, as a consequence, will not be able to generate the expected returns
on equity. Any combination of the above would have material adverse effects on the Group's business, cash flows,
financial condition and results of operations.
The Group is exposed to changes in foreign currency exchange rates
The Group’s financial statements are expressed in Euro and the Company’s functional currency is the Euro.
Moreover, the majority of the Group’s revenues, specifically rent revenues, are expressed in Euro. However,
certain of the Group’s costs, such as certain construction costs, labour costs and remuneration for certain general
contractors, are incurred in the currencies of the respective geographical markets, including Polish złoty, Bulgarian
leva, Czech korunas, Croatian kunas, Hungarian forints, Romanian lei or Serbian dinars.
In making the assumptions regarding the level of equity required to implement its strategic objectives, the Group
used Euro as the reference currency. Additionally the majority of the investments that the Group plans to make as
part of its business strategy will be expressed in Euro. Therefore, no assurance can be given that the proceeds
derived and expressed in Polish zloty will suffice to meet the investment requirements of the Group’s contemplated
acquisition pipeline. Whilst the companies of the Group may engage in currency hedging in an attempt to reduce
the impact of currency fluctuations and the volatility of returns that may result from their currency exposure by, inter
alia, entering into derivatives transactions, obtaining debt financing denominated in Euro, as well as concluding
agreements with contractors specifying remuneration expressed in Euro, there can be no assurance that such
hedging will be fully effective or beneficial. Moreover, given the fact that certain contractors of the Group engage in
hedging arrangements with respect to their remuneration on the basis of, inter alia, construction contracts, their
flexibility to postpone certain phases of construction may be limited and may result in their financial distress. In
addition, given that payments under most of the Group’s commercial leases are expressed as the local currency
equivalent of a euro-denominated amount, some of the Group’s tenants, specifically those leasing retail space,
may face difficulties in meeting their payment obligations under such leases as they derive revenues in their
respective local currencies. Consequently, any future material appreciation of the local currencies against the Euro
could significantly decrease the Group’s income in terms of the local currencies and could have a material adverse
effect on the Group’s business, financial condition, results of operations.
The Group is subject to interest rate risk
The Group currently has and intends to incur certain indebtedness under existing debt facilities which is subject to
variable interest rates. Interest rates are highly sensitive to many factors, including government monetary policies
and domestic and international economic and political conditions, as well as other factors beyond the Group’s
control. The Group’s exposure to interest risk and the extent to which the Group attempts to hedge such exposure
vary significantly between the geographical markets in which the Group operates, but any changes in the relevant

30
interest rates may increase the Group’s costs of borrowing in relation to existing loans, thus impacting its
profitability. The need to hedge interest rate risk is reviewed by the Group on a case by case basis, except for
those projects in which the lenders require it to hedge the relevant interest rate risk. Changes in interest rates may
have a material adverse effect on the Group’s business, financial condition, results of operations.
The Group’s business is capital intensive, and additional financing may not be available on favourable
terms, on a timely basis or at all
The Group requires substantial up-front expenditures for land acquisition, development construction and design
costs. As a result, the Group requires substantial amounts of cash and construction financing from banks for its
operations. The Group’s capital needs depend on many factors, in particular on market conditions, which are
beyond the Group’s control. Should its capital needs differ significantly from those currently planned, the Group
might require additional financing. In the case of difficulties in obtaining additional financing, the scale of the
Group’s growth and the pace of achievement of certain strategic objectives can be slower than originally assumed.
It is not certain whether the Group will be able to obtain the required financing if needed or if such funds will be
provided on conditions favourable to the Group.
In addition, construction loan agreements generally permit the drawdown of the loan funds against the
achievement of predetermined construction and space leasing milestones or the sale of a specific number of flats.
If the Group fails to achieve these milestones, the availability of the loan funds may be delayed, thereby causing a
further delay in the construction schedule. Restrictions of or delays in the access to sources of external financing
and conditions of such financing that are less favourable than assumed can have a material adverse effect on the
Group’s business, financial condition, results of operations.
Risk Factors Relating to the Macroeconomic, Political and Legal Environment in the Markets where the
Group Operates
Political, economic and legal risks associated with countries in emerging markets, including CEE and SEE
countries
All of the Group’s revenues are attributable to operations in CEE and SEE countries, particularly Poland, Romania
and Hungary. These markets are subject to greater risk than more developed markets. CEE and SEE countries still
present various risks to investors, such as instability or changes in national or local government authorities, land
expropriation, changes in taxation legislation or regulation, changes to business practices or customs, changes to
laws and regulations relating to currency repatriation and limitations on the level of foreign investment or
development. In particular, the Group is affected by rules and regulations regarding foreign ownership of real
estate and personal property. Such rules may change quickly and significantly and, as a result, impact the Group’s
ownership and may cause it to lose property or assets without legal recourse.
Furthermore, some countries may regulate or require governmental approval for the repatriation of investment
income, capital or the proceeds of sales of securities by foreign investors. In addition, if there is a deterioration in a
country’s balance of payments or for other reasons, a country may impose temporary restrictions on foreign capital
remittances abroad. Any such restrictions may adversely affect the Group’s ability to repatriate investment loans or
to remit dividends. Some CEE and SEE countries, have experienced substantial, and in some periods extremely
high, rates of inflation for many years. Inflation and rapid fluctuations in inflation rates have had and may continue
to have negative effects on the economies and securities markets of certain emerging countries.
31
In addition, adverse political or economic developments in neighbouring countries could have a significant negative
impact on, among other things, gross domestic product, foreign trade or economies in general of individual
countries. The countries and the region in which the Group operates have experienced and may still be subject to
potential political instability caused by changes in governments, political deadlock in the legislative process, tension
and conflict between federal and regional authorities, corruption among government officials and social and ethnic
unrest. In particular, the armed conflict in the territory of Ukraine and uncertainties regarding the relationship with
Russia may affect the attitude of investors towards the regional real estate market and their willingness to invest in
the countries neighbouring with Ukraine and Russia, where the Group operates.
The Group may not be able to realise its expected rates of return if the real estate markets in CEE and SEE
countries in which the Group operates become saturated and competition increases. Real estate markets may
reach saturation if the supply of properties exceeds demand. Saturation in these markets would result in an
increase in vacancy rates and/or a decrease in market rental rates and sale prices. As the commercial real estate
markets in CEE and SEE are characterised predominantly by short-term leases, the Group expects that rental
rates will decrease promptly in response to a perceived oversupply of lettable commercial space in those markets.
If vacancy rates rise and/or market rental rates decrease, the Group may not be able to realise its expected rates
of return on its projects or may be unable to let or sell its properties at all, which could have a material adverse
effect on the Group’s business, financial condition, results of operations.
The materialisation of any of the foregoing risks would have a material adverse effect on the Group’s business,
financial condition, results of operations.
The real estate market is cyclical
The real estate market is cyclical. Consequently, the number of projects completed by the Group has varied from
year to year, depending on, among other things, general macro-economic factors, changes in the demographics of
specific metropolitan areas, availability of financing and market prices of existing and new projects. Typically,
growing demand results in greater expectations regarding the achieved profits and an increase in the number of
new projects, as well as increased activity on the part of the Group’s competitors. Because of the significant lag
time between the moment a decision is taken to construct a project and its actual delivery, due in part to the
protracted process of obtaining the required governmental consents and construction time, there is a risk that once
a project is completed, the market will be saturated and the developer will not be able to lease or sell the project
with the anticipated level of profits. An upturn in the market is typically followed by a downturn as new developers
are deterred from commencing new projects due to reduced profit margins. There can be no assurance that during
a downturn in the market the Group will be able to select projects which will fill actual demand during an upturn in
the market. Additionally, the corporate bodies of the respective Group Companies that are expected to make
certain investment decisions may not be able to properly asses the cycle of the real estate market and,
consequently, accurately define the most favourable stage for completing the given investments.
All such events may have a material adverse effect on the Group’s business, financial condition, results of
operations.
The locations of the Group’s properties are exposed to regional risks and could lose some of their appeal
The locations of each of the properties are influenced by macro-economic developments in the regions in which
the Group operates, as well as being subject to specific local conditions in a given regional market. The Group’s

32
real estate portfolio focuses on commercial premises, which significantly exposes the Group to negative
developments in those segments of the real estate market in the countries where the Group operates, including
intensified competition or increased saturation.
Insolvencies, close-downs or moves of large companies or companies from individual or several sectors as a
consequence of adverse developments or for other reasons could have a negative effect on the economic
development of the location in question and, consequently, on the Group’s portfolio as a whole. The Group has no
control over such factors. Negative economic developments at one or more of the locations could reduce the
Group’s rental income or result in a loss of rent, which stem from a number of tenants being unable to pay their
rent in full or in part, as well as cause a decline in the market value of the Group’s properties, which may have a
material adverse effect on the Group’s business, financial condition, results of operations.
Changes in tax laws or their interpretation could affect the Group’s financial condition and the cash flows
available to the Group
Tax regulations in number of countries the Group operates in, including Poland, are complex and they are subject
to frequent changes. The tax law practice of the tax authorities is not homogenous and there are rather significant
discrepancies between the judicial decisions issued by administrative courts in tax law matters. No assurance may
be given by the Company that the tax authorities will not employ a different interpretation of the tax laws which
apply to the Group Companies, which may prove unfavourable to the Group. One may not exclude the risk that the
specific individual tax interpretations already obtained and applied by the Group Companies will not be changed or
questioned. There is also a risk that once new tax law regulations are introduced, the Group Companies will need
to take actions to adjust thereto, which may result in greater costs forced by circumstances related with complying
with the changed or new regulations.
In light of the foregoing, there can be no assurance given that the tax authorities will not question the accuracy of
tax reporting and tax payments made by the Group Companies, in the scope of tax liabilities not barred by the
statute of limitations, and that they will not determine the tax arrears of the Group Companies, which may have a
material adverse effect on the Group Companies’ business, financial standing, growth prospects or results of the
Group.
Moreover, in relation to the cross-border nature of the Group’s business, the international agreements, including
the double tax treaties, to which the Republic of Poland is a party, also have an effect on the Group Companies’
business. Different interpretations of the double tax treaties by the tax authorities as well as any changes to these
treaties may have a material adverse effect on the business, financial standing or results of the Group Companies.
The related-party transactions carried out by the Group Companies could be questioned by the tax
authorities
The Group Companies have carried out transactions with related parties. When concluding and performing related-
party transactions, the Group Companies endeavour to take special care to ensure that such transactions comply
with the applicable transfer pricing regulations. However, due to the specific nature of related-party transactions,
the complexity and ambiguity of legal regulations governing the methods of examining the prices applied, as well
as the difficulties in identifying comparable transactions for reference purposes, no assurance can be given that
specific Group Companies will not be subject to inspections or other investigative activities undertaken by tax
authorities or fiscal control authorities. Should the methods of determining arm’s-length terms for the purpose of the

33
above transactions be challenged, this may have a material adverse effect on the business, financial standing,
growth prospects, results of the Group Companies.
Changes in laws could adversely affect the Group
The Group’s operations are subject to various regulations in Poland, Romania, Hungary, Croatia, Serbia, Bulgaria,
Slovakia and other jurisdictions in which the Group conducts business activities, such as fire and safety
requirements, environmental regulations, labour laws, and land use restrictions. If the Group’s projects and
properties do not comply with these requirements, the Group may incur regulatory fines or damages.
Moreover, there can be no assurance that if perpetual usufruct fees in Poland are increased, the Group will be able
to pass such costs onto its tenants in the form of increased service charges as such increase might lead to a given
property becoming less competitive as compared to properties not situated on land subject to perpetual usufruct
fees.
Furthermore, the imposition of more strict environmental, health and safety laws or enforcement policies in CEE
and SEE could result in substantial costs and liabilities for the Group and could subject the properties that the
Group owns or operates (or those formerly owned or operated by the Group) to more rigorous scrutiny than is
currently applied. Consequently, compliance with these laws could result in substantial costs resulting from any
required removal, investigation or remediation, and the presence of such substances on the Group’s properties
may restrict its ability to sell the property or use the property as collateral.
New, or amendments to existing, laws, rules, regulations, or ordinances could require significant unanticipated
expenditures or impose restrictions on the use of the properties and could have a material adverse effect on the
Group’s business, financial condition, results of operations.
Unlawful, selective or arbitrary government actions may impact the Group’s ability to secure the
agreements, contracts and permits required for it to develop its projects
Government authorities in the geographical markets in which the Group operates have a high degree of discretion
and may not be subject to supervision by other authorities, requirements to provide a hearing or prior notice or
public scrutiny. Therefore, government authorities may exercise their discretion arbitrarily or selectively or in an
unlawful manner and may be influenced by political or commercial considerations. The Group has faced
administrative decisions in the past which forced it to unexpectedly change its investment plans (including limiting
the scale of a project). Such discretion may have a material adverse effect on the Group’s business, financial
condition, results of operations.
The land and mortgage registry systems in certain of the CEE and SEE jurisdictions are non-transparent
and inefficient, and the Group’s properties may be subject to restitution claims
The land and mortgage registry systems in certain of the CEE and SEE jurisdictions are non-transparent and
inefficient, which may, inter alia, result in delays in the land acquisition process and the registration of many plots
into one consolidated plot, which is a requirement before certain projects can be developed. This inefficiency could
have a material adverse effect on the business, cash flows, financial condition, results of operations of the Group.
Moreover, the Group may be exposed to the inherent risk related to investing in real estate situated in CEE and
SEE countries resulting from the unregulated legal status of some of such real properties. Following the

34
introduction of nationalization in certain CEE and SEE jurisdictions, including Poland, Hungary and Czech
Republic, during the post-war years, many privately-owned properties and businesses were taken over by such
states. In many cases, the requisition of the property took place in contravention of prevailing laws. After the CEE
and SEE countries moved to a market economy system in 1989-1990, many former property owners or their legal
successors took steps to recover the properties or businesses lost after the war or to obtain compensation. For
many years efforts have been made to regulate the issue of restitution claims in Poland. Despite several attempts,
no act regulating the restitution process has been passed in Poland. Under the current law, former owners of
properties or their legal successors may file applications with the authorities for the administrative decisions under
which the properties were taken away from them to be revoked. As at the date of the delivery of this Report, there
are no proceedings underway seeking the invalidation of administrative decisions issued by the authorities
concerning properties held by the Group. There is no guarantee, however, that restitution claims may not be
brought against the Group in the future, and this could have a material adverse effect on the Group’s business,
financial condition, results of operations.
The Group’s claims to the titles to investment and development properties may be subject to challenge in
certain cases, and permits in relation to such properties may have been obtained in breach of applicable
laws
It may be difficult or, in certain cases, impossible for the Group to establish with certainty that the title to a property
has been vested in a relevant Group company due to the fact that real estate laws in Poland and other jurisdictions
in which the Group operates are complicated and often ambiguous and/or contradictory and the relevant registries
may not be reliable. For example, under the laws of Poland, transactions involving real estate may be challenged
on many grounds, including where the seller or assignor to a given property did not have the right to dispose of
such property, for a breach of the corporate approval requirements by a counterparty or a failure to register the
transfer of a title in an official register, when required. Also, even if a title to real property is registered, it may still be
contested. Therefore, there can be no assurance that the Group’s claim to a title would be upheld if challenged.
Further, it is possible that permits, authorisations, re-zoning approvals or other similar decisions may have been
obtained in breach of applicable laws or regulations. Such matters would be susceptible to subsequent challenge.
Similar issues may arise in the context of compliance with privatisation procedures and auctions related to the
acquisition of land leases and development rights. It may be difficult, or impossible, to monitor, assess or verify
these concerns. If any of these permits, authorisations, re-zoning approvals or other similar requirements were to
be challenged, this may have a material adverse effect on the Group’s business, financial condition, results of
operations.
Risk Factors Relating to the Shareholding Structure of the Company and Corporate Governance
There may be potential conflicts of interest between the Group and the Group’s controlling shareholder
LSREF III GTC Investments B.V. (“LSREF”), which is fully controlled by Lone Star Real Estate Fund III LP (with its
registered office in the United States of America) and Lone Star Real Estate Fund III LP (with its registered office in
Bermuda) (jointly, “Lone Star Real Estate Fund III”), is the Group’s controlling shareholder as of the date of the
delivery of this Report. Lone Star Real Estate Fund III, a fund specialising in real property investments, is managed
by Lone Star Funds. Lone Star Funds (“Lone Star”), is a leading private equity firm that invests globally in real
estate, equity, credit and other financial assets.

35
Lone Star’s representatives constitute the majority of the Supervisory Board and may thus control the appointment
of the Management Board. Consequently, Lone Star may influence the decision making process in the Company.
Accordingly, in considering any investment, business and operational matters of the Company and the most
appropriate uses for the Company’s available cash, the interests of Lone Star and of Lone Star Real Estate Fund
III may not be aligned with the interests of the Company or of its other stakeholders.
Moreover, Lone Star and Lone Star Real Estate Fund III operate in the same market as the Group and they may
compete over investments that the Group may be interested in.
Any such conflicts of interest may have an adverse effect on the Group’s business, financial condition, results of
operations.
Because the Company is a holding company, its ability to pay dividends depends upon the ability of its
subsidiaries to pay dividends and advance funds
The Company does not intend to pay out any dividends for at least the next four years; instead, its strategy focuses
on significantly improving its level of funds for operations. The dividend policy is strictly connected with the general
business strategy of the Group. Nonetheless, upon reaching the targeted level of funds necessary for the Group’s
operations, the Company may consider paying dividend. Moreover, the amount which may be distributed by the
Company in accordance with the Polish law depends on the net profit and certain other figures reflected in the
Company’s stand-alone financial statements. Such figures may differ from the figures included in the Group’s
consolidated financial statements which are prepared in accordance with the IFRS.
As a holding company, the Company’s ability to pay dividends depends upon the ability of its subsidiaries to pay
dividends and advance funds to the Company. Therefore, there can be no assurance that the Company will
declare or pay any dividends to its shareholders in the future. The payment and amount of any future dividends will
depend on the Management Board’s assessment of factors such as long-term growth and earnings trends, the
need for sufficient liquidity, the need for investment in the Company’s existing project portfolio, the existence of
alternative investment opportunities and the Company’s financial position in general. This may have a material
adverse effect on the Group’s business, financial condition, results of operations.
Future offerings of debt or equity securities offered by the Company may adversely affect the market price
of the Shares and dilute the shareholders’ interests
To finance future acquisitions, the Company may raise additional capital by offering debt or additional equity
securities, including convertible notes, medium-term notes, senior or subordinated notes and ordinary shares. The
issuance of equity or debt securities with conversion rights may dilute the economic and voting rights of existing
shareholders, if made without granting pre-emptive or other subscription rights, or reduce the price of the
Company’s shares, or both. The exercise of conversion rights or options by the holders of convertible or warrant-
linked bonds that the Company may issue in the future may also dilute the shareholders’ interests. Holders of the
Company’s ordinary shares have statutory pre-emptive rights entitling them to purchase a percentage of every
issuance of the Company’s ordinary shares. As a result, holders of the Company’s ordinary shares may, in certain
circumstances, have the right to purchase ordinary shares that the Company may issue in the future in order to
preserve their percentage ownership interest in the Company, thereby reducing the percentage ownership interest
of other investors. Because any decision by the Company to issue additional securities depends on market
conditions and other factors beyond the Company’s control, the Company cannot predict or estimate the amount,

36
timing or nature of any such future issuances. Thus, prospective investors bear the risk of the Company’s future
offerings reducing the market price of the Shares and diluting their interest in the Company.
Item 4. Presentation of the Group
Item 4.1. General information about the Group The GTC Group is a leading developer and commercial real estate manager in CEE and SEE, operating in Poland, Romania, Hungary, Croatia, Serbia and Bulgaria. Additionally, it holds land in Ukraine and Russia and operates in the Czech Republic through its associates and joint ventures. The Group was established in 1994 and has been present in the real estate market for approximately 20 years.
The Group’s portfolio comprises: (i) completed commercial properties; (ii) commercial properties under construction; (iii) a commercial landbank intended for future development or for sale and (iv) residential projects and landbank.
Since its establishment and as at 31 December 2015 the Group: (i) has developed approximately 950 thousand sq. m of commercial space and approximately 300 thousand sq. m of residential space and (ii) has sold approximately 430 thousand sq. m of commercial space in completed commercial properties and approximately 299 thousand sq. m of residential space.
As of 31 December 2015, the Group`s property portfolio comprised the following properties:
25 completed commercial properties, including 20 office properties and 5 retail properties with a combined commercial space of approximately 524 thousand sq. m, of which the Group's proportional interest amounts to approximately 500 thousand sq. m of NRA;
3 commercial projects under construction, including 2 office projects and 1 retail project with total NRA of approximately 90 thousand sq. m, of which the Group's proportional interest amounts to 90 thousand of NRA;
commercial landbank designated for future development, with approximately 862 thousand sq. m NRA;
residential projects and landbank designated for approximately 369 thousand sq. m NRA designated for residential use; and
3 assets held for sale, 1 retail projects (Galleria Arad in Romania) and land plots in Serbia and Poland.
As of 31 December 2015, the book value of the Group’s portfolio amounts to €1.324.413 with: (i) the Group’s completed commercial properties accounting for 80% thereof; (ii) commercial properties under construction – 8%; (iii) a commercial landbank intended for future development or for sale - 10%; and (iv) residential projects and land accounting for 2%. Based on the Group’s assessment approximately 96% of the portfolio is core and remaining 4% is non-core assets, including assets held for sale and residential projects.
As of 31 December 2015, the Group’s completed properties in its three most significant markets, i.e. Poland, Hungary and Romania, constitute 39%, 20% and 14% of the total book value of all completed properties.
Additionally, the Group conducts operations in the Czech Republic, through its associates. The Group’s
proportional interest in assets in Czech Republic amounts to approximately 24 thousand sq. m of NRA in two

37
office buildings and a shopping mall. The Group also holds a land plot located in Russia and a land plot
designated for Ana Tower, located in Romania.
Additionally, the Group manages third party assets, including: one office building in Budapest and three office buildings in Warsaw.
The Company’s shares are listed on the WSE and included in the WIG30 index. The Company’s shares are also included in the international MSCI index and the Dow Jones STOXX Eastern Europe 300.
The Group’s headquarters are located in Warsaw, at 5 Wołoska Street.
Item 4.2. Structure of the Group The structure of Globe Trade Centre S.A. Capital Group as of 31 December 2015 is presented in the
Consolidated Financial Statements for the year ended 31 December 2015 in Note 7 “Investment in subsidiaries,
associates and joint ventures”.
The following changes in the structure of the Group occurred in the year ended 31 December 2015:
In July 2015, the Group sold the shares of GTC Nekretnine Istok d.o.o (owner of Avenue Mall Osijek) for the amount of €1,300.
In July 2015, the Group sold the shares of Galleria Varna AD (owner of Galleria Varna) for the amount of €5,500.
In December 2015, the Group acquired remaining 41.1% stake in Bucharest City Gate B.V. (indirect owner of the City Gate office building in Bucharest) for the amount of €18,108.
In December 2015, the Group purchased remaining shares in Europort Investment (Cyprus) 1 Limited, Europort LTD for €191.
In 2015 the Group sold the shares of GTC Jarosova S.R.O (owner of Jarosova office building in Bratislava) for the amount of €5,500 and shares of GTC Vinohradis Villas S.R.O.
In 2015, the Group established GTC Duna Kft.
In 2015, the Group liquidated Yasmine Residential Complex S.R.L .
GTC Hill S.R.O., GTC Real Estate Vinohrady s.r.o., GTC Real Estate Vinohrady 2 s.r.o. and GTC Vinohradis Piazza S.R.O merged into GTC Slovakia Real Estate s.r.o.
Item 4.3. Changes to the principal rules of the management of the Company and the Group There were no changes to the principal rules of management of the Company and the Group.

38
Item 4.4. The Group’s Strategy
The Group's objective is to create value from:
active management of a growing commercial real estate portfolio in CEE and SEE, supplemented by selected development activities; and
enhancing deal flow, mitigating risks and optimising performance through its regional platform, by investing its own funds, the proceeds from share capital increase and reinvesting potential proceeds from the sale of real properties.
The Group implements the following elements, among others, to achieve its strategic objectives:
Acquiring yielding properties in Poland and in capital cities of selected CEE and SEE countries
The Group's strategic objective is to expand its portfolio by acquiring yielding properties in Poland and in capital cities of selected CEE and SEE countries that have value added potential.
The Management Board believes that the current market conditions, including the attractive pricing of yielding properties and the widening range of potential sellers, present compelling real estate acquisition opportunities for both individual assets and portfolios at attractive prices. The Management Board will carefully consider and evaluate attractive investment opportunities, which meet the investment criteria of the Group, while taking into consideration the prevailing market yields and the Group's investment criteria targets.
In addition, in implementing its strategic objective of expanding its portfolio, the Group is well-positioned to benefit from:
the exceptional high yield spread in the current low interest rate environment, allowing for highly accretive growth;
the future growth potential in Poland, in particular Warsaw and other capital cities of the countries in which the Group operates, including Belgrade, Bucharest and Budapest, if the macro environment improves;
the current constraints on bank lending in the CEE and SEE regions, which limits competition from other potential purchasers;
rents in the CEE and SEE regions being at historical lows.
The Group's acquisition strategy includes the acquisition of income generating assets with value-added potential that meet the following criteria:
office and retail assets;
located in Warsaw or secondary cities in Poland and in the capital cities of CEE/SEE countries;
cash generation ability (upon acquisition or short after)
potential growth of NOI, through re-leasing optimising average occupancy and rental rates, and redevelopment;
potential to increase return on equity through active asset management.
The Group's expansion will be selective and will be evaluated based on market opportunity, demand and potential return on investment. The Group may invest alone or may co-invest with partners, which will allow for increased portfolio diversification and boost the scope of investments.
39
Improving the efficiency of asset management activities and maximising operating performance and efficiency
The Group will continue to actively manage its current and future income-generating commercial property portfolio to maximise operating performance and efficiency, diversify tenant risk and enhance rental income.
The Group intends to add value to its portfolio through its asset management activities. Such activities include:
increasing and maintaining occupancy on best achievable market terms;
improving collection by maintaining good relationships with tenants and cooperating with them in improving their performance;
striving for a low and efficient cost base by using energy efficient technologies and optimising property repair and maintenance costs;
optimising development costs by revising and cost-engineering its developments without detriment to the competitiveness of any individual asset;
optimising administrative costs where possible; and
optimising the costs of finance by deleveraging and refinancing where possible.
The Management Board believes that, on a long-term basis, active asset management of completed assets will constitute a very important element of the Group's strategy. The Group will also explore other options with regards to increasing the value of its business as opportunities arise.
Developing selected projects in the pre-construction or construction stage
Another core growth source under the Group's strategy is the development of commercial projects in areas where there is demand for commercial properties. These areas include the Galeria Wilanów and Galeria Północna shopping malls in Warsaw and an office project in Belgrade (Fortyone) as well as in Łódź (University Business Park II).
The development of those projects, which as at the date of the Report were in the pre-construction stage (Galeria Wilanów) or construction stage (Galeria Północna, University Business Park and Fortyone), is an important value driver of the Group. As of 31 December 2015, those projects represent approximately 8% of the Group's portfolio value (including assets held for sale).
Over the course of the next years, the Group will focus its attention on the following major projects (as of the Report identified as projects in pipeline):
Galeria Północna - a retail and entertainment centre being built by the Group in Warsaw with the total NRA of approximately 63,400 sq. m;
Fortyone - a complex of three office buildings being built in Belgrade, Serbia with the total NRA of up to 27,800 sq. m; construction of the first building (10,673 sq. m) completed in August 2015 and construction of the second building (7,500 sq. m) commenced in October 2015
University Business Park second phase - an office building of 19,200 sq. m being built in office complex in Łódź
Galeria Wilanów - a retail and entertainment centre with intended NRA of approximately 61,000 sq. m to be developed by the Group in Warsaw, and
Ada Mall - located in Belgrade, a shopping centre with up to 31,100 sq. m of NRA;

40
Subject to market conditions, the Group may also decide to commence the development of the following projects:
White House - located in Budapest, an office building with up to 23,000 sq. m of NRA;
Ana Tower - located in Romania, an office building with up to 15,700 sq. m of NRA;
Osiedle Konstancja – located on the outskirts of Warsaw, the sixth and last phase in the complex of high end luxury villas,
The Group intends to position itself as a real estate investor and developer and adjust its development activities to the market conditions. The Management Board believes that this approach allows the Group to better respond to the changing conditions of the real estate market and focus on more active and efficient asset management of its existing as well as its expanded portfolio. Subject to prevailing market conditions, in order to improve the recurring operating income, in the mid-term the Group intends to structure its real estate portfolio in such a manner whereby more than half of its value is attributed to income-generating assets and the remaining portion to trading and development.
Disposal of non-core assets
The Group intends to sell its non-core assets (which include all of its residential properties and certain properties in its landbank, i.e. land designated for residential development and land designated for commercial development including specifically those located outside of Warsaw, in secondary Polish cities or in capital and secondary cities of the CEE/SEE countries) in order to improve its liquidity and unlock equity which will be used to finance new investments and acquisitions.
The Management Board believes that by disposing the non-core assets of the Group's portfolio the Group will be able to rationalise the real estate portfolio structure and enhance the performance of its core assets.
Disposal of mature assets
The Group may sell certain of its mature assets from its portfolio (i.e. completed commercial properties which generate a stable flow of rental income and which, in the Group's view, have reached their long-term value). Moreover, following the acquisition of existing income-generating properties and increasing their value, the Group may also sell such properties.
Maintaining a balanced mix of investments across CEE and SEE regions and adapting to changes in the real estate markets
The Group intends to continue to focus its business activities on properties located in Warsaw or secondary cities in Poland and in the capital cities of CEE and SEE countries, as such are characterised by macroeconomic stability, continued GDP growth and investor and tenant demand. The Group believes that some other markets, in which it operates also offer long-term growth potential due to their relatively underdeveloped real estate markets and relatively illiquid markets. Further investments in these markets will be explored on an opportunistic basis with strict risk adjusted return hurdles. At the same time, specific performance requirements will be imposed on all assets in the Group's portfolio.
The Group aims to create and maximise shareholder value by constantly adapting to changes in the markets in which it operates whilst maintaining maximum performance of its core portfolio of assets.

41
Item 4.5. Business overview
The Group’s core business is geared towards commercial real estate, with a clear focus on creating value from
active management of a growing real estate portfolio in CEE and SEE supplemented by selected development
activities. As of 31 December 2015 , the book value of the Group’s investment property, residential inventory,
landbank and assets held for sale amounted to €1,324,413. The Groups investment properties include income
generating assets (completed properties), projects under construction and commercial landbank.
Investment portfolio
The Group has developed over 950 thousand sq. m of net rentable space and it currently manages completed
commercial property with a combined net rentable area of approximately 524 thousand sq. m, including 20 office
properties and 5 retail properties. As of 31 December 2015, income generating properties constituted 80% of the
overall portfolio (by value).
The Group’s office buildings provide convenient space, flexible interiors and a comfortable working environment.
They are located in the heart of business districts and in proximity to the most important transport routes,
including international airports. All projects have earned the trust of a significant number of international
corporations and other prestigious institutions, including: the European Bank for Reconstruction and
Development, Microsoft, Bertelsmann, Hewlett Packard, IBM, KPMG, Lotos, Allianz, Motorola, Noble Bank,
Publicis Group companies, Levi’s, Honeywell, Roche, State Street, Aviva Group, Exxonmobil, Peugeot, Samsung
and Verifone.
The Group’s shopping centres are located in both capital cities as well as in secondary cities in Poland, Bulgaria,
Croatia, Czech Republic and Romania. They are always very highly ranked in the city of their location. The
tenants include big multinationals as well as local brands like: Carrefour, Cora, Zara, Reserved, Peek &
Cloopenburg, C&A, H&M, Cinema City, New Yorker and others.
Projects under construction
As of 31 December 2015, the Group had 3 assets classified as investment under construction with a book value
of €108,000, which constituted 8% of the Group’s overall portfolio (by value).
Commercial landbank
As of 31 December 2015, the Group had land classified as commercial landbank designated for future
development of €124,796, which constituted 10% of the Group’s overall portfolio(by value). This landbank
includes projects that are on Group`s focus for coming years like: Galeria Wilanów, Ada Mall, White House, (49%
of value).
Residential inventory and landbank
Over past 20 years, the Group also used to develop residential units for sale, however is phasing out of that
segment of the market. As of 31 December 2015, the Group held residential inventory of both completed and
landbank projects with a total value of €29,934, which constituted 2% of the Group’s overall portfolio.

42
Assets held for sale
As of 31 December 2015, the Group had land and a shopping mall (Galleria Arad, Romania) classified as assets
held for sale with a total book value of €5,950.
Item 4.5.1. Overview of investment portfolio
The Group`s strategy focuses on creating value from active management of a growing real estate portfolio in CEE
and SEE. The Group has presence in Poland, Romania, Hungary, Croatia, Serbia, Bulgaria, Slovakia and the
Czech Republic. The Group focused on commercial assets, mainly office buildings and office parks as well as
retail and entertainment centres. The Groups investment properties include income generating assets (completed
properties), projects under construction and commercial landbank.
Item 4.5.1.1. Overview of income generating assets
As of 31 December 2015, the Group had 25 own income generating assets under its management, totaling 524
thousand sq. m and valued €1,055,732. The average occupancy rate within the income generating portfolio was
92% as of 31 December 2015. The portfolio was valued based on average yield of 7.9%. Average duration of
leases in Group`s income generating portfolio amounted to 3.4 years and the average rental rate was € 14.3 / sq.
m / month.
Approximately 39% of the income generating portfolio are located in Poland, 20% is located in Hungary, 14% in
Romania, 12% in Serbia and remaining 15% is located in other countries in which the Group operates.
As of 31 December 2015, the value of office properties accounted for around 71% and retail properties accounted
for the remaining 29% of income generating portfolio.
The following table presents income generating portfolio by main usage type as of 31 December 2015:
Usage type
GTC`s
consolidat
ed share
( sq. m)
Total net
leasable area
( sq. m)
% of total
income
generating
portfolio
(sq. m)
Average
occupancy
(%)
Book
value
(€)
% of total
book
value
Office 364,695 364,695 70% 93% 744,632 71%
Retail1 159,429 159,429 30% 89% 311,100 29%
Total 524,124 524,124 100% 92% 1,055,732 100%
1Including Avenue Center, Croatia

43
The following table presents income generating portfolio as by country in which the Group operates of
31 December 2015:
Country
GTC`s
consolidated
share (sq. m)
Total net
leasable area
(sq. m)
% of total
income
generating
portfolio
(sq. m)
Average
occupancy
(%)
Book value
(€)
% of total
book value
Poland 184,161 184,161 35% 91% 416,636 39%
Hungary 117,098 117,098 22% 95% 208,496 20%
Romania 60,954 60,954 12% 93% 150,000 14%
Serbia 64,421 64,421 12% 92% 123,600 12%
Croatia 36,138 36,138 7% 97% 102,100 10%
Bulgaria 61,352 61,352 12% 82% 54,900 5%
Total 524,124 524,124 100% 92% 1,055,732 100%
Additionally, the Group holds income generating properties in the Czech Republic through its associates, which are presents as the investment in associates in consolidated financial statement for the year ended 31 December 2015.
Item 4.5.1.1.1. Overview of the office portfolio
As of 31 December 2015, the Group office portfolio comprised of 20 office projects. Total net rentable office
space was 365 thousand sq. m compared to 356 sq. m as of 31 December 2014. Total value of office portfolio as
of 31 December 2015 was €744,632 compared to €712,876 as of 31 December 2014. Increase in value and
space is mainly due to acquisition of Duna Tower, office building in Budapest and completion of Fortyone office
building in Belgrade partially offset by sale of Kazimierz Office Centre office building in Krakow in May 2015 and
Jarosova office building in Bratislava in December 2015. The Group’s office buildings are located in Poland,
Hungary, Serbia, Croatia (Avenue Center is a part of Avenue Mall Zagreb and its presented together with Avenue
Mall Zagreb in retail segment) and Romania. Additionally, the Group holds office properties in the Czech Republic
through its associates.
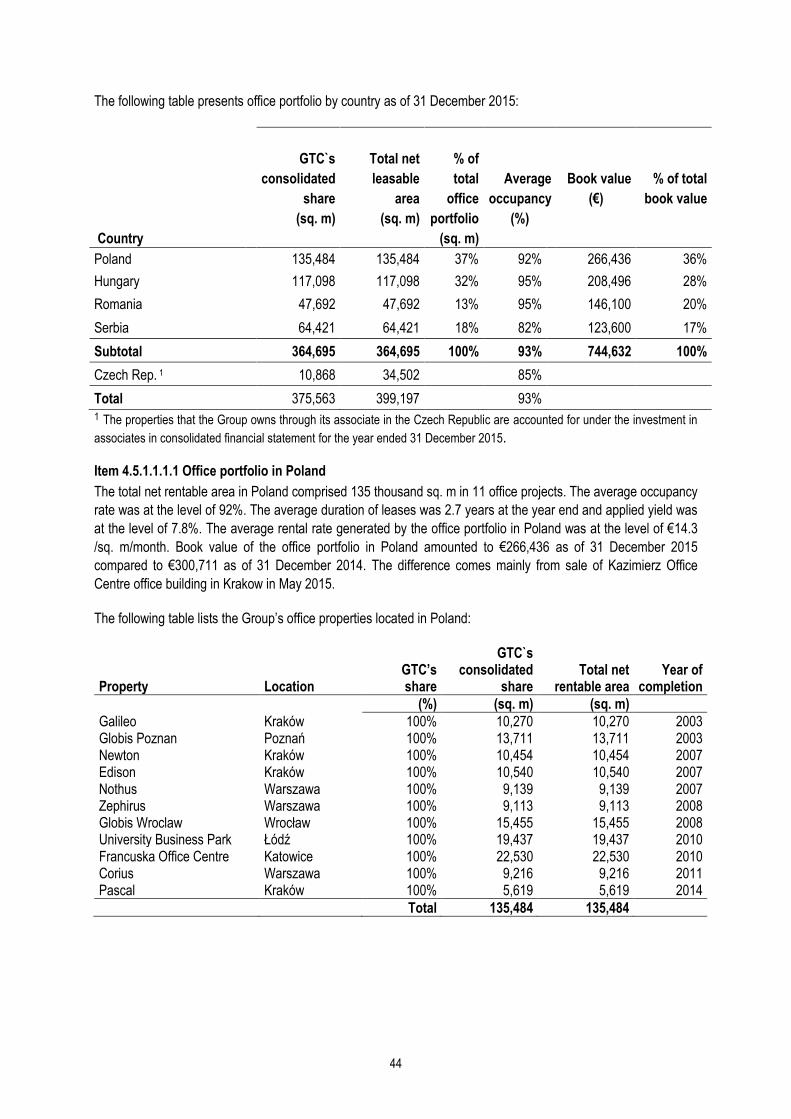
44
The following table presents office portfolio by country as of 31 December 2015:
Country
GTC`s
consolidated
share
(sq. m)
Total net
leasable
area
(sq. m)
% of
total
office
portfolio
(sq. m)
Average
occupancy
(%)
Book value
(€)
% of total
book value
Poland 135,484 135,484 37% 92% 266,436 36%
Hungary 117,098 117,098 32% 95% 208,496 28%
Romania 47,692 47,692 13% 95% 146,100 20%
Serbia 64,421 64,421 18% 82% 123,600 17%
Subtotal 364,695 364,695 100% 93% 744,632 100%
Czech Rep. 1 10,868 34,502 85%
Total 375,563 399,197 93% 1 The properties that the Group owns through its associate in the Czech Republic are accounted for under the investment in
associates in consolidated financial statement for the year ended 31 December 2015.
Item 4.5.1.1.1.1 Office portfolio in Poland
The total net rentable area in Poland comprised 135 thousand sq. m in 11 office projects. The average occupancy
rate was at the level of 92%. The average duration of leases was 2.7 years at the year end and applied yield was
at the level of 7.8%. The average rental rate generated by the office portfolio in Poland was at the level of €14.3
/sq. m/month. Book value of the office portfolio in Poland amounted to €266,436 as of 31 December 2015
compared to €300,711 as of 31 December 2014. The difference comes mainly from sale of Kazimierz Office
Centre office building in Krakow in May 2015.
The following table lists the Group’s office properties located in Poland:
Property Location GTC’s share
GTC`s consolidated
share Total net
rentable area Year of
completion
(%) (sq. m) (sq. m)
Galileo Kraków 100% 10,270 10,270 2003 Globis Poznan Poznań 100% 13,711 13,711 2003 Newton Kraków 100% 10,454 10,454 2007 Edison Kraków 100% 10,540 10,540 2007 Nothus Warszawa 100% 9,139 9,139 2007 Zephirus Warszawa 100% 9,113 9,113 2008 Globis Wroclaw Wrocław 100% 15,455 15,455 2008 University Business Park Łódź 100% 19,437 19,437 2010 Francuska Office Centre Katowice 100% 22,530 22,530 2010 Corius Warszawa 100% 9,216 9,216 2011 Pascal Kraków 100% 5,619 5,619 2014
Total 135,484 135,484

45
Item 4.5.1.1.1.2 Office portfolio in Hungary
The Group’s total net rentable area in Hungary comprised 117 thousand sq. m in four projects. The occupancy
rate was at the level of 95%. The average duration of leases was 3.5 years and the year end and applied yield
was at the level of 7.9%. The average rental rate generated by the office portfolio in Hungary was at the level of
€11.7 / sq. m / month. Book value of the Group’s office portfolio in Hungary amounted to €208,496 as of 31
December 2015, as compared to €154,865 as of 31 December 2014. This increase comes mainly from a
acquisition of Duna Tower, office building in Budapest.
The following table lists the Group’s office properties located in Hungary:
Property Location GTC’s share
GTC`s consolidated
share
Total net rentable
area Year of
completion
(%) (sq. m) (sq. m)
Center Point I&II Budapest 100% 37,130 37,130 2004/2006
Duna Tower* Budapest 100% 31,249 31,249 2006
Spiral I&II Budapest 100% 31,979 31,979 2009
Metro Budapest 100% 16,740 16,740 2010
Total 117,098 117,098 *property acquired in 2015
Item 4.5.1.1.1.3 Office portfolio in Serbia
The Group’s total net rentable area in Serbia comprised 64 thousand sq. m in four office buildings. The occupancy rate was at the level of 92%. The average duration of leases was 2.3 years at the year end and applied yield was at the level of 8.8%. The average rental rate generated by the office portfolio in Serbia was at the level of €14.7 / sq. m / month. Book value of the Group’s office portfolio in Serbia amounted to €123,600 as of 31 December 2014 compared to € 100,200 as of 31 December 2014. Increase comes mainly from completion of Fortyone office building in Belgrade.
The following table lists the Group’s office properties located in Serbia:
Property Location GTC’s share
GTC`s consolidated
share
Total net rentable
area Year of
completion
(%) (sq. m) (sq. m)
GTC House Belgrade 100% 13,492 13,492 2005 Avenue 19 Belgrade 100% 17,521 17,521 2008 GTC Square Belgrade 100% 22,735 22,735 2008 Fortyone phase I Belgrade 100% 10,673 10,673 2015
Total 64,421 64,421
Item 4.5.1.1.1.4 Office portfolio in Romania
The Group’s total net rentable area in Romania comprised 48 thousand sq. m in one office project. The occupancy rate was at the level of 93%. The average duration of leases was 2.7 years at the year end and applied yield was at the level of 7.7%. The average rental rate generated by the office portfolio in Romania was at the level of €19.0/ sq. m / month. Book value of the Group’s office portfolio in Romania amounted to €146,100 as of 31 December 2015, as compared to €148,000 as of 31 December 2014.

46
The following table lists the Group’s office properties located in Romania:
Property Location GTC’s share
GTC`s consolidated
share
Total net rentable
area Year of
completion
(%) (sq. m) (sq. m)
City Gate Bucharest 100% 47,692 47,692 2009
Total 47,692 47,692
Item 4.5.1.1.1.5 Office portfolio in Croatia
The Group’s total net rentable area in Croatia comprises 7 thousand sq. m in one office building. The occupancy
rate (100%) and the book value of the Group’s office portfolio in Croatia are presented together with the data for
Avenue Mall Zagreb.
The following table lists the Group’s office investment properties located in Croatia:
Property Location GTC’s share GTC`s share
Total net rentable area
Year of completion
(%) (sq. m) (sq. m)
Avenue Center Zagreb 70% 7,000 7,000 2007
Total 7,000 7,000
Item 4.5.1.1.1.6 Office portfolio in the Czech Republic
The Group owns a number of properties in the Czech Republic through associates and as a result the properties
valuation and results of operations in the Czech Republic are not consolidated but uncounted for under as the
investment in associates.
Total office net rentable area in the Czech Republic comprises 35 thousand sq. m, of which the Group’s share is
11 thousand sq. m. Book value of the Group’s office space in the Czech Republic amounted to €60,370 as of
31 December 2015. The Group’s proportional interest is €19,017. Occupancy rate is at the level of 87%.
The properties that the Group owns through its associate in the Czech Republic are accounted for under the
investment in associates in financial statements.
The following table lists the Group’s office properties located in Czech Republic:
Property Location GTC’s share GTC`s share
Total net rentable area
Year of completion
(%) (sq. m) (sq. m)
Prague Marina Office Centre Prague 32% 4,164 13,219 2009
Harfa Office Prague 32% 6,704 21,283 2011
Total 10,868 34,502

47
Item 4.5.1.1.2. Overview of retail portfolio
As of 31 December 2015, the Group’s retail properties comprised 5 shopping centres with a total net rentable
area of 156 thousand sq. m compared to 192 sq. m as of 31 December 2014. The total value of retail investment
properties as of 31 December 2015 was €311,100 compared to €316,400 as of 31 December 2014. The
decrease in value and space comes mainly from sale of Avenue Mall Osijek in Osijek in June 2015. The Group’s
retail properties are located in Poland, Bulgaria, Croatia and Romania. Additionally the Group holds a shopping
centre in Prague through its associate.
The following table presents retail portfolio by country as of 31 December 2015:
Country
GTC`s
consolidated
share
(ths. sq. m)
Total net
leasable
area
(ths. sq. m)
% of
total
retail
portfolio
(sq. m)
Average
occupancy
(%)
Book value
(€)
% of total
book value
Poland 48,677 48,677 31% 90% 150,200 48%
Croatia1 36,138 36,138 23% 97% 102,100 33%
Bulgaria 61,352 61,352 38% 82% 54,900 18%
Romania 13,262 13,262 8% 95% 3,900 1%
Subtotal 159,429 159,429 100% 89% 311,100 100%
Czech Republic2 13,057 41,450 92%
Total 172,486 200,879 89%
1 Including book value of Avenue Center, Croatia 2 The properties that the Group owns through its associate in the Czech Republic and is accounted for under the
investment in associates.
Retail properties in Romania are recognized by GTC Group as non-core. Additionally Galleria Arad is classified as assets held for sale following .
Item 4.5.1.1.2.1 Retail portfolio in Poland
The total net rentable area of retail space in Poland comprises 49 thousand sq. m in one retail scheme. The
occupancy rate was at the level of 90%. The average duration of leases was 3.9 years at the year end and
applied yield was at the level of 7.3%. The average rental rate generated by the retail portfolio in Poland was at
the level of €19.3 / sq. m / month. Book value of the Group’s retail portfolio in Poland amounted to €150,200 as of
31 December 2015, as compared to €150,000 as of 31 December 2014.
The following table lists the Group’s retail properties located in Poland:
Property Location GTC’s share
GTC`s consolidated
share
Total net rentable
area Year of
completion
(%) (sq. m) (sq. m)
Galeria Jurajska Częstochowa 100% 48,677 48,677 2009
Total 48,677 48,677

48
Item 4.5.1.1.2.2 Retail portfolio in Croatia
The Group’s total net rentable area of retail space in Croatia comprised 36 thousand sq. m (including Avenue
Center) in one retail scheme. The occupancy rate was at the level of 97%. The average duration of leases was
4.7 years at the year end and applied yield was at the level of 8.0%. The average rental rate generated by the
retail portfolio in Croatia was at the level of €20.0 / sq. m / month. Book value of the Group’s retail portfolio in
Croatia amounted to €102,100 (including book value of Avenue Center) as of 31 December 2015 compared to
€102,200 as of 31 December 2014.
The following table lists the Group’s retail properties located in Croatia:
Property Location GTC’s share
GTC`s consolidated
share Total net
rentable area Year of
completion
(%) (sq. m) (sq. m)
Avenue Mall Zagreb1 Zagreb 70% 36,138 36,138 2007
Total 36,138 36,138 1Including Avenue Center
Item 4.5.1.1.2.3 Retail portfolio in Bulgaria
The Group’s total net rentable area of retail space in Bulgaria comprised 61 thousand sq. m in two projects. Occupancy rate is at the level of 82%. The average duration of leases was 5.0 years at the year end and applied yield was at the level of 9.3%. The average rental rate generated by the retail portfolio in Bulgaria was at the level of €9.4 sq. m / month. Book value of the Group’s retail properties in Bulgaria amounted to €54,900 as at 31 December 2015, as compared to €55,700 as at 31 December 2014.
The following table lists the Group’s office properties located in Bulgaria:
Property Location GTC’s share
GTC`s consolidated
share Total net
rentable area Year of
completion
(%) (sq. m) (sq. m) Galleria Stara Zagora Stara Zagora 75% 24,628 24,628 2010 Galleria Burgas Burgas 80% 36,724 36,724 2012
Total 61,352 61,352
Item 4.5.1.1.2.4 Retail portfolio in Romania
The Group’s total net rentable area of retail space in Romania comprised 13 thousand sq. m in one retail schemes. The occupancy rate was at the level of 95%. The average duration of leases was 5.2 years at the year end and applied yield was at the level of 11.5%. The average rental rate generated by the office portfolio in Romania was at the level of €5.7/ sq. m / month. Book value of the Group’s retail portfolio in Romania amounted to €3,900 as of 31 December 2015, as compared to €8,500 as of 31 December 2014, which is based on the received offers to purchase those non-performing assets, following Group’s classification of those assets as non-core.

49
The following table lists the Group’s retail investment properties located in Romania:
Property Location GTC’s share
GTC`s consolidated
share
Total net rentable
area Year of
completion
(%) (sq. m) (sq. m)
Galleria Piatra Neamt Piatra Neamt 100% 13,262 13,262 2009
Total 13,262 13,262
Item 4.5.1.1.2.5 Retail portfolio in the Czech Republic
The Group owns a number of properties in the Czech Republic through associates and as a result the properties
valuation and results of operations in the Czech Republic are not consolidated but uncounted for under as the
investment in associates.
Total retail net rentable area of that retail space is 41 thousand sq. m, of which the Group’s share is 13 thousand sq. m. Occupancy rate is at the level of 90%. Book value of the Group’s retail space in the Czech Republic amounted to €99,400 as of 31 December 2015. The Group’s proportional interest is €31,311. The properties that the Group owns through its associate in the Czech Republic are accounted for under the investment in associates in financial statements.
The following table lists the Group’s office properties located in the Czech Republic:
Property Location GTC’s share GTC`s share
Total net rentable
area Year of
completion
(%) (sq. m) (sq. m)
Galeria Harfa Prague 32% 13,057 41,450 2010
Total 13,057 41,450
Item 4.5.1.2 Overview of properties under construction
As of 31 December 2015, the Group had three project under construction including one retail project and two
office projects with a total net rentable area of 90 thousand sq. m and a book value of €108,000.
Property
Segment Location
GTC’s
share
Total net
leasable area
(sq. m)
Expected
completion
Fortyone second phase office Belgrade, Serbia 100% 7,500 Q3 2016
Galeria Północna retail Warsaw, Poland 100% 63,400 Q2 2017
University Business Park
second phase
office Łódź, Poland 100% 19,200 Q2 2016
Total 90,100

50
Item 4.5.1.3. Overview of commercial landbank
Management, has conducted a thorough, asset by asset, review of the whole portfolio, in parallel to its decision to
focus on Group’s new developments efforts, solely on the strongest markets and, whilst supporting only the
projects in its portfolio, which give the strongest mid-term upside potential, while reducing. Concurrently, the
Management decided to reduce the cash allocation towards projects that has a longer term investment horizon.
The above implied re-assessment of the some of GTC's landbank projects development timetable, and
rescheduling them to a later stage or designating them for sale.
Additionally, in some cases, in view due to the decline in consumption and deteriorating of purchasing power, the
timetable for stabilization of in relevant catchment areas around certain completed and cash generating assets in
SEE, the timetable for stabilization of had to be re-assessed, and consequently expectations for stabilized income
were deferred.
As of 31 December 2015, the Group had land classified as commercial landbank designated for future
commercial development with same land plats defined as for sale of €124,796. This landbank, designated for
future commercial development, includes projects that are on Group`s focus for coming years like: Galeria
Wilanów, Ada Mall, White House (which constitute 49% of value).
Property Segment Location GTC’s share
Total net
leasable area
(sq. m)
Galeria Wilanów retail Warsaw, Poland 100% 61,000
Ada Mall office Belgrade, Serbia 100% 31,100
White House office Budapest, Hungary 100% 23,000
Fortyone III phase office Belgrade, Serbia 100% 9,900
Total 125,000
Item 4.5.2. Residential inventory and landbank
As of 31 December 2015, the Group held residential inventory of both completed projects and landbank with a
total value of €29,934, which constituted 2% of the Group’s overall portfolio. The residential sector is not a core
sector for the GTC Group, thus GTC decided to develop one residential project – Osiedle Konstancja, the sixth
and last phase in the complex of high end luxury villas, located on the outskirts of Warsaw. The remaining land is
designated for sale.
Property Location GTC’s share Number of houses
Osiedle Kontancja, phase VI
Kontancin Jeziorna
(outskirts of Warsaw)
Poland
100% 17

51
Item 4.5.3. Assets held for sale
As of 31 December 2015, the Group had land and one retail project classified as assets held for sale with a total
book value of €5,950.
Property Location GTC’s share
Total NRA/plot area
(sq. m)
Galleria Arad Arad, Romania 100% 33,142
Land plot Subotica, Serbia 100% 12,366
Land plot Łódź, Poland 100% 12,203
Item 4.6. Overview of the markets on which the Group operates
This overview was prepared by the Group based on the publicly available information and is focused on the most
important markets on which the Group operates.
Item 4.6.1. Office market
The following description of the markets is fully based on JLL publicly available research and presents its view as
the year end. Any changes that were notice post year end are not reflected.
Poland
2015 proved to be extremely busy for the Warsaw office market. Leasing activity boomed, reaching a record - breaking 834,000 sq. m let, an impressive 36% growth y – o – y. Take - up volumes have been boosted by new transactions and corporate tenants that decided to renew their leases in 2015. Approximately 379,000 sq. m of the office space leased in 2015 was for new deals in existing buildings, a further 124,400 sq. m of space was pre-let and 60,500 sq. m came from expansions. Net take-up accounted for 68% of total demand, a result comparable with previous quarters. Positive market sentiment is further confirmed by the net absorption level, which stood at almost 280,000 sq. m in 2015. This robust occupier activity will likely continue in 2016 and 2017. In 2015, approximately 277,600 sq. m of modern office space entered the market in Warsaw. The vacancy rate decreased marginally in 2015 and stood 12.3% (15.8% in the CBD, 11.9% in the City Centre Fringe and 11.8% in Non-Central locations). JLL expects the rate to grow with the new office completions planned for delivery in 2016 and onwards. However, if the long-term vacant space of more than two years is excluded, the rate stands at 8.5%. Prime headline rents in Warsaw edged down over the course of 2015, with City Centre rents declining from €22–24 / sq. m/ month to €21–23.5 sq. m/ month and Non-Central locations commanding rents of €11–18 / sq. m/ month. Downward pressures are applicable to effective rents, which are on average 15–20% below headline rents and we may expect even higher levels of incentives in terms of strategic occupiers.
The major regional office markets outside of Warsaw continue to grow at a robust pace, with 2015 full year take-up surging to 682,900 sq. m, the best outcome on record, up by 54% on the strong 2014 total of 444,600 sq. m. A significant proportion of this was leased in Kraków, which accounted for around one third of the total (226,000 sq. m leased). The market which has seen a particular turnaround in fortunes is Poznań, which recorded take-up of around 65,000 sq. m, more than triple the level achieved in 2014. Elsewhere, the Tri-City, Łódź, Wrocław and Katowice also witnessed substantial growth in volumes, with leasing activity up 61%, 53%, 34% and 29% y-o-y, respectively. As much as 28% of the high 2015 take-up was pre-leasing, 36% came from new deals signed in existing office schemes and 11% from lease expansions. Lease renewals accounted for around 25%. Development activity broadly kept pace. In 2015, around 365,000 sq. m of new office space was brought to the market outside of Warsaw, up 13% on the amount recorded in 2014. A further 768,000 sq. m is currently under construction (of which 25% is already secured by pre-let agreements). Kraków and Wrocław maintain their lead in this respect, and each account for around 24% of that pipeline. Most of the regional office markets registered minor fluctuations in quarterly vacancy rates over the course of 2015 and those rates remain similar and even

52
slightly below the previous year (e.g. in Kraków, Wrocław, the Tri-City, Katowice, Łódź and Lublin). The significant pipeline underway for 2016 is, however expected to apply gradual upward pressure to vacancy rates, particularly in Kraków, Wrocław, the Tri-City and Łodź. Rental levels across core regional office markets levelled off in 2015. Currently, prime headline rents range between €11 to €12 / sq. m/ month in Lublin and €14 to €14.5 / sq. m/ month in Poznań, Wrocław and Kraków. Looking ahead, JLL anticipates slight reductions in prime headline rents. Moreover, in the case of cities with the largest office pipelines incentives will be a strong driver of activity and widely used to attract new tenants.
Romania
Total take-up in Bucharest amounted to 248,000 sq. m out of which 109,000 sq. m accounted for the net take-up. Demand in 2015 was generated mainly by IT companies, which accounted for 36% of the total annual volume registered in Bucharest, followed by professional services companies with 16% and BPO/SSCs with 15%. Two sub-markets in the north of Bucharest, Floreasca Barbu Vacarescu and Dimtrie Pompeiu, attracted more than half of the total take-up, mainly due to the good accessibility, including metro, amenities in the area and quality office premises. Vacancy in Bucharest increased marginally over the quarter to 13.3%, 20 bps above the level of Q3 2015. This is mainly due to the fact that the Romanian operations of Volksbank were taken over by a local bank and therefore the space which they previously occupied remained vacant. Vacancy is expected to increase by the end of 2016, due to the large volume of space planned for delivery which is only partially pre-leased. Vacancy rates continue to be uneven between sub-markets, which is also reflected in the evolution of the rental levels. While in South, Baneasa and Pipera North vacancy is above 30%, the vacancy rate in Dimitrie Pompeiu, Floreasca Barbu Vacarescu, CBD and West is below 10%.
Serbia
Following the delivery of the first phase of GTC’s Fortyone there were no new office schemes delivered to the Belgrade market. The office market however is witnessing a growth in construction activity, with several ongoing and announced projects located mainly in New Belgrade – CBD. High demand for new schemes has been recorded as new office schemes are being absorbed quickly. As a result, the vacancy rate continues to drop. Market activity was split by net take-up (52%), including relocations, new leases and expansion, while 48% was attributed to renewals. The most active sector was IT, followed by the banking and the insurance sectors.
Hungary
In 2015, Budapest’s modern office stock expanded by four buildings totalling 50,885 sq. m. Out of this volume, 30,885 sq. m included assets for letting purposes, while the remaining 20,000 sq. m accounted for an owner-occupied headquarters. As a result the size of the modern office stock in Budapest increased to 3.28 million sq. m. Annual gross take-up reached an all-time high of 538,050 sq. m, reflecting a ca. 16% growth on 2014. Annual net take-up totalled 364,240 sq. m, reaching a record peak, indicating a significant 45% growth on 2014. Vacancy declined constantly throughout the year and bottomed at 12.1% by the year end, representing the lowest rate since 2008. The high annual net absorption played an important role in the sharp fall of availability. The annual level reached a record high with 175,975 sq. m, reflecting a 41% improvement on 2014.
Item 4.6.2. Retail market
Poland
The Warsaw Agglomeration is the largest Polish retail market in terms of supply, accommodating ca.1.65 million sq. m of retail space distributed among all retail formats. The spending power of its inhabitants (€10,807 per person per annum) exceeds the national average by 68%. However, with respect to shopping centre density per 1,000 inhabitants, Warsaw with a ratio of 447 sq. m, remains behind other major metropolitan areas such as Wrocław, Poznań, Tri-City, Łódź, and Kraków. This situation, however, is likely to change in the mid to long-term as ca. 120,000 sq. m of retail space is now under construction. Albeit a considerable volume, the available stock is well absorbed by the market, which is reflected in one of the lowest vacancy rates countrywide. Warsaw remains the bridgehead for further expansion in Poland for most retailers, particularly those aiming to locate in
53
prestigious assets. Approx. 20 new brands entered Polish market in 2015, including: Arior Barcelona, Benihana, Courir, Decimas, Kiabi, Origins, Patisserie Paul and Superdry. However, changes on the political scene negatively impacted the sentiment to the polish retail sector, tenants value established localisations and new brands are more cautious while entering the Polish market.
Romania
2015 was a good year for the retail market in Romania. Close to 175,000 sq. m of GLA has been delivered – a value 143% higher when compared to 2014. Over 196,000 sq. m of shopping centers are planned to be delivered in 2016, supported by the strong growth of retail sales, consumer confidence and the growing economy. Two large, new shopping centers and several extensions of existing assets were inaugurated in 2015, mainly targeting areas which were previously lacking major schemes such as Brasov, the east of Bucharest, Deva or Drobeta. Moreover, large, new projects planned to be delivered in the next 2 years are following the same pattern of aiming at undersupplied cities such as Timisoara, Piatra Neamt or Satu Mare. In terms of retail formats, large shopping centres continue to dominate in major cities while local centres and convenience-type schemes are predominant in smaller cities. Developers more rarely decide to develop retail parks. According to the National Institute of Statistics, in 2015, retail sales grew by an impressive 8.9%, which together with the increasing consumer confidence, encouraged retailers to expand. However, even though retailers are developing dynamically, they are increasingly selective when it comes to the standard and location of new retail objects. As a result, they are thoroughly revising the leasing of further units, targeting mainly the performing shopping centers, due to the lack of high-street retail. Debenhams is among the most famous fashion brands to debut on the Romanian retail market in 2015 and reopened their unit in Bucuresti Mall after a two year break. Luxury retailer Marc Cain opened its first shop in the commercial gallery attached to the Radisson Blu hotel, Armani Jeans and Chanel opened their first Romanian operations in Baneasa Shopping City and Tally Weijl and Liu Jo opened new locations in AFI Palace Cotroceni.
Serbia
There was one large retail scheme completion: Aviv Park Zvezdara in November 2015. We see continued
expansion of retail parks. Further future shopping centre development in Belgrade remains quite uncertain with
several projects planned for completion in 2017 (Rajiceva and Belgrade Plaza) and with few other projects being
planned (Delta Planet). When considering market entry, the majority of retailers are focused on Belgrade’s prime
retail assets. Therefore, modern shopping centres have excellent occupancy, with vacancy being constantly close
to zero. Average rents in prime shopping centres in Belgrade remained stable, ranging from €25-27 sq. m/month.
Retail units sized from 100 - 200 sq. m within prime shopping centres stand at €60 sq. m/month. During 2015 the
market saw the first Cinestar opening and Jeordie’s new store opening. However there are other big retailers
willing to enter the Serbian market: Decathlon plans to enter the market in 2016.
Croatia
Croatia’s economic recovery continues, with GDP growth accelerating to a seasonally adjusted 2.3% during the third quarter, along with strong tourism figures and improved industrial output. In terms of the retail sector 2015 noted no larger scale retail completions. During year, we have noted one market entry, namely Kiehl’s. Debenhams plans to enter the market. Currently, there is more construction activity in secondary cities.
Bulgaria
There were no new shopping centers delivered in 2015. The previous completions of Mega Mall Sofia and Sofia Ring Mall during 2014 increased Sofia’s stock by 29%. On the demand side: Marks & Spencer announce closure of its operations, while Kaufland and Billa plan further expansion.

54
Item 4.6.3. Investment market
Poland
In Q4 2015, the volume of traded commercial real estate in Poland reached €2.043 billion bringing the total annual investment volume to €4.1 billion, the highest figure recorded since the record year of 2006 (€ 5.05 billion). This amount has been distributed between the following sectors: retail - €1.308 billion, office - €515 million, and industrial - €221 million. The Q4 2015 result represents 161% of the respective 2014 figure, which confirms very strong investment market sentiment with investors being active in all asset classes and risk profiles. The retail sector, with 10 deals closed, outperformed Q4 2014 figure by more than 8 times and included numerous high profile shopping centre and retail park deals in major but also secondary and tertiary cities. Regional offices continued to strengthen their position on the investment map, achieving a considerable result of over €342 million across six transactions. Similarly to earlier quarters of the year, there were more office deals concluded in regional cities in Q4 2015, (67% share) than in Warsaw (33%), which resulted in 2015 being the first year in the history of the Polish office investment market, in which the volume of transactions in regional cities exceeded the volume registered in the capital city. This proves how increased liquidity and strong investor interest in assets located outside Warsaw has developed. The buyers included reputable institutional investors including Gramercy, Deka, GLL, Hillwoodand Savills Investment Management. Bearing in mind transactions already signed in 2015 that shall close this year, JLL expects to see a significant investment volume in the coming months and for 2016 to be another busy year.
Romania
The property investment volume in 2015 is estimated at approximately €675 million, coming off the back of a very strong 2014, when ca. €1.17 billion was transacted, including a number of unique, very large deals. However, 2015 witnessed an equally large number of transactions proving that the market remains liquid and is maintaining momentum. Bucharest accounted for more than 80% of the total investment volume. Market volumes were dominated by industrial transactions (41%), making 2015 an all-time record year for this segment, followed by office (38%). The most active buyer in 2015 was Czech investor CTP, who acquired 6 industrial properties across Romania, for a combined total value of over €130 million. 2015 saw the entry of several new players on the Romanian real estate market. In industrial, P3 and CTP bought their first standing assets in the country. On the office market, GLL -the German institutional buyer acquired, after a 6 years hiatus, Floreasca Park and Victoria Center, 2 office buildings in major office areas in Bucharest for a combined value of close to €130 million. Investors looking for distressed property in Romania will struggle to find any that can be worked out. More core players wanting to secure properties with stable, long term income, in a steadily growing economy are coming in as they see the opportunity to improve their returns. With financing conditions having improved significantly over the past 12 months and increased appetite from banks for good product and serious sponsors is encouraging this flow of capital. We also see interest from foreign banks looking to finance in Romania again, which will put further pressure on margins offered locally. Prospects for 2016 are positive given that the projected economic growth of the country is forecast to be one of Europe’s top performers, but also the availability of quality product and the still significant yield spread between Romania and Poland or the Czech Republic. Prime office and retail yields are at 7.50% while prime industrial yields are at 9.00%. Yields have compressed between 25 and 75 bps since the start of 2015, but no significant further compression is expected in the first half of 2016.
Hungary
The annual transactional volume amounted to ca. €790 million, the highest volume since the peak of the market in 2007. From this volume, offices had a share of 50% followed by retail with 25%, industrial and hotel with 9% each and other assets for redevelopment purposes with the remaining 7%. Almost 60% of the annual volume was generated by portfolio transactions, which clearly reflects the increasing interest of investors for large platforms in an attempt to gain significant exposure to the market. The outstanding performance of the market was supported by various factors. Market fundamentals improved remarkably, with record breaking occupier demand, declining vacancy rates and a limited development pipeline. The pool of buyers deepened: the importance of Hungarian real estate funds and overseas investors increased strikingly, the presence of exotic private money remained significant, while European capital (British and Austrian investors) was also active. Moreover, the yield spread

55
with Western European and other leading CEE markets guarantees the attraction of the market. Finally, it is highly anticipated that Hungary’s sovereign debt rating will be upgraded from junk level to investment grade in March 2016, which could be encouraging even for the more conservative investors for whom the strong market fundamentals and relatively high yields have not be compelling enough arguments. The gap in pricing expectations between vendors and bidders narrowed and liquidity increased in every asset class along with improved debt finance terms. Based on the latest transactional evidence the prime office yields stand at 7.00% along with prime retail while we now price prime logistics at 8.75%. Further compression is expected over the course of 2016. Interest for Hungarian assets will further increase in 2016. JLL expects large platforms to be sold, as well as large ticket landmark buildings. Secondary debt trading will remain an essential part of the activity in 2016.
Serbia
Serbia remained the least developed country among the CEE countries, however, more development is expected in the upcoming 24 months. The second half of the year was significant as Atterbury Europe, a joint venture company formed by the Atterbury Group and foreign investors, acquired a one third stake (ca. € 86 million) of seven Serbian retail schemes, including the country's prime and the largest shopping center Ušće. Another significant investment recently signed, was the joint venture between the Serbian government and the United Arab Emirates real estate developer, Eagle Hills. This large 1.8 million sq. m project (gross construction area) has officially started and will comprise both residential and commercial elements.
Item 4.7 Information on the Company’s policy on sponsorship, charity and other similar activities.
The Group actively pursue the policies adopted by them which envisage supporting local communities that reside
within or in close proximity of the areas where the Group’s investments are situated. Such support involves:
Enhancement of local infrastructure, including road and traffic infrastructure. The infrastructure created
in connection with or for the purposes of the developments constructed is handed over to the local self-
government free of charge to be used by all residents. Moreover, prior to the development of the Group’s
projects, public green areas (such as squares and parks) are placed on undeveloped plots or plots which
will surround future developments following their completion by the Group.
Sponsoring local initiatives. The Group participates in and supports local initiatives (such as the “Bieg
przez Most” run and the “Dni Wilianowa” event).
Embracing environmental certification. Out of concern for the environment, the investments of the
Company and the Group are fully compliant with LEED guidelines.
Item 5. Operating and financial review
Item 5.1. General factors affecting operating and financial results General factors affecting operating and financial results
The key factors affecting the Group’s financial and operating results are discussed below. The Management
believes that the following factors and important market trends have significantly affected the Group’s results of
operations since the end of period covered by the latest published audited financial statements, and the Group
expects that such factors and trends will continue to have a significant impact on the Group’s results of operations
in the future.
Economic conditions in CEE and SEE
The Group’s business results have been affected by the global financial crisis, which started in 2008/2009. The
global crisis on the financial markets impacted the condition of many financial institutions, and governments were
often forced to intervene on the capital markets on an unprecedented scale. Such turbulence resulted in
businesses having restricted access to bank financing, an increase in interest rates charged on bank loans and a

56
decrease in consumer spending with many tenants making requests for temporary or permanent rent reduction or
downsizing of rental space. All these factors impacted the real estate market as well as resulted in a decrease in
the value of real estate.
The crisis experienced by the financial markets slowed down the general economy in the countries, where the
Group operates. The economic downturn in those countries resulted in reduced demand for property, growth of
vacancy rates, and increased competition in the real estate market, which adversely affected the Group’s ability
to sell or let its completed projects at their expected yields and rates of return.
The reduced demand for property that, on the one hand, resulted in a drop in sales dynamics, and, on the other,
an increase in vacancy rates and lower rent revenues from leased space, significantly impacted the results of
operations of the Group. Specifically, the Group was forced to change some of its investment plans, for example
numerous projects in Bulgaria, Romania and Croatia, as those projects did not meet the initially assumed returns
targets. Additionally, the Group was not able to develop numerous plans in the countries where it operates.
Real estate market in CEE and SEE
The Group derives the majority of its revenue from operations from rental activities, including rental and service
revenue. For the year ended 31 December 2014 and for the year ended 31 December 2015, the Group derived
68% and 68% of its revenues from operations as rental revenue, which greatly depends on the rental rates per
sq. m and occupancy rates. The amount the Group can charge for rent largely depends on the property’s location
and condition and is influenced by local market trends and the state of local economies. The Group’s revenue
from rent is particularly affected by the delivery of new rent spaces, changes in vacancy rates and the Group’s
ability to implement rent increases. Rental income is also dependent upon the time of completion of the Group’s
development projects as well as on its ability to let such completed properties at favorable rent levels. Moreover,
for the year ended 31 December 2014 and for the year ended 31 December 2015, respectively, the Group
derived 21% and 22% of its revenues from operations as service revenue, which reflects certain costs the Group
passes on to its tenants.
The vast majority of the Group’s lease agreements are concluded in Euro and include a clause that provides for
the full indexation of the rent linked to the European Index of Consumer Prices. When a lease is concluded in
another currency, it is typically linked to the consumer price index of the relevant country of the currency.
To a certain extent, the Group’s operational results are influenced by its ability to sell residential units, which for
the year ended 31 December 2014 and for the year ended 31 December 2015, amounted for 12% and 11% of
the Group’s total revenues, respectively. The supply of new apartments in the different markets in which the
Group operates and the demand on such markets affect apartment prices. The demand for apartments is further
impacted by fluctuations in interest rates, the availability of credit and the mortgage market in general. For
example, the Group’s residential revenues decreased steadily over the last few years due to the slowdown in the
sale of residential properties coupled with an increase in discounts which had to be granted to purchasers of the
Group’s apartments in order to facilitate sales.
Real estate valuation
The Group’s results of operations depend heavily on the fluctuation of the value of assets on the property
markets. The Group revalues its investment properties at least twice per year. Any change in fair value of
investment property is thereafter recognized as a gain or loss in the income statement.
57
The following three significant factors influence the valuation of the Group’s properties: (i) the cash flow arising
from operational performance, (ii) the expected rental rates and (iii) the capitalization rates that result from the
interest rates in the market and the risk premiums applied to the Group’s business.
The cash flow arising from operational performance is primarily determined by current gross rental income per
square meter, vacancy rate trends, total portfolio size, maintenance and administrative expenses, and operating
expenses. Expected rental values are determined predominantly by expected development of the
macroeconomic indicators as GDP growth, disposable income, etc. as well as micro conditions such as new
developments in the immediate neighborhood, competition, etc. Capitalization rates are influenced by prevailing
interest rates and risk premium. In the absence of other changes when capitalization rates increase, market value
decreases and vice versa. Small changes in one or some of these factors can have a considerable effect on the
fair value of the Group’s investment properties and on the results of its operations.
Moreover, the valuation of the Group’s landbank additionally depends on among others the building rights and the
expected timing of the projects. The value of landbank which is assessed using a comparative method is
determined by referring to the market prices applied in transactions relating to similar properties.
The Group recognized net profit from revaluation and impairment of assets and residential projects of €26,222
and loss of €194,404 in the year ended 31 December 2015 and in the year ended 31 December 2014,
respectively.
Impact of interest rate movements
Substantially all of the loans of the Group have a variable interest rate, mainly connected to EURIBOR. The bonds
issued by the Company are denominated in PLN and bear interest connected to WIBOR. Increases in interest
rates generally increase the Group’s financing costs. As of 31 December 2015 approximately 58% of the Group’s
loans were hedged or partially hedged. For example, an interest rate increase of 50 basis points for the year
ended 31 December 2015 would have increased the Group’s interest expense for the year ended 31 December
2015 by approximately €1,115. In addition, in an economic environment in which availability of financing is not
scarce, demand for investment properties generally tends to increase when interest rates are low, which can lead
to higher valuations of the Group’s existing investment portfolio. Conversely, increased interest rates generally
adversely affect the valuation of the Group’s properties, which can result in recognition of impairment that could
negatively affect the Group’s income.
Historically, EURIBOR rates have demonstrated significant volatility, changing from 1.343% as of 2 January
2012, through 0.188% as of 2 January 2013, to 0.280% as of 3 January 2014, 0,076% as of 2 January 2015 and
–0,1320% as of 4 January 2016 (EURIBOR for three-month deposits).
Impact of foreign exchange rate movements
For the year ended 31 December 2014 and for the year ended 31 December 2015 a vast majority of the Group’s
revenues and costs were incurred or derived in euro. Nonetheless, the exchange rates against euro of the local
currencies of the countries in which the Group operates are an important factor as the credit facilities that are
obtained may be denominated in either euro or local currencies.
The Group reports its financial statements in euro, its operations, however, are based locally in Poland, Romania,
Hungary, Croatia, Serbia, Bulgaria, Slovakia and other countries. The Group receives the majority of its revenue
from rent denominated in euro, however, it receives a certain portion of its income (including the proceeds from
the sales of residential real estate) and incurs most of its costs (including the vast majority of its selling expenses
and administrative expenses) in local currencies, including the Polish zloty, Bulgarian leva, Czech korunas,

58
Croatian cunas, Hungarian forints, Romanian lei and Serbian dinars. In particular, the significant portion of the
financial costs incurred by the Group includes: (i) the interest on the bonds issued by the Group in Polish zloty
and (ii) the interest on the loan taken by the Group in Hungarian forints. The exchange rates between local
currencies and euro have historically fluctuated.
The income tax expense (both actual and deferred) in the jurisdictions in which the Group conducts its operations
is incurred in such local currencies. Consequently, such income tax expense was and may continue to be
materially affected by foreign exchange rate movements.
Accordingly, the foreign exchange rate movements have a material impact on the Group’s operations and
financial results.
Availability of financing
In the CEE and SEE markets, real estate development companies, including the companies of the Group, usually
finance their real estate projects with proceeds from bank loans, loans extended by their holding companies or
the issuance of debt securities. The availability and cost of procuring financing are of material importance to the
implementation of the Group’s projects and for the Group’s development prospects, as well as its ability to repay
existing debt. Finally, the availability and cost of financing may impact the Group’s sales dynamics and the
Group’s net profit.
In the past, the principal sources of financing for the Group’s core business included, apart from proceeds from
asset disposals, bank loans and proceeds from bonds issued by the Company.
Item 5.2. Specific factors affecting financial and operating results
As of 31 December 2014, the loan agreements with Unicredit related to the Felicity residential project with an outstanding loan amount of €25,600 exceeded the fair value of related asset. In March 2015, the Company transferred the Felicity project to a subsidiary of Unicredit. Unicredit released the Company from any payment obligations arising from the loan agreements.
On 29 May 2015, the Group, signed with Kazimierz Office Center Sp. z o.o., a subsidiary of a fund managed by GLL Real Estate Partners, an agreement for the sale of an office building Kazimierz Office Centre in Krakow. The net price for the property and the other rights and movable assets under the sale agreement is €41,600.
In June 2015, the Group fully repaid the loan from OTP and MKB (Galleria Varna) in the amount of €17,700. At the same time, MKB and OTP granted GTC S.A a new loan in the amount of €12,600.
On 26 June 2015, the Company and EBRD entered into an agreement for the restructuring of a loan to Mars Commercial Center SRL (Galleria Piatra Mall), and Mercury Commercial Center SRL (Galleria Arad), in Romania. Furthermore, in June 2015, the Company and EBRD agreed on the restructuring of a loan granted to Galleria Stara Zagora AD, the owner of Galleria Stara Zagora, Bulgaria. On 3 July 2015, the Company and EBRD entered into an agreement for the restructuring of a loan extended by the EBRD to Galleria Stara Zagora AD
In June 2015, the Group fully repaid the loan from EBRD and Raiffeisen Bank Austria (Avenue Mall Osijek) in the amount of €15,800.
During the second quarter 2015, the Group acquired remaining 35% in Galeria Ikonomov GmbH (owner of Galleria Varna) and remaining 20% in GTC Nekretnine Istok d.o.o. (owner of Avenue Mall Osijek). As a result, the impact of on the equity attributable to equity holders of the parent amounted to a decrease of €35,800.
59
In April 2015 as a result of liquidation of one of the joint venture companies, investment in joint ventures decreased by €67,000 and long term liabilities decreased by €63,000.
In July 2015, the Group sold the shares of GTC Nekretnine Istok d.o.o (owner of Avenue Mall Osijek) for the amount of €1,300.
In July 2015, the Group sold the shares of Galleria Varna AD (Galleria Varna) for the amount of €5,500.
In July 2015, the Group commenced the construction of Galeria Połnocna shopping centre, Warsaw.
In July 2015, the Group has completed the first building in its new office complex in Belgrade – Fortyone. Very good leasing results and an increasing interest from the tenants allowed GTC to commence the construction of second building in this project in October 2015.
In August 2015, the Group signed a credit facility agreement with Bank Polska Kasa Opieki S.A., concerning financing and refinancing of total project costs of the construction of Galeria Północna. These facilities comprise a construction loan facility in the amount of up to €116,000 and investment loan facility in the amount of up to €150,000. (Under financial thresholds the investment facility may be increased up to €175,000.)
In September 2015, the Group commenced the construction of University Business Park second phase in office complex located in Łódź.
On 21 October 2015, the District Court for the Capital City of Warsaw in Warsaw, registered the increase of the Company’s share capital from PLN 35,131,028.80 (not in thousand) to PLN 46,021,647.80 (not in thousand) through the issuance of 108,906,190 series K ordinary bearer shares in the Company with a nominal value of PLN 0.10 (ten groszy) each. On 26 October 2015, the funds from the share issuance in the amount of PLN 595,700 (€140,102) were received by Company.
In November 2015, the Group acquired Duna Tower office building in Budapest, Hungary, the total acquisition cost amount to €53,080. Duna Tower office building is located in the 13th District of Budapest and is leased to international tenants. GTC intends to continue the leasing activity through upgrading the property and improving its occupancy.
In December 2015, the Group acquired remaining 41.1% in BCG (owner of a company, which owns City Gate office building in Bucharest) for the total amount of €18,108 which was paid in 2016. The impact of on the equity attributable to equity holders of the parent amounted to an increase of €5,400.
Item 5.3.Presentation of differences between achieved financial results and published forecasts
The Group did not present forecasts for 2015.
Item 5. 4. Statement of financial position
Item 5.4.1. Key items of the statement of financial position
Investment property
Investment properties that are owned by the Group comprise office and commercial space, including property
under construction. Investment property can be split up into: (i) completed investment property; (ii) investment
property under construction presented at fair value; and (iii) investment property under construction presented at
cost.
Residential landbank

60
The Group classifies its residential inventory as current or non-current assets based on their development stage
within the business operating cycle. The normal operating cycle in most cases falls within a period of one to five
years. The Group classifies residential inventory the development of which is planned to be commenced at least
one year after the balance sheet date as residential landbank, which is part of its non-current assets.
61
Investment in associates and joint ventures
Investment in associates and joint ventures is accounted for pursuant to the equity method. Such investment is
carried in the statement of financial position at cost plus post-acquisition changes in the Group’s share of the net
assets of the associate and joint ventures.
Assets held for sale
Assets held for sale comprise office or retail space and land plots that are designated for sale.
Inventory
Inventory relates to residential projects under construction and is stated at the lower of cost and net realisable
value. Expenditures relating to the construction of a project are included in inventory.
The Group classifies its residential inventory as current or non-current assets based on their development stage
within the business operating cycle. The normal operating cycle in most cases falls within a period of one to five
years. Residential projects which are active are classified as current inventory.
Short-term deposits
Short-term and long-term deposits are restricted and can be used only for certain operating activities as
determined by underlying contractual commitments.
Derivatives
Derivatives include instruments held by the Group that hedge the risk involved in the fluctuations of interest and
currency rates. In relation to the instruments qualified as cash flow hedges, the portion of gain or loss on the
hedging instrument that is determined to be an effective hedge is recognized directly in other comprehensive
income and the ineffective portion is recognized in net profit or loss. The classification of hedges in the statement
of financial position depends on their maturity. For derivatives that do not qualify for hedge accounting, any gain
or losses arising from changes in fair value are recorded directly in net profit and loss for the year. The fair value
of interest rate swap contracts is determined by reference to market values for similar instruments
Item 5.4.2. Financial position as of 31 December 2014 compared to 31 December 2013
Total assets increased by €42,486 (3%) to €1,559,550 as of 31 December 2015. This increase was mainly due to an increase in investment property and cash and cash equivalents following share issue, partially offset by disposal of residential inventory and landbank.
Assets
The value of investment property increased by €67,210 (6%) to €1,288,529 as of 31 December 2015 from €1,221,319 as of 31 December 2014 mainly as a result of acquisition of Duna Tower office building in Budapest for the amount of €53,080 (including acquisition cost), an investment of €40,679 mainly in Fortyone office building in Belgrade, University Business Park II office building in Łódź and Galeria Północna shopping centre in Warsaw as well as revaluation gain attributed to these projects. This increase was partially offset by sale of Kazimierz Office Centre in Kraków for the amount of €41,577 and Jarossova €8,949.
The value of assets held for sale of €5,950 as of 31 December 2015 includes Galleria Arad in Romania and land plots in Serbia and Poland that are under preliminary sale agreements.

62
The value of residential landbank and inventory decreased by €35,049 (54%) to €29,934 as of 31 December 2015 from €64,983 as of 31 December 2014, mainly due to disposal of residential landbank and inventory in Felicity project as part of the restructuring arrangement with the lender and sale of completed apartments in other projects in the amount of €12,364.
The value of investment in associates and joint ventures decreased by €72,979 to €23,067 as of 31 December 2015 from €96,046 as of 31 December 2014 mainly due to liquidation of a joint venture company (Galeria Kazimierz) €66,637 and a reclassification of land in Ukraine into investment property following acquisition of remaining shares in Europort Investment (Cyprus) 1 Limited, Europort LTD. The Galeria Kazimierz asset was sold in prior year whilst the joint venture company was liquidated in the second quarter of 2015 following dividend distribution to the joint venture shareholders.
The value of cash and cash equivalents increased by €88,409 (109%) to €169,472 as of 31 December 2015
from €81,063 as of 31 December 2014, mainly due recognition of proceeds from the issue of shares in the net amount of €137,621 , which were partially offset by acquisition of Duna Tower in the amount of €53,080
(including acquisition cost) and investment in an amount of €33,519 in development of investment property,
mainly in Galeria Północna, University Business Park, Fortyone (I+II), and Ada Mall projects.
Liabilities
The value of loans and bonds decreased by €183,079 (20%) to €739,112 as of 31 December 2015 from €922,191 as of 31 December 2014, mainly due to repayment of loans in the amount of €66,637 as part of liquidation of Galeria Kazimierz, €27,368 as part of sale of Galeria Kazimierz Office, €46,700 as part of loan restructuring exercise executed in the second quarter of 2015, €35,100 as part of ongoing amortization.
The value of trade and other payables increased by €9,124 (46%) to €28,774 as of 31 December 2015 from €19,650 as of 31 December 2014 and consisted mainly of €11,396 of construction invoices which were paid in January 2016.
The value of purchase of non-controlling interest amounted to €18,108 as of 31 December 2015 and consisted €18,108 acquisition of the minority stake in City Gate, which was paid on 5 January 2016
Equity
Equity increased by €194,021 (45%) to €621,202 as of 31 December 2015 from €427,181 on 31 December 2014 mainly due to an increase in share capital and premium in the amount of €137,621 following share issue.
Accumulated profit increased by €45,192 to €156,647 as of 31 December 2015.
Item 5.5. Consolidated income statement
Item 5.5.1. Key items of the consolidated income statement
Revenues from operations
Revenues from operations consist of:
rental income, which consists of monthly rental payments paid by tenants of the Group’s investment
properties for the office or retail space rented by such tenants. Rental income is recognized as income
over the lease term;
service income, which comprises fees paid by the tenants of the Group’s investment properties to cover
the costs of the services provided by the Group in relation to their leases; and

63
residential revenue, which comprises proceeds from the sales of houses or apartments, which is
recognized when such houses or apartments have been substantially constructed, accepted by the
customer and a significant amount resulting from the sale agreement has been paid by the purchaser.
Cost of operations
Costs of operations consist of:
service costs, which consist of all the costs that are related to the management services provided to the
individual tenants within the Group’s properties — service costs should be covered by service income;
and
residential costs, which comprise the costs that are related to the development of residential properties sold. The costs related to the development of residential properties incurred during the construction period are capitalized in inventory. Once income is recognized, the costs in respect of sold units are expensed.
Gross margin from operations
Gross margin from operations is equal to the revenues from operations less the cost of operations.
Selling expenses
Selling expenses include:
brokerage and similar fees incurred to originate the lease or sale of space;
marketing and advertising costs; and
payroll and related expenses directly related to leasing or sales personnel.
Administrative expenses
Administration expenses include:
payroll, management fees and other expenses that include the salaries of all employees that are not
directly involved in sales or rental activities;
provisions made to account for the share-based incentive program that was granted to key personnel;
costs related to the sale of investment properties;
costs of audit, legal and other advisors;
office expenses;
depreciation and amortization expenses include depreciation and amortization of the Group’s property,
plant and equipment;
exchange gains or losses; and
others.

64
Profit/(loss) from the revaluation/impairment of assets
Net valuation gains (loss) on investment property and investment properties under development reflect the
change in the fair value of investment properties and investment property under development.
Financial income/(expense), net
Financial income includes interest on loans granted to associate companies and interest on bank deposits.
Financial expenses include interest on borrowings and deferred debt rising expenses. Borrowing costs are
expensed in the period in which they are incurred, except for those that are directly attributable to construction. In
such a case, borrowing costs are capitalized as part of the cost of the asset. Borrowing costs include interest and
foreign exchange differences.
Additionally, financial income or expenses include settlement of financial assets and gain or losses arising from
changes in fair value of derivatives that do not qualify for hedge accounting.
Taxation
Income tax on profit or loss for the year comprises current and deferred tax. Current tax is the expected tax
payable on the taxable income for the year using tax rates enacted or substantially enacted as of the balance
sheet date and any adjustments to tax payable in respect of previous years. Generally, the Group disposes of
property holding companies rather than the real estate itself, in part because in certain jurisdictions the sale and
disposal of real estate is generally subject to real estate transfer tax and/or VAT.
Item 5.5.2. Comparison of financial results for the 12 month period ended 31 December 2014 with the result for the corresponding period of 2013
Revenues from operations
Revenues from operations decreased by €6,921 to €117,363 in the 12-month period ended 31 December 2015.
Residential revenues decreased by €2,285 to €12,364 in the 12-month period ended 31 December 2015 due to a
decrease in inventory available for sale. The sale of the remaining residential inventory is scheduled to end by
end of March 2016. Rental and service revenues decreased by €4,636 to €104,999 in the 12-month period ended
31 December 2015 due to sale of Kazimierz Office Centre, Galleria Buzau, Jarosova and Avenue Mall Osijek
combined with rent free periods and a decrease in rental rates in certain office properties.
Cost of operations
Cost of operations decreased by €5,882 to €37,333 in the 12-month period ended 31 December 2015.
Residential costs decreased by €3,581 to €10,871 in the 12-month period ended 31 December 2015 resulting
from recognition of costs related to sales of residential properties in Romania and Poland. Cost of rental
operations decreased by €2,241 to €26,462 in the 12-month period ended 31 December 2015 as a result of the
sale of Kazimierz Office Centre, Galleria Buzau, Jarosova and Avenue Mall Osijek.
Gross margin from operations
Gross margin (profit) from operations decreased by €1,099 to €80,030 in the 12-month period ended 31
December 2015. The gross margin (profit) on rental activities decreased by €2,395 to €78,537 in the 12-month
period ended 31 December 2015 from €80,932 in the 12-month period ended 31 December 2014. Gross margin
on rental activities in the 12-month period ended 31 December 2015 was 75% compared to 74% in the 12-month

65
period ended 31 December 2014. The gross margin (profit) on residential activities increased by €1,296 to €1,493
in the 12-month period ended 31 December 2015 from €197 in the 12-month period ended 31 December 2014.
Gross margin on residential activities was 12% in the 12-month period ended 31 December 2015 as compared to
1% in the 12-month period ended 31 December 2014.
Selling expenses
Selling expenses decreased by €163 to €2,721 in the 12-month period ended 31 December 2015 from €2,884 the
12-month period ended 31 December 2014.
Administrative expenses
Administrative expenses (before provision for stock based program) decreased by €1,169 to €10,182 in the 12-
month period ended 31 December 2015. The decrease is due to optimization of certain cost items. In addition,
mark-to-market of Phantom Shares program (see: Item 12.9 Stock option plan) resulted in recognition of cost of
€863 in the 12-month period ended 31 December 2015 compared to recognized income of €2,570 in the 12-
month period ended 31 December 2014.
Profit/(loss) from the revaluation/impairment of assets and impairment of residential projects
Net profit from the revaluation of the investment properties and impairment of residential projects amounted to
€26,222 in the 12-month period ended 31 December 2015, as compared to a net loss of €194,404 in the 12-
month period ended 31 December 2014.
Other income/(expense), net
Other expenses (net of other income) related to landbank properties were at €785 in the 12-month period ended
31 December 2015 as compare to an income of €616 in the 12-month period ended 31 December 2014.
Foreign exchange profit/(loss)
Foreign exchange profit amounted to €1,394 in the 12-month period ended 31 December 2015, as compared to a
foreign exchange loss amounting to €93 in the 12-month period ended 31 December 2014.
Financial income/(cost), net
Net financial cost decreased by €13,181 to €29,356 in the 12-month period ended 31 December 2015 as
compared to €42,537 in the 12-month period ended 31 December 2014 mainly due to deleveraging activity,
restructuring of loans and repayment of loan related to Kazimierz Office Centre following its sale and repayment
of loan related to Felicity project following the restructuring arrangement with the lender. The decrease was also
supported by low EURIBOR environment and resulted in a decrease in average borrowing cost to 3.4% in the 12-
month period ended 31 December 2015 from 4.2% in the 12-month period ended 31 December 2014.
Share of loss of associates
Share of loss of associates was €8,163 in the 12-month period ended 31 December 2015 as compared to a share
of loss of €27,568 in the 12-month period ended 31 December 2014. The share of loss in 2015 is mainly due to
decrease in value of plots in Ukraine and Russia.

66
Taxation
Taxation amounted to €11,937 the 12-month period ended 31 December 2015. Taxation consist of €7,011 of
current tax expenses and €5,011 of deferent tax expenses.
Net profit/ (loss)
Net profit amounted to €43,639 in the 12-month period ended 31 December 2015, as compared to a net loss of €207,390 in the 12-month period ended 31 December 2014, mostly due to recognition of profit from the revaluation of the investment properties and impairment of residential projects of €26,222 combined with significant decrease in financial cost net.
Business segmental analysis
The Group operating segments are carried out through subsidiaries that develop real estate projects.
The operating segments are aggregated into reportable segments, taking into consideration the nature of the business, operating markets and other factors. Reportable segments are divided into two main segments:
1. Development and rental of office space and shopping malls (“rental activity”) and
2. Development and sale of houses and apartment units (“residential activity”).
Current operating segments are divided into geographical zones, which have common characteristics and reflect the nature of management reporting structure:
a. Poland and Hungary
b. Capital cities in SEE (South and Eastern Europe) countries (Romania, Serbia, Croatia, Slovakia)
c. Secondary cities in Bulgaria
d. Secondary cities in Croatia
e. Secondary cities in Romania.
Management monitors gross margin from operations of its business units for the purposes of making performance
assessment and decision making. Operating segment performance is evaluated based on gross margin from
operations.
The resource allocation decisions made by the management are based, amongst others, on segmental analysis.

67
Segment analysis for the year ended 31 December 2015 and year ended 31 December 2014 is presented below:
Poland and Hungary
Capital cities in SEE countries
Bulgaria-secondary cities
Croatia-secondary cities
Romania-secondary cities
Consolidated
31 December
2015
31 December
2014
31 December
2015
31 December
2014
31 December
2015
31 December
2014
31 December
2015
31 December
2014
31 December
2015
31 December
2014
31 December
2015
31 December
2014
Rental and service income 58,181 60,226 35,335
36,704 7,956
7,346 705
1,611 2,822
3,748 104,999
109,635
Contract income 5,311 3,509 7,053
11,140 - - - - - - 12,364
14,649
Total income 63,492 63,735 42,388 47,844 7,956 7,346 705 1,611 2,822 3,748 117,363 124,284
Rental and service costs 12,623 12,028 8,936
9,124 2,083
2,445 695
1,803 2,125
3,303 26,462
28,703
Contract costs 4,003 2,203 6,868
12,249 - - - - - - 10,871
14,452
Total costs 16,626 14,231 15,804 21,373 2,083 2,445 695 1,803 2,125 3,303 37,333 43,155
Rental result 45,558 48,198 26,399
27,580 5,873
4,901 10
(192) 697
445 78,537
80,932
Contract result 1,308 1,306 185
(1,109) - - - - - - 1,493
197
Segment result 46,866 49,504 26,584 26,471 5,873 4,901 10 (192) 697 445 80,030 81,129
Loss from revaluation/ impairment of assets
Investment properties
27,958
(39,812)
1,811
(56,120)
(90)
(21,624)
(520)
(15,104)
(1,637)
(27,665)
27,522
(160,325)
Residential (1,300)
(9,432)
-
(16,047)
- - -
(8,600)
- - (1,300)
(34,079)
26,658 (49,244) 1,811 (72,167) (90) (21,624) (520) (23,704) (1,637) (27,665) 26,222) (194,404)

68
Poland and Hungary
Capital cities in SEE countries
Bulgaria-secondary cities
Croatia-secondary cities
Romania-secondary cities
Consolidated
31 December
2015
31 December
2014
31 December
2015
31 December
2014
31 December
2015
31 December
2014
31 December
2015
31 December
2014
31 December
2015
31 December
2014
31 December
2015
31 December
2014
Segment assets
Allocated assets rental 809,611
732,293 448,317
418,927 59,460
64,533 -
1,751 6,819
13,273 1,324,207
1,230,777
Allocated assets residential 10,605
17,399 6,609
44,756 - - 6,850 6,740 - - 24,064
68,895
Unallocated assets 141,890 176,676 62,321 35,428 4,876 2,482 1,385
1,666 808 1,140 211,280 217,392
Total assets 962,106 926,368 517,247 499,111 64,336 67,015 8,235 10,157 7,627 14,413 1,559,551 1,517,064
Segment liabilities
Allocated liabilities rental 68,796
25,365 65,823
43,741 2,637 1,548 -
887 1,145
698 138,401
72,239
Allocated liabilities residential 1,110
1,356 2,462 1,485 - - - 1,363 - 3,572 4,204
Unallocated liabilities 543,076 610,254 160,542 276,063 48,221 70,231 - 23,107 44,535 33,785 796,374 1,013,440
Total liabilities 612,982 636,975 228,827 321,289 50,858 71,779 - 25,357 45,680 34,483 938,347 1,089,883
Unallocated assets include mostly cash and cash equivalents, deposits, investments in associates and loans granted. Unallocated liabilities include mostly loans received, bonds and hedges, and unallocated part of deferred tax liability.
Item 5. 6. Consolidated cash flow statement
Item 5.6.1. Key items from consolidated cash flow statement
Net cash from (used in) operating activities
The operating cash flow is the cash that the Group generates through running its business and comprises cash
inflows from rental activities and sale of residential projects.
Net cash used in investing activities
The investing cash flow is the aggregate change in the Group’s cash position resulting from any gains (or losses)
from investments in the financial markets, investment properties and operating subsidiaries, as well as changes
resulting from amounts spent on investments in capital assets, such as property, plant and equipment.
Net cash from (used in) financing activities
The cash flow from (used in) financing activities accounts for, inter alia, the payment of cash dividends, receiving
proceeds from loans or bond and issuing stock.
Cash and cash equivalents
Cash balance consists of cash in banks. Cash in banks earns interest at floating rates based on daily bank deposit rates. Short-term deposits are made for varying periods of between one day and three months, depending on the immediate cash requirements of the Group, and earn interest at the respective short-term
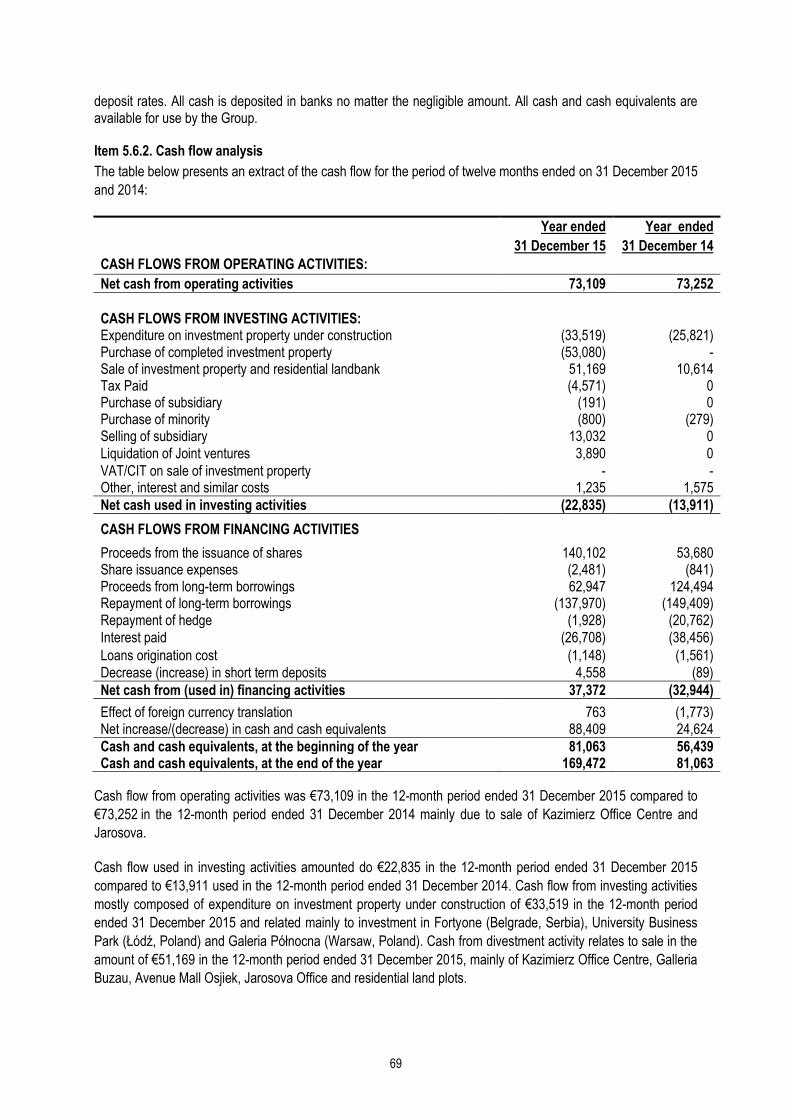
69
deposit rates. All cash is deposited in banks no matter the negligible amount. All cash and cash equivalents are available for use by the Group.
Item 5.6.2. Cash flow analysis
The table below presents an extract of the cash flow for the period of twelve months ended on 31 December 2015
and 2014:
Year ended Year ended
31 December 15 31 December 14
CASH FLOWS FROM OPERATING ACTIVITIES:
Net cash from operating activities 73,109 73,252
CASH FLOWS FROM INVESTING ACTIVITIES: Expenditure on investment property under construction (33,519) (25,821) Purchase of completed investment property (53,080) - Sale of investment property and residential landbank 51,169 10,614 Tax Paid (4,571) 0 Purchase of subsidiary (191) 0 Purchase of minority (800) (279) Selling of subsidiary 13,032 0
Liquidation of Joint ventures 3,890 0
VAT/CIT on sale of investment property - - Other, interest and similar costs 1,235 1,575
Net cash used in investing activities (22,835) (13,911)
CASH FLOWS FROM FINANCING ACTIVITIES
Proceeds from the issuance of shares 140,102 53,680 Share issuance expenses (2,481) (841) Proceeds from long-term borrowings 62,947 124,494 Repayment of long-term borrowings (137,970) (149,409) Repayment of hedge (1,928) (20,762)
Interest paid (26,708) (38,456)
Loans origination cost (1,148) (1,561)
Decrease (increase) in short term deposits 4,558 (89)
Net cash from (used in) financing activities 37,372 (32,944)
Effect of foreign currency translation 763 (1,773) Net increase/(decrease) in cash and cash equivalents 88,409 24,624
Cash and cash equivalents, at the beginning of the year 81,063 56,439 Cash and cash equivalents, at the end of the year 169,472 81,063
Cash flow from operating activities was €73,109 in the 12-month period ended 31 December 2015 compared to
€73,252 in the 12-month period ended 31 December 2014 mainly due to sale of Kazimierz Office Centre and
Jarosova.
Cash flow used in investing activities amounted do €22,835 in the 12-month period ended 31 December 2015
compared to €13,911 used in the 12-month period ended 31 December 2014. Cash flow from investing activities
mostly composed of expenditure on investment property under construction of €33,519 in the 12-month period
ended 31 December 2015 and related mainly to investment in Fortyone (Belgrade, Serbia), University Business
Park (Łódź, Poland) and Galeria Północna (Warsaw, Poland). Cash from divestment activity relates to sale in the
amount of €51,169 in the 12-month period ended 31 December 2015, mainly of Kazimierz Office Centre, Galleria
Buzau, Avenue Mall Osjiek, Jarosova Office and residential land plots.

70
Cash flow from financing activities amounted to €37,372 in the 12-month period ended 31 December 2015,
compared to €32,944 of cash flow used in financing activities in the 12-month period ended 31 December 2014.
Cash flow from financing activities mostly composed of net proceeds from the issuance of shares of €137,621m
and proceeds from long-term borrowings of €62,947, offset partially by repayment of long term borrowings of
€137,970 related mostly to Kazimierz Office Centre, Avenue Mall Osijek and Galeria Varna and standard
amortization of loans and payment of interest in the amount of €26,708.
Cash and cash equivalents as of 31 December 2015 amounted to €169,472 compared to €81,063 as of 31
December 2014. The Group keeps its cash in the form of bank deposits, mostly in Euro, with various international
banks.
Item 5.7. Future liquidity and capital resources
As of 31 December 2015, the Group holds cash and cash equivalent in the amount of approximately €169,472.
During the third quarter of 2015, the Group increased its share capital via the rights issue. The proceeds from the
share issue amounted to €140,102. The Group attempts to efficiently manage all its liabilities and is currently
reviewing its funding plans related to: (i) development and acquisition of commercial properties, (ii) debt servicing
of its existing assets portfolio and (iii) capex. Such funding will be sourced through available cash, operating
income, sales of assets and refinancing.
As of 31 December 2015, the Group’s non-current liabilities amounted to €806,969 compared to €944,680 as of
31 December 2014.
The Group’s total debt from long and short-term loans and borrowings as of 31 December 2015 amounted to
€739,112 as compared to €922,191 as of 31 December 2014. The Group’s loans and borrowings are mainly
denominated in Euro, except for the corporate bonds that are denominated in PLN.
The Group’s loan-to-value ratio amounted to 39.4% as of 31 December 2015, as compared to 54.0% as of 31
December 2014. The Group’s strategy is to keep its loan-to-value ratio at the level of around 50%.
As of 31 December 2015, 58% of the Group’s loans (by value) were hedged against interest fluctuations, mostly
through interest rate swaps and currency swap as mentioned above.
Item 6. Information on use of proceeds from the issuance of shares and bonds
On 30 September 2015, the Company issued 108,906,190 Series K Shares at a price of 5.47 PLN per share. The net proceeds from the issuance of the shares amounted to €137,621 (PLN 585,296).
Net proceeds from the issuance of the shares of €137,621 (net of issuance expenses in the amount of €2,481)
were used to finance acquisition of Duna Tower in amount of €53,080 (including acquisition cost), acquisition of
remaining shares in City Gate in the amount of €18,108, acquisition of Pixel in the amount of €32,000 (in 2016)
and investment in Ada Mall and University Business Park projects of €7,466. Remaining amount will be used to
further finance the acquisition of value-add projects and development of selective assets as outlined in the
prospectus published on 7 September 2015.

71
Item 7. Information on loans granted with a particular emphasis on related entities
During 2015, the Group did not grant any new loans to its associates or joint ventures.
The following table presents the balance as of 31 December 2015 of long-term loans that have been granted to
the Group’s subsidiaries and associates:
Associate Amount of
loan (€) Currency Interest rate
Yatelsis Viborgskaya Limited of Nicosia 32,944 USD 9%
Ana Tower Offices S.R.L 1,422 EUR 3m Euribor+3.25% CID Holding S.A. 23,987 EUR 85%*(3 m Euribor +4.5%)
Lighthouse Holdings Limited S.A. 3,965 EUR 85%*(3 m Euribor +4.5%)
Item 8. Information on granted and received guarantees with a particular emphasis on guarantees granted to related entities
Company granted guarantees to third parties in order to secure construction cost-overruns and loans to its subsidiaries. As of 31 December 2015 and 31 December 2014, the guarantees granted amounted to €74,000 and €149,000, respectively. Additionally, in connection with the sale of its assets, the Company gave typical warranties under the sale agreements, which are limited in time and amount. The risk involved in above warranties is very low.
In the normal course of our business activities the Group receive guarantees from the majority of its tenants to secure the rental payments on the leased space.
Item 9. Off balance liabilities
Investment properties in secondary cities
In certain real estate markets in which the Company is active, including especially non-capital cities of SEE, there are indications of slower than expected recovery and revival of demand, as well as absence of liquidity and transactions, resulting in a lack of clarity and uncertainty as to estimated rental values, yields and property values. There are also markets with rising vacancies due to oversupply of real estate product and lack of economic growth that would create appropriate demand. Therefore property values are going through a period of increased volatility. This has resulted in a continual devaluation of commercial property values, especially in SEE. As a result there is less certainty with regard to market values that change rapidly in the current market environment. Too broad for present situation. Should be soften and focused.
Commitments As of 31 December 2015 (31 December 2014), the Group had commitments contracted for in relation to future building construction without specified date, amounting to €158,000 (€8,000). These commitments are expected to be financed from available cash and current financing facilities, other external financing or future instalments under already contracted sale agreements and yet to be contracted sale agreements.

72
Guarantees GTC gave guarantees to third parties in order to secure construction cost-overruns and loans to its subsidiaries. As of 31 December 2015 and 31 December 2014, the guarantees granted amounted to €74,000 and €149,000, respectively. Additionally, in connection with the sale of its assets, the Company gave typical warranties under the sale agreements, which are limited in time and amount. The risk involved in above warranties is very low. Croatia In relation to the Marlera Golf project in Croatia, part of the land is held on a lease basis from the State. There is furthermore a Consortium agreement with the Ministry of Tourism of Croatia (Ministry) which includes a deadline for the completion of a golf course that has passed in 2014. The Company has taken active steps to achieve an extension of the period for completing the project. In February 2014, the Company received a draft amendment from the Ministry expressing its good faith and intentions to prolong the abovementioned timeline however the amendment was not formalized. At the end of 2015 parliamentary elections were held in Croatia and in January 2016 a new Government was appointed. The Company has formally approached the new Minister of Tourism with a request to formalize the amendment to the Consortium agreement however the extension is no longer at the sole discretion of the Group. As a result, the Management has decided to revalue the freehold asset in assuming no development of the golf course project. As of 31 December 2015 the book value of the investment in Marlera was assessed by an independent valuer at €6,900 and is assumed to be fully recoverable. Russia
As of 31 December 2015, the Group holds 50% interest in Yatelsis, which indirectly owns land and buildings in St.
Petersburg, Russia.
During the last year, the economic and political uncertainty in Russia remained high. The market uncertainty
created an unclear view as for potential future development of the St. Petersburg project and availability of
reliable information related to such project. The Group's balance sheet exposure to St. Petersburg amounted to
approximately €4,600. The above mentioned events could adversely impact the results and financial position of
the Group and its St. Petersburg investments in a manner that could not be estimated at this stage.
Item 10. Major investments, local and foreign (securities, financial instruments, intangible assets, real estate), including capital investments outside the Group and its financing method
The Group does not have any major local or foreign investments other than direct investments in real estate
properties designated for development, or through companies that hold such real estate.
Item 11. Information on market risks
The Group’s principal financial instruments comprise bank and shareholders’ loans, hedging instruments, trade payables and other long-term financial liabilities. The main purpose of these financial instruments is to raise finance for the Group’s operations. The Group has various financial assets such as trade receivables, loans granted, derivatives and cash and short-term deposits. The main risks arising from the Group’s financial instruments are cash flow interest risk, liquidity risk, foreign currency risk and credit risk.

73
Interest rate risk
The Group exposure to changes in interest rates which are not offset by hedge relates primarily to the Group's long-term debt obligations and loans granted.
The Group’s policy is to obtain finance bearing variable interest rate. To manage the interest rate risk in a cost-efficient manner, the Group enters into interest rate swaps or cap transactions.
The majority of the Company’s loans are nominated or swapped into Euro.
A 50bp change in Euribor rate would lead to €1,115 change in profit (loss) before tax.
Foreign currency risk
The group enters into transactions in currencies other than the Group's functional currency. Therefore it hedges the currency risk by either matching the currency of the inflow, outflow and cash and cash equivalent with that of the expenditures.
The table below presents the sensitivity of profit (loss) before tax due to change in foreign exchange:
2015 2014
PLN/Euro PLN/Euro
+10% +5% -5% -10% +10% +5% -5% -10%
Cash and cash equivalents
5,588 2,794 (2,794) (5,588) 2,878 1,439 (1,439) (2,878)
Trade and other receivables
662 331 (331) (662) 214 106 (106) (214)
Trade and other payables
(1,598) (779) 779 1,598 (558) (279) 279 558
Bonds (11,756) (5,588) 5,588 11,756 (11,594) (5,797) 5,797 11,594
Exposure to other currencies and other positions in statement of financial position are not material.
Credit risk
Credit risk is the risk that a party to a financial instrument will fail to discharge an obligation. To manage this risk the Group periodically assesses the financial viability of its customers. The Group does not expect any counter parties to fail in meeting their obligations. The Group has no significant concentration of credit risk with any single counterparty or Group counterparties.
With respect to trade receivables and other receivables that are neither impaired nor past due, there are no indications as of the reporting date that those will not meet their payment obligations.
With respect to credit risk arising from the other financial assets of the Company, which comprise cash and cash equivalents and blocked deposits the Company’s exposure to credit risk equals to the carrying amount of these instruments.
The maximum exposure to credit risk as of the reporting date is the full amount presented. The Company cooperates with reputable banks.
There are no material financial assets as of the reporting dates, which are overdue and not impaired. There are no significant financial assets impaired.
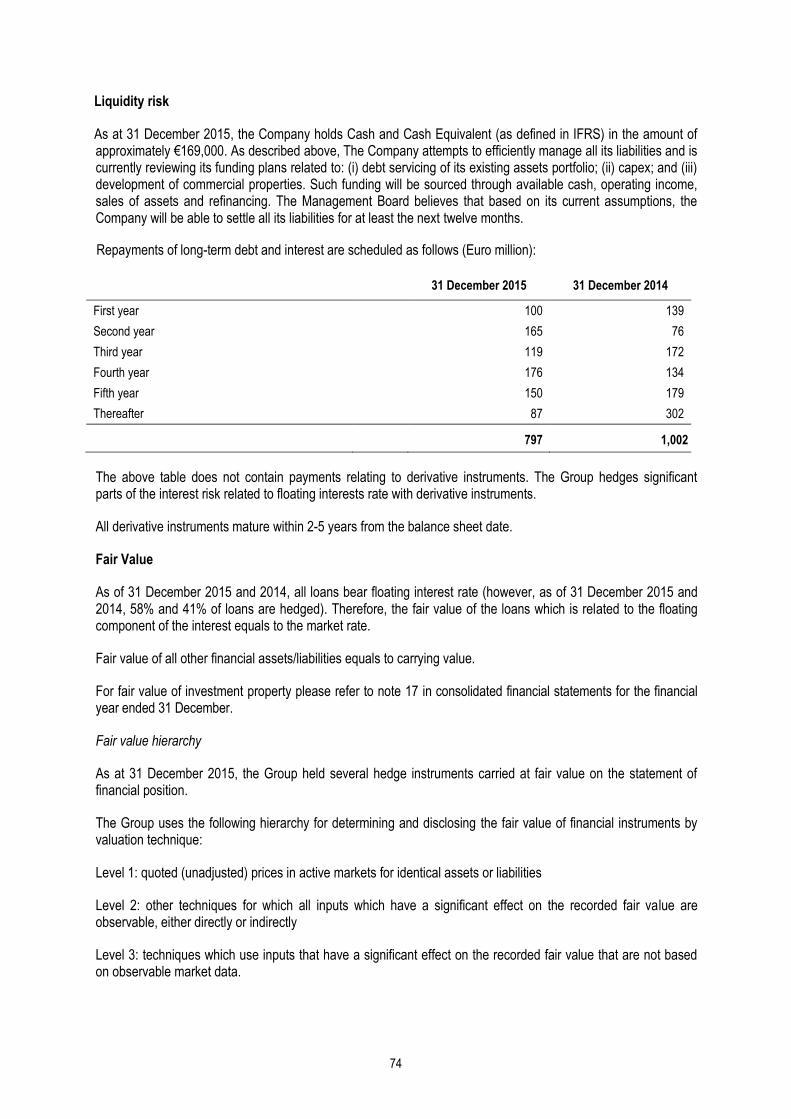
74
Liquidity risk
As at 31 December 2015, the Company holds Cash and Cash Equivalent (as defined in IFRS) in the amount of approximately €169,000. As described above, The Company attempts to efficiently manage all its liabilities and is currently reviewing its funding plans related to: (i) debt servicing of its existing assets portfolio; (ii) capex; and (iii) development of commercial properties. Such funding will be sourced through available cash, operating income, sales of assets and refinancing. The Management Board believes that based on its current assumptions, the Company will be able to settle all its liabilities for at least the next twelve months.
Repayments of long-term debt and interest are scheduled as follows (Euro million):
31 December 2015 31 December 2014
First year 100 139
Second year 165 76
Third year 119 172
Fourth year 176 134
Fifth year 150 179
Thereafter 87 302
797 1,002
The above table does not contain payments relating to derivative instruments. The Group hedges significant parts of the interest risk related to floating interests rate with derivative instruments.
All derivative instruments mature within 2-5 years from the balance sheet date.
Fair Value
As of 31 December 2015 and 2014, all loans bear floating interest rate (however, as of 31 December 2015 and 2014, 58% and 41% of loans are hedged). Therefore, the fair value of the loans which is related to the floating component of the interest equals to the market rate.
Fair value of all other financial assets/liabilities equals to carrying value.
For fair value of investment property please refer to note 17 in consolidated financial statements for the financial year ended 31 December.
Fair value hierarchy
As at 31 December 2015, the Group held several hedge instruments carried at fair value on the statement of financial position.
The Group uses the following hierarchy for determining and disclosing the fair value of financial instruments by valuation technique:
Level 1: quoted (unadjusted) prices in active markets for identical assets or liabilities
Level 2: other techniques for which all inputs which have a significant effect on the recorded fair value are observable, either directly or indirectly
Level 3: techniques which use inputs that have a significant effect on the recorded fair value that are not based on observable market data.

75
Valuations of hedges are considered as level 2 fair value measurements. During the year ended 31 December 2015 and 31 December 2014, there were no transfers between Level 1 and Level 3 fair value measurements.
Price risk The Group is exposed to fluctuations of in the real estate markets in which it operates. These can have an effect on the Company’s results.
Capital management
The primary objective of the Group’s capital management is to ensure capital preservation and maintaining healthy capital ratios in order to support its business and maximise shareholder value.
The Group manages its capital structure and makes adjustments to it, in light of changes in economic conditions. To maintain or adjust the capital structure, the Group decides on leverage policy, repayment of loans, investment or divestment of assets, dividend policy and the need, if any, to issue new shares.
No changes were made in the objectives, policies or processes during the years ended 31 December 2015 and 31 December 2014.
The Company monitors its gearing ratio, which is Gross Debt less Cash & Deposits (as defined in IFRS) divided by its investment in real estate. The Company’s policy is to maintain the gearing ratio at the level of around 50%.
31 December 2015 31 December 2014
(1) Loans and derivatives, net of cash and deposits (*) 521,559 697,970
(2) Investment properties, inventory and assets held for sale 1,324,413 1,292,956
Gearing ratio [(1)/(2)] 39.4% 54.0%
(*) Excluding loans from joint ventures and minorities and deferred issuance debt expenses.
Item 12. Remuneration policy and human resources management
Item 12.1 Remuneration policy
Employees of the Group may receive the following remuneration components: base remuneration, bonuses for specific achievements and share based payment in a form of participation in phantom share plan.
Item 12.2 Number of employees as at 31 December 2015,
As of 31 December 2015 and 2014 the number of full time equivalent working in the Group companies was 143
and 144 respectively.
Item 12.3 Incentive system
The Company has a remuneration and incentive system that consists of a bonus for meeting specific goals or objectives set by the Management Board or Supervisory Board (as the case may be) or achieving special achievements. The Company’s key managers are also incentivized by participation in phantom share plan, according to which a certain number of phantom shares is vested to the employee once a year.

76
Item 12.4 Training policy
The Company offers its employees various forms to raise professional qualifications. The key strategic training and workshops are conducted by external companies. Such training opportunities focus mainly on market and product knowledge, marketing, processes and IT applications competencies, asset management, legal, tax and accounting. The Company believes that such training is increasing the employee’s commitment to the performance of business tasks, improving his/her skills and maintaining high customer service quality.
Item 12.5 Benefits for Supervisory and Management Board members
Principles of remunerating the Management Board members
According to principles of remuneration of the Company’s Management Board members which drew by the Supervisory Board, members of the Company’s Management Board are entitled to: basic remuneration at an amount determined by the Company’s Supervisory Board for each member of the Board, variable remuneration components as a result of meeting specific goals and achievements, severance payout related to the termination of the employment, and participation in phantom share plan according to which, every year a certain amount of phantom shares are vested to the member of the Board.
Management contracts with members of the Management Board setting out severance payouts as a result of their dismissal from their position without a material cause. Such payout is subject to 6-month prior notice and compensation according to the Polish law.
The contracts of the Company’s Management Board members include provisions regarding severance package payouts as a result of their resignation or dismissal from their position without material cause.
\ Principles of remunerating the Supervisory Board members
Members of the Supervisory Board are entitled to a fixed monthly amount set by the shareholders meeting.
Item 12.6 Agreements concluded between GTC and Management Board members
The Company has concluded agreement with its two Members of the Board, providing for their basic compensation, performance related bonus, participation if phantom share plan, severance payment in the case of their dismissal. Furthermore, the agreements contain a non-competition clause and confidentiality clause.
Item 12.7 Evaluation of the remuneration policy for the realization of its objectives
The remuneration policy is consistent with the shareholders target to have a long-term increase in shareholder value. Furthermore it aims to provide stability in managing the Company and carrying out its policies by attracting and retaining highly skilled employees across the organization and operation countries of the Company. Such goals guarantee motivation for quality work and the good attitude of employees, stable financial results in the long run, sound and effective risk management, supporting the implementation of the business strategy and the reduction of conflict of interest.

77
Item 12.8 Remuneration of the Members of the Management Board and Supervisory Board
Management Board
The following table presents the remuneration of the members of the Management Board as of 31
December 2015 for the 12 months ended 31 December 2015:
Name Period
Fixed
Remuneration¹ (€)
(not in thousand)
Variable
Remuneration¹ (€)
(not in thousand)
Vested Phantom Shares
(not in thousand)
Thomas Kurzmann 1 January -
31 December 2015 328,669 56,700 512,000
Erez Boniel 1 January -
31 December 2015 323,430 15,900 0
Yovav Carmi 1 January -
28 August 2015 0 191,442 0
Mariusz Kozłowski 1 January -
23 April 2015 79,098 78,000 0
Piotr Kroenke 1 January -
23 April 2015 83,260 0 0
Jacek Wachowicz 1 January -
28 August 2015 162,249 0 0
Witold Zatoński 1 January -
21 July 2015 149,510 63,000 0
¹ Remuneration (or fees to entities in which the holder is a key personnel) consists of payment for 2015 and success fee amounts paid
for present and past year in addition to Group’s Phantom Shares program vested during 2015, as detailed in Item 13.9. Stock option
plan. During the year none of the Phantom Shares were exercised.
On 23 April 2015, i.e. on the date of the annual shareholders meeting of the Company approving the financial
statements for the last full financial year of their service as members of the management board of the Company,
the mandates of management board members Piotr Kroenke and Mariusz Kozłowski expired pursuant to Article
369 § 4 of the Commercial Companies Code.
On 21 July 2015, Witold Zatoński resigned from his function of a Member of the Management Board of GTC SA.
On 28 August 2015, Jacek Wachowicz and Yovav Carmi have assumed new functions within the GTC organization. At the same time both, Mr Wachowicz and Mr Carmi resigned from their functions of Member of the Management Board of GTC SA and will remain senior executives at GTC.

78
Supervisory Board
The following table presents the remuneration of the members of the Supervisory Board as of 31 December
2015 for the 12 months ended 31 December 2015:
Name
Periods
Remuneration1 (€)
(not in thousand)
Vested Phantom Shares (not in thousand)
Alexander Hesse 1 January - 31 December 2015 0 0
Philippe Couturier 1 January - 31 December 2015 0 0
Michael Damnitz 1 January – 13 July 2015 0 0
Jan Düdden 1 January - 31 December 2015 0 0
Krzysztof Gerula 1 January – 10 June 2015 10,176 0
Mariusz Grendowicz 1 January - 31 December 2015 22,896 0
Klaus Helmrich 13 July - 31 December 2015 0 0
Jarosław Karasiński 1 January - 31 December 2015 22,896 0
Tomasz Mazurczak 1 January – 10 June 2015 10,176 0
Marcin Murawski 1 January - 31 December 2015 22,896 0
Katharina Schade 1 January - 31 December 2015 0 0
Dariusz Stolarczyk 1 January – 10 June 2015 10,176 0 1 Remuneration (or fees to entities in which the holder is a key personnel) consists of payment for 2015 and success fee amounts paid
for present and past year in addition to Group’s Phantom Shares program vested during 2015, as detailed in Item 12.9. Stock option
plan. During the year none of the Phantom Shares were exercised.
In June 2015 AVIVA OFE AVIVA BZ WBK decreased to 7.15% of the total number of votes in the Company.
Following the decrease, according to Art. 7 paragraph. 7.1.5 Articles of Association, the mandate of Mr. Tomasz
Mazurczak acting as a supervisory board member in GTC automatically expired on 10 June 2015.
In June 2015 ING OFE decreased to 0% of the total number of votes in the Company. Following the decrease,
according to Art. 7 paragraph. 7.1.5 Articles of Association, the mandates of Mr. Dariusz Stolarczyk and Krzysztof
Gerula acting as a supervisory board members in GTC automatically expired on 10 June 2015.
On 13 June 2015, LSREF III GTC Investments B.V. dismissed Michael Damnitz from the function of a member of
the supervisory board of the Company and appointed Klaus Helmrich as a member of the supervisory board of
the Company.
Item 12.9 Stock option plan
Certain key management personnel of the Company are entitled to specific payments resulting from phantom
shares in the Company (the “Phantom Shares”).
The Phantom Shares grant to the entitled persons a right for a settlement from the Company in the amount equal
to the difference between the average closing price for the Company’s shares on the Warsaw Stock Exchange
during the 30-day period prior to the date of delivery to the Company of the exercise notice, and settlement price
(“strike”) amount per share (adjustable for dividend). The Phantom Shares are not securities convertible or
exchangeable into shares in the Company, in particular, they are not options on such shares. The Phantom
Shares are merely a mean of calculation of variable compensation of the entitled persons, which depends on the
future market price of the shares on the regulated market.

79
The Phantom Shares (as presented in below mentioned table) have been accounted for based on future cash
settlement.
Strike (PLN) Blocked Vested Total
8.22 - 724,100 724,100
7.09 5,171,200 512,000 5,683,200
Total 5,171,200 1,236,100 6,407,300
As at 31 December 2015, Phantom Shares granted were as follows:
Last exercise date Strike (in PLN) Amount of Phantom
Shares
30/06/2016 8.22 724,100
31/05/2018 7.09 1,536,000
30/06/2019 7.09 4,147,200
Total 6,407,300
Item 12.9.1. Stock option control system
Granting phantom shares to members of the Management Board and setting their condition is reviewed and
approved by the Remuneration Committee and the Supervisory Board. Remuneration to other key personnel is set
by the Management Board.
Item 13. Shares in GTC held by members of the Management Board and the Supervisory Board
Shares held by members of the Management Board
The following table presents shares owned directly or indirectly by members of the Company’s Management
Board of 17 March 2016, the date of publication of this annual report, and changes in their holdings since the date
of publication of Group’s last financial report (interim report for the three and nine-month period ended 30
September 2015) on 13 November 2015.
The information included in the table is based on information received from members of the Management Board
pursuant to Art. 160 sec. 1 of the Act on Trading in Financial Instruments.
Management Board Member
Balance as of 17 March 2016
(not in thousand)
Nominal value of shares in PLN
(not in thousand)
Change since 13 November 2015
(not in thousand)
Thomas Kurzmann 0 0 No change
Erez Boniel 143,500 14,350 No change
Total 143,500 14,350

80
Phantom Shares held by members of the Management Board
The following table presents Phantom Shares owned directly or indirectly by members of the Company’s
Management Board as of 31 December 2015 since 30 September 2015. The Phantom Shares granted to the
members of the Management Board are subject to Supervisory Board decision on the equity settlement.
Management Board Member
Balance as of 31 December 2014
(not in thousand)
Change since 30 September 2014 (not in thousand)
Thomas Kurzmann 512,000 No change
Erez Boniel 0 No change
Shares of GTC held by members of the Supervisory Board
The following table presents shares owned directly or indirectly by members of the Company’s Supervisory Board
of 17 March 2015, the date of publication of this annual report, and changes in their holdings since the date of
publication of Group’s last financial report (interim report for the three and nine-month period ended 30
September 2015) on 13 November 2015.
The information included in the table is based on information received from members of the Supervisory Board
pursuant to Art. 160 sec. 1 of the Act on Trading in Financial Instruments.
Members of Supervisory Board
Balance as of 17
March 2016 (not in thousand)
Nominal value of shares in PLN
(not in thousand)
Change since 13 November 2015
Alexander Hesse 0 0 No change
Philippe Couturier 0 0 No change
Michael Damnitz 0 0 No change
Jan Düdden 0 0 No change
Mariusz Grendowicz 10,158 1,016 No change
Jarosław Karasiński 0 0 No change
Marcin Murawski 0 0 No change
Katharina Schade 0 0 No change
Total 10,158 1,016
Item 14. Material transactions with related parties concluded on terms other than market terms
The Group presents information on the material transactions that the Company, or its subsidiaries, concluded with
a related party in the consolidated financial statements for the financial year ended 31 December 2015 in Note 33
Related Party Transactions.
Item 15. Information on signed and terminated loan agreements within a given year
As of 31 December 2014, the loan agreements with Unicredit related to the Felicity residential project with an outstanding loan amount of €25,600 exceeded the fair value of related asset. In March 2015, the Company

81
transferred the Felicity project to a subsidiary of Unicredit. Unicredit released the Company from any payment obligations arising from the loan agreements.
In June 2015, the Group fully repaid the loan from OTP and MKB (Galleria Varna) in the amount of €17,700. At the same time, MKB and OTP granted GTC S.A a new loan in the amount of €12,600.
On 26 June 2015, the Company and EBRD entered into an agreement for the restructuring of a loan to Mars Commercial Center SRL (Galleria Piatra Mall), and Mercury Commercial Center SRL (Galleria Arad), in Romania. Furthermore, in June 2015, the Company and EBRD agreed on the restructuring of a loan granted to Galleria Stara Zagora AD, the owner of Galleria Stara Zagora, Bulgaria. On 3 July 2015, the Company and EBRD entered into an agreement for the restructuring of a loan extended by the EBRD to Galleria Stara Zagora AD
In June 2015, the Group fully repaid the loan from EBRD and Raiffeisen Bank Austria (Avenue Mall Osijek) in the amount of €15,800.
In August 2015, the Group signed a credit facility agreement with Bank Polska Kasa Opieki S.A., concerning financing and refinancing of total project costs of the construction of Galeria Północna. These facilities comprise a construction loan facility in the amount of up to €116,000 and investment loan facility in the amount of up to €150,000. (Under financial thresholds the investment facility may be increased up to €175,000.)
Item 16. Information on contracts of which the Company is aware (including those concluded after the balance sheet date) which could result in a change in the shareholding structure in the future
There are no contracts of which the Company is aware (including those concluded after the balance sheet date) which could result in a change in the shareholding structure in the future.
Item 17. Proceedings before a court or public authority involving Globe Trade Centre SA or its subsidiaries the total value of the liabilities or claims of which amount to at least 10% of the Group's equity
There are no individual proceeding or group of proceedings before a court or public authority involving Globe Trade
Centre SA or its subsidiaries, with the total value of liabilities or claims of 10% or more of the Company's equity
Item 18. Material contracts signed during the year, including insurance contracts and co-operation contracts
There are no material contracts signed during the year 2015, including insurance contracts and co-operation contracts.
Item 19. Agreements with an entity certified to execute an audit of the financial statements
In March 2015, the Company entered into an agreement with Ernst & Young Audyt Polska Sp. z o.o. sp. k, with
registered office on 1 Rondo ONZ, 00-124 Warsaw, for performance of the audit of the standalone financial
statements of Globe Trade Centre S.A. and the consolidated financial statements of Globe Trade Centre Group for
the financial year ended 31 December 2015. Additionally to that agreement, the Group entered into various
agreements with EY in the countries of the relevant Group’s subsidiaries.

82
The following summary presents a list of services provided by EY and remuneration for the services in the periods
of 12 months ended on 31 December 2015 and 31 December 2014.
For year ended
31 December
2015
31 December
2014
€ €
Fee for audit and review of financial statements 583 759
Tax and other advisory services 108 246
Total 691 1,005

Globe Trade Centre S.A.
Report on application of the principles of corporate governance
for the financial year ended 31 December 2015

2
Table of contents
Part 1. The principles of corporate governance which the issuer is subject to and the location
where the set of principles is publicly available ....................................................................................... 3
Part 2. The principles of corporate governance that the issuer has waived, including the reasons
for such waiver......................................................................................................................................... 3
Part 3. The principal characteristics of the internal control and risk management systems used with
respect to the procedure of preparing financial statements and consolidated financial statements ....... 5
Part 4. Shareholders who, directly or indirectly, have substantial shareholding, including the
number of shares held by them, the percentage share in the share capital, and the number of votes
attached to their shares in the overall number of votes at the general meeting ..................................... 6
Part 5. Holders of any securities that grant special rights of control, including a description of such
rights …………………………………………………………………………………………………………6
Part 6. Restrictions concerning the exercise of voting rights, such as restriction of the exercise of
voting rights by holders of any specific part or number of votes, time restrictions concerning the
exercise of voting rights or regulations whereunder, with the co-operation of the company, the equity
rights related to the securities are separate from holding securities ....................................................... 7
Part 7. Restrictions concerning transfer of the ownership title to securities in Globe Trade
Centre S.A. .............................................................................................................................................. 7
Part 8. Rules concerning the appointment and dismissal of management and the rights thereof,
specifically the right to make decisions concerning the issuance and redemption of shares. ................ 7
Part 9. Overview of the procedure of amending the Company’s articles of association ................... 7
Part 10. The bylaws of the general meeting and its principal rights and description of rights of
shareholders and their exercise, in particular the rules resulting from the bylaws of the general
meeting, unless information on that scope results directly from the provisions of law ............................ 8
Part 11. Personnel composition and changes in the previous business year and description of the
functioning of the management, supervisory, or administrative bodies of the Company and its
committees. ............................................................................................................................................. 9
3
Part 1. The principles of corporate governance which the issuer is subject to and the location where the set of principles is publicly available
In July 2007, the Council of the Warsaw Stock Exchange adopted a set of principles for the corporate
governance for joint-stock companies issuing shares, convertible bonds, or senior bonds that are
admitted to trading on the stock exchange. The principles of corporate governance, in the form of the
Best Practices of WSE Listed Companies (the “WSE Best Practices”), constitute an appendix to
Resolution No. 12/1170/2007 of the Council of GPW of 4 July 2007 and entered into force on 1 January
2008. On 19 May 2010, the Warsaw Stock Exchange introduced the first amendment to the Code of
Best Practice for Warsaw Stock Exchange Listed Companies since 4 July 2007. The WSE Best
Practices were thus brought in line with recent legislative amendments, current international corporate
governance trends, and the expectations of market participants. The amendment constituted an
appendix to Resolution No. 207/1287/2011 of the Warsaw Stock Exchange supervisory board dated 19
October 2011 concerning the adoption of amendments to the Code of Best Practice for Warsaw Stock
Exchange Listed Companies. Such amendment to the WSE Best Practices took effect on 1 July 2010.
Additionally, on 31 August 2011 and 19 October 2011, the Warsaw Stock Exchange supervisory board
adopted two resolutions, No. 15/1282/2011 and No. 20/1287/2011, concerning amendments to the
WSE Best Practices. Such amendment to the WSE Best Practices took effect on 1 January 2012.
Furthermore, on 21 November 2012 the Warsaw Stock Exchange supervisory board adopted resolution
No. 19/1307/2012, concerning amendments to the WSE Best Practices. Such amendment to the WSE
Best Practices took effect on 1 January 2013. On 13 October 2015, the Warsaw Stock Exchange
supervisory board adopted resolution approving a new code of corporate governance “Best Practice of
GPW Listed Companies 2016” which comes to force as at 1 January 2016.
Company prepared report on application of the principles of corporate governance for the financial year
ended 31 December 2015 according to WSE Best Practices adopted by resolution of Warsaw Stock
Exchange supervisory board No. 19/1307/2012, which were in force until 31 December 2015.
The content of the WSE Best Practices is publicly available on the website of the Warsaw Stock
Exchange dedicated to those issues at www.corp-gov.gpw.pl.
Part 2. The principles of corporate governance that the issuer has waived, including the reasons for such waiver
We strive to make every possible effort to employ the corporate governance principles set out in the
WSE Best Practices, and try to follow, in all areas of the Company’s business, all the recommendations
regarding best practices of Warsaw Stock Exchange Listed Companies and all the recommendations
directed to management boards, supervisory boards and shareholders.
Additionally, so as to implement a transparent and effective information policy the Company provides
fast and safe access to information for shareholders, analysts and investors, employing both traditional
and modern, technologies of publishing information about the Company to the greatest extent possible.

4
Nevertheless, in the year ended 31 December 2015, the Company did not comply with the following
recommendations:
II. Best practice for management boards of listed companies
Rule Company’s Comment
1 A company should operate a corporate website and publish on it, in addition to information required by legal regulation: 1) basic corporate regulations, in particular the statutes and internal regulations of its governing bodies; 6) annual reports on the activity of the Supervisory Board taking into account the activities of its committees together with the evaluation of the internal control system and the significant risk management system submitted by the Supervisory Board
In the Company’s opinion, communicating with investors to the fullest extent possible, including via the Internet, is a best corporate practice. The Company seeks to ensure clarity and transparency of its operations. However, some of the points require information from shareholders or impose more demanding requirements than those specified in applicable law. Although the Company wishes to implement this rule to the widest extent possible, it cannot guarantee that the rule as it is now will be observed in full.
III. Best practice for supervisory board members
Rule Company’s Comment
1 In addition to its responsibilities laid down in legal provisions, the supervisory board should: 3) review and present opinions on issues subject to resolutions of the general meeting.
The Company’s articles of association do not impose the requirement that the supervisory board should review and present opinions on issues subject to the resolutions the general meeting. However, the supervisory board may decide to observe the rule.
2 A member of the supervisory board should submit to the company’s management board information on any relationship with a shareholder who holds shares representing not less than 5% of all votes at the general meeting. This obligation concerns financial, family, and other relationships which may affect the position of the member of the supervisory board on issues decided by the supervisory board.
Being well aware of the need to duly inform its shareholders about any important events which could affect their investments and investment decisions, the Company is of the opinion that the disclosure requirements imposed by applicable law are sufficient to ensure that the shareholders have full access to important information which might affect the value of the securities issued by the Company. The Company will consider adopting this rule in the future.
8 Annex I to the Commission Recommendation of February 15 2005 on the role of non-executive or supervisory directors of listed companies and of the committees of the (supervisory) board should apply to the tasks and the operation of the committees of the supervisory board.
The functions of the nomination is now performed by the entire supervisory board.

5
Part 3. The principal characteristics of the internal control and risk management systems used with respect to the procedure of preparing financial statements and consolidated financial statements
The management board is responsible for the Company’s internal control system and its effectiveness
in the process of preparing financial statements and interim reports prepared and published in
accordance with the provisions of the Decree of the Finance Minister of 19 February 2009 on current
and interim information provided by issuers of securities and the conditions for accepting, as
equivalent, information required by the provisions of a country not being a member state.
The Company draws on its employees’ extensive experience in the identification, documentation,
recording and controlling of economic operations, including numerous control procedures supported
by modern information technologies used for the recording, processing and presentation of operational
and financial data.
In order to ensure the accuracy and reliability of the accounts of the parent and subsidiary companies,
the Company applies a series of internal procedures in the area of transactional control systems and
processes resulting from the activities of the Company and the capital group.
An important element of the risk management, in relation to the financial reporting process, is ongoing
internal controls exercised by main accountants on the holding and subsidiaries level.
The budgetary control system is based on monthly and annual financial and operational reporting.
Financial results are monitored regularly.
One of the basic elements of control in the preparation of financial statements of the Company and the
Group is verification carried out by independent auditors. An auditor is chosen from a group of
reputable firms which guarantee a high standard of service and independence. The supervisory board
approves the choice of the auditor. The tasks of the independent auditor include, in particular: a review
of semi-annual stand-alone and consolidated financial statements and audit of annual stand-alone and
consolidated financial statements.
An auditor’s independence is fundamental to ensuring the accuracy of an audit of books. An audit
committee, appointed to the Company’s supervisory board, supervises the financial reporting process
in the Company, in co-operation with the independent auditor, who participates in the audit committee
meetings. The audit committee oversees the financial reporting process, in order to ensure
sustainability, transparency and integrity of financial information. The audit committee includes one
member of the supervisory board who meets the independence criteria set out in the Best Practices of
WSE Listed Companies. The audit committee reports to the supervisory board.
Moreover, under Article 4a of the Act of 29 September 1994 on accounting, the duties of the
supervisory board include ensuring that the financial statements and the report of the Company’s
operations meet the requirements of the law, and the supervisory board carries out this duty, using the
powers under the law and the articles of association of the Company. This is yet another level of
control exercised by an independent body to ensure the accuracy and reliability of the information
presented in the separate and consolidated financial statements.

6
Part 4. Shareholders who, directly or indirectly, have substantial shareholding, including the number of shares held by them, the percentage share in the share capital, and the number of votes attached to their shares in the overall number of votes at the general meeting
The following table presents the Company’s shareholders, who had no less than 5% of votes at the
Ordinary Shareholders Meeting of GTC S.A., as of the date of publication of this Report. The table is
prepared based on information received directly from the shareholders and takes into consideration
the changes in the shareholding structure arising from, inter alia:
notification received 15 June 2015 on decrease in the total number of votes in the Company from Aviva OFE Aviva BZ WBK (see: Current report no 20/2015),
notification received 16 June 2015 on decrease in the total number of votes in the Company from ING OFE (see: Current report no 21/2015),
notification received 5 November 2015 on increase in the total number of votes in the Company from OFE PZU “Złota Jesień” (see: Current report no 44/2015),
notification received 18 December 2015 on increase in the total number of votes in the Company received from LSREF III GTC Investments B.V and Lone Star Real Estate Partners III L.P. (see: Current report no 49/2015).
Shareholder
Number of shares and
rights to the shares held
% of share capital
Number of votes % of votes
LSREF III GTC Investments B.V.¹ 275,049,658 59,77% 275,049,658 59.77%
OFE PZU Złota Jesień 46,045,798 10.01% 46,045,798 10.01%
AVIVA OFE Aviva BZ WBK 32,922,901 7.15% 32,922,901 7.15%
Other shareholders 106,198,121 23.07% 106,198,121 23.07%
Total 460,216,478 100.00% 460,216,478 100.00%
¹LSREF III GTC Investments B.V. is related to Lone Star Real Estate Partners III L.P.
Part 5. Holders of any securities that grant special rights of control, including a description of such rights
There are no special rights of control that would be attached to any securities in Globe Trade
Centre S.A.
7
Part 6. Restrictions concerning the exercise of voting rights, such as restriction of the exercise of voting rights by holders of any specific part or number of votes, time restrictions concerning the exercise of voting rights or regulations whereunder, with the co-operation of the company, the equity rights related to the securities are separate from holding securities
There are no restrictions applicable to the exercise of voting rights such as restriction of the exercise
of voting rights by holders of any specific part or number of shares, any time restrictions applicable to
the exercise of voting rights or regulations whereunder, with the co-operation of Globe Trade
Centre S.A., the equity rights related to securities would be separate from holding securities.
Part 7. Restrictions concerning transfer of the ownership title to securities in Globe Trade Centre S.A.
There are no limitations of transfer of ownership title to securities, except for those limitations that are
resulting from the general provisions of the law, in particular contractual limitations regarding the
transfer of the ownership rights to the securities issued by the Company.
Part 8. Rules concerning the appointment and dismissal of management and the rights thereof, specifically the right to make decisions concerning the issuance and redemption of shares.
Pursuant to Art. 7 the Company’s statute the management board consist of one to seven members,
appointed by the supervisory board for a three-year term.
Additionally, the supervisory board designates the president of the management board and deputy
thereof.
The management board of the Company is responsible for the Company’s day-to-day management
and for its representation in dealing with third parties. All issues related to the Company’s operations
are in the scope of activities of the management board, unless they are specified as the competence
of the supervisory board or the general meeting by the provisions of applicable law or the articles of
association.
Members of the management board participate, in particular, in general meetings and provide answers
to questions asked during general meetings. Moreover, members of the management board invited to
a supervisory board meeting by the chairman of the supervisory board participate in such meeting,
with a right to voice their opinion on issues on the agenda.
The general meeting takes decisions regarding the issuance or buying back of shares in the
Company. The competencies of the management board in the scope are limited to execution of any
resolutions adopted by the general meeting.
Part 9. Overview of the procedure of amending the Company’s articles of association
A change to the Company’s articles of association require a resolution of the general meeting and an
entry into the Court register. The general provisions of law and the articles of association govern the
procedure of adopting resolutions regarding changes to the articles of association.

8
Part 10. The bylaws of the general meeting and its principal rights and description of rights of shareholders and their exercise, in particular the rules resulting from the bylaws of the general meeting, unless information on that scope results directly from the provisions of law
The general meeting acts pursuant to the provisions of the Polish Commercial Companies Code and
the articles of association.
The general meeting adopts resolutions regarding, in particular, the following issues:
a) discussion and approval of reports of the management board and the financial
statements for the previous year,
b) decision about allocation of profits or covering of debts,
c) signing off for the performance of duties for the supervisory board and the
management board,
d) determination of the supervisory board remuneration,
e) changes to the articles of association of the Company,
g) increase or decrease in the share capital,
h) merger or transformation of the Company,
i) dissolution or liquidation of the Company,
j) issuance of bonds,
k) sale or lease of the Company and the establishment of a right of use or sale of the
Company’s enterprise,
l) all decisions regarding claims for damages upon establishment of the Company, or the
performance of management or supervision.
A general meeting can be attended by persons who are shareholders of the Company sixteen days
before the date of the general meeting (the day of registration for participation in the general meeting).
A shareholder who is natural person is entitled to participate in general meetings and execute voting
rights in person or through a proxy. A shareholder which is a legal entity is entitled to participate in
general meetings and execute voting rights through a person authorized to forward statements of will
on their behalf or through a proxy.
A power of attorney to attend a general meeting and exercise voting rights must be in written or
electronic form. For the purposes of identification of the shareholder who granted the power of
attorney, a notice on the granting of such power of attorney electronically should contain (as a
schedule):
- if the shareholder is an individual, a copy of an identity card, passport or any other official
identification document confirming the identity of the shareholder; or

9
- if the shareholder is not an individual, a copy of an extract from a relevant register or any
other document confirming the authorisation of the individual(s) to represent the shareholder
at the general meeting (e.g. an uninterrupted chain of powers of attorney).
The general meeting may be attended by members of the management board and supervisory board
(in a composition which allows for substantive answers to the questions asked during the general
meeting) and by the auditor of the Company, if the general meeting is held to discuss financial
matters.
At the general meeting each participant is entitled to be elected the chairman of the general meeting,
and also nominate one person as a candidate for the position of chairman of the general meeting.
Until election of the chairman the general meeting may not take any decisions.
The chairman of the general meeting directs proceedings in accordance with the agreed agenda,
provisions of law, the articles of association, and, in particular: gives the floor to speakers, orders
votes and announces the results thereof. The chairman ensures efficient proceedings and respecting
of the rights and interests of all shareholders.
After the creation and signing of the attendance list, the chairman confirms that the general meeting
has been called in the correct manner and is authorized to pass resolutions.
The chairman of the general meeting closes the general meeting upon the exhausting of its agenda.
Part 11. Personnel composition and changes in the previous business year and description of the functioning of the management, supervisory, or administrative bodies of the Company and its committees.
The management board
Currently, the management board is composed of two members. During 2015 the following changes in
the composition of the management board took place:
on 23 April 2015, mandates of Piotr Kroenke and Mariusz Kozłowski expired pursuant to
Article 369 § 4 of the Commercial Companies Code (see: Current report no 14/2015);
on 21 July 2015, Witold Zatoński resigned from his function as a member of the management
board of GTC SA (see: Current report no 29/2015);
on 28 August 2015, Jacek Wachowicz and Yovav Carmi resigned from their functions as
members of the management board of GTC SA (see: Current report no 31/2015).
Composition of the management board
The following table presents the names, surnames, functions, dates of appointment and dates of
expiry of the current term of the members of the management board as at 31 December 2015:

10
Name and surname Function Year of first appointment
Year of appointment for the current term
Year of expiry of
term
Thomas Kurzmann President of the management board 2014 2014 2017
Erez Boniel Member of the management board 1997 2015 2018
Description of operations of the management board
The management board runs the Company’s business in a transparent and efficient way pursuant to
the provisions of applicable law, its internal provisions and the “Best Practices of WSE Listed
Companies”. When taking decisions related to the Company’s business, the members of the
management board act within limits of justified business risk.
The two members of management board acting jointly are entitled to make representations on the
Company’s behalf.
All issues related to the management of the Company which are not specified by the provisions of
applicable law or the articles of association as competences of the supervisory board or the general
meeting are within the scope of competence of the management board.
Members of the management board participate in sessions of the general meeting and provide
substantive answers to questions asked during the general meeting. Members of the management
board invited to a meeting of the supervisory board by the chairman of the supervisory board
participate in such meeting with the right to take the floor regarding issues on the agenda. Members of
the management board are required to, within their scope of competence and the scope necessary to
settle issues discussed by the supervisory board, submit explanations and information regarding the
Company’s business to the participants of a meeting of the supervisory board.
The management board makes any decisions considered (by the management board) to be important
for the company by passing resolutions at meetings thereof. Such resolutions are passed by simple
majority.
Moreover, the management board may adopt resolutions in writing or via a manner enabling
instantaneous communication between the members of the management board by means of audio-
video communication (e.g. teleconferencing, videoconferencing, etc).
The supervisory board
Currently, the supervisory board comprises eight members. During 2015 the following change in the
composition of the supervisory board took place:
on 10 June 2015, mandates of Tomasz Mazurczak, Dariusz Stolarczyk and Krzysztof Gerula
automatically expired after the sale of GTC shares by AVIVA OFE AVIVA BZ WBK and ING
OFE (see: Current reports no 20/2015 and 21/2015);
on 13 June 2015, LSREF III GTC Investments B.V. dismissed Michael Damnitz and appointed
Klaus Helmrich to the supervisory board of GTC S.A (see: Current report no 28/2015).

11
The composition of the supervisory board
The following table presents the names, surnames, functions, dates of appointment and dates of
expiry of the current term of the members of the supervisory board as at 31 December 2015:
Name and surname Function Year of first appointment
Year of appointment
for the current term
Year of expiry of
term
Alexander Hesse Chairman of the supervisory board
2013 2013 2016
Philippe Couturier Member of the supervisory board 2013 2013 2016
Jan Düdden Member of the supervisory board 2014 2014 2017
Klaus Helmrich Member of the supervisory board 2015 2015 2018
Mariusz Grendowicz1 Independent member of the supervisory board
2000 2013 2016
Jarosław Karasiński Member of the supervisory board 2013 2013 2016
Marcin Murawski1 Independent member of the supervisory board
2013 2013 2016
Katharina Schade Member of the supervisory board 2013 2013 2016
1 conforms with the independence criteria listed in the Best Practices of WSE Listed Companies
Description of the operations of the supervisory board
The supervisory board acts pursuant to the Polish Commercial Companies Code and also pursuant to
the articles of association of the Company and the supervisory board regulations dated 14 April 2005.
Pursuant to the articles of association of the Company, the supervisory board performs constant
supervision over activities of the enterprise. Within the scope of its supervisory activities, the
supervisory board may demand any information and documents regarding the Company’s business
from the management board.
Members of the supervisory board are required to take necessary steps to receive regular and full
information from the management board regarding material matters concerning the Company’s
business and risks involved in the business and the strategies of risk management. The supervisory
board may (while not infringing the competencies of other bodies of the Company) express their
opinion on all the issues related to the Company’s business, including forwarding motions and
proposals to the management board.
In addition to the matters defined in the Polish Commercial Companies Code the following are the
competencies of the supervisory board:
a) Giving consent for the Company or one of its Subsidiaries to execute an agreement or
agreements with an Affiliate or with a member of the Company’s management board or
supervisory board or with a member of the management or supervisory authorities of an
Affiliate. Such consent is not be required for transactions with companies in which the
Company holds, directly or indirectly, shares entitling it to at least 50% of votes at
shareholders’ meetings, if such transaction results in obligations of the other shareholders of
such companies proportional to their stake in that company, or if the difference between the

12
financial obligations of the Company and the other shareholders does not exceed EUR 5
million. In the articles of association indirect ownership of shares entitling the holder thereof to
at least 50% of the votes at a shareholders’ meeting means possession of such number of
shares that entitles the holder thereof to at least 50% of votes in each of the indirectly held
companies in the chain of subsidiaries.
b) Giving approval to any change of the auditor selected by the Company’s management board
to audit the Company’s financial statements.
c) Expressing consent for the Company or one of its Subsidiaries to: (i) execute transaction
comprising the acquisition or sale of investment assets of any kind the value of which exceeds
EUR 30million; (ii) issue a guarantee for an amount exceeding EUR 20 million; or (iii) execute
any transaction (in the form of a single legal act or a number of legal acts) other than those set
forth in preceding points (i) or (ii) where the value of such transaction exceeds EUR 20 million.
For the avoidance of doubt, consent is required for the Company’s management board to vote
on the Company’s behalf at a meeting of the shareholders of a Company’s Subsidiary
authorizing transactions meeting above criteria.
Pursuant to Art. 7.4 of the articles of association:
a) an entity is an “Affiliate”, if it is (i) a Dominating Entity with respect to the Company, or (ii) a
Subsidiary of the Company; or (iii) a Subsidiary of a Dominating Entity of the Company; or (iv)
a Subsidiary of the Company’s Dominating Entity other than the Company’ Subsidiary; or (v) a
Subsidiary of any member of managing or supervisory authorities of the Company or any of
the entities designated in (i) through (iii);
b) an entity is a “Subsidiary” of any other entity (the “Dominating Entity”) if the Dominating Entity:
(i) has the right to exercise the majority of votes in the authorities of the Subsidiary, including
on the basis of understandings with other authorised entities, or (ii) is authorised to take
decisions regarding financial policies and current commercial operations of the Subsidiary on
the basis of any law, statute or agreement, or (iii) is authorised to appoint or dismiss the
majority of members of managing authorities of the Subsidiary, or (iv) more than half of the
members of the Subsidiary’s management board are also members of the management board
or persons performing any management functions at the Dominating Entity or any other
Subsidiary.
The supervisory board consists of five to twenty members, including the Chairman of the supervisory
board. Each shareholder who holds individually more than 5% of shares in the Company’s share
capital (the “Initial Threshold”) is entitled to appoint one supervisory board member. Shareholders are
further entitled to appoint one additional supervisory board member for each block of held shares
constituting 5% of the Company’s share capital above the Initial Threshold. Supervisory board
members are appointed by a written notice of entitled shareholders given to the chairman of the
general meeting at the general meeting or outside the general meeting delivered to the management
board along with a written statement from the selected person that he/she agrees to be appointed to
the supervisory board.

13
The number of supervisory board members is equal to the number of members appointed by the
entitled shareholders, increased by one independent member, provided that in each case such
number may not be lower than five.
Under the Company’s articles of association, the supervisory board should consist of at least one
member meeting the criteria of an independent member of the supervisory board as set out in the
corporate governance regulations included in the Best Practices of Warsaw Stock Exchange listed
Companies.
The chairman of the supervisory board calls meetings of the supervisory board. The chairman calls
meetings of the supervisory board upon the request of a member of the management board or a
member of the supervisory board therefore. A meeting of the supervisory board must take place within
14 days of the date of filing a written application therefore with the Chairman.
The supervisory board may convene meetings both within the territory of the Republic of Poland and
abroad. Supervisory board meetings may be held via telephone, provided that all the participants
thereof are able to communicate simultaneously. All resolutions adopted at such meetings are valid,
provided that the attendance register is signed by the supervisory board members who participated in
such meeting. The place where the Chairman attends such meeting is considered as the place where
the meeting was held.
Unless the articles of association provide otherwise, resolutions of the supervisory board are adopted
by absolute majority of votes cast in the presence of at least five supervisory board members. In the
event of a tie, the Chairman has a casting vote.
Members of the supervisory board execute their rights and perform their duties in person. Members of
the supervisory board may participate in general meetings.
Moreover, within the performance of their duties, the supervisory board is required to:
a) once a year prepare and present to the general meeting a concise evaluation of the situation
of the Company, taking into account the evaluation of the internal control system and the
management system of risks that are important for the Company,
b) once a year prepare and present to the annual general meeting an evaluation of its own
performance,
c) discuss and issue opinions on matters which are to be subject of the resolutions of the general
meeting.
Committees of the supervisory board
The supervisory board may appoint committees to investigate certain issues which are in the
competence of the supervisory board or to act as advisory and opinion bodies to the supervisory
board.
The supervisory board has appointed the Audit Committee, whose principal task is to make
administrative reviews, to exercise financial control, and to oversee financial reporting as well as

14
internal and external audit procedures at the Company and at the companies in its group. As of
31 December 2015, the members of the Audit Committee were Marcin Murawski, Mariusz Grendowicz
and Katharina Schade.
The supervisory board has appointed the Remuneration Committee of the Supervisory Board, which
has no decision-making authority and which is responsible for making recommendations to the
supervisory board with respect to the remuneration of the members of the management board and the
policies for setting such remuneration. As of 31 December 2015, the members of the Remuneration
Committee were Alexander Hesse, Marcin Murawski and Mariusz Grendowicz.

Management Board's representations
Pursuant to the requirements of the Regulation of the Council of Ministers of 19 February 2009 on ongoing and periodical information reported by issuers of securities and conditions of recognizing as equivalent information required by the law of a country not being a member state the Management Board of Globe Trade Centre S.A. represented by:
Thomas Kurzmann, President of the Management Board
Erez Boniel, Member of the Management Board
hereby represents that:
- to the best of its knowledge the consolidated financial statements for twelve months ended 31 December 2015 and the comparable data were prepared in accordance with the prevailing accounting principles, and they truly, reliably, and clearly reflect the asset and financial standing of the Group and its financial result, and the annual Management Board’s activity report contains a true image of the Group’s development and achievements and its standing, including the description of basic risks and threats;
- the entity authorized to audit the financial statements, which has audited the consolidated financial statements, was selected in accordance with the regulations of law. That entity as well as the auditor who has carried out the audit fulfilled the conditions for expressing an unbiased and independent opinion about the audit pursuant to relevant provisions of the national law and industry norms.
Warsaw, 16 March 2016

GLOBE TRADE CENTRE S.A.
IFRS CONSOLIDATED FINANCIAL STATEMENTSFOR THE YEAR ENDED31 DECEMBER 2015WITH THE INDEPENDENT AUDITOR’S REPORT

Globe Trade Centre S.A.Consolidated Statement of Financial Position
as of 31 December 2015(in thousands of Euro)
The accompanying notes are an integral part of this Consolidated Statement of Financial Position2
Note 31 December 2015 31 December 2014
ASSETS
Non-current assetsInvestment property 17 1,288,529 1,221,319Residential landbank 18 26,773 41,444Investment in associates and joint ventures 19 23,067 96,046Property, plant and equipment 16 1,070 1,480Deferred tax asset 15 647 2,245Other non-current assets 386 639
1,340,472 1,363,173
Assets held for sale 17 5,950 6,654
Current assetsResidential inventory 18 3,161 23,539Accounts receivables 5,505 5,035Accrued income 1,655 1,358VAT and other tax receivable 4,985 1,840Income tax receivable 316 429Prepayments and deferred expenses 1,323 2,268Short-term deposits 22 26,711 31,705Cash and cash equivalents 23 169,472 81,063
213,128 147,237
TOTAL ASSETS 1,559,550 1,517,064

Globe Trade Centre S.A.Consolidated Statement of Financial Position
as of 31 December 2015(in thousands of Euro)
The accompanying notes are an integral part of this Consolidated Statement of Financial Position3
Note 31 December 2015 31 December 2014
EQUITY AND LIABILITIES
Equity attributable to equity holders of the CompanyShare capital 29 10,410 7,849Share premium 8 499,288 364,228Capital reserve 8 (20,646) 8,392Hedge reserve (4,563) (3,839)Foreign currency translation 1,405 1,128Accumulated profit 156,647 111,455
642,541 489,213
Non-controlling interest 27 (21,339) (62,032)Total Equity 621,202 427,181
Non-current liabilitiesLong-term portion of long-term loans and bonds 28 658,744 802,631Deposits from tenants 25 6,242 5,415Long term payable 26 4,621 3,391Provision for share based payment 29 1,152 289Derivatives 20 2,755 2,892Provision for deferred tax liability 15 133,455 130,062
806,969 944,680Current liabilities Trade and other payables and provisions 21 28,774 19,650 Payables related to purchase of non-controlling interest 21 18,108 - Current portion of long-term loans and bonds 28 80,368 119,560 VAT and other taxes payable 1,572 1,736 Income tax payable 363 521 Derivatives 20 2,194 3,152 Advances received from residential - 584
131,379 145,203
TOTAL EQUITY AND LIABILITIES 1,559,550 1,517,064

Globe Trade Centre S.A.Consolidated Income Statement
for the year ended 31 December 2015(in thousands of Euro)
The accompanying notes are an integral part of this Consolidated Income Statement4
Note 2015 2014
Revenue 9 117,363 124,284Cost of operations 10 (37,333) (43,155)
Gross margin from operations 80,030 81,129
Selling expenses 11 (2,721) (2,884)Administration expenses 12 (11,045) (8,781)Profit/(Loss) from revaluation/ impairment of assets 17 27,611 (160,325)Impairment of residential projects 18 (1,389) (34,079)Other income 1,645 3,145Other expenses 24 (2,430) (2,529)
Profit/(Loss) from continuing operations before taxand finance income / expense 91,701 (124,324)
Foreign exchange differences gain/(loss), net 1,394 (93)Finance income 13 3,849 3,904Finance cost 13 (33,205) (46,441)Share of loss of associates and joint ventures 19 (8,163) (27,568)
Profit/(loss) before tax 55,576 (194,522)
Taxation 15 (11,937) (12,868)
Profit/(Loss) for the period 43,639 (207,390)
Attributable to:Equity holders of the Company 45,192 (183,822)Non-controlling interest (1,553) (23,568)
Basic earnings per share (in Euro) 31 0.12 (0.53)

Globe Trade Centre S.A.Consolidated Statement of Comprehensive Income
for the year ended 31 December 2015(In thousands of Euro)
The accompanying notes are an integral part of this Consolidated Statement of Comprehensive Income5
2015 2014
Profit/(loss) for the period 43,639 (207,390)
Gain/(loss) on hedge transactions (531) 10,549Income tax 85 (2,001)Net gain/(loss) on hedge transactions (446) 8,548
Foreign currency translation 143 (3,294)
Total comprehensive income/ (loss) for the period, net of taxto be reclassified to profit or loss in subsequent periods 43,336 (202,136)
Attributable to:Equity holders of the Company 44,745 (178,616)Non-controlling interest (1,409) (23,520)

Globe Trade Centre S.A.Consolidated Statement of Changes in Equity
for the year ended 31 December 2015(In thousands of Euro)
The accompanying notes are an integral part of this Consolidated Statement of Changes in Equity6
Issued and paidin share capital
Sharepremium
Capitalreserve
Hedgereserve
Foreign currencytranslation
Accumulatedprofit
Total Non-controllinginterest
Total
Balance as of1 January 2015 7,849 364,228 8,392 (3,839) 1,128 111,455 489,213 (62,032) 427,181Other comprehensiveincome / (loss) - - - (724) 277 - (447) 144 (303)Profit / (loss) for theyear ended31 December 2015 - - - - - 45,192 45,192 (1,553) 43,639Total comprehensiveincome / (loss) forthe period - - - (724) 277 45,192 44,745 (1,409) 43,336Issuance of shares 2,561 135,060 - - - - 137,621 - 137,621Purchase of NCIshares - - (29,038) - - - (29,038) 42,102 13,064
Balance as of31 December 2015 10,410 499,288 (20,646) (4,563) 1,405 156,647 642,541 (21,339) 621,202
Issued and paidin share capital
Sharepremium
Capitalreserve
Hedgereserve
Foreign currencytranslation
Accumulatedprofit Total
Non-controllinginterest Total
Balance as of1 January 2014 7,082 312,155 15,154 (12,344) 4,427 295,277 621,751 (45,870) 575,881Other comprehensiveincome / (loss) - - - 8,505 (3,299) - 5,206 48 5,254Loss for the periodended 31 December2014 - - - - - (183,822) (183,822) (23,568) (207,390)Total comprehensiveincome / (loss) forthe year - - - 8,505 (3,299) (183,822) (178,616) (23,520) (202,136)Issuance of shares 767 52,073 - - - - 52,840 - 52,840Purchase of NCIshares - - (6,762) - - - (6,762) 7,358 596
Balance as of31 December 2014 7,849 364,228 8,392 (3,839) 1,128 111,455 489,213 (62,032) 427,181

Globe Trade Centre S.A.Consolidated Statement of Cash Flowfor the year ended 31 December 2015
(In thousands of Euro)
The accompanying notes are an integral part of this Consolidated Statement of Cash Flow7
Year ended31 December
2015
Year ended31 December
2014
CASH FLOWS FROM OPERATING ACTIVITIES:Profit/(loss) before tax 55,576 (194,522)Adjustments for:Loss/(profit) from revaluation/impairment of assets and residential projects (26,222) 194,404Share of loss of associates and joint ventures 19 8,163 27,568Profit on disposal of asset (1,014) (4)Foreign exchange differences loss/(gain), net (1,394) (445)Finance income 13 (3,849) (3,904)Finance cost 13 33,205 46,441Share based payment loss/(profit) 12 863 (2,538)Depreciation and amortization 16 509 499Operating cash before working capital changes 65,837 67,499Increase in accounts receivables and prepayments and other current assets (1,340) (1,680)Decrease in residential inventory 10,263 12,895Decrease in advances received from residential (545) (2,082)Increase in deposits from tenants 663 17Increase/(decrease) in trade and other payables 966 (945)
Cash generated from operations 75,844 75,704Tax paid in the period (2,735) (2,452)Net cash from operating activities 73,109 73,252
CASH FLOWS FROM INVESTING ACTIVITIES:Expenditure on investment property (33,519) (25,821)Purchase of completed investment property 8 (53,080) -Sale of investment property 42,665 10,614Sale of residential landbank and inventory 8,504 -Tax Paid (4,571) -Sale of subsidiary 13,032 -Purchase of subsidiary 7 (191) -Purchase of minority (800) (279)Interest received 1,279 2,019Lease origination expenses - (208)Liquidation of Joint Ventures 8 3,890 -Loans granted (288) (566)Loans repayments 244 330Net cash used in investing activities (22,835) (13,911)CASH FLOWS FROM FINANCING ACTIVITIESProceeds from the issuance of shares 8 140,102 53,680Share issuance expenses (2,481) (841)Proceeds from long-term borrowings 62,947 124,494Repayment of long-term borrowings (137,970) (149,409)Repayment of hedge (1,928) (20,762)Interest paid (26,708) (38,456)Loans origination cost (1,148) (1,561)Decrease/(Increase) in short term deposits 4,558 (89)Net cash from /(used) in financing activities 37,372 (32,944)Effect of foreign currency translation 763 (1,773)Net increase in cash and cash equivalents 88,409 24,624Cash and cash equivalents at the beginning of the period 81,063 56,439Cash and cash equivalents at the end of the period 169,472 81,063
Globe Trade Centre S.A.Notes to the Consolidated Financial Statements
for the year ended 31 December 2015 (in thousands of Euro)
8
1. Principal activities
Globe Trade Centre S.A. (the “Company” or “GTC”) and its subsidiaries (“GTC Group” or“the Group”) are an international real-estate corporation. The Company was registered inWarsaw on 19 December 1996. The Company’s registered office is in Warsaw, Poland at 5Wołoska Street. The Company owns through subsidiaries, joint ventures and associatescommercial and residential real estate companies in Poland, Hungary, Romania, Serbia,Croatia, Ukraine, Slovakia, Bulgaria, Russia and Czech Republic.
The Group’s business activities are:a) Development and rental of office and retail space andb) Development and sale of residential units.
As of 31 December 2015 and 2014, the number of full time equivalent working employeesin the Group companies was 143 and 144, respectively.
There is no seasonality in the business of the Group companies.
GTC is listed on the Warsaw Stock exchange.
The major shareholder of the Company is LSREF III GTC Investments B.V. (“LSREF III”),controlled by Lone Star, a global private equity firm, which held 275,049,658 shares59.77% of total share as of 31 December 2015.
2. Functional and reporting currencies
The functional currency of GTC is Euro. The functional currency of some of GTC’ssubsidiaries is other than Euro.
The financial statements of those companies prepared in their functional currencies areincluded in the consolidated financial statements by translation into Euro using appropriateexchange rates outlined in IAS 21. Assets and liabilities are translated at the period endexchange rate, while income and expenses are translated at average exchange rates forthe period. All resulting exchange differences are classified in equity as “Foreign currencytranslation” without effecting earnings for the period.

Globe Trade Centre S.A.Notes to the Consolidated Financial Statements
for the year ended 31 December 2015 (in thousands of Euro)
9
3. Basis of preparation
The Company maintains its books of account in accordance with accounting principles andpractices employed by enterprises in Poland as required by Polish accounting regulations.The companies outside Poland maintain their books of account in accordance with localGAAP.
These consolidated financial statements have been prepared in accordance withInternational Financial Reporting Standards ( "IFRS" ) as adopted by the EU ( "EU IFRS").At the date of authorisation of these consolidated financial statements, taking into accountthe EU's ongoing process of IFRS endorsement and the nature of the Group's activities,there is a difference between International Financial Reporting Standards and InternationalFinancial Reporting Standards endorsed by the European Union. The Group applied thepossibility existing for the companies applying International Financial Reporting Standardsendorsed by the EU, to apply IFRIC 21 for reporting periods beginning on or after 1 January2015 and to apply amendments to IFRS 2 and amendments to IFRS 3, being part ofImprovements to IFRSs resulting from the review of IFRS 2010-2012, for reporting periodsbeginning on or after 1 January 2016.
4. Going concern
The Group’s policies and processes are aimed at managing the Group’s capital, financialand liquidity risks on a sound basis. The Group meets its day to day working capitalrequirements through generation of operating cash-flows from rental income and sale ofresidential properties. Further details of financial risks and capital management processesare described in Note 34.
As of 31 December 2015, the Group’s net working capital (defined as current assets lesscurrent liabilities) was positive and amounted to Euro 82 million.
The management has analysed the timing, nature and scale of potential financing needs ofparticular subsidiaries and believes that cash on hand, as well as, expected operating cash-flows will be sufficient to fund the Group’s anticipated cash requirements for working capitalpurposes, for at least the next twelve months from the balance sheet date. Consequently,the consolidated financial statements have been prepared on the assumption that theGroup companies will continue as a going concern in the foreseeable future, for at least12 months from the balance sheet date.

Globe Trade Centre S.A.Notes to the Consolidated Financial Statements
for the year ended 31 December 2015 (in thousands of Euro)
10
5. Changes in accounting policies
New and amended standards and interpretations
These consolidated financial statements are prepared based on the same accountingpolicies as for the consolidated financial statements of the Group for the year ended31 December 2014, except for the following amendments to existing standards and newregulations that are effective for financial years beginning on or after 1 January 2015:
• Amendments introduced as part of the Improvements to IFRSs 2011-2013 cycle,published on December 12th 2013 (effective for annual periods beginning on or afterJuly 1st 2014) − in the EU effective for annual periods beginning on or after 1 January2015,
• IFRIC 21 Levies, published on 20 May 2013 (applicable to annual periods beginning onor after 1 January 2014 – in the EU effective for annual periods beginning on or after17 June 2014).
Standards issued but not yet effective
The following new standards, amendments to standards and interpretations have beenissued but are not yet effective.• Amendments introduced as part of the Improvements to IFRSs 2010-2012 cycle,
published on December 12th 2013 (effective for annual periods beginning on or afterJuly 1st 2014) − in the EU effective for annual periods beginning on or after 1 February2015,
• Amendments introduced as part of the Improvements to IFRSs 2011-2013 cycle,published on December 12th 2013 (effective for annual periods beginning on or afterJuly 1st 2014) − in the EU effective for annual periods beginning on or after 1 January2015,
• Amendments to IAS 19 Employee Benefits: Defined Benefit Plans − EmployeeContributions (effective for annual periods beginning on or after July 1st 2014) − in theEU effective for annual periods beginning on or after 1 February 2015,
• Amendments to IAS 16 Property, Plant and Equipment and IAS 38 Intangible Assets:Clarification of Acceptable Methods of Depreciation and Amortisation, published on12 May 2014 (effective for annual periods beginning on or after 1 January 2016),
• Amendments to IAS 16 Property, Plant and Equipment and IAS 41 Agriculture: BearerPlants, published on 30 June 2014 (effective for annual periods beginning on or after1 January 2016),
• Amendments to IAS 27 Separate Financial Statements: Equity method in separatefinancial statements, published on August 12th 2014 (effective for annual periodsbeginning on or after 1 January 2016),
• Amendments introduced as part of the Improvements to IFRSs 2012-2014 cycle,published on 25 September 2014 (effective for annual periods beginning on or after1 January 2016),
• Amendments to IAS 1 Presentation of financial statements − Disclosures, published on18 December 2014 (effective for annual periods beginning on or after 1 January 2016).

Globe Trade Centre S.A.Notes to the Consolidated Financial Statements
for the year ended 31 December 2015(in thousands of Euro)
11
5. Changes in accounting policies (continued)
The Company has not early adopted any other standard, interpretation or amendment thatwas issued but is not yet effective.
The management is in process of analyzing the impact of the above new standards andamendments on the consolidated financial statements in the period of their initialapplication.
6. Summary of significant accounting policies
(a) Basis of accounting
The consolidated financial statements have been prepared on a historical cost basis,except for completed investment properties, IPUC if certain condition described in note6(c) ii are met, and derivative financial instruments that have been measured at fair value.
(b) Plant and Equipment
Plant and equipment consist of vehicles and equipment. Plant and equipment are recordedat cost less accumulated depreciation and impairment. Depreciation is provided using thestraight-line method over the estimated useful life of the asset. Reassessment of the usefullife and indications for impairment is done each quarter.
The following depreciation rates have been applied:Depreciation rates
Equipment 7 -20 %Vehicles 20 %
Assets under construction other than investment property are shown at cost. The directcosts paid to subcontractors for the improvement of the property are capitalised intoconstruction in progress. Capitalised costs also include borrowing costs, planning anddesign costs, construction overheads and other related costs. Assets under constructionare not depreciated.
(c) Investment properties
Investment property comprises of a land plot or a building or a part of a building held toearn rental income and/or for capital appreciation and property that is being constructed ordeveloped for future use as investment property (investment property under construction).

Globe Trade Centre S.A.Notes to the Consolidated Financial Statements
for the year ended 31 December 2015(in thousands of Euro)
12
6. Summary of significant accounting policies (continued)
(i) Completed Investment properties
Investment properties are stated at fair value according to the fair value model, whichreflects market conditions at the reporting date. Gains or losses arising from a change inthe fair value of the investment properties are included in the income statement in the yearin which they arise.
Completed investment properties were externally valued by independent appraisers as of31 December 2015 based on open market values. Completed properties are either valuedon the basis of Discounted Cash Flow or - as deemed appropriate – on basis of the IncomeCapitalisation or Yield method.
Investment properties are derecognised when either they have been disposed of or whenthe investment property is permanently withdrawn from use and no future economic benefitis expected from its disposal. Any gains or losses on the retirement or disposal of aninvestment property are recognised in the income statement in the year of retirement ordisposal.
Transfers are made to investment property when, and only when, there is a change in use,evidenced by the end of owner occupation or commencement of an operating lease.Transfers are made from investment property when, and only when, there is a change inuse, evidenced by commencement of owner occupation or commencement of developmentwith a view to sale.
(ii) Investment property under construction
The Company has decided to revalue only IPUC, for which a substantial part of thedevelopment risks have been eliminated. Assets, for which this is not the case, arepresented at the lower of cost or recoverable amount.
Land is reclassified to IPUC at the moment, at which active development of this landbegins.
The Company has adopted the following criteria to assess whether the substantial risks areeliminated with regard to particular IPUC:• agreement with general contractor is signed;• building permit is obtained;• at least 20% of the rentable area is leased to tenants (based on the signed lease
agreements and letter of intents).
The fair values of IPUC were determined, as at their stage at the end of the reporting period(first implementation as of 31 December 2008). Valuations were performed in accordancewith RICS and IVSC Valuation Standards using either the residual method approach, DCFor sales comparison approach, as deemed appropriate by the valuer. Each IPUC isindividually assessed.
The future assets’ value is estimated based on the expected future income from the project,using yields that are higher than the current yields of similar completed property.The remaining expected costs to completion are deducted from the estimated future assetsvalue.
For projects where the expected future completion risk is above average (as deemedappropriate by the valuer), also a developer profit margin of unexecuted works, wasdeducted from the value.

Globe Trade Centre S.A.Notes to the Consolidated Financial Statements
for the year ended 31 December 2015(in thousands of Euro)
13
6. Summary of significant accounting policies (continued)
(d) Investment in associates
Investment in associates is accounted for under the equity method. The investment iscarried in the statement of financial position at cost plus post acquisition changes in theGroup share of net assets of the associate.
(e) Investment in jointly controlled entities
Investment in Joint Ventures is accounted for under the equity method. The investment iscarried in the statement of financial position at cost plus post acquisition changes in theGroup share of net assets of the Joint Ventures.
(f) Lease origination costs
The costs incurred to originate a lease (mainly brokers fees) for available rental space areadded to the carrying value of investment property until the date of revaluation of therelated investment property to its fair value.
(g) Inventory and residential landbank
Inventory relates to residential projects under construction and is stated at the lower of costand net realisable value. The realisable value is measured using the Discounted Cash Flowmethod, or Comparison method. Costs relating to the construction of a residential projectare included in inventory.
Commissions paid to sales or marketing agents on the sale of real estate units, which arenot refundable, are expensed in full when the contract to sell is secured.
The Group classifies its residential inventory to current or non-current assets, based ontheir development stage within the business operating cycle. The normal operating cycle inmost cases falls within period of 1-5 years. Residential projects, which are active, areclassified as current inventory. Residential projects which are planned to be completed in aperiod longer than the operating cycle are classified as residential landbank under non-current assets.
(h) Advances received
Advances received (related to pre-sales of residential units) are deferred to the extent thatthey are not reflected as revenue as described below in note 6(k).
(i) Rental revenue
Rental revenues result from operating leases and are recognised as income over the leaseterm on a straight-line basis.
(j) Interest and dividend income
Interest income is recognised on an accrual basis using the effective interest method.
Dividend income is recognised when the shareholders’ right to receive payments isestablished.

Globe Trade Centre S.A.Notes to the Consolidated Financial Statements
for the year ended 31 December 2015(in thousands of Euro)
14
6. Summary of significant accounting policies (continued)
(k) Contract revenue and costs recognition
Revenue is recognized to the extent that it is probable that the economic benefits will flowto the Group and the revenue can be reliably measured. Revenues comprise amountsreceived or receivable, net of Value Added Tax and discounts.
Revenue from the sale of houses and apartments is recognized when the significant risksand rewards of ownership of the goods have passed to the buyer and when the revenuecan be measured reliably. The risks and rewards are considered as transferred to the buyerwhen the houses or apartments have been substantially constructed, accepted by thecustomer and all significant amount resulting from the sale agreement was paid by thebuyer.
The costs related to the real estate development incurred during the construction period arecapitalized in inventory. Once revenue is recognised, the costs in respect of sold units areexpensed.
(l) Borrowing costs
Borrowing costs directly attributable to the acquisition or construction of an asset thatnecessarily takes a substantial period of time to get ready for its intended use or sale arecapitalised as part of the cost of the asset. All other borrowing costs are expensed in theperiod in which they occur. Borrowing costs consist of interest and other costs that an entityincurs in connection with the borrowing of funds.
The interest capitalised is calculated using the Group’s weighted average cost ofborrowings after adjusting for borrowings associated with specific developments. Whereborrowings are associated with specific developments, the amount capitalised is the grossinterest incurred on those borrowings less any investment income arising on theirtemporary investment. Interest is capitalised as from the commencement of thedevelopment work until the date of practical completion, i.e., when substantially all of thedevelopment work is completed. The capitalisation of finance costs is suspended if thereare prolonged periods when development activity is interrupted. Interest is also capitalisedon the purchase cost of a site of property acquired specifically for redevelopment, but onlywhere activities necessary to prepare the asset for redevelopment are in progress.
Debt issuance expenses are deducted from the amount of debt originally recognised.These costs are amortised through the income statement over the estimated duration of theloan, except to the extent that they are directly attributable to construction. Debt issuanceexpenses represent an adjustment to effective interest rates.
(m) Share issuance expenses
Share issuance costs are deducted from equity (share premium), net of any related incometax benefits.
Globe Trade Centre S.A.Notes to the Consolidated Financial Statements
for the year ended 31 December 2015(in thousands of Euro)
15
6. Summary of significant accounting policies (continued)
(n) Income taxes
The current provision for corporate income tax for the Group companies is calculated inaccordance with tax regulations ruling in particular country of operations and is based onthe profit or loss reported under relevant tax regulations.
Deferred tax liabilities are recognised for all taxable temporary differences, except:
i. Where the deferred tax liability arises from the initial recognition of goodwill or of anasset or liability in a transaction that is not a business combination and, at the time ofthe transaction, affects neither the accounting profit nor taxable profit or loss,
ii. In respect of taxable temporary differences associated with investments insubsidiaries, associates and interests in joint ventures, where the timing of thereversal of the temporary differences can be controlled and it is probable that thetemporary differences will not reverse in the foreseeable future.
Deferred tax assets are recognised for all deductible temporary differences, carry forward ofunused tax credits and unused tax losses, to the extent that it is probable that taxable profitwill be available against which the deductible temporary differences, and the carry forwardof unused tax credits and unused tax losses can be utilised, except:
i. Where the deferred tax asset relating to the deductible temporary difference arisesfrom the initial recognition of an asset or liability in a transaction that is not a businesscombination and, at the time of the transaction, affects neither the accounting profitnor taxable profit or loss.
ii. In respect of deductible temporary differences associated with investments insubsidiaries, associates and interests in joint ventures, deferred tax assets arerecognised only to the extent that it is probable that the temporary differences willreverse in the foreseeable future and taxable profit will be available against which thetemporary differences can be utilised.
Deferred tax assets and liabilities are measured using the tax rates enacted to taxableincome in the years in which these temporary differences are expected to be recovered orsettled.
The measurement of deferred tax liabilities and deferred tax assets reflects the taxconsequences that would follow from the manner in which each company of the Groupexpects, at the reporting date, to recover or settle the carrying amount of its assets andliabilities.
At each reporting date, the Group companies re-assess unrecognised deferred tax assetsand the carrying amount of deferred tax assets. The companies recognise a previouslyunrecognised deferred tax asset to the extent that it has become probable that futuretaxable profit will allow the deferred tax asset to be recovered.
The companies conversely reduce the carrying amount of a deferred tax asset to the extentthat it is no longer probable that sufficient taxable profit will be available to allow the benefitof part or all of the deferred tax asset that might be utilised.

Globe Trade Centre S.A.Notes to the Consolidated Financial Statements
for the year ended 31 December 2015(in thousands of Euro)
16
6. Summary of significant accounting policies (continued)
(o) Foreign exchange differences
For companies with Euro as functional currency, transactions denominated in a foreigncurrency (including Polish Zloty) are recorded in Euro at the actual exchange ratesprevailing at the date of the transaction. Monetary assets and liabilities denominated inforeign currencies are revalued at period-end using period-end exchange rates. Foreigncurrency translation differences are charged to the income statement.
(p) Financial instruments
All financial assets and financial liabilities are recognised on the reporting date. All thesefinancial assets and liabilities are initially measured at fair value plus transaction costs incase of financial assets and financial liabilities not classified as fair value through profit andloss. All purchases of financial assets (whose delivery time is regulated in the market) areaccounted at trade date.
The table below presents the categorisation of financial assets and liabilities: Item,Category, and Measurement.
Item Category MeasurementFinancial assets/liabilities
Cash and cash equivalent Held for trading Fair value – adjusted to incomestatements
Short-term deposits Loans and receivables Amortised costDebtors Loans and receivables Amortised cost
Trade and other payables Other financial liabilities Amortised costLong and short term Loans Amortised costDeposits from tenants Amortised costLong term payables Amortised costInterest Rate Swaps Hedging (cash flow hedges) Fair value – adjusted to other
comprehensive income (effective portion) /adjusted to income statements (ineffectiveportion)
The Group recognises a financial asset and financial liability in its statement of financialposition, when and only when, it becomes a party to the contractual provisions of theinstrument. An entity shall derecognise a financial asset when, and only when thecontractual rights to the cash flows from the financial asset expire or it transfers thefinancial asset and the transfer qualifies for derecognition. A financial liability should beremoved from the statement of financial position when, and only when, it is extinguished,that is, when the obligation specified in the contract is either discharged, cancelled, orexpired.
(q) Cash and cash equivalents
Cash comprises cash on hand and on-call deposits. Cash equivalents are short-term highlyliquid investments that readily convert to a known amount of cash and which are subject toinsignificant risk of changes in value.

Globe Trade Centre S.A.Notes to the Consolidated Financial Statements
for the year ended 31 December 2015(in thousands of Euro)
17
6. Summary of significant accounting policies (continued)
(r) Trade and other receivables
Short term and long term trade receivables are carried at amortised cost. An estimate fordoubtful debts allowance is made when collections of the full amount is no longer probable,based on historical collection patterns or alternatively having regard to the age of thereceivable balances.
(s) Impairment of assets
The carrying value of assets is periodically reviewed by the Management to determinewhether impairment may exist. In particular, the Management assessed whether theimpairment indicators exist. Based upon its most recent analysis management believes thatany material impairment of assets that existed at the reporting date, was reflected in thesefinancial statements.
(t) Purchase of shares of minority
If the Company increases its share in the net assets of its controlled subsidiaries thedifference between the consideration paid/payable and the carrying amount of non-controlling interest is recognised in equity attributable to equity holders of the parent.
(u) Derivatives and hedge accounting
The Group uses interest rate swaps and collars to hedge its risks associated with interestrate volatility (cash flow hedges).
In relation to the instruments, which meet the conditions of cash flow hedges, the portion ofgain or loss on the hedging instrument that is determined to be an effective hedge isrecognised directly in other comprehensive income and the ineffective portion is recognisedin net profit or loss. Classification of hedges in the statement of financial position dependson their maturity.
The conditions of the cash flow hedges are as follows:
(a) At the inception of the hedge there is formal designation and documentation of thehedging relationship and the entity's risk management objective and strategy forundertaking the hedge. That documentation shall include identification of the hedginginstrument, the hedged item or transaction, the nature of the risk being hedged andhow the entity will assess the hedging instrument's effectiveness in offsetting theexposure to changes in the hedged item's fair value or cash flows attributable to thehedged risk.
(b) The hedge is expected to be highly effective in achieving offsetting changes in fairvalue or cash flows attributable to the hedged risk, consistently with the originallydocumented risk management strategy for that particular hedging relationship.
(c) For cash flow hedges, a forecast transaction that is the subject of the hedge must behighly probable and must present an exposure to variations in cash flows that couldultimately affect profit or loss.
(d) The effectiveness of the hedge can be reliably measured, i.e. the fair value or cashflows of the hedged item that are attributable to the hedged risk and the fair value ofthe hedging instrument can be reliably measured.
(e) The hedge is assessed on an ongoing basis and determined actually to have beenhighly effective throughout the financial reporting periods for which the hedge wasdesignated.

Globe Trade Centre S.A.Notes to the Consolidated Financial Statements
for the year ended 31 December 2015(in thousands of Euro)
18
6. Summary of significant accounting policies (continued)
Hedge accounting is discontinued when the hedging instrument expires, or is sold,terminated or exercised, or no longer qualifies for hedge accounting. At that point of time,any cumulative gain or loss recognised in equity is transferred to net profit or loss for theyear.
For derivatives that do not qualify for hedge accounting, any gain or losses arising fromchanges in fair value are recorded directly to net profit and loss of the year.
The fair value of interest rate swap contracts is determined by reference to market valuesfor similar instruments.
(v) Estimations
The preparation of financial statements in accordance with International Financial ReportingStandards requires Management to make estimates and assumptions that affect thereported amounts of assets and liabilities and contingent assets and liabilities at balancedate. The actual results may differ from these estimates.
Investment property represents property held for long-term rental yields. Investmentproperty is carried at fair value which is established at least annually by an independentregistered valuer based on discounted projected cash flows from the investment propertyusing the discounts rates applicable for the local real estate market and updated byManagement judgment. The changes in the fair value of investment property are included inthe profit or loss for the period in which it arises.
The group uses estimates in determining the amortization rates used.
(w) Significant accounting judgements
In the process of applying the Group's accounting policies, management has made thefollowing judgments:
The Group has entered into commercial property leases on its investment property portfolio.The Group has determined that it retains all the significant risks and rewards of ownershipof these properties which are leased out on operating leases.
Significant accounting judgements related to investment property under construction arepresented in note 6 c) (ii).
The Group classifies its residential inventory to current or non-current assets, based ontheir development stage within the business operating cycle. The normal operating cyclemost cases falls within period of 1-5 years. Residential projects, which are active, areclassified as current inventory. Residential projects which are planned to be completed in aperiod longer than the operating cycle are classified as residential landbank under non-current assets.
On the basis of the assessment made, the Group has reclassified part of inventory fromcurrent assets to residential landbank in non–current assets.
Deferred tax with respect to outside temporary differences relating to subsidiaries,branches associates and joint agreements was calculated based on estimated probabilitythat these temporary differences will be realized in the foreseeable future

Globe Trade Centre S.A.Notes to the Consolidated Financial Statements
for the year ended 31 December 2015(in thousands of Euro)
19
6. Summary of significant accounting policies (continued)
The Company also makes assessment of probability of realization of deferred tax asset. Ifnecessary, the Company decreases deferred tax asset to the realizable value.
The group uses judgements in determining the settlement of share based payment in cash.
(x) Basis of Consolidation
The consolidated financial statements comprise the financial statements of GTC S.A. andits subsidiaries prepared using consistent accounting policies.
The Company, regardless of the nature of its involvement with an entity (the investee), shalldetermine whether it is a parent by assessing whether it controls the investee.
The Company controls an investee when it is exposed, or has rights, to variable returnsfrom its involvement with the investee and has the ability to affect those returns through itspower over the investee.Thus, the Company controls an investee if and only if it has all the following:
(a) power over the investee;(b) exposure, or rights, to variable returns from its involvement with the investee; and(c) the ability to use its power over the investee to affect the amount of the investor's
returns.
Subsidiaries are consolidated from the date on which control is transferred to the Groupand cease to be consolidated from the date on which control is transferred out of theGroup.
All inter-company balances and transactions are eliminated upon consolidation.
(y) Provisions
Provisions are recognised when the Company has present obligation, (legal orconstructive) as a result of a past event, it is probable that an outflow of resourcesembodying economic benefits will be required to settle the obligation and reliable estimatecan be made of the amount of the obligation.
(z) Share-based payment transactions
Amongst others, the Company gives shares or rights to shares to key managementpersonnel in exchanges for services.
The cost of equity-settled transactions with employees is measured by reference to theshare value at the date at which they were granted. The cost of equity-settled transactionsis recognised, together with a corresponding increase in equity, over the period in which theservice conditions are fulfilled, ending on the date on which the relevant employeesbecome fully entitled to the award. The cumulative expense recognised for equity-settledtransactions at each reporting date until the vesting date reflects the extent to which thevesting period has expired.
The cost of cash-settled transactions with employees is measured initially at fair value atthe grant date. The fair value is expensed over period until the vesting date with recognitionof a corresponding liability. The liability is re-measured to fair value at each reporting dateup and including the settlement date, with changes in fair value recognised in employeebenefits expense.

Globe Trade Centre S.A.Notes to the Consolidated Financial Statements
for the year ended 31 December 2015(in thousands of Euro)
20
6. Summary of significant accounting policies (continued)
(aa) Leases
Lessor:Leases where the group does not transfer substantially all the risk and benefits ofownership of the asset are classified as operating leases.
7. Investment in Subsidiaries, Associates and Joint Ventures
The consolidated financial statements include the financial statements of the Company andits subsidiaries listed below together with direct and indirect ownership of these entities asat the end of each period (the table presents the effective stake):
Subsidiaries
Name HoldingCompany
Country ofincorporation
31 December2015
31 December2014
GTC Konstancja Sp. z o.o. GTC S.A. Poland 100% 100%GTC Korona S.A. GTC S.A. Poland 100% 100%Globis Poznań Sp. z o.o. GTC S.A. Poland 100% 100%GTC Aeropark Sp. z o.o. GTC S.A. Poland 100% 100%Globis Wrocław Sp. z o.o. GTC S.A. Poland 100% 100%GTC Satellite Sp. z o.o. GTC S.A. Poland 100% 100%GTC Ogrody Galileo Sp. z o.o. GTC S.A. Poland 100% 100%GTC GK Office Sp. z o.o. GTC S.A. Poland 100% 100%GTC Com 1 Sp. z o.o. GTC S.A. Poland 100% 100%GTC Karkonoska Sp. z o.o. GTC S.A. Poland 100% 100%GTC Ortal Sp. z o.o. GTC S.A. Poland 100% 100%Diego Sp. z o.o. GTC S.A. Poland 100% 100%GTC Francuska Sp. z o.o. GTC S.A. Poland 100% 100%GTC UBP Sp. z o.o. GTC S.A. Poland 100% 100%GTC Wilson Park Sp. z o.o. GTC S.A. Poland 100% 100%GTC Moderna Sp. z o.o. GTC S.A. Poland 100% 100%CH Wilanow Sp. z o.o. GTC S.A. Poland 100% 100%GTC Management sp. z o.o. (*) GTC S.A. Poland 100% 100%GTC Corius sp. z o.o. GTC S.A. Poland 100% 100%Centrum Światowida sp. z o.o. GTC S.A. Poland 100% 100%Glorine investments sp. z o.o. GTC S.A. Poland 100% 100%Glorine investments Sp. z o.o. s.k.a. GTC S.A. Poland 100% 100%Omikron Development Inwestycje Sp. z o.o. (**) GTC S.A. Poland - 100%GTC Galeria CTWA Sp. z o.o. GTC S.A. Poland 100% 100%
(*) Previously Alfa Development Inwestycje Sp. z o.o.(**) Liquidated

Globe Trade Centre S.A.Notes to the Consolidated Financial Statements
for the year ended 31 December 2015(in thousands of Euro)
21
7. Investment in Subsidiaries, Associates and Joint Ventures (continued)
Name HoldingCompany
Country ofincorporation
31 December2015
31 December2014
GTC Hungary Real Estate DevelopmentCompany Ltd. (“GTC Hungary”) GTC S.A. Hungary 100% 100%
Commercial Properties B.V. (formerly BudapestOffices B.V.) GTC Hungary Netherland 100% 100%
GTC Duna Kft.(***) GTC Hungary Hungary 100% -
Vaci Ut 81-85 Kft. GTC Hungary Hungary 100% 100%
Riverside Apartments Kft. (“Riverside”) GTC Hungary Hungary 100% 100%
Centre Point I. Kft. (“Centre Point I”) GTC Hungary Hungary 100% 100%
Centre Point II. Kft. (“Centre Point II”) GTC Hungary Hungary 100% 100%
Spiral Holding Kft. GTC Hungary Hungary 100% 100%
Spiral I.Kft. GTC Hungary Hungary 100% 100%
Spiral II. Kft. GTC Hungary Hungary 100% 100%
River Loft Ltd. GTC Hungary Hungary 100% 100%
SASAD Resort Kft. (“Sasad”) GTC Hungary Hungary 100% 100%
Albertfalva Kft. (“Szeremi Gate”) GTC Hungary Hungary 100% 100%
GTC Metro Kft. GTC Hungary Hungary 100% 100%
SASAD Resort Offices Kft. GTC Hungary Hungary 100% 100%
Mastix Champion Kft. GTC Hungary Hungary 100% 100%
GTC Renaissance Plaza Kft. GTC Hungary Hungary 100% 100%
SASAD II Kft. GTC Hungary Hungary 100% 100%Amarantan Ltd. GTC Hungary Hungary 100% 100%
Abritus Kft. GTC Hungary Hungary 100% 100%
Immo Buda Kft. GTC Hungary Hungary 100% 100%
Szemi Ingatlan Ltd. GTC Hungary Hungary 100% 100%
Preston Park Kft. GTC Hungary Hungary 100% 100%
GTC Real Estate Investments Ukraine B.V. (“GTCUkraine”) GTC S.A. Netherlands 90% 90%
GTC Slovakia Real Estate s.r.o. GTC RH B.V. Slovakia 100% 100%
GTC Vinohradis Piazza S.R.O. (*) GTC RH B.V. Slovakia - 100%
GTC Jarosova S.R.O. (**) GTC RH B.V. Slovakia - 100%
GTC Hill S.R.O. (*) GTC RH B.V. Slovakia - 100%
GTC Vinohradis Villas S.R.O. (**) GTC RH B.V. Slovakia - 100%
GTC Real Estate Vinohrady s.r.o.(“GTC Vinohrady”) (*) GTC RH B.V. Slovakia - 100%
GTC Real Estate Vinohrady 2 s.r.o.(“GTC Vinohrady 2”) (*) GTC RH B.V. Slovakia - 100%
(*) Merged into GTC Slovakia Real Estate s.r.o.(**) Sold(***)The company was established in 2015

Globe Trade Centre S.A.Notes to the Consolidated Financial Statements
for the year ended 31 December 2015(in thousands of Euro)
22
7. Investment in Subsidiaries, Associates and Joint Ventures (continued)
Name Holding Company Country ofincorporation
31 December2015
31 December2014
GTC Nekretnine Zagreb d.o.o.(“GTC Zagreb”) GTC RH B.V. Croatia 100% 100%
Euro Structor d.o.o. GTC RH B.V. Croatia 70% 70%
Marlera Golf LD d.o.o. GTC RH B.V. Croatia 80% 80%
Nova Istra Idaeus d.o.o. Marlera Golf LDd.o.o Croatia 80% 80%
GTC Nekretnine Istok d.o.o. (“Osijek“) (*) GTC RH B.V. Croatia - 80%
GTC Nekretnine Jug. d.o.o. (under liquidation) GTC RH B.V. Croatia 100% 100%
GTC Sredisnja tocka d.o.o. GTC RH B.V. Croatia 100% 100%
GTC Nekretnine Zapad d.o.o.(under liquidation) GTC RH B.V. Croatia 100% 100%
Towers International Property S.R.L. GTC RH B.V. Romania 100% 100%
Galleria Shopping Center S.R.L. (formerly“International Hotel and Tourism S.R.L.”) GTC RH B.V. Romania 100% 100%
BCG Investment B.V. GTC RH B.V. Netherlands 100% 100%
Green Dream S.R.L. GTC RH B.V. Romania 100% 100%
Aurora Business Complex S.R.L (“Felicity“) GTC RH B.V. Romania 71.5% 71.5%
Yasmine Residential Complex S.R.L. (**) GTC RH B.V. Romania - 100%
Bucharest City Gate B.V. ("BCG”) GTC RH B.V. Netherlands 100% 58.9%
City Gate Bucharest S.R.L. BCG Romania 100% 58.9%
Mablethompe Investitii S.R.L. GTC RH B.V. Romania 100% 100%
Mercury Commercial Center S.R.L. (“GaleriaArad“) GTC RH B.V. Romania 100% 100%
Venus Commercial Center S.R.L. GTC RH B.V. Romania 100% 100%
Mars Commercial Center S.R.L. (“GaleriaPiatra Neamt“) GTC RH B.V. Romania 100% 100%
Beaufort Invest S.R.L. GTC RH B.V. Romania 100% 100%
Fajos S.R.L. GTC RH B.V. Romania 100% 100%
City Gate S.R.L. GTC RH B.V. Romania 100% 58.9%
Brightpoint Investments Limited GTC RH B.V. Cyprus 50.1% 50.1%
Complexul Residential Colentina S.R.L. GTC RH B.V. Romania 50.1% 50.1%
Operetico Enterprises Ltd. GTC RH B.V. Cyprus 66.7% 66.7%
Deco Intermed S.R.L. OpereticoEnterprises Ltd. Romania 66.7% 66.7%
GML American Regency Pipera S.R.L. GTC RH B.V. Romania 66.7% 66.7%
(*) Sold (**) Liquidated

Globe Trade Centre S.A.Notes to the Consolidated Financial Statements
for the year ended 31 December 2015(in thousands of Euro)
23
7. Investment in Subsidiaries, Associates and Joint Ventures (continued)Name Holding Company Country of
incorporation31 December
201531 December
2014
GTC RH B.V. (formerly GTC BulgariaB.V.)
GTC S.A. Netherlands 100% 100%
Galeria Stara Zagora AD (“StaraZagora”) GTC RH B.V. Bulgaria 75% 75%
Galeria Burgas AD GTC RH B.V. Bulgaria 80% 80%
Galeria Varna AD (“Varna”) (***) Galeria Ikonomov GmbH Bulgaria - 65%
GTC Business Park EAD GTC RH B.V. Bulgaria 100% 100%
NRL EAD GTC RH B.V. Bulgaria 100% 100%
Galeria Ikonomov GmbH (**) GTC RH B.V. Austria 100% 65%
GTC Yuzhen Park EAD (“GTCYuzhen”) GTC RH B.V. Bulgaria 100% 100%
GTC Medj Razvoj Nekretnina d.o.o. GTC RH B.V. Serbia 100% 100%
GTC Business Park d.o.o. GTC RH B.V. Serbia 100% 100%
GTC Commercial and ResidentialVentures d.o.o. GTC RH B.V. Serbia 100% 100%
GTC Real Estate Developments d.o.o. GTC CommercialDevelopment d.o.o. Serbia 95% 95%
Demo Invest d.o.o. GTC RH B.V. Serbia 100% 100%
Atlas Centar d.o.o. GTC RH B.V. Serbia 100% 100%
GTC Commercial Development d.o.o. GTC RH B.V. Serbia 100% 100%
Europort Investment (Cyprus) 1 Limited(*) GTC RH B.V. Cyprus 95% -
Black Sea Management LLC (*) Europort Investment(Cyprus) 1 Limited Ukraine 95% -
Europort Ukraine Holdings 1 LLC (*) Europort Investment(Cyprus) 1 Limited
Ukraine 95% -
Europort Ukraine Holdings 2 LLC (*) Europort Investment(Cyprus) 1 Limited
Ukraine 95% -
Europort Ukraine LL (*) Europort Investment(Cyprus) 1 Limited
Ukraine 95% -
Europort Project Ukraine 1 LLC (*) Europort Investment(Cyprus) 1 Limited
Ukraine 95%-
Investment in Associates and Joint Ventures
Name Holding Company Country ofincorporation
31 December2015
31 December2014
Havern Investments sp. z o.o. GTC S.A. Poland 50% 50%
Delta Development Inwestycje sp. z o.o. GTC S.A. Poland - 50%
Yatelsis Viborgskaya Limited of Nicosia(“YVL”) GTC RH B.V. Cyprus 50% 50%
Ana Tower Offices S.R.L. GTC RH B.V. Romania 50% 50%
Lighthouse Holdings Limited S.A.(“Lighthouse”) GTC S.A. Luxembourg 35% 35%
CID Holding S.A. (“CID”) GTC S.A. Luxembourg 35% 35%
Europort Investment (Cyprus) 1 Limited(*) GTC Ukraine B.V. Cyprus - 49.9%
Europort LTD GTC RH B.V. Israel 9.9% 9.9%
(*) In Dec 2015, the Company purchased the majority shares for Euro 191 thousands,(**) Purchased as part of NCI acquisition of GTC Varna (see note 8),(***)Sold

Globe Trade Centre S.A.Notes to the Consolidated Financial Statements
for the year ended 31 December 2015(in thousands of Euro)
24
8. Events in the period
As of 31 December 2014, the loan agreements with Unicredit related to the Felicityresidential project with an outstanding loan amount of EUR 25.6 million exceeded the fairvalue of related asset. In March 2015, the Company transferred the Felicity project to asubsidiary of Unicredit. Unicredit released the Company from any payment obligationsarising from the loan agreements.
In April 2015, as a result of liquidation of joint venture, investments in joint venturesdecreased by EUR 67 million and long term liabilities decreased by EUR 63 million.
On 29 May 2015, the Group sold Centrum Biurowe Kazimierz in Krakow for the net price ofEUR 41.6 million.
In June 2015, the loan from EBRD and Raiffeisen Bank Austria, related to Osijek, in theamount of Euro 15.8 million was fully repaid.
In June 2015, the loan from OTP and MKB, related to Varna, in the amount of Euro 17.7million was fully repaid. At the same time, MKB and OTP granted to GTC a new loan in theamount of Euro 12.6 million.
On 26 June 2015, the Company and EBRD entered into an agreement for the restructuringof a loan to Mars Commercial Center SRL (Piatra Mall) and Mercury Commercial CenterSRL (Arad Mall). Furthermore, in June 2015 the Company and EBRD agreed on therestructuring of a loan granted to Galleria Stara Zagora AD, the owner of a shopping centerin Stara Zagora, Bulgaria.
In June 2015, the Company acquired remaining 35% in Galeria Ikonomov GmbH (owner ofGaleria Varna) and remaining 20% in GTC Nekretnine Istok d.o.o. As a result, the impact ofon the equity attributable to equity holders of the parent amounted to a decrease of Euro35.8 million. In July 2015, GTC Group sold the shares of GTC Nekretnine Istok d.o.o(Galeria Osijek) for the amount of Euro 1.3 million and the shares of Galleria Varna AD(Galeria Varna) for the amount of Euro 5.5 million (see note 27).
On 30 June 2015, the shareholders of the Company approved a resolution regarding theissuance of up to 140,000,000 new shares at a price of not less than PLN 5 per share toexisting shareholders. On 30 September 2015, the Company was informed that theexercise of the pre-emptive rights resulted in allocation of 108,906,190 Series K Shares at aprice of PLN 5.47 per share.
In July 2015, the Company commenced the construction of Galeria Polnocna shoppingcentre, Warsaw. In August 2015, the Company signed a credit facility agreement with BankPolska Kasa Opieki S.A., finance the Galeria Północna project. The facility comprises aconstruction loan in the amount of up to EUR 116 million and investment loan in theamount of up to EUR 150 million. (Under certain financial threshold the investment facilitymay be increased up to EUR 175 million).

Globe Trade Centre S.A.Notes to the Consolidated Financial Statements
for the year ended 31 December 2015(in thousands of Euro)
25
8. Events in the period (continued)
On 21 October 2015, the share capital increase (in relation to shareholders’ resolution from30 June 2015) was registered by the district court in Warsaw. The Company increased itsshare capital from PLN 35,131,028.80 to PLN 46,021,647.80 through the issuance of108,906,190 series K ordinary bearer shares in the Company with a nominal value of PLN0.10 (ten groszy) each. On 26 October 2015, the funds from shares issuance in the totalamount of PLN 595.7 million (Euro 140.1 million) were received by the Company.
In November 2015, the Company acquired Duna tower office building in Budapest,Hungary, for the total cost of Euro 53.1 million. Duna Tower office building is located in the13th District of Budapest and is leased to international tenants. GTC intends to continue theleasing activity through upgrading the property and improving its occupancy.
In December 2015, the Company acquired remaining 41.1% in BCG (owner of a company,which owns City Gate office building in Bucharest) for the total amount of Euro 18.1 million,which was paid in January 2016.
The impact of on the equity attributable to equity holders of the parent amounted to anincrease of Euro 5.4 million (see note 27).

Globe Trade Centre S.A.Notes to the Consolidated Financial Statements
for the year ended 31 December 2015(in thousands of Euro)
26
9. Revenue from operations
Revenue from operations comprises of the following:
2015 2014
Rental revenue 79,636 84,124Service revenue 25,363 25,511Residential revenue 12,364 14,649
117,363 124,284
Rental income includes turnover rent for the year ended 31 December 2015 ofapproximately Euro 2,347 thousand (2014: Euro 2,736 thousand)
The Group has entered into various operational lease contracts on its property portfolio inPoland, Romania, Croatia, Serbia and Hungary. The commercial property leases typicallyinclude clauses to enable periodic upward revision of the rental charge according toprevailing market conditions.

Globe Trade Centre S.A.Notes to the Consolidated Financial Statements
for the year ended 31 December 2015(in thousands of Euro)
27
9. Revenue from operations (continued)
Future minimum rentals receivable under operating leases from completed projects are, asfollows (in millions of Euro):
31 December 2015 31 December 2014
Within 1 year 78 84
After 1 year, but not more than 5 years 229 221
More than 5 years 26 72
333 377
The majority of revenue from operations is earned predominantly on the basis of amountsdenominated in, directly linked to or indexed by reference to the Euro.
10. Cost of operations
Costs of operations comprise the following:
2015 2014
Rental and service costs 26,462 28,703
Residential costs 10,871 14,452
37,333 43,155
Majority of service costs represents external services costs. Service costs relate toinvestment properties, which generate rental income.
11. Selling expenses
Selling expenses comprise of the following:
2015 2014
Brokerage and similar fees 203 242
Advertising and marketing 1,798 1,894
Payroll and related expenses 720 748
2,721 2,884

Globe Trade Centre S.A.Notes to the Consolidated Financial Statements
for the year ended 31 December 2015(in thousands of Euro)
28
12. Administration expenses
Administration expenses comprise of the following:
2015 2014
Remuneration and management fees 6,089 6,645
Audit and valuations 1,221 1,395
Legal and tax advisers 930 779
Office expenses 799 744
Investors relations 58 116
Travel expenses 298 362
Supervisory board remuneration fees 109 133
Severance expenses 155 444
Depreciation and other 523 733
Total before share based payment 10,182 11,351Share based payment 863 (2,570)Total 11,045 8,781
13. Financial income and financial expense
Financial income comprise of the following:
2015 2014
Interest on loans granted to associates and jointventures
2,999 2,730
Interest on deposits and other 850 1,174
3,849 3,904
Financial expense comprise of the following:
2015 2014
Interest expenses (on financial liabilities that arenot at fair value through profit or loss) and othercharges (29,559) (41,225)
Settlement of financial instruments (derivatives) (928) (1,636)
Change in fair value of financial instruments andhedge ineffectiveness (derivatives) (432) (1,826)
Loan raising expenses (2,286) (1,754)
(33,205) (46,441)
The average interest rate (including hedges) on the Group’s loans during the year ended31 December 2015 was 3.4% p.a. (4.2% p.a. in year 2014).

Globe Trade Centre S.A.Notes to the Consolidated Financial Statements
for the year ended 31 December 2015(in thousands of Euro)
29
14. Segmental analysis
The Group operating segments are carried out through subsidiaries that develop real estateprojects.
The operating segments are aggregated into reportable segments, taking into considerationthe nature of the business, operating markets and other factors. Reportable segments aredivided into two main segments:
1. Development and rental of office space and shopping malls (“rental activity”) and2. Development and sale of houses and apartment units (“residential activity”).
Current operating segments are divided into geographical zones, which have commoncharacteristics and reflect the nature of management reporting structure:
a. Poland and Hungaryb. Capital cities in SEE (South and Eastern Europe) countries (Romania, Serbia, Croatia,
Slovakia)c. Secondary cities in Bulgariad. Secondary cities in Croatiae. Secondary cities in Romania
Management monitors gross margin from operations of its business units for the purposesof making performance assessment and decision making. Operating segment performanceis evaluated based on gross margin from operations.
The resource allocation decisions made by the management are based, amongst others,on segmental analysis.

Globe Trade Centre S.A.Notes to the Consolidated Financial Statements
for the year ended 31 December 2015 (in thousands of Euro)
30
14. Segmental analysis (continued)
Segment analysis for the year ended 31 December 2015 and year ended 31 December 2014 is presented below:
Poland and HungaryCapital cities in SEE
countries Bulgaria-secondary cities Croatia-secondary cities Romania-secondary cities Consolidated31 December
2015 31 December
201431 December
2015 31 December
201431 December
201531 December
201431 December
201531 December
201431 December
201531 December
201431 December
201531 December
2014Rental andservice income 58,181 60,226 35,335 36,704 7,956 7,346 705 1,611 2,822 3,748 104,999 109,635Contract income 5,311 3,509 7,053 11,140 - - - - - - 12,364 14,649Total income 63,492 63,735 42,388 47,844 7,956 7,346 705 1,611 2,822 3,748 117,363 124,284
Rental andservice costs 12,623 12,028 8,936 9,124 2,083 2,445 695 1,803 2,125 3,303 26,462 28,703Contract costs 4,003 2,203 6,868 12,249 - - - - - - 10,871 14,452Total costs 16,626 14,231 15,804 21,373 2,083 2,445 695 1,803 2,125 3,303 37,333 43,155
Rental result 45,558 48,198 26,399 27,580 5,873 4,901 10 (192) 697 445 78,537 80,932Contract result 1,308 1,306 185 (1,109) - - - - - - 1,493 197
Segment result 46,866 49,504 26,584 26,471 5,873 4,901 10 (192) 697 445 80,030 81,129
Gain/(loss) from revaluation/ impairment of assetsInvestmentproperties 27,958 (39,812) 1,811 (56,120) (90) (21,624) (520) (15,104) (1,637) (27,665) 27,522 (160,325)
Residential (1,300) (9,432) - (16,047) - - - (8,600) - - (1,300) (34,079)26,658 (49,244) 1,811 (72,167) (90) (21,624) (520) (23,704) (1,637) (27,665) 26,222 (194,404)
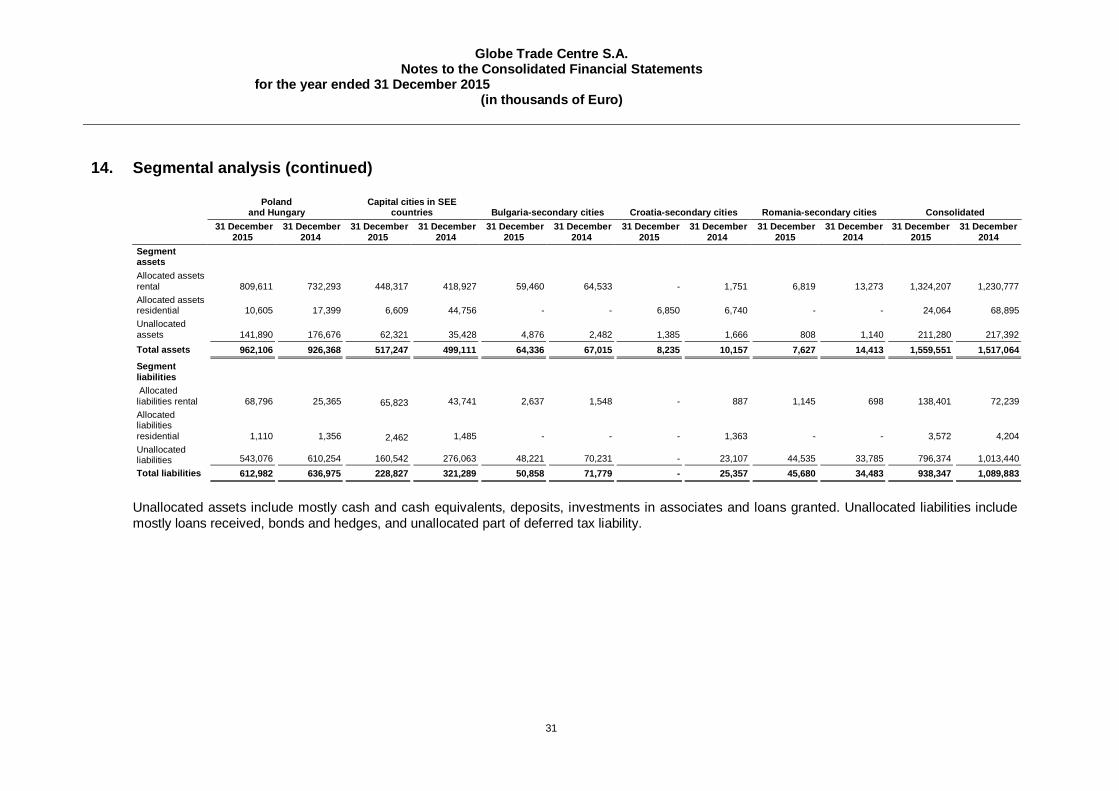
Globe Trade Centre S.A.Notes to the Consolidated Financial Statements
for the year ended 31 December 2015(in thousands of Euro)
31
14. Segmental analysis (continued)
Polandand Hungary
Capital cities in SEEcountries Bulgaria-secondary cities Croatia-secondary cities Romania-secondary cities Consolidated
31 December2015
31 December2014
31 December2015
31 December2014
31 December2015
31 December2014
31 December2015
31 December2014
31 December2015
31 December2014
31 December2015
31 December2014
SegmentassetsAllocated assetsrental 809,611 732,293 448,317 418,927 59,460 64,533 - 1,751 6,819 13,273 1,324,207 1,230,777Allocated assetsresidential 10,605 17,399 6,609 44,756 - - 6,850 6,740 - - 24,064 68,895Unallocatedassets 141,890 176,676 62,321 35,428 4,876 2,482 1,385 1,666 808 1,140 211,280 217,392Total assets 962,106 926,368 517,247 499,111 64,336 67,015 8,235 10,157 7,627 14,413 1,559,551 1,517,064
Segmentliabilities Allocatedliabilities rental 68,796 25,365 65,823 43,741 2,637 1,548 - 887 1,145 698 138,401 72,239Allocatedliabilitiesresidential 1,110 1,356 2,462 1,485 - - - 1,363 - - 3,572 4,204Unallocatedliabilities 543,076 610,254 160,542 276,063 48,221 70,231 - 23,107 44,535 33,785 796,374 1,013,440Total liabilities 612,982 636,975 228,827 321,289 50,858 71,779 - 25,357 45,680 34,483 938,347 1,089,883
Unallocated assets include mostly cash and cash equivalents, deposits, investments in associates and loans granted. Unallocated liabilities includemostly loans received, bonds and hedges, and unallocated part of deferred tax liability.

Globe Trade Centre S.A.Notes to the Consolidated Financial Statements
for the year ended 31 December 2015 (in thousands of Euro)
32
15. Taxation
The major components of tax expense are as follows:
Year ended31 December 2015
Year ended31 December 2014
Current (corporate and capital gain) taxexpense
7,011 2,766
Tax related to previous years (85) (42)Deferred tax expense 5,011 10,144
11,937 12,868
The Group companies pay taxes in the following jurisdictions: Poland, Serbia, Romania,Hungary, Netherlands, Ukraine, Bulgaria, Cyprus, Slovakia and Croatia. The Group doesnot constitute a tax group under local legislation. Therefore, every company in the Group isa separate taxpayer.
The reconciliation between tax expense and accounting profit multiplied by the applicabletax rates is presented below:
Year ended31 December 2015
Year ended31 December 2014
Accounting profit/(loss) before tax 55,576 (194,522)
Taxable expenses (income) at the applicable taxrate in each country of activity 12,506 (41,785)Tax effect of expenses that are not deductible indetermining taxable profit 1,631 2,278Share of profit/(loss) in associates and Jointventures 1,231 5,264Tax effect of foreign currency differences (1,045) (447)Change of tax rate (341) (605)Previous year’s tax (85) (42)Unrecognised deferred tax asset, net (2,077) 48,270Other 117 (65)Tax expense 11,937 12,868

Globe Trade Centre S.A.Notes to the Consolidated Financial Statements
for the year ended 31 December 2015 (in thousands of Euro)
33
15. Taxation (continued)
The components of the deferred tax balance were calculated at a rate applicable when the Company expects to recover or settle the carrying amountof the asset or liability.
Net deferred tax assets comprise the following:
As of 1 January 2014 Credit / (charge) to incomestatement
As of 31 December 2014 Credit / (charge) to incomestatement
As of 31 December 2015
Financial instruments 508 (103) 405 (285) 120Tax loss carried forwards 4,124 (400) 3,724 4,526 8,250Basis differences in non-current assets 735 (1,901) (1,166) 1,166 -Netting (**) (1,215) 497 (718) (7,005) (7,723)Net deferred tax assets 4,152 (1,907) 2,245 (1,598) 647
Net deferred tax liability comprises of the following:
As of1 January 2014
Credit /(charge) to
equity
Foreignexchange
differences
Credit /(charge) to
incomestatement
As of31 December
2014
Credit /(charge) to
equity
Foreignexchange
differences
Credit /(charge) to
incomestatement
As of31 December
2015
Financial instruments (*) (37,315) (2,001) (32) (11,687) (51,035) 85 (65) (412) (51,427)Basis differences in non-current assets (83,841) - - 3,612 (80,229) - - (9,337) (89,566)Other 149 - - 335 484 - - (669) (185)Netting (**) 1,215 - - (497) 718 - - 7,005 7,723Net deferred tax liability (119,792) (2,001) (32) (8,237) (130,062) 85 (65) (3,413) (133,455)
(*) Mostly, unrealized interest and foreign exchange differences,(**) Relate to deferred tax asset on tax losses carried forward

Globe Trade Centre S.A.Notes to the Consolidated Financial Statements
for the year ended 31 December 2015 (in thousands of Euro)
34
15. Taxation (continued)
The enacted tax rates in the various countries were as follows:
Tax rate Year ended 31 December 2015 Year ended 31 December 2014Poland 19% 19%Hungary 10%/19% 10%/19%Ukraine 18% 18%Bulgaria 10% 10%Slovakia 22% 22%Serbia 15% 15%Croatia 20% 20%Russia 20% 20%Romania 16% 16%Cyprus 12.5% 12.5%The Netherlands 25% 25%
Future benefit for deferred tax assets have been reflected in these consolidated financialstatements only if it is probable that taxable profits will be available when timing differencesthat gave rise to such deferred tax asset reverse.
Regulations regarding VAT, corporate income tax and social security contributions aresubject to frequent changes. These frequent changes result in there being little point ofreference and few established precedents that may be followed. The binding regulationsalso contain uncertainties, resulting in differences in opinion regarding the legalinterpretation of tax regulations both between government bodies, and betweengovernment bodies and companies. Tax settlements and other areas of activity (e.g.customs or foreign currency related issues) may be subject to inspection by administrativebodies authorised to impose high penalties and fines, and any additional taxation liabilitiescalculated as a result must be paid together with high interest. The above circumstancesmean that tax exposure is greater in the Group’s countries than in countries that have amore established taxation system.
Tax settlements may be subject to inspections by tax authorities. Accordingly the amountsshown in the financial statements may change at a later date as a result of the finaldecision of the tax authorities.
The Group companies have tax losses carried forward as of 31 December 2015 available inthe amount of Euro 374 million. The expiry dates of these tax losses as of 31 December2015 are as follows: within one year - Euro 19 million, between 2-5 years - Euro 140 million,afterwards – Euro 215 million.

Globe Trade Centre S.A.Notes to the Consolidated Financial Statements
for the year ended 31 December 2015(in thousands of Euro)
35
16. Property, Plant and Equipment
The movement in property, plant and equipment for the periods ended 31 December 2015and 31 December 2014 was as follows:
Equipment Vehicles Total
Gross carrying amountAs of 1 January 2015 2,862 935 3,797Additions 130 50 180Disposals, impairments and other decreases (120) (228) (348)Translation differences - - -As of 31 December 2015 2,872 757 3,629
Accumulated DepreciationAs of 1 January 2015 1,685 632 2,317Charge for the period 410 99 509Disposals, impairments and other decreases (50) (217) (267)Translation differences - - -As of 31 December 2015 2,045 514 2,559
Net book value as of 31 December 2015 827 243 1,070
Gross carrying amountAs of 1 January 2014 3,011 959 3,970Additions 528 144 672Disposals (677) (161) (838)Translation differences - (7) (7)As of 31 December 2014 2,862 935 3,797
Accumulated DepreciationAs of 1 January 2014 1,748 636 2,384Charge for the period 358 141 499Disposals (421) (142) (564)Translation differences - (2) (2)As of 31 December 2014 1,685 632 2,317
Net book value as of 31 December 2014 1,177 303 1,480

Globe Trade Centre S.A.Notes to the Consolidated Financial Statements
for the year ended 31 December 2015(in thousands of Euro)
36
17. Investment Property
Investment properties that are owned by the Group are office and commercial space,including property under construction:
Investment property can be split up as follows:
31 December 2015 31 December 2014
Completed investment property 1,055,732 1,029,276Investment property under construction at fairvalue 108,000 -Investment property under construction at cost 124,797 192,043
Total 1,288,529 1,221,319
The movement in investment property for the periods ended 31 December 2015 and31 December 2014 was as follows:
Level 2 Level 3 Total
Carrying amount as of 1 January 2015 753,576 467,743 1,221,319Capitalised subsequent expenditure 4,489 36,190 40,679Purchase of completed asset 53,080 - 53,080Adjustment to fair value / impairment 1,664 25,341 27,005Disposals of Galeria Kazimiez office (41,577) - (41,577)Sale of subsidiary (Jarosova) - (8,494) (8,494)Reclassified as assets held for sale (*) - (5,950) (5,950)Purchase of subsidiary (Europort Cyprus 1) - 2,467 2,467
Carrying amount as of 31 December 2015 771,232 517,297 1,288,529
Carrying amount as of 1 January 2014 762,355 613,383 1,375,738Reclassification 9,468 (9,468) -Capitalised subsequent expenditure 4,345 16,956 21,301Adjustment to fair value / impairment (18,090) (141,710) (159,800)Disposals - (4,654) (4,654)Reclassified as assets held for sale - (6,654) (6,654)Translation differences and other non-cashadjustments (4,502) (110) (4,612)
Carrying amount as of 31 December 2014 753,576 467,743 1,221,319
(*) It relates to Arad (Romania), Lodz 1 (Poland) and Subotica (Serbia) in secondary cities
Fair value and impairment adjustment consists of the following:
2015 2014
Adjustment to fair value of completed assets 2,546 (104,780)Adjustment to fair value of property under construction 25,828 -Impairment adjustment of IPUC at cost (1,369) (55,020)
Total (*) 27,005 (159,800)
(*) The amount does not include an amount of Euro 606 thousand as fair value adjustment on assets held for sale

Globe Trade Centre S.A.Notes to the Consolidated Financial Statements
for the year ended 31 December 2015(in thousands of Euro)
37
17. Investment Property (continued)
Assumptions used in the valuations of completed assets as of 31 December 2015 andrelated sensitivity analysis are presented below.
Potfolio Book valueNRA
thousand OcupancyActual
rent ERVAverageduration
FairValue
HierarchyLevel
Impact onPBT (*) of 1%
change inERV
‘000 Euro sqm % Euro/ sqm Euro/ sqm YearsPoland retail 150,200 49 90% 19.3 19.7 3.9 2 7,624Poland office 266,436 135 92% 14.3 14.0 2.7 2 19,059Serbia officecapital city 123,600 64 92% 14.7 15.0 2.3 3 8,260Croatia retailcapital city 102,100 36 97% 20.0 21.3 4.7 3 4,793Hungaryoffice capitalcity 208,496 117 95% 11.7 12.0 3.5 2 17,341Romaniaretailsecondarycities 3,900 13 95% 5.7 5.6 5.2 3 696Romaniaoffice capitalcity 146,100 48 93% 19.0 17.4 2.7 2 8,397Bulgariaretailsecondarycities 54,900 61 82% 9.4 9.3 5.0 3 5,931
Total 1,055,732 524 92% 14.3 14.2 3.4
Actual variations in yield or ERV may vary between different markets(*) Profit before tax.
Assumptions used in the valuations of completed assets as of 31 December 2014 andrelated sensitivity analysis are presented below.
Potfolio Book valueNRA
thousand OcupancyActual
rent ERVAverageduration
FairValue
HierarchyLevel
Impact onPBT (*)of 1%
change inERV
‘000 Euro sqm % Euro/ sqm Euro/ sqm YearsPoland retail 150,000 50 86% 20.8 19.0 4.3 2 7,907Poland office 300,711 150 92% 14.7 14.1 3.6 2 21,263Serbia officecapital city 100,200 53 95% 14.7 15.5 3.2 3 6,479Croatia retailcapital city 102,200 36 96% 20.5 22.0 6.4 3 4,645Hungary officecapital city 154,865 91 93% 11.6 12.0 4.6 2 12,913Slovakia officecapital city 9,100 13 65% 9.8 8.6 1.4 3 1,058Romania retailsecondarycities 8,500 45 88% 4.0 4.2 4.5 3 2,033Romaniaoffice capitalcity 148,000 48 93% 19.5 20.0 3.4 2 7,400Bulgaria retailsecondarycities 55,700 61 92% 8.3 9.2 6.4 3 6,069
Total 1,029,276 547 91% 13.8 13.9 4.3
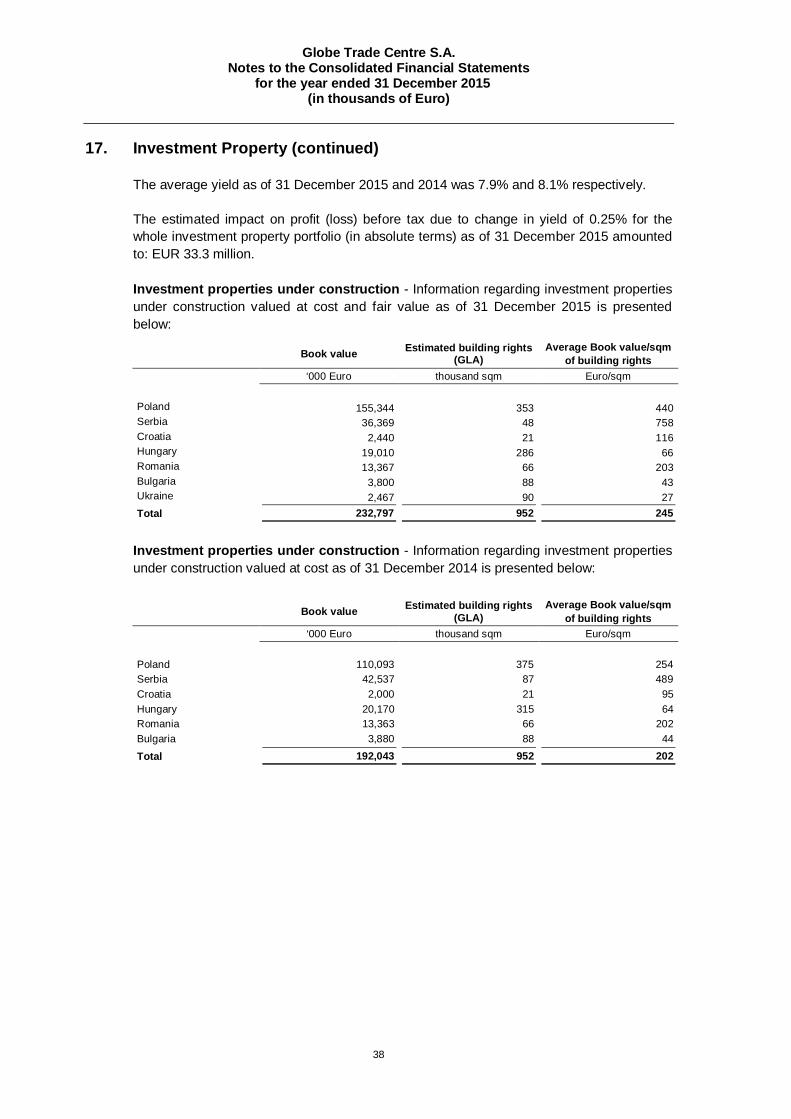
Globe Trade Centre S.A.Notes to the Consolidated Financial Statements
for the year ended 31 December 2015(in thousands of Euro)
38
17. Investment Property (continued)
The average yield as of 31 December 2015 and 2014 was 7.9% and 8.1% respectively.
The estimated impact on profit (loss) before tax due to change in yield of 0.25% for thewhole investment property portfolio (in absolute terms) as of 31 December 2015 amountedto: EUR 33.3 million.
Investment properties under construction - Information regarding investment propertiesunder construction valued at cost and fair value as of 31 December 2015 is presentedbelow:
Book value Estimated building rights(GLA)
Average Book value/sqmof building rights
‘000 Euro thousand sqm Euro/sqm
Poland 155,344 353 440Serbia 36,369 48 758Croatia 2,440 21 116Hungary 19,010 286 66Romania 13,367 66 203Bulgaria 3,800 88 43Ukraine 2,467 90 27Total 232,797 952 245
Investment properties under construction - Information regarding investment propertiesunder construction valued at cost as of 31 December 2014 is presented below:
Book value Estimated building rights(GLA)
Average Book value/sqmof building rights
‘000 Euro thousand sqm Euro/sqm
Poland 110,093 375 254Serbia 42,537 87 489Croatia 2,000 21 95Hungary 20,170 315 64Romania 13,363 66 202Bulgaria 3,880 88 44
Total 192,043 952 202

Globe Trade Centre S.A.Notes to the Consolidated Financial Statements
for the year ended 31 December 2015(in thousands of Euro)
39
18. Inventory and Residential landbank
The movement in residential landbank and inventory for the periods ended 31 December2015 and 31 December 2014 was as follows:
Year ended31 December 2015
Year ended31 December 2014
Carrying amount at the beginning of the period 64,983 121,267Construction and foreign exchange differences 635 564Impairment to net realisable value (1,389) (34,079)Cost of units sold (10,871) (14,452)Sale of subsidiary (728) -Disposal of assets (*) (22,696) (8,317)Carrying amount at the end of the period 29,934 64,983
(*) Disposal of Felicity in 2015
During 2015 a land in Poland in the amount of Euro 2,100 thousand was reclassified fromResidential landbank into inventory.
Completed inventory as of 31 December 2015 consists of the following:
Book value Estimated building rightsGLA
Average Book value/sqmof building rights
‘000 Euro Thousand sqm Euro/sqm
Poland 466 <1 1,333Hungary 59 <1 391Serbia 275 <1 810Slovakia 145 <1 851Romania 116 <1 789Total/Average 1,061 1 917Uncompleted inventory 2,100Total inventory 3,161
Residential landbank and uncompleted inventory as of 31 December 2015 consists of thefollowing:
Book value Estimated building rightsGLA
Average Book value/sqmof building rights
‘000 Euro Thousand sqm Euro/sqm
Poland 2,100 4 525Croatia 6,850 48 143Hungary 7,980 123 65Slovakia 4,500 56 80Romania 7,443 138 54
Total/Average 28,873 369 78

Globe Trade Centre S.A.Notes to the Consolidated Financial Statements
for the year ended 31 December 2015(in thousands of Euro)
40
18. Inventory and Residential landbank (continued)
Completed inventory as of 31 December 2014 consists of the following:
Book value Estimated building rightsGLA
Average Book value/sqmof building rights
‘000 Euro Thousand sqm Euro/sqm
Poland 3,923 3 1,348Hungary 119 <1 745Serbia 275 <1 810Slovakia 173 <1 1,020Romania 19,049 33 572
Total/Average 23,539 37 638
Residential landbank and uncompleted inventory as of 31 December 2014 consists of thefollowing:
Book value Estimated building rightsGLA
Average Book value/sqmof building rights
‘000 Euro Thousand sqm Euro/sqm
Poland 2,100 4 512Croatia 6,700 48 143Hungary 9,431 138 68Slovakia 6,999 68 103Romania 16,214 207 79
Total/Average 41,444 465 89

Globe Trade Centre S.A.Notes to the Consolidated Financial Statements
for the year ended 31 December 2015(in thousands of Euro)
41
19. Investment in associates and Joint ventures
The investment in associates and joint ventures comprises the following:
31 December 2015 31 December 2014
Equity method accounting – associates (1) (8,878) (24,165)Loans granted 26,352 47,018Investment in associates 17,474 22,853Equity method accounting – joint ventures (2) (28,773) 39,896Loans granted 34,366 33,297Investment in joint ventures 5,593 73,193Investment in associates and joint ventures 23,067 96,046
(1) Majority share in company Europort Investment Cyprus 1 was purchased in December 2015 (decrease ofloans granted by EUR 23.7 million and investment by EUR 22.3 million),
(2) Decrease in the amount of Euro 67 million, relates to a joint venture liquidation in 2015
The loans finance investments in those associates. The loans and interest do not havespecified maturity date and are denominated in EUR with the interest based on EURIBORplus margin. The maturity of loans is expected to be over one year.
Summarised financial information of the associates and Joint ventures comprises ofthe following:
31 December 2015 31 December 2014
Non-current assets 176,994 342,304Current assets 9,025 15,072Total assets 186,019 357,376Equity (79,306) 54,428Non-current liabilities 165,509 173,434Current liabilities 99,816 129,514
Total equity and liabilities 186,019 357,376
2015 2014
Rental revenue 12,762 11,263Expenses (12,986) (10,271)Loss from revaluationLoss before taxTax incomeLoss for the year
(9,770)(9,994)
636(9,358)
(63,405)(62,413)
5,800(56,613)
The Group’s share in loss (8,163) (27,568)

Globe Trade Centre S.A.Notes to the Consolidated Financial Statements
for the year ended 31 December 2015(in thousands of Euro)
42
19. Investment in associates and Joint ventures (continued)
Summarised financial information of the material associates interest is presented below:
CID (Harfa mall)As of
31 December 2015As of
31 December 2014
Non-current assets 141,219 156,481Current assets 7,186 1,557Total assets 148,405 158,038Equity (27,598) (25,347)Non-current liabilities 92,730 75,556Current liabilities 83,273 107,829
Total equity and liabilities 148,405 158,038
2015 2014
Rental revenue 8,893 7,110Loss for the year (1,153) (21,220)

Globe Trade Centre S.A.Notes to the Consolidated Financial Statements
for the year ended 31 December 2015(in thousands of Euro)
43
20. Derivatives
The Company holds instruments (IRS and Cap) that hedge the risk involved in fluctuationsof interest rate and currencies rates. The instruments hedge interest on loans for a period of2-5 years
The movement in derivatives for the years ended 31 December 2015 and 31 December2014 was as follows:
31 December 2015 31 December 2014
Fair value as of beginning of the year (6,044) (32,890)
Charged to other comprehensive income 527 10,550Charged to income statements (1,360) (6,102)Disposals/paid 1,928 22,398Fair value as of end of the year (4,949) (6,044)
For more information regarding derivatives, see note 34
21. Trade and other payables
An amount of Euro 11 million of trade creditors and accruals relates to payables due todevelopment activity to be financed mostly by long term loans.
An amount of Euro 18.1 million relates to purchase of non-controlling interest in BCG.
22. Short term deposits
Short-term deposits include deposits related to loan agreements, derivatives, and othercontractual commitments and can be used only for certain operating activities asdetermined by underlying agreements.
23. Cash and cash equivalents
Cash balance consists of cash in banks. Cash at banks earns interest at floating ratesbased on periodical bank deposit rates. Save for minor amount, all cash is deposited inbanks.
All cash and cash equivalents are available for use by the Group.
24. Other expenses
Other expenses relate mainly to perpetual usufruct expenses of landbank, as well asunrecoverable taxes.
25. Deposits from tenants
Deposits from tenants represent amounts deposited by tenants to guarantee theirperformance of their obligations under tenancy agreements.

Globe Trade Centre S.A.Notes to the Consolidated Financial Statements
for the year ended 31 December 2015(in thousands of Euro)
44
26. Long term payables
Long term payables represent long term commitments related with purchase of land anddevelopment of infrastructure.
27. Non-controlling interest
The movement in non-controlling interest and inventory for the periods ended 31 December2015 and 31 December 2014 was as follows:
2015 2014
Balance as of 1 January (62,032) (45,870)Other comprehensive income 144 48Profit /(loss) for the year (1,553) (23,568)Total comprehensive income / (loss) for the period (1,409) (23,520)Purchase of NCI shares (Slovakian Projects) - 7,358Purchase of NCI shares (Galeria Varna) (*) 27,982 -Purchase of NCI shares (Osijek shopping center) (*) 16,663 -Purchase of NCI shares (City Gate) (*) (2,543) -
Balance as of 31 December (21,339) (62,032)
(*) See note 8

Globe Trade Centre S.A.Notes to the Consolidated Financial Statements
for the year ended 31 December 2015(in thousands of Euro)
45
28. Long-term loans and bonds
31 December 2015 31 December 2014
Bonds series 2017-2018 47,847 47,872
Bonds series 2018-2019 69,717 69,735
Loan from OTP (GTC) 11,008 -
Loan from WBK (Globis Poznan) 14,407 14,914
Loan from WBK (Korona Business Park) 42,319 41,877
Loan from Pekao (Globis Wroclaw) 24,692 25,415
Loan from ING (Nothus) 11,570 13,232
Loan from ING (Zephirus) 11,570 13,232
Loan from Berlin Hyp (Corius) 11,874 12,295
Loan from Peko (Galeria Polnocna) 4,519 -
Loan from WBK (Kazimierz office) - 27,369
Loan from Pekao (Galeria Jurajska) 98,010 101,203
Loan from Berlin Hyp (UBP) 18,639 19,035
Loan from ING (Francuska office Centre) 23,737 16,277
Loan from MKB (Centre Point I) 18,401 20,001
Loan from MKB (Centre Point II) 22,199 23,825
Loan from CIB (Metro) 18,630 19,573
Loan from Erste (Spiral) 27,146 -
Loan from MKB (Spiral) - 21,992
Loan from Erste (White House) 2,859 3,859
Loan from MKB (Sasad Resort) 8,327 8,327
Loan from EBRD and Raiffeisen Bank (GTC House) 9,400 11,100
Loan from Erste (19 Avenue) 21,707 22,277
Loan from EBRD and Raiffeisen Bank (GTC Square) 13,760 15,685
Loan from Raiffeisen Bank (Forty one 1) 9,500 -
Loan from Unicredit (Felicity) - 25,563
Loan from RZBR (Rose Garden) - 2,987
Loan from Erste (City Gate) 86,544 88,782
Loan from EBRD and Raiffeisen Bank (Galeria Piatra) 5,042 5,778
Loan from EBRD and Raiffeisen Bank (Galeria Arad) 24,293 27,575
Loan from MKB and Zagrabecka Banka (Avenue Mall Zagreb) 21,220 25,674
Loan from EBRD and Raiffeisen Bank Austria (Osijek) - 15,750
Loan from MKB and OTP (Galeria Varna) - 17,904
Loan from EBRD and Unicredit (Galeria Stara Zagora) 15,799 22,799
Loan from EBRD (Galeria Burgas) 23,006 25,356
Loan from VUB Bank (Jarosova) - 3,475
Loans from minorities in subsidiaries and from joint ventures 27,047 118,268
Deferred issuance debt expenses (5,677) (6,815)
739,112 922,191

Globe Trade Centre S.A.Notes to the Consolidated Financial Statements
for the year ended 31 December 2015(in thousands of Euro)
46
28. Long-term loans and bonds (continued)
Long-term loans and bonds have been separated into the current portion and the long-termportion as disclosed below:
31 December 2015 31 December 2014
Current portion of long term loans and bonds:Bonds series 2017-2018 915 949
Bonds series 2018-2019 680 711
Loan from OTP (GTC) 3,145 -
Loan from WBK (Globis Poznan) 14,407 507
Loan from WBK (Korona Business Park) 1,166 1,053
Loan from Berlin Hyp (UBP) 397 397
Loan from Pekao (Galeria Jurajska) 3,388 3,197
Loan from Pekao (Globis Wroclaw) 769 724
Loan from ING (Nothus) 746 662
Loan from ING (Zephirus) 746 662
Loan from Berlin Hyp (Corius) 469 421
Loan from WBK (Kazimierz office) - 634
Loan from ING (Francuska office Centre) 540 540
Loan from MKB (Centre Point I) 1,700 1,600
Loan from MKB (Centre Point II) 1,626 1,626
Loan from Erste (White House) 1,000 1,000
Loan from MKB (Sasad Resort) 8,327 8,327
Loan from CIB (Metro) 983 943
Loan from Erste (Spiral) 1,254 -
Loan from MKB (Spiral) - 1,191
Loan from EBRD and Raiffeisen Bank (GTC House) 750 1,700
Loan from Erste (19 Avenue) 569 569
Loan from EBRD and Raiffeisen Bank (GTC Square) 2,060 1,926
Loan from Raiffeisen Bank (Forty one 1) 264 -
Loan from EBRD and Unicredit (Galeria Stara Zagora) 8,900 22,799
Loan from MKB and OTP (Galeria Varna) - 918
Loan from EBRD (Galeria Burgas) 1,424 1,150
Loan from MKB and Zagrabecka Banka (Avenue Mall Zagreb) 4,454 4,454
Loan from EBRD and Raiffeisen Bank Austria (Osijek) - 964
Loan from EBRD and Raiffeisen Bank (Galeria Piatra) 2,613 -
Loan from EBRD and Raiffeisen Bank (Galeria Arad) 12,587 27,575
Loan from Erste (City Gate) 2,306 3,237
Loan from RZBR (Rose Garden) - 2,987
Loan from Unicredit (Felicity) - 25,563
Loan from VUB Bank (Jarosova) - 574
Loans from minorities in subsidiaries 2,183 -
80,368 119,560

Globe Trade Centre S.A.Notes to the Consolidated Financial Statements
for the year ended 31 December 2015(in thousands of Euro)
47
28. Long-term loans and bonds (continued)
31 December 2015 31 December 2014
Long term portion of long term loans and bonds:Bonds series 2017-2018 46,932 46,923
Bonds series 2018-2019 69,037 69,024
Loan from OTP (GTC) 7,863 -
Loan from WBK (Globis Poznan) - 14,407
Loan from WBK (Korona Business Park) 41,153 40,824
Loan from Pekao (Globis Wroclaw) 23,923 24,691
Loan from ING (Nothus) 10,824 12,570
Loan from ING (Zephirus) 10,824 12,570
Loan from Berlin Hyp (Corius) 11,405 11,874
Loan from Peko (Galeria Polnocna) 4,519 -
Loan from WBK (Kazimierz office) - 26,735
Loan from Pekao (Galeria Jurajska) 94,622 98,006
Loan from Berlin Hyp (UBP) 18,242 18,638
Loan from ING (Francuska office Centre) 23,197 15,737
Loan from MKB (Centre Point I) 16,701 18,401
Loan from MKB (Centre Point II) 20,573 22,199
Loan from CIB (Metro) 17,647 18,630
Loan from Erste (Spiral) 25,892 -
Loan from MKB (Spiral) - 20,801
Loan from Erste (White House) 1,859 2,859
Loan from EBRD and Raiffeisen Bank (GTC House) 8,650 9,400
Loan from Erste (19 Avenue) 21,138 21,708
Loan from EBRD and Raiffeisen Bank (GTC Square) 11,700 13,759
Loan from Raiffeisen Bank (Forty one 1) 9,236 -
Loan from Erste (City Gate) 84,238 85,545
Loan from EBRD and Raiffeisen Bank (Galeria Piatra) 2,429 5,778
Loan from EBRD and Raiffeisen Bank (Galeria Arad) 11,706 -
Loan from MKB and Zagrabecka Banka (Avenue Mall Zagreb) 16,766 21,220
Loan from EBRD and Raiffeisen Bank Austria (Osijek) - 14,786
Loan from MKB and OTP (Galeria Varna) - 16,986
Loan from EBRD (Galeria Burgas) 21,582 24,206
Loan from EBRD and Unicredit (Galeria Stara Zagora) 6,899 -
Loan from VUB Bank (Jarosova) - 2,901
Loans from minorities in subsidiaries and from joint ventures 24,864 118,268
Deferred issuance debt expenses (5,677) (6,815)
658,744 802,631

Globe Trade Centre S.A.Notes to the Consolidated Financial Statements
for the year ended 31 December 2015(in thousands of Euro)
48
28. Long-term loans and bonds (continued)
As securities for the bank loans, the banks have mortgage over the assets and security depositstogether with assignment of the associated receivables and insurance rights.
In its financing agreements with banks, the Company undertakes to comply with certain financialcovenants that are listed in those agreements; the main covenants are: maintaining a Loan-to-Value and Debt Service Coverage ratios in the company that holds the project.
In addition, substantially, all investment properties and IPUC that were financed by a lender havebeen pledged to secure the long-term loans from banks. Unless otherwise stated, fair value of thepledged assets exceeds the carrying value of the related loans.
All bank loans except of loan granted to Spiral are nominated in Euro and bonds are nominated inPLN.
As of 31 December 2015, there were no breach of loan covenants.
For information regarding maturity dates and hedges on loans, see note 34.

Globe Trade Centre S.A.Notes to the Consolidated Financial Statements
for the year ended 31 December 2015(in thousands of Euro)
49
29. Capital and Reserves
As at 31 December 2015, the shares structure was as follows:
Number of Shares Share series Total value Total valuein PLN in euro
139,286,210 A 13,928,621 3,153,995
1,152,240 B 115,224 20,253
235,440 B1 23,544 4,443
8,356,540 C 835,654 139,648
9,961,620 D 996,162 187,998
39,689,150 E 3,968,915 749,022
3,571,790 F 357,179 86,949
17,120,000 G 1,712,000 398,742
100,000,000 I 10,000,000 2,341,372
31,937,298 J 3,193,729 766,525
108,906,190 K 10,890,619 2,561,293
460,216,478 46,021,647 10,410,240
All shares are entitled to the same rights.
Shareholders who as at 31 December 2015 held above 5% of the Company shares wereas follows:
• LSREF III• AVIVA OFE BZ WBK• OFE PZU
The statutory financial statements of GTC S.A are prepared in accordance with PolishAccounting Standards. Dividends may be distributed based on the net profit reported in thestandalone annual financial statements prepared for statutory purposes.
On 23 April 2015, the Company held an ordinary shareholders meeting. The ordinaryshareholders meeting decided that the loss for the year 2014 presented in the financialstatements of Globe Trade Centre S.A. prepared in accordance with the Polish AccountingStandards shall be presented under Retained earnings.
Reserves are created based on provisions of the Polish Code of commercial companies.

Globe Trade Centre S.A.Notes to the Consolidated Financial Statements
for the year ended 31 December 2015(in thousands of Euro)
50
30. Phantom shares
Phantom shares
Certain key management personnel of the Company are entitled to specific paymentsresulting from phantom shares in the Company (the “Phantom Shares”).
The Phantom Shares grant to the entitled persons a right for a settlement fromthe Company in the amount equal to the difference between the average closing price forthe Company’s shares on the Warsaw Stock Exchange during the 30-day period prior tothe date of delivery to the Company of the exercise notice, and settlement price (“strike”)amount per share (adjustable for dividend). The Phantom Shares are not securitiesconvertible or exchangeable into shares in the Company, in particular, they are not optionson such shares. The Phantom Shares are merely a means of calculation of deferredvariable compensation of the entitled persons, which depends on the future market price ofthe shares on the regulated market. The Phantom Shares (as presented in belowmentioned table) have been accounted for based on future cash settlement.
The Phantom shares (as presented in below mentioned table) have been accounted forbased on future cash settlement.
Strike (PLN) Blocked Vested Total
8.22 - 724,100 724,100 7.09 5,171,200 512,000 5,683,200
Total 5,171,200 1,236,100 6,407,300
The income/(expenses) recognized during the period is shown below:
2015 2014
Income (expenses) arising from cash settled sharebased payments (863) 2,570
As at 31 December 2015, phantom shares issued were as follows:
Last exercise date Strike (in PLN) Number of phantomshares
30/06/2016 8.22 724,100
31/05/2018 7.09 1,536,000
30/06/2019 7.09 4,147,200
Total 6,407,300

Globe Trade Centre S.A.Notes to the Consolidated Financial Statements
for the year ended 31 December 2015(in thousands of Euro)
51
31. Earnings per share
Basic earnings per share were calculated as follows:
Year ended31 December 2015
Year ended31 December 2014
Profit / (loss) for the period attributable to equityholders (euro) 45,192,000 (183,822,000)Weighted average number of shares for calculatingbasic earnings per share 371,301,287 349,822,797
Basic earnings per share (euro) 0.12 (0.53)
There have been no potentially dilutive instruments as at 31 December 2015 and31 December 2014.
32. Related party transactions
The company provides asset management services to subsidiaries within Lone Star group,which own real estate projects.
Transactions with the related parties are arm’s length transactions.
The transactions and balances with related parties are presented below:
Year ended31 December 2015
Year ended31 December 2014
TransactionAsset management services 476 -Interest income from associates and JointVentures 2,999 2,730BalancesLoans granted to associates 26,352 47,018Loans granted to joint ventures 34,366 33,297Loans from Joint ventures - 62,426
Management and Supervisory Board remuneration (including severance payment to theCompany’s former Management board members) for the year ended 31 December 2015,amounted to EUR 1.6 million, and 512,000 phantom shares were vested. Management andSupervisory Board remuneration for the year ended 31 December 2014, amounted toEUR 2.9 million, and 1,345,542 phantom shares were vested.

Globe Trade Centre S.A.Notes to the Consolidated Financial Statements
for the year ended 31 December 2015(in thousands of Euro)
52
33. Commitments, contingent liabilities and Guarantees
Investment properties in secondary cities
In certain real estate markets in which the Company is active, including especially non-capital cities of SEE, there are indications of slower than expected recovery and revival ofdemand, as well as absence of liquidity and transactions, resulting in a lack of clarity anduncertainty as to estimated rental values, yields and property values. There are alsomarkets with rising vacancies due to oversupply of real estate product and lack ofeconomic growth that would create appropriate demand. Therefore property values aregoing through a period of increased volatility.
Commitments
As of 31 December 2015 (31 December 2014), the Group had commitments contracted forin relation to future building construction without specified date, amounting to Euro 158million (Euro 8 million). These commitments are expected to be financed from availablecash and current financing facilities, other external financing or future instalments underalready contracted sale agreements and yet to be contracted sale agreements.
Guarantees
GTC gave guarantees to third parties in order to secure construction cost-overruns andloans to its subsidiaries. As of 31 December 2015 and 31 December 2014, the guaranteesgranted amounted to Euro 74 million and Euro 149 million, respectively. Additionally, inconnection with the sale of its assets, the Company gave typical warranties under the saleagreements, which are limited in time and amount. The risk involved in above warranties isvery low.
Croatia
In relation to the Marlera Golf project in Croatia, part of the land is held on a lease basisfrom the State. There is furthermore a Consortium agreement with the Ministry of Tourismof Croatia (Ministry) which includes a deadline for the completion of a golf course that haspassed in 2014. The Company has taken active steps to achieve an extension of the periodfor completing the project. In February 2014, the Company received a draft amendmentfrom the Ministry expressing its good faith and intentions to prolong the abovementionedtimeline however the amendment was not formalized. At the end of 2015 parliamentaryelections were held in Croatia and in January 2016 a new Government was appointed. TheCompany has formally approached the new Minister of Tourism with a request to formalizethe amendment to the Consortium agreement however the extension is no longer at thesole discretion of the Group. As a result, the Management has decided to revalue thefreehold asset in assuming no development of the golf course project. As of 31 December2015 the book value of the investment in Marlera was assessed by an independent valuerat Euro 6.9 million and is assumed to be fully recoverable.

Globe Trade Centre S.A.Notes to the Consolidated Financial Statements
for the year ended 31 December 2015(in thousands of Euro)
53
33. Commitments, contingent liabilities and Guarantees (continued)
Russia
As of 31 December 2015, the Group holds 50% interest in Yatelsis, which indirectly ownsland and buildings in St. Petersburg, Russia.
During the last year, the economic and political uncertainty in Russia remained high. Themarket uncertainty created an unclear view as for potential future development of the St.Petersburg project and availability of reliable information related to such project. TheGroup's balance sheet exposure to St. Petersburg amounted to approximately Euro 4.6million. The above mentioned events could adversely impact the results and financialposition of the Group and its St. Petersburg investments in a manner that could not beestimated at this stage.
34. Financial instruments and risk management
The Group’s principal financial instruments comprise bank and shareholders’ loans, hedginginstruments, trade payables and other long-term financial liabilities. The main purpose ofthese financial instruments is to raise finance for the Group’s operations. The Group hasvarious financial assets such as trade receivables, loans granted, derivatives and cash andshort-term deposits.
The main risks arising from the Group’s financial instruments are cash flow interest risk,liquidity risk, foreign currency risk and credit risk.
Interest rate risk
The Group exposure to changes in interest rates which are not offset by hedge relatesprimarily to the Group's long-term debt obligations and loans granted.
The Group’s policy is to obtain finance bearing variable interest rate. To manage theinterest rate risk in a cost-efficient manner, the Group enters into interest rate swaps or captransactions.
The majority of the Company’s loans are nominated or swapped into Euro.
A 50bp change in Euribor rate would lead to Euro 1,115 thousand change in profit (loss)before tax.
Foreign currency risk
The group enters into transactions in currencies other than the Group's functional currency.Therefore it hedges the currency risk by either matching the currency of the inflow, outflowand cash and cash equivalent with that of the expenditures.

Globe Trade Centre S.A.Notes to the Consolidated Financial Statements
for the year ended 31 December 2015(in thousands of Euro)
54
34. Financial instruments and risk management (continued)
The table below presents the sensitivity of profit (loss) before tax due to change in foreignexchange:
2015 2014PLN/Euro PLN/Euro
+10% +5% -5% -10% +10% +5% -5% -10%Cash and cashequivalents 5,588 2,794 (2,794) (5,588) 2,878 1,439 (1,439) (2,878)Trade and otherreceivables 662 331 (331) (662) 214 106 (106) (214)Trade and otherpayables (1,598) (779) 779 1,598 (558) (279) 279 558Bonds (11,756) (5,588) 5,588 11,756 (11,594) (5,797) 5,797 11,594
Exposure to other currencies and other positions in statement of financial position are notmaterial.
Credit risk
Credit risk is the risk that a party to a financial instrument will fail to discharge an obligation.To manage this risk the Group periodically assesses the financial viability of its customers.The Group does not expect any counter parties to fail in meeting their obligations.The Group has no significant concentration of credit risk with any single counterparty orGroup counterparties.
With respect to trade receivables and other receivables that are neither impaired nor pastdue, there are no indications as of the reporting date that those will not meet their paymentobligations.
With respect to credit risk arising from the other financial assets of the Company, whichcomprise cash and cash equivalents and blocked deposits the Company’s exposure tocredit risk equals to the carrying amount of these instruments.
The maximum exposure to credit risk as of the reporting date is the full amount presented.
There are no material financial assets as of the reporting dates, which are overdue and notimpaired. There are no significant financial assets impaired.
Liquidity risk
As at 31 December 2015, the Company holds Cash and Cash Equivalent (as defined inIFRS) in the amount of approximately EUR 169 million. As described above, The Companyattempts to efficiently manage all its liabilities and is currently reviewing its funding plansrelated to: (i) debt servicing of its existing assets portfolio; (ii) capex; and (iii) developmentof commercial properties. Such funding will be sourced through available cash, operatingincome, sales of assets and refinancing. The Management Board believes that based on itscurrent assumptions, the Company will be able to settle all its liabilities for at least the nexttwelve months.

Globe Trade Centre S.A.Notes to the Consolidated Financial Statements
for the year ended 31 December 2015(in thousands of Euro)
55
34. Financial instruments and risk management (continued)
Repayments of long-term debt and interest are scheduled as follows (Euro million):
31 December2015
31 December2014
First year 100 139
Second year 165 76
Third year 119 172
Fourth year 176 134Fifth year 150 179Thereafter 87 302
797 1,002
The above table does not contain payments relating to derivative instruments. The Grouphedges significant parts of the interest risk related to floating interests rate with derivativeinstruments.
All derivative instruments mature within 2-5 years from the balance sheet date.
Fair Value
As of 31 December 2015 and 2014, all loans bear floating interest rate (however, as of31 December 2015 and 2014, 58% and 41% of loans are hedged). Therefore, the fair valueof the loans which is related to the floating component of the interest equals to the marketrate.
Fair value of all other financial assets/liabilities equals to carrying value.
For fair value of investment property please refer to note 17.
Fair value hierarchy
As at 31 December 2015, the Group held several hedge instruments carried at fair value onthe statement of financial position.
The Group uses the following hierarchy for determining and disclosing the fair value offinancial instruments by valuation technique:
Level 1: quoted (unadjusted) prices in active markets for identical assets or liabilities,
Level 2: other techniques for which all inputs which have a significant effect on the recordedfair value are observable, either directly or indirectly,
Level 3: techniques which use inputs that have a significant effect on the recorded fair valuethat are not based on observable market data.
Valuations of hedges are considered as level 2 fair value measurements. During the yearended 31 December 2015 and 31 December 2014, there were no transfers betweenLevel 1 and Level 3 fair value measurements.

Globe Trade Centre S.A.Notes to the Consolidated Financial Statements
for the year ended 31 December 2015(in thousands of Euro)
56
34. Financial instruments and risk management (continued)
Price risk
The Group is exposed to fluctuations of in the real estate markets in which it operates.These can have an effect on the Company’s results.
Capital management
The primary objective of the Group’s capital management is to ensure capital preservationand maintaining healthy capital ratios in order to support its business and maximiseshareholder value.
The Group manages its capital structure and makes adjustments to it, in light of changes ineconomic conditions. To maintain or adjust the capital structure, the Group decides onleverage policy, repayment of loans, investment or divestment of assets, dividend policyand the need, if any, to issue new shares.
No changes were made in the objectives, policies or processes during the years ended31 December 2015 and 31 December 2014.
The Company monitors its gearing ratio, which is Gross Debt less Cash & Deposits (asdefined in IFRS) divided by its investment in real estate. The Company’s policy is tomaintain the gearing ratio at the level of around 50%.
31 December 2015 31 December 2014
(1) Loans, net of cash and deposits (*) 521,559 697,970(2) Investment properties, inventory and assets held for sale 1,324,413 1,292,956Gearing ratio [(1)/(2)] 39.4% 54.0%
(*) Excluding loans from joint ventures and minorities and deferred issuance debt expenses.

Globe Trade Centre S.A.Notes to the Consolidated Financial Statements
for the year ended 31 December 2015(in thousands of Euro)
57
35. Material non-controlling interest
Summarised financial information of the material non-controlling interest as of 31 December2015 is presented below:
Avenue Mall Burgas StaraZagora
GTCUkraine
(*)
Non-coreresidentialprojects
Total
Non-current assets 102,189 42,030 13,324 1,203 14,293 173,039
Current assets 2,310 3,322 2,881 55 2,735 11,303
Total assets 104,499 45,352 16,205 1,258 17,028 184,342
Equity 60,998 (9,469) (63,749) (26,384) (64,545) (103,149)
Non-current liabilities 37,355 52,183 69,458 27,622 78,618 265,236
Current liabilities 6,146 2,638 10,496 20 2,955 22,255
Total equity and liabilities 104,499 45,352 16,205 1,258 17,028 184,342
Revenue 10,501 5,611 2,382 - 5,149 23,643Profit /(loss) for the year 3,602 3,153 (5,677) (5,521) (3,491) (7,934)NCI share in equity 18,304 (1,894) (15,937) (2,290) (19,521) (21,339)NCI share in profit / (loss) 1,081 631 (1,419) (552) (1,293) (1,553)
(*) NCI was purchased for Euro 1 in January 2016
36. Subsequent events
In January 2016, the Company purchased Pixel office building in Poznan, Poland forEUR 32 million. The office building is entirely leased to renowned tenants. The Companyintends to hold the office building as part of the income-producing portfolio of the GTCGroup. The purchase of the Property was financed by the Company’s own sources anda bank loan.

Globe Trade Centre S.A.Notes to the Consolidated Financial Statements
for the year ended 31 December 2015(in thousands of Euro)
58
37. Approval of the financial statements
The financial statements were authorised for issue by the Management Board on 16 March2016.