Considering Brand in a Data-Driven Company
31
Considering “Brand” in a Data-Driven Company Talia Fisher Director of Product & UX Ben Gelinas Digital Creative Director
-
Upload
firstmark-capital -
Category
Technology
-
view
477 -
download
0
Transcript of Considering Brand in a Data-Driven Company
Considering “Brand” in a Data-Driven Company
Talia Fisher Director of Product & UX
Ben Gelinas Digital Creative Director
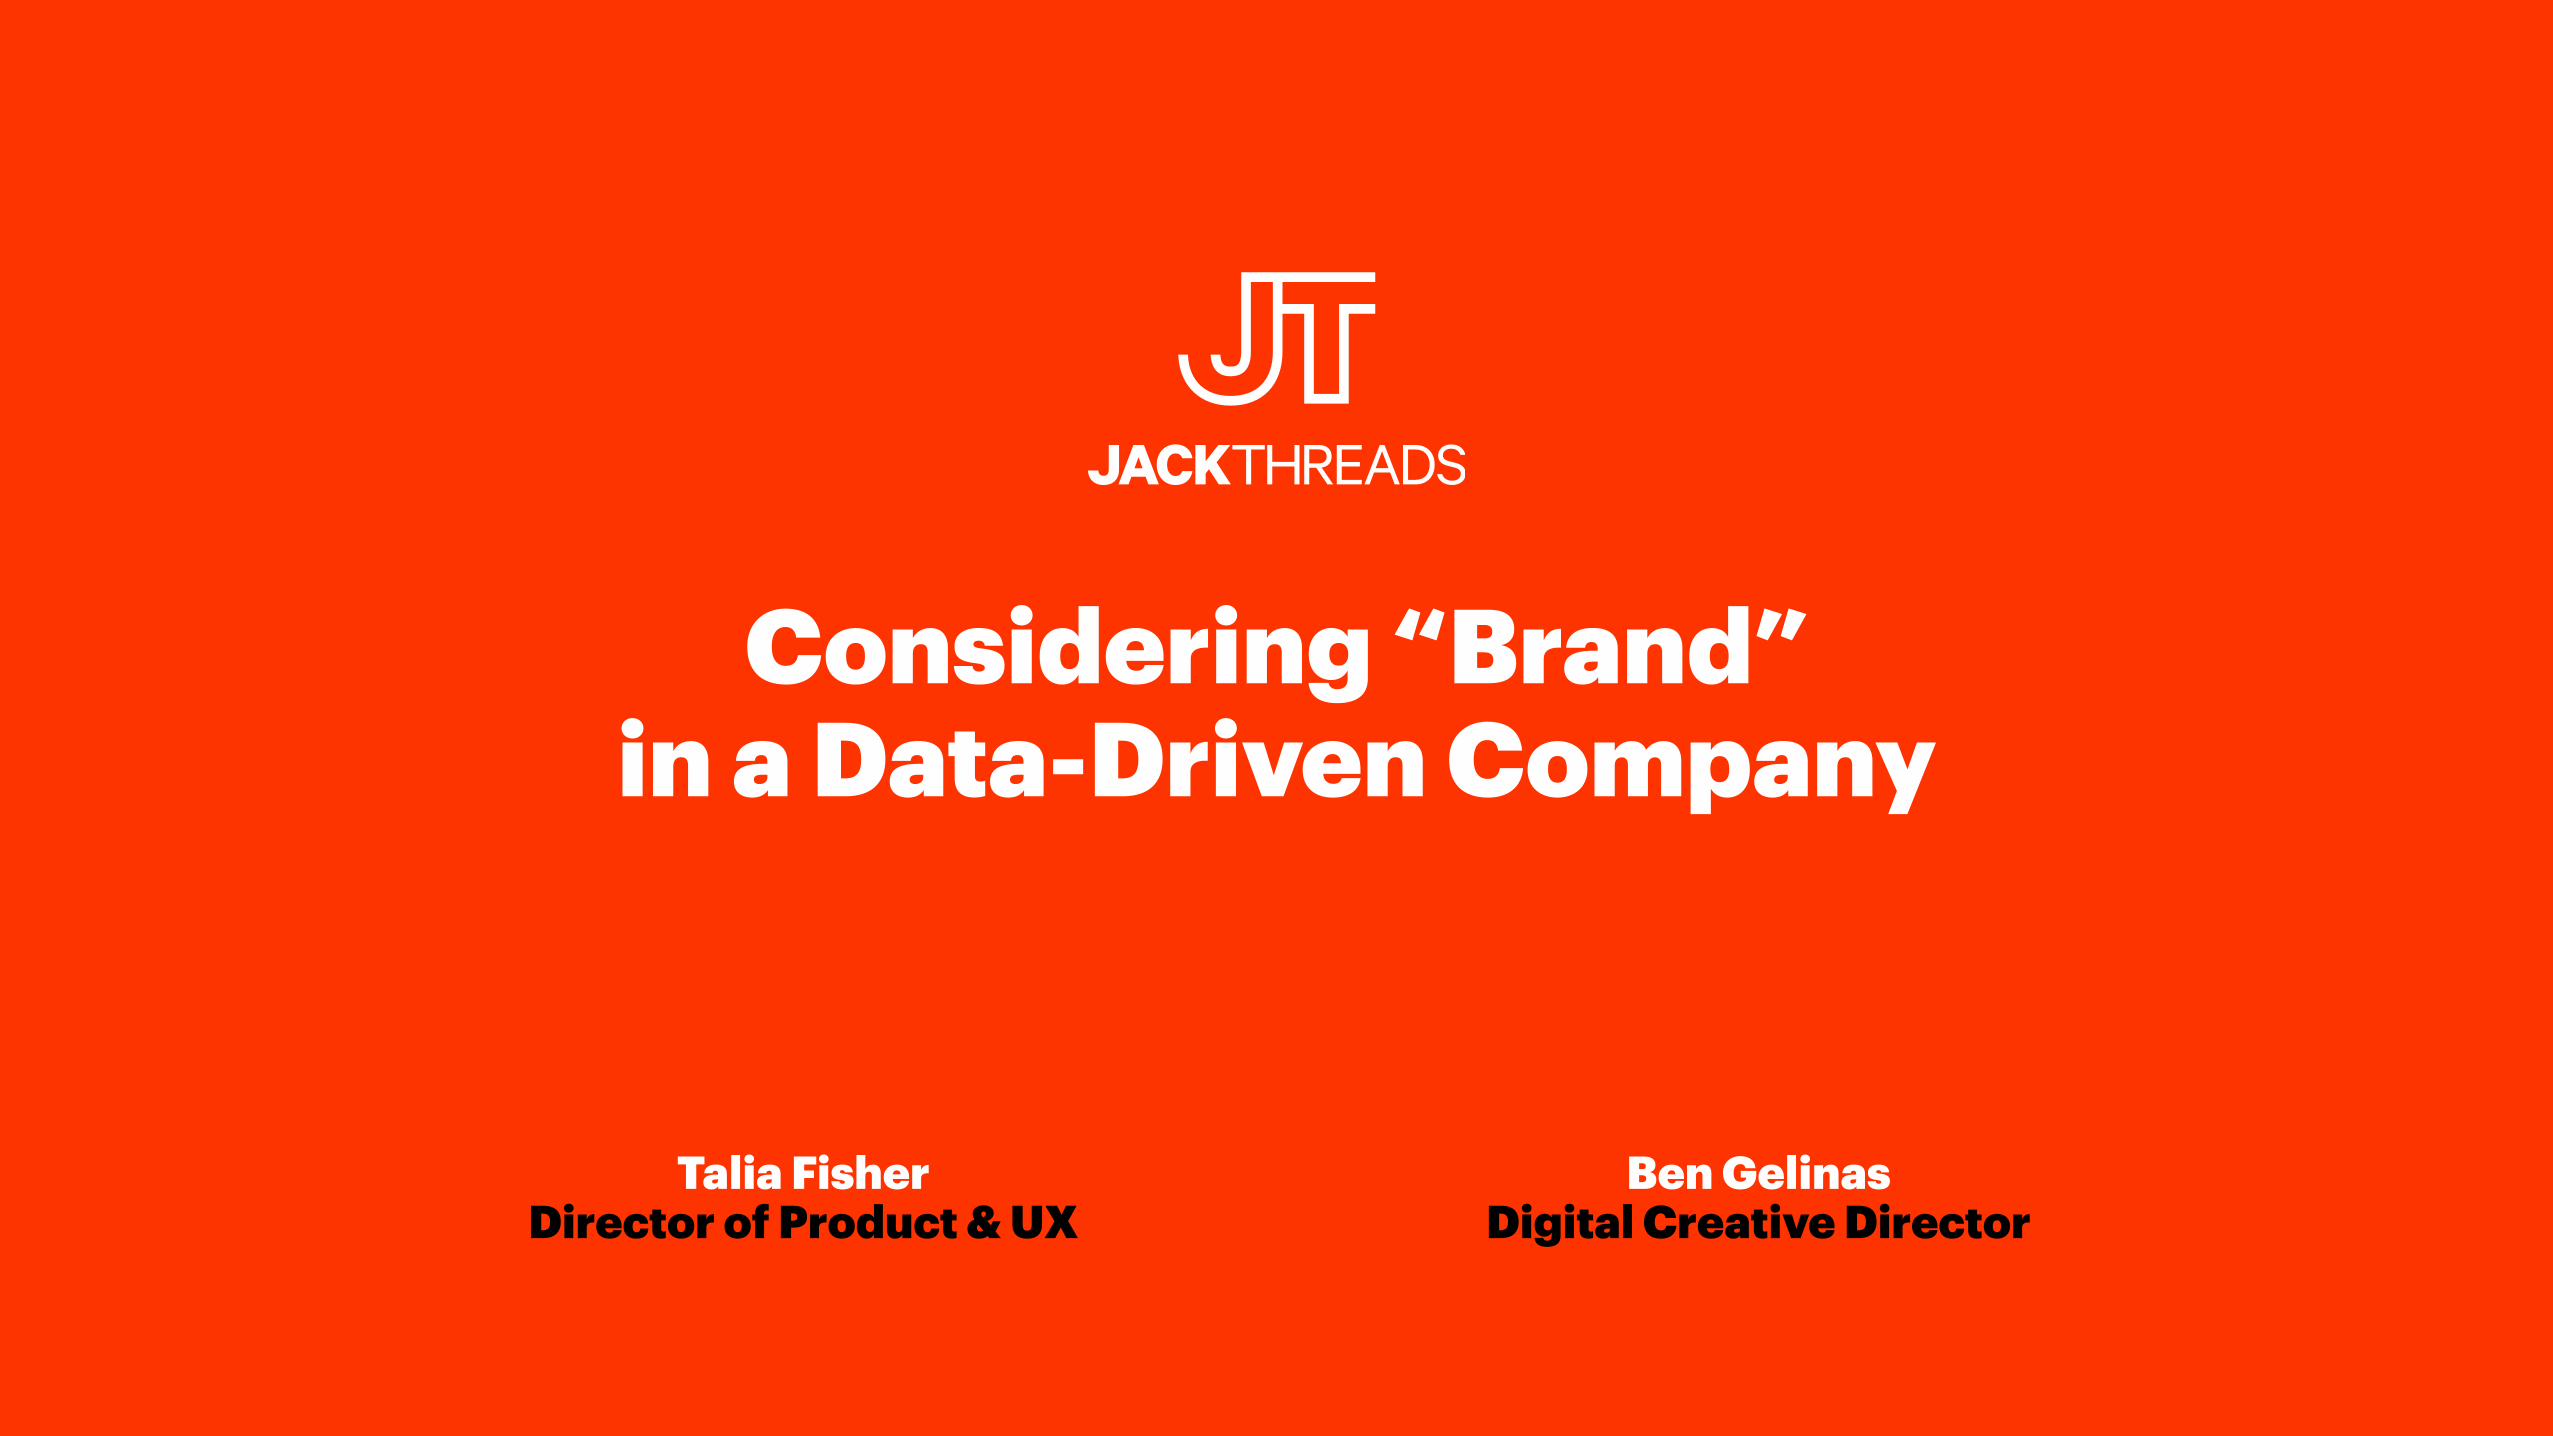
Old JackThreads Flash Retail
Data obsessed A/B test everything
Optimized Site by the minute Hourly/Daily Revenue Goals

Data > Insights > Design

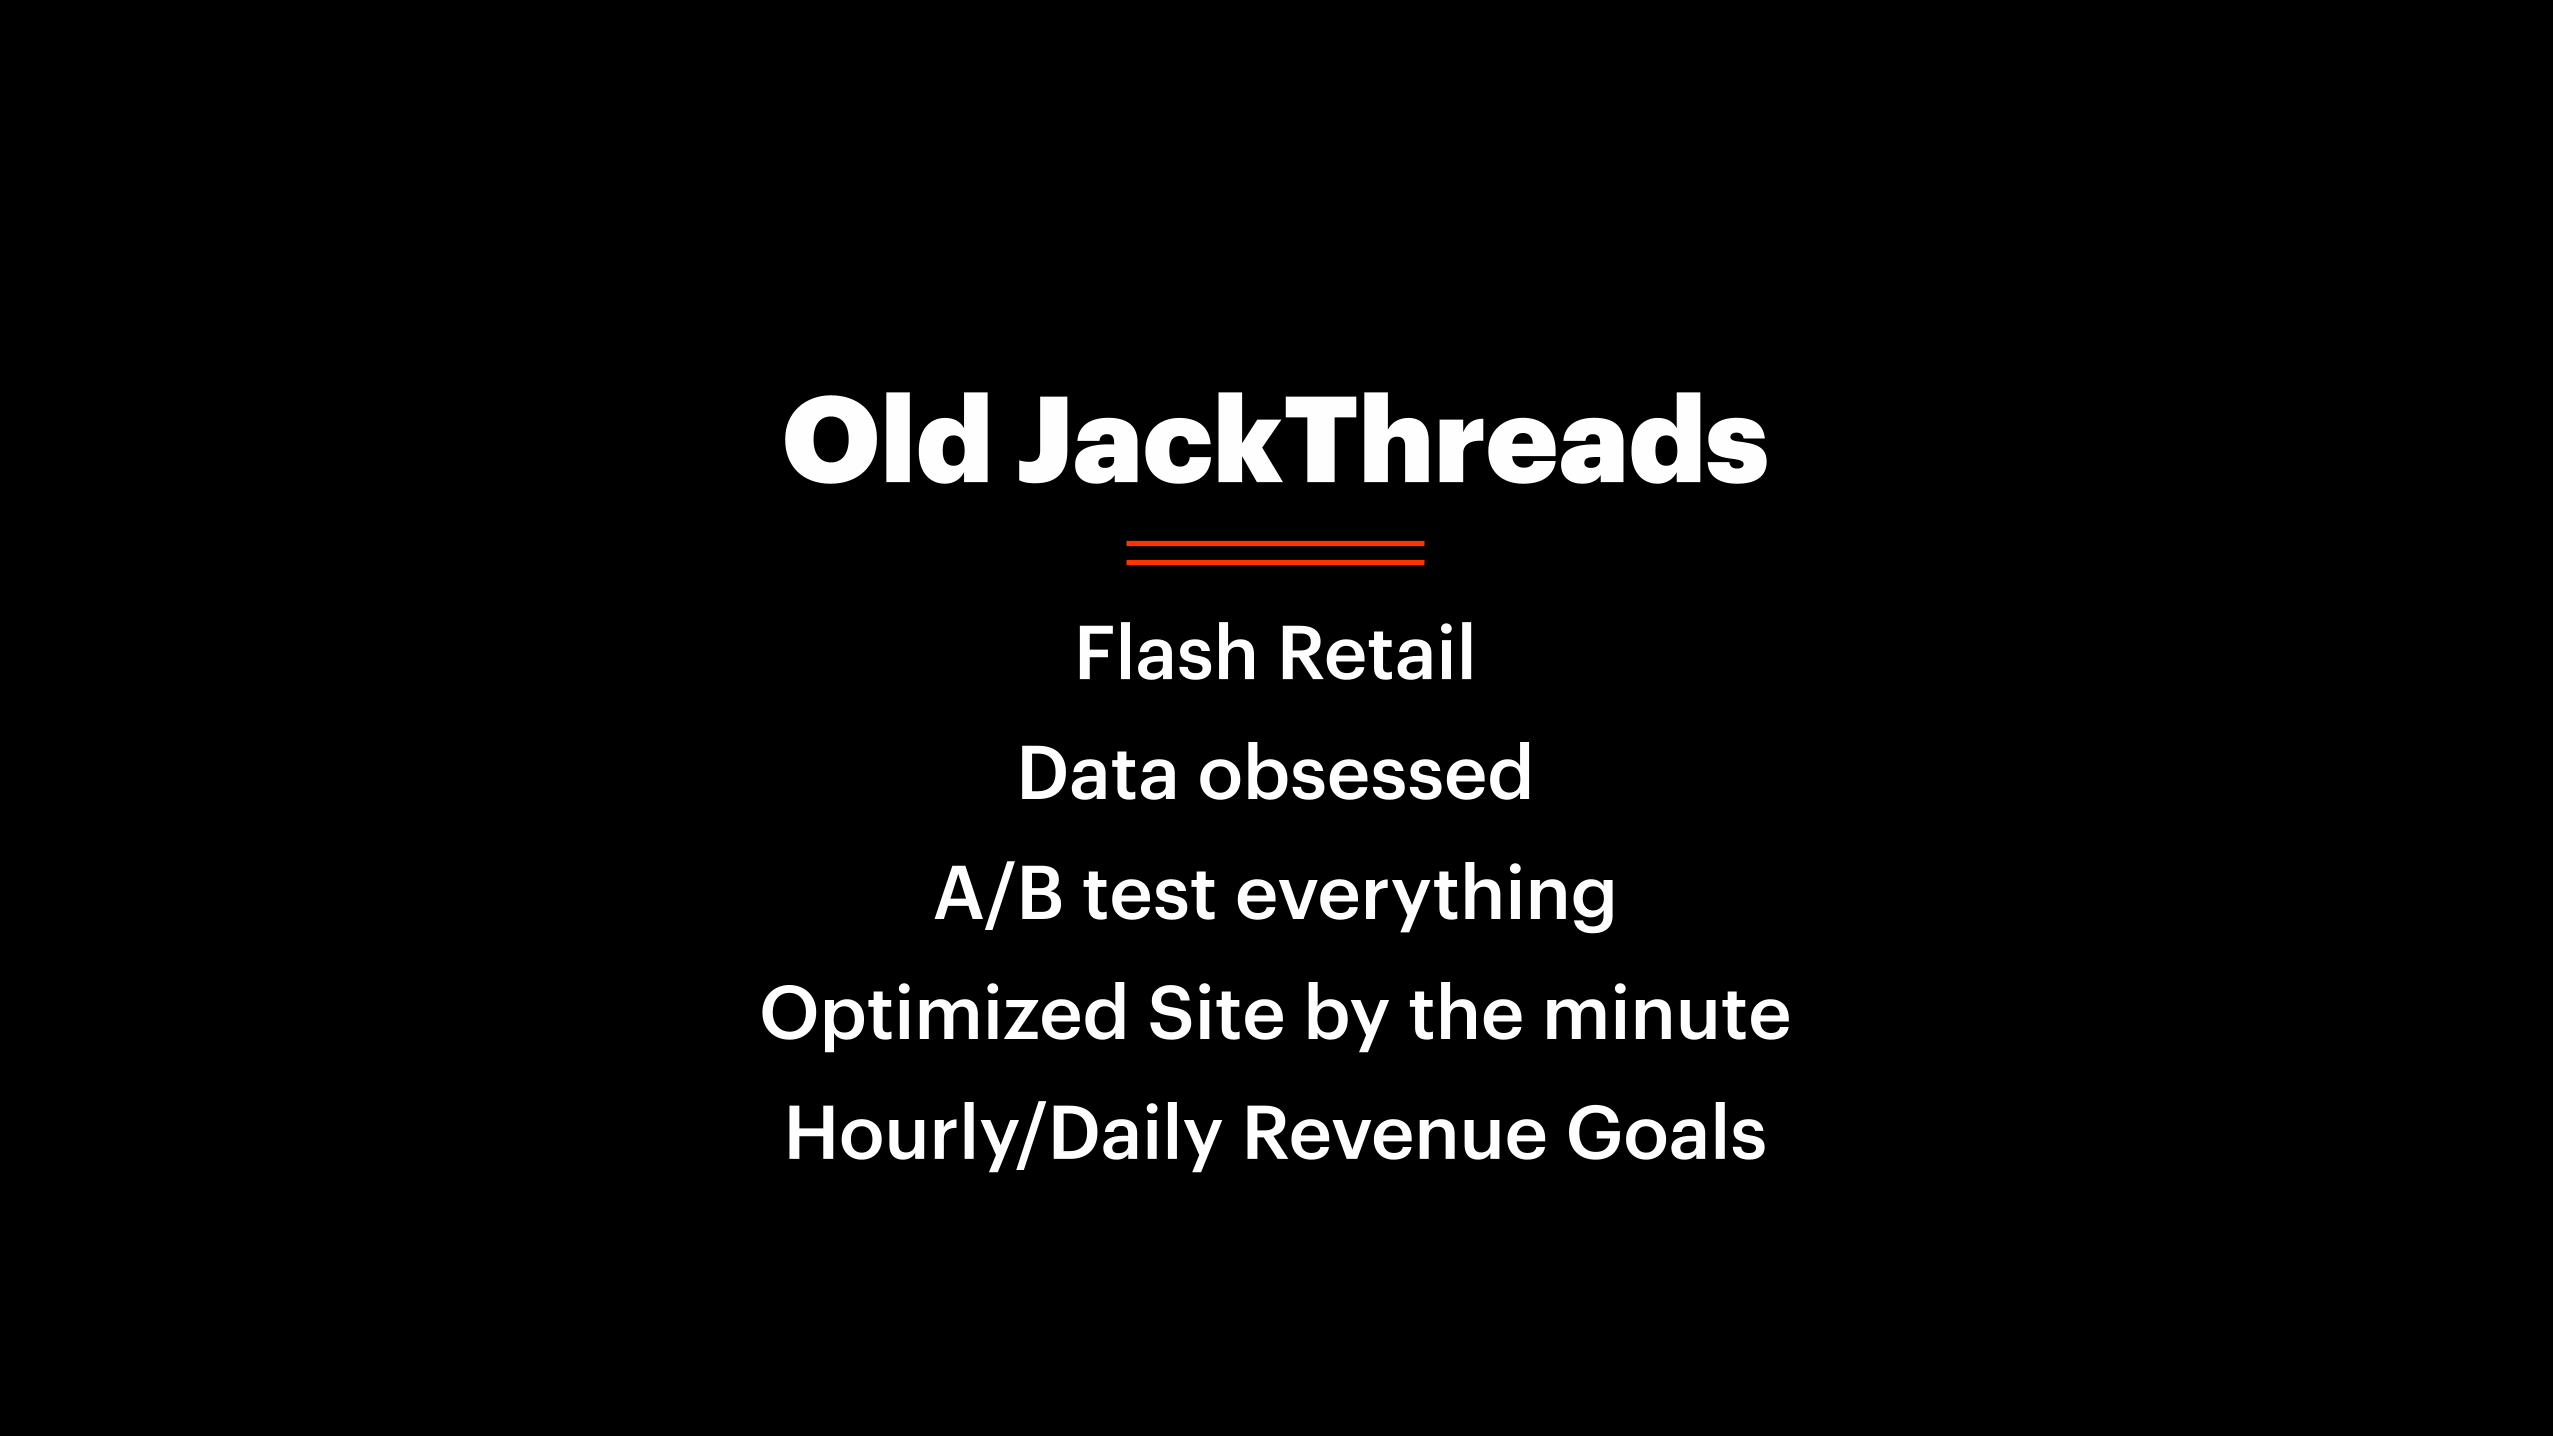
Off With Their Heads
More is More
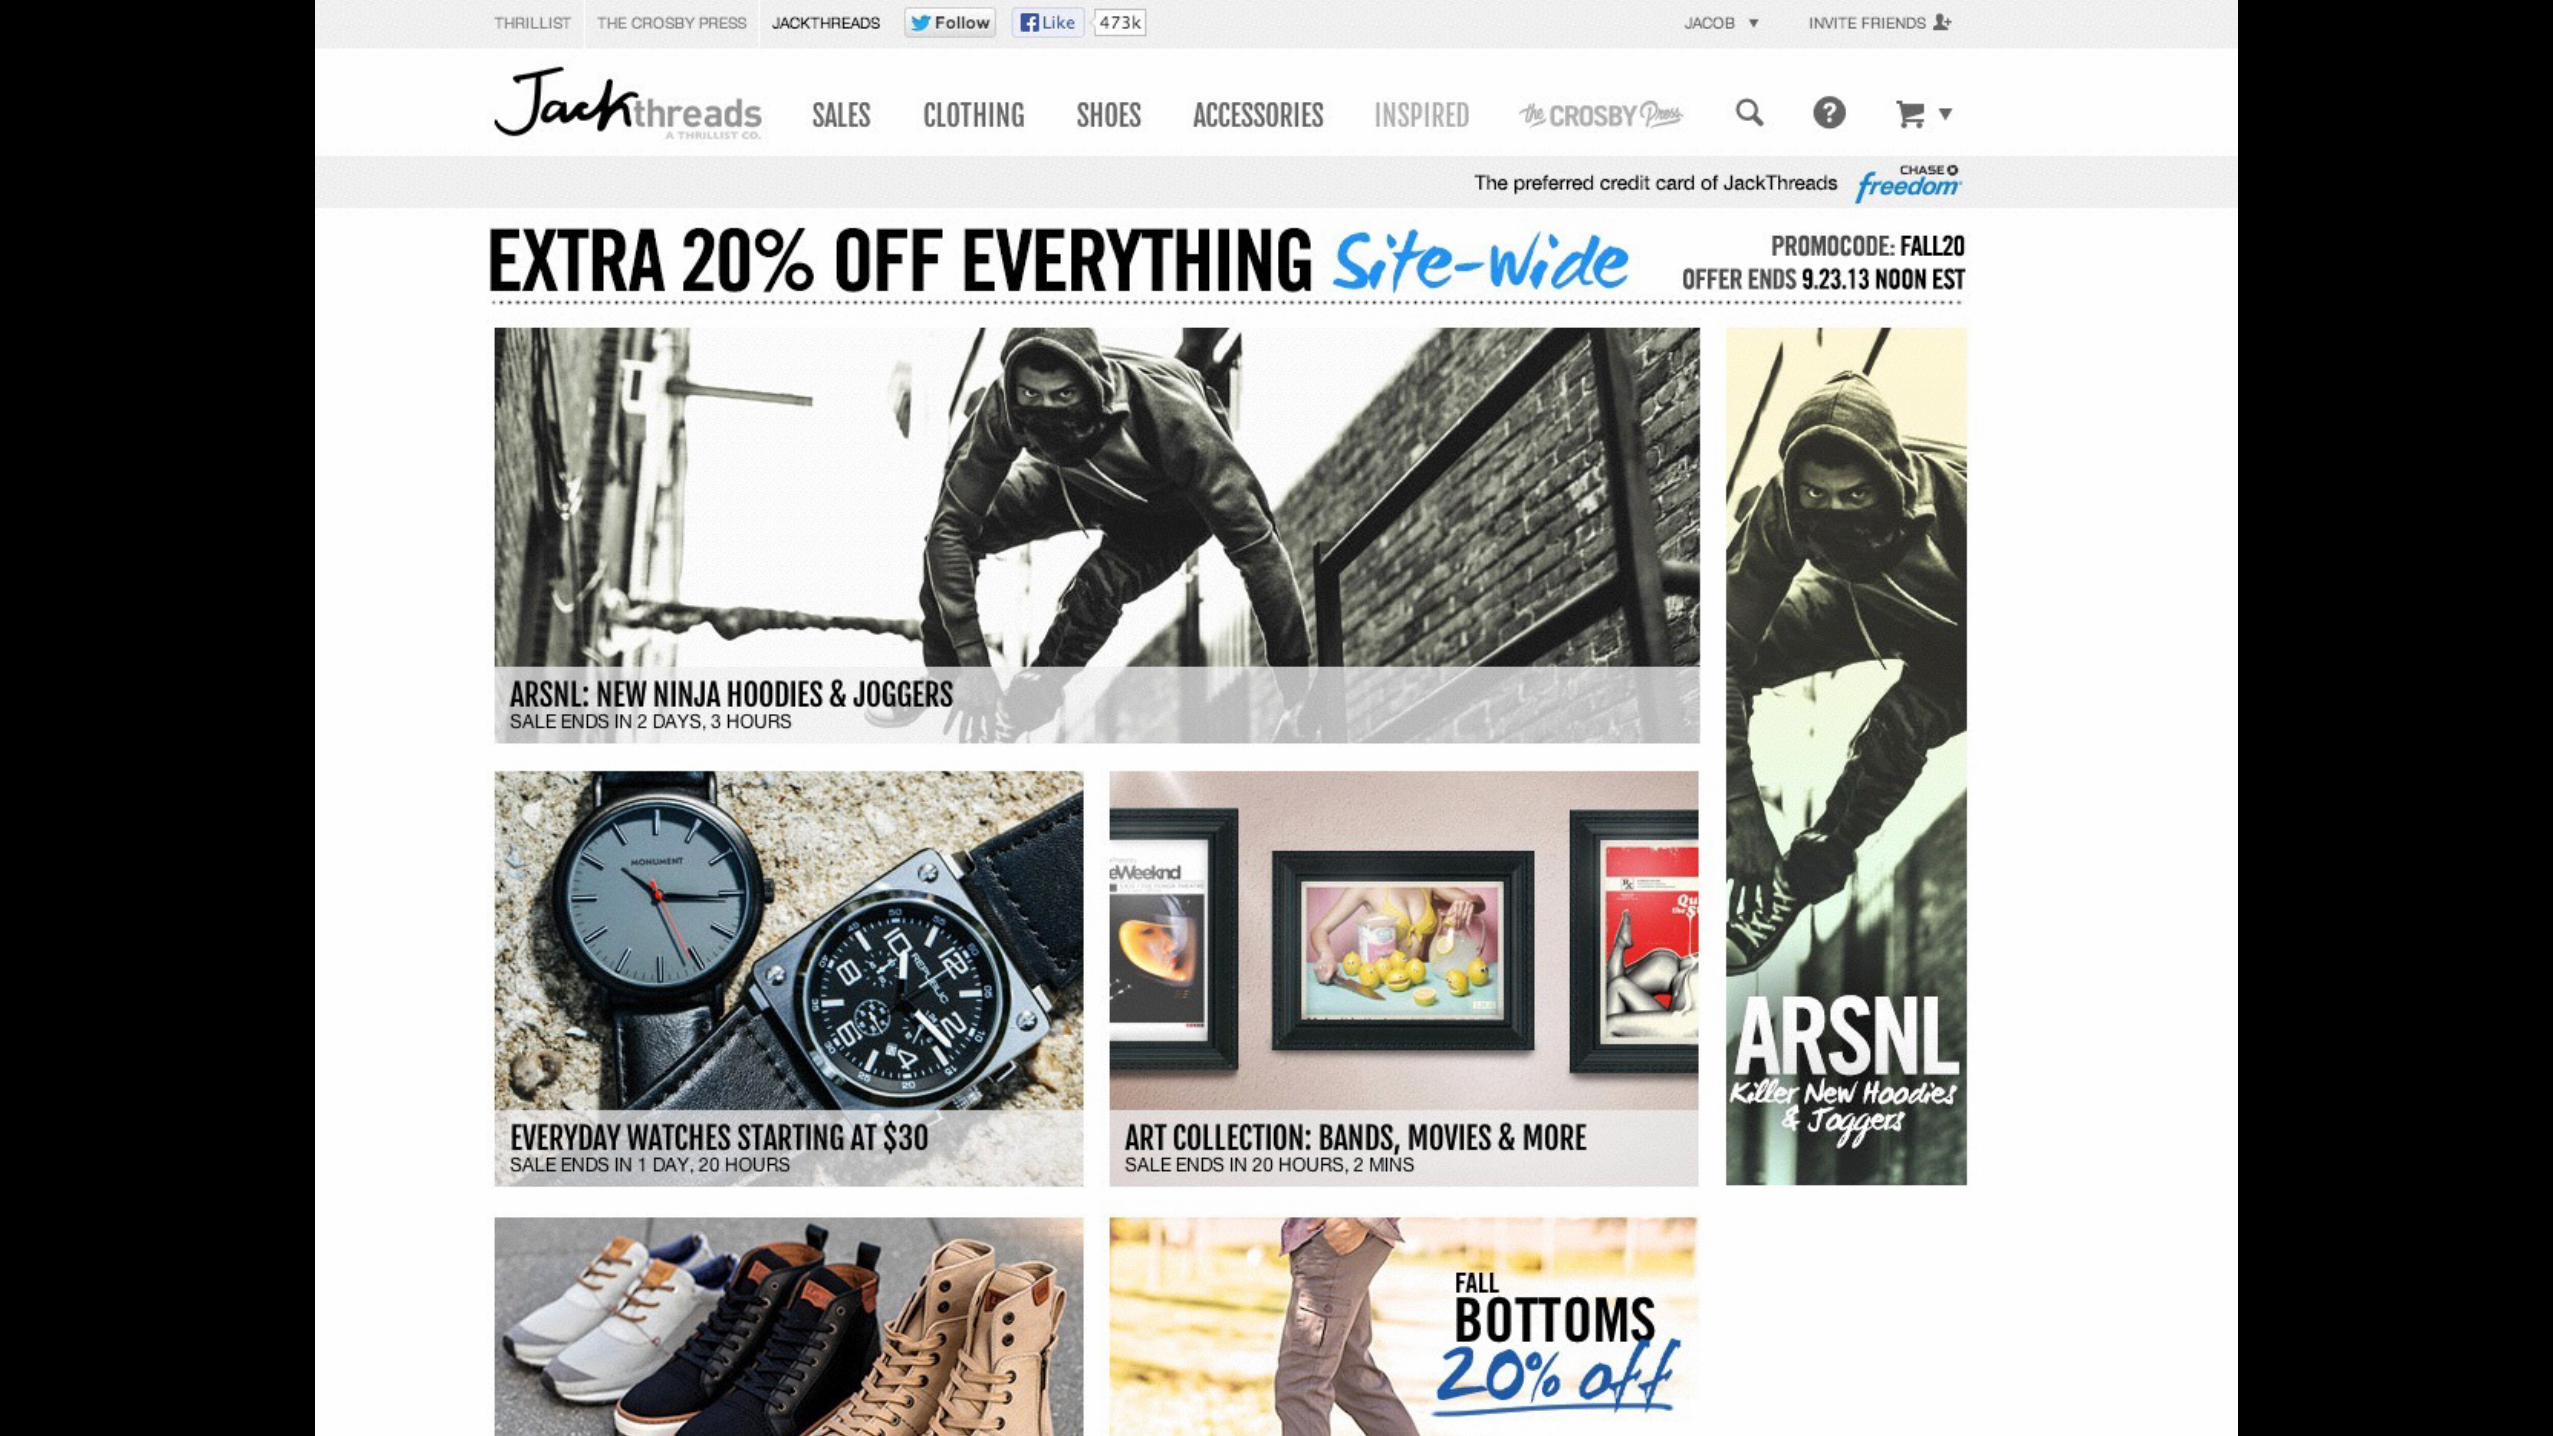

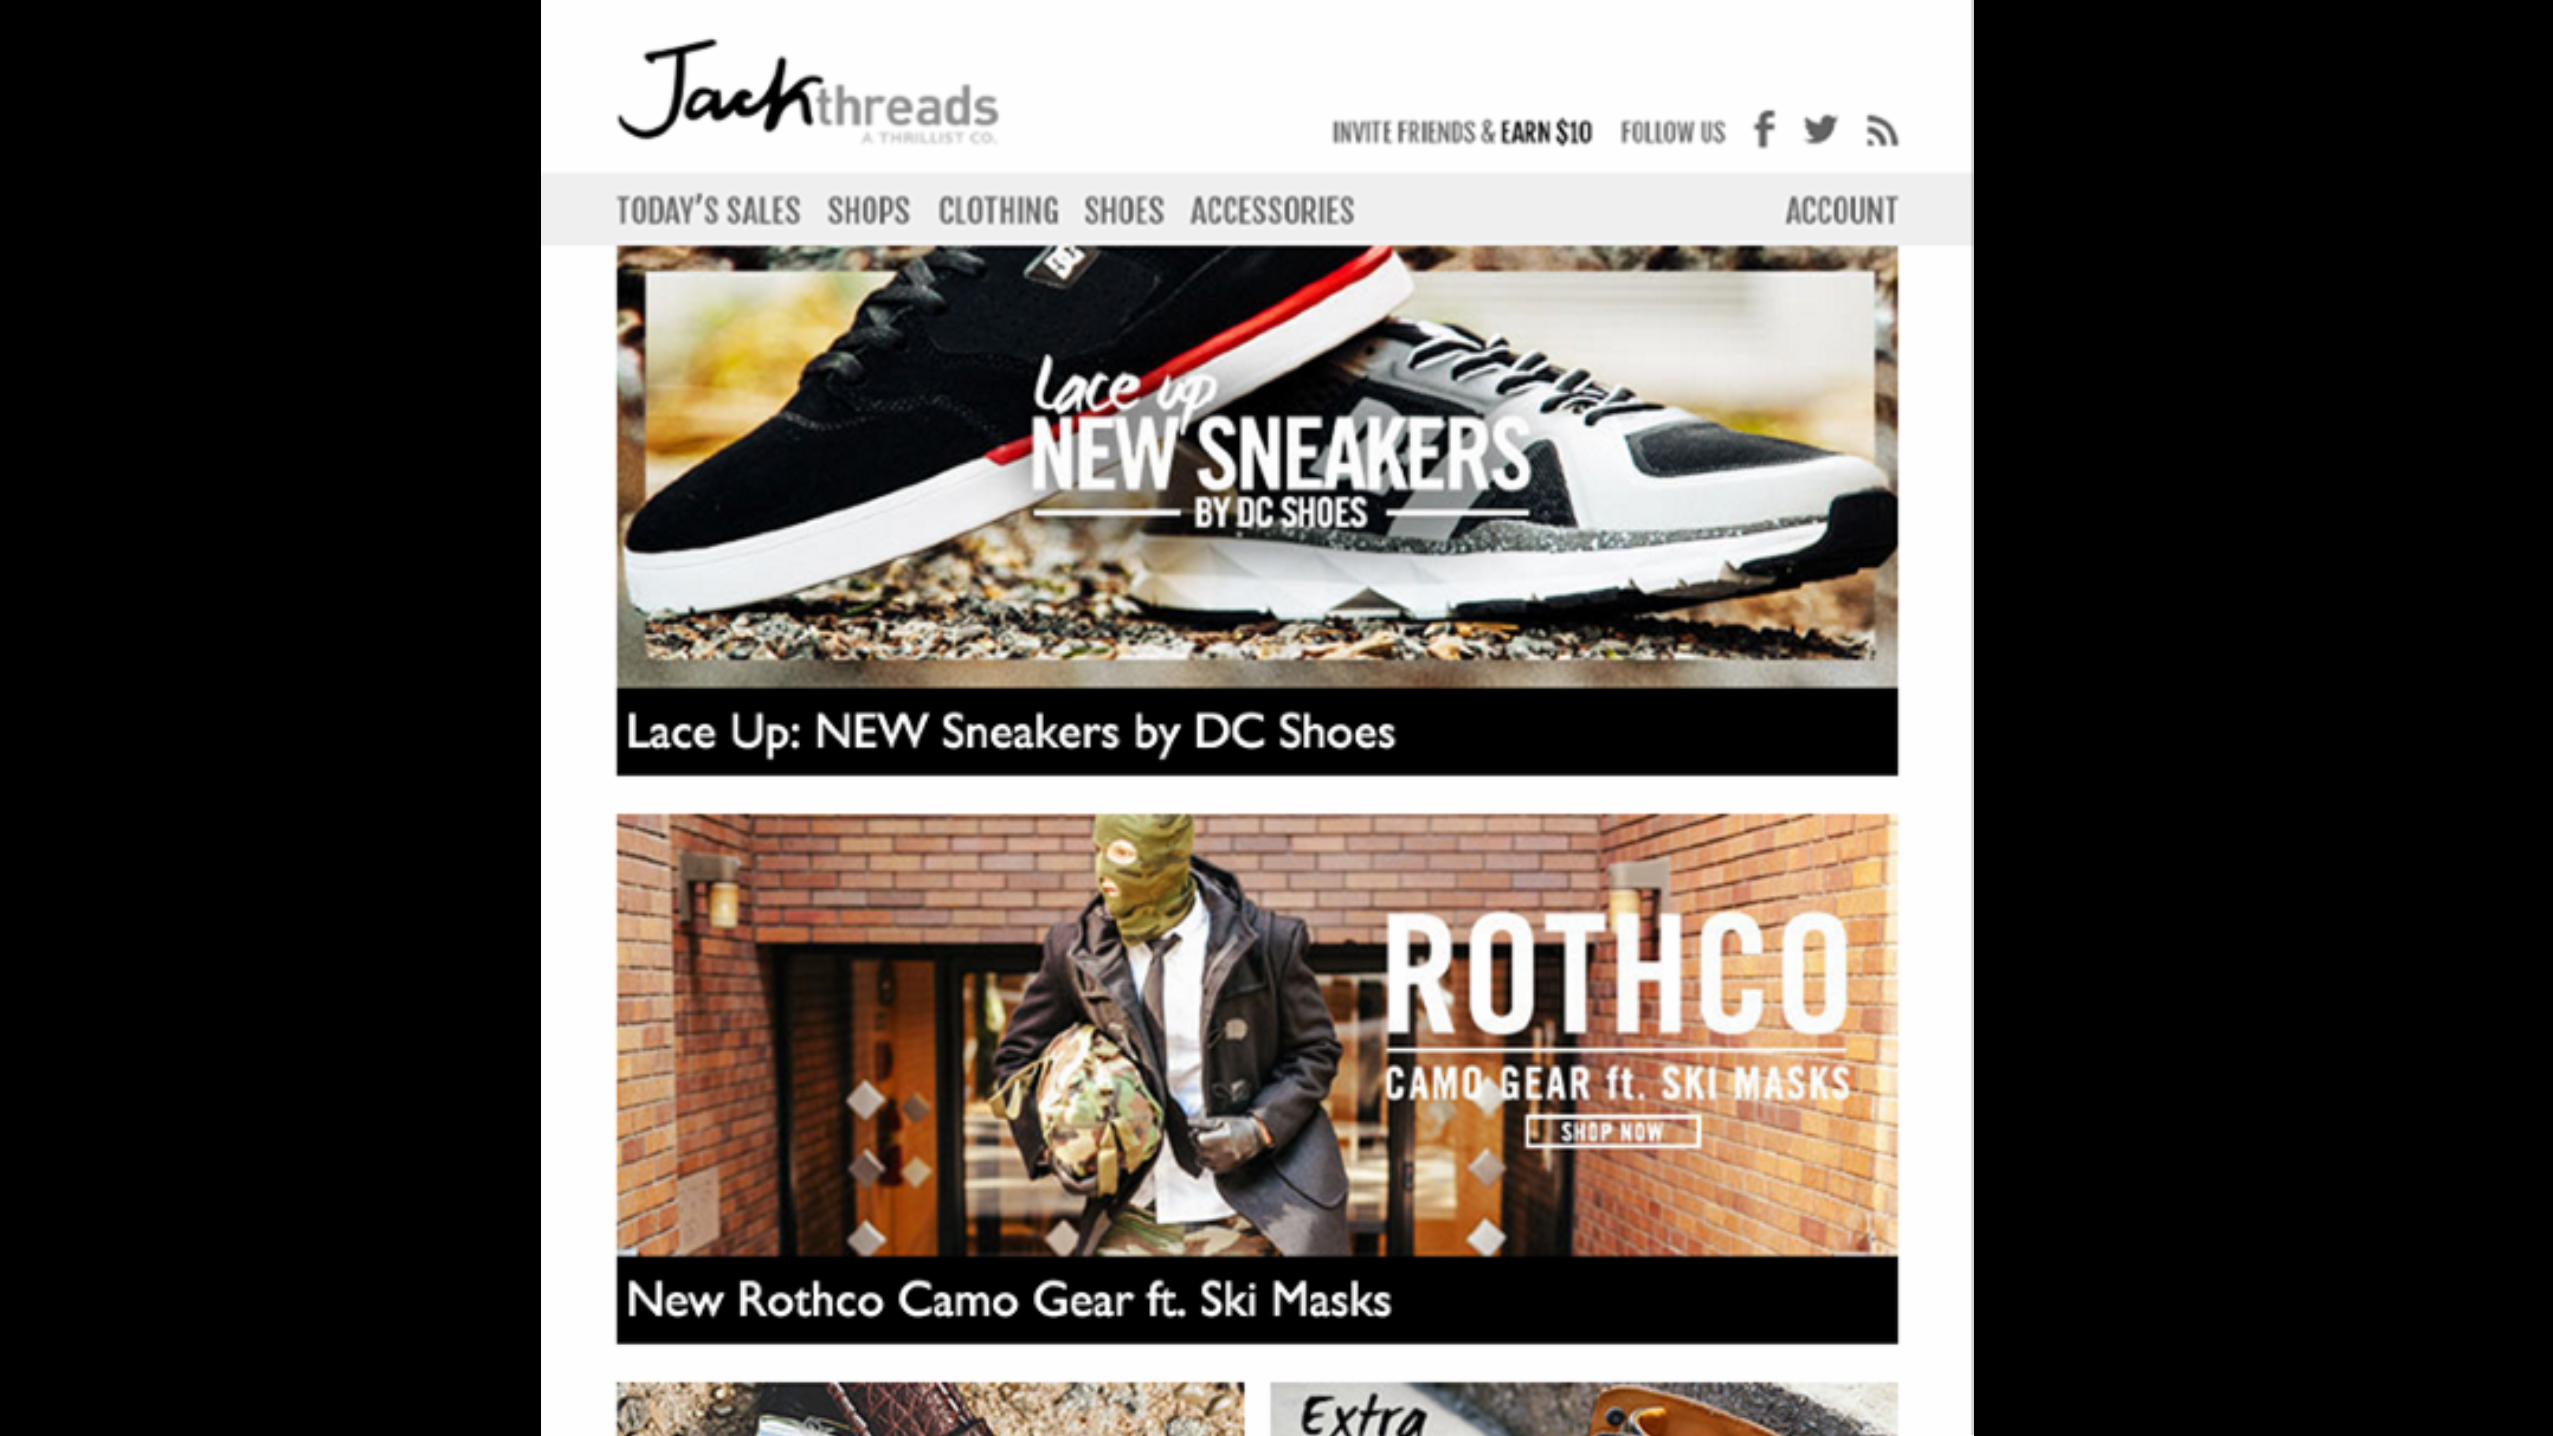
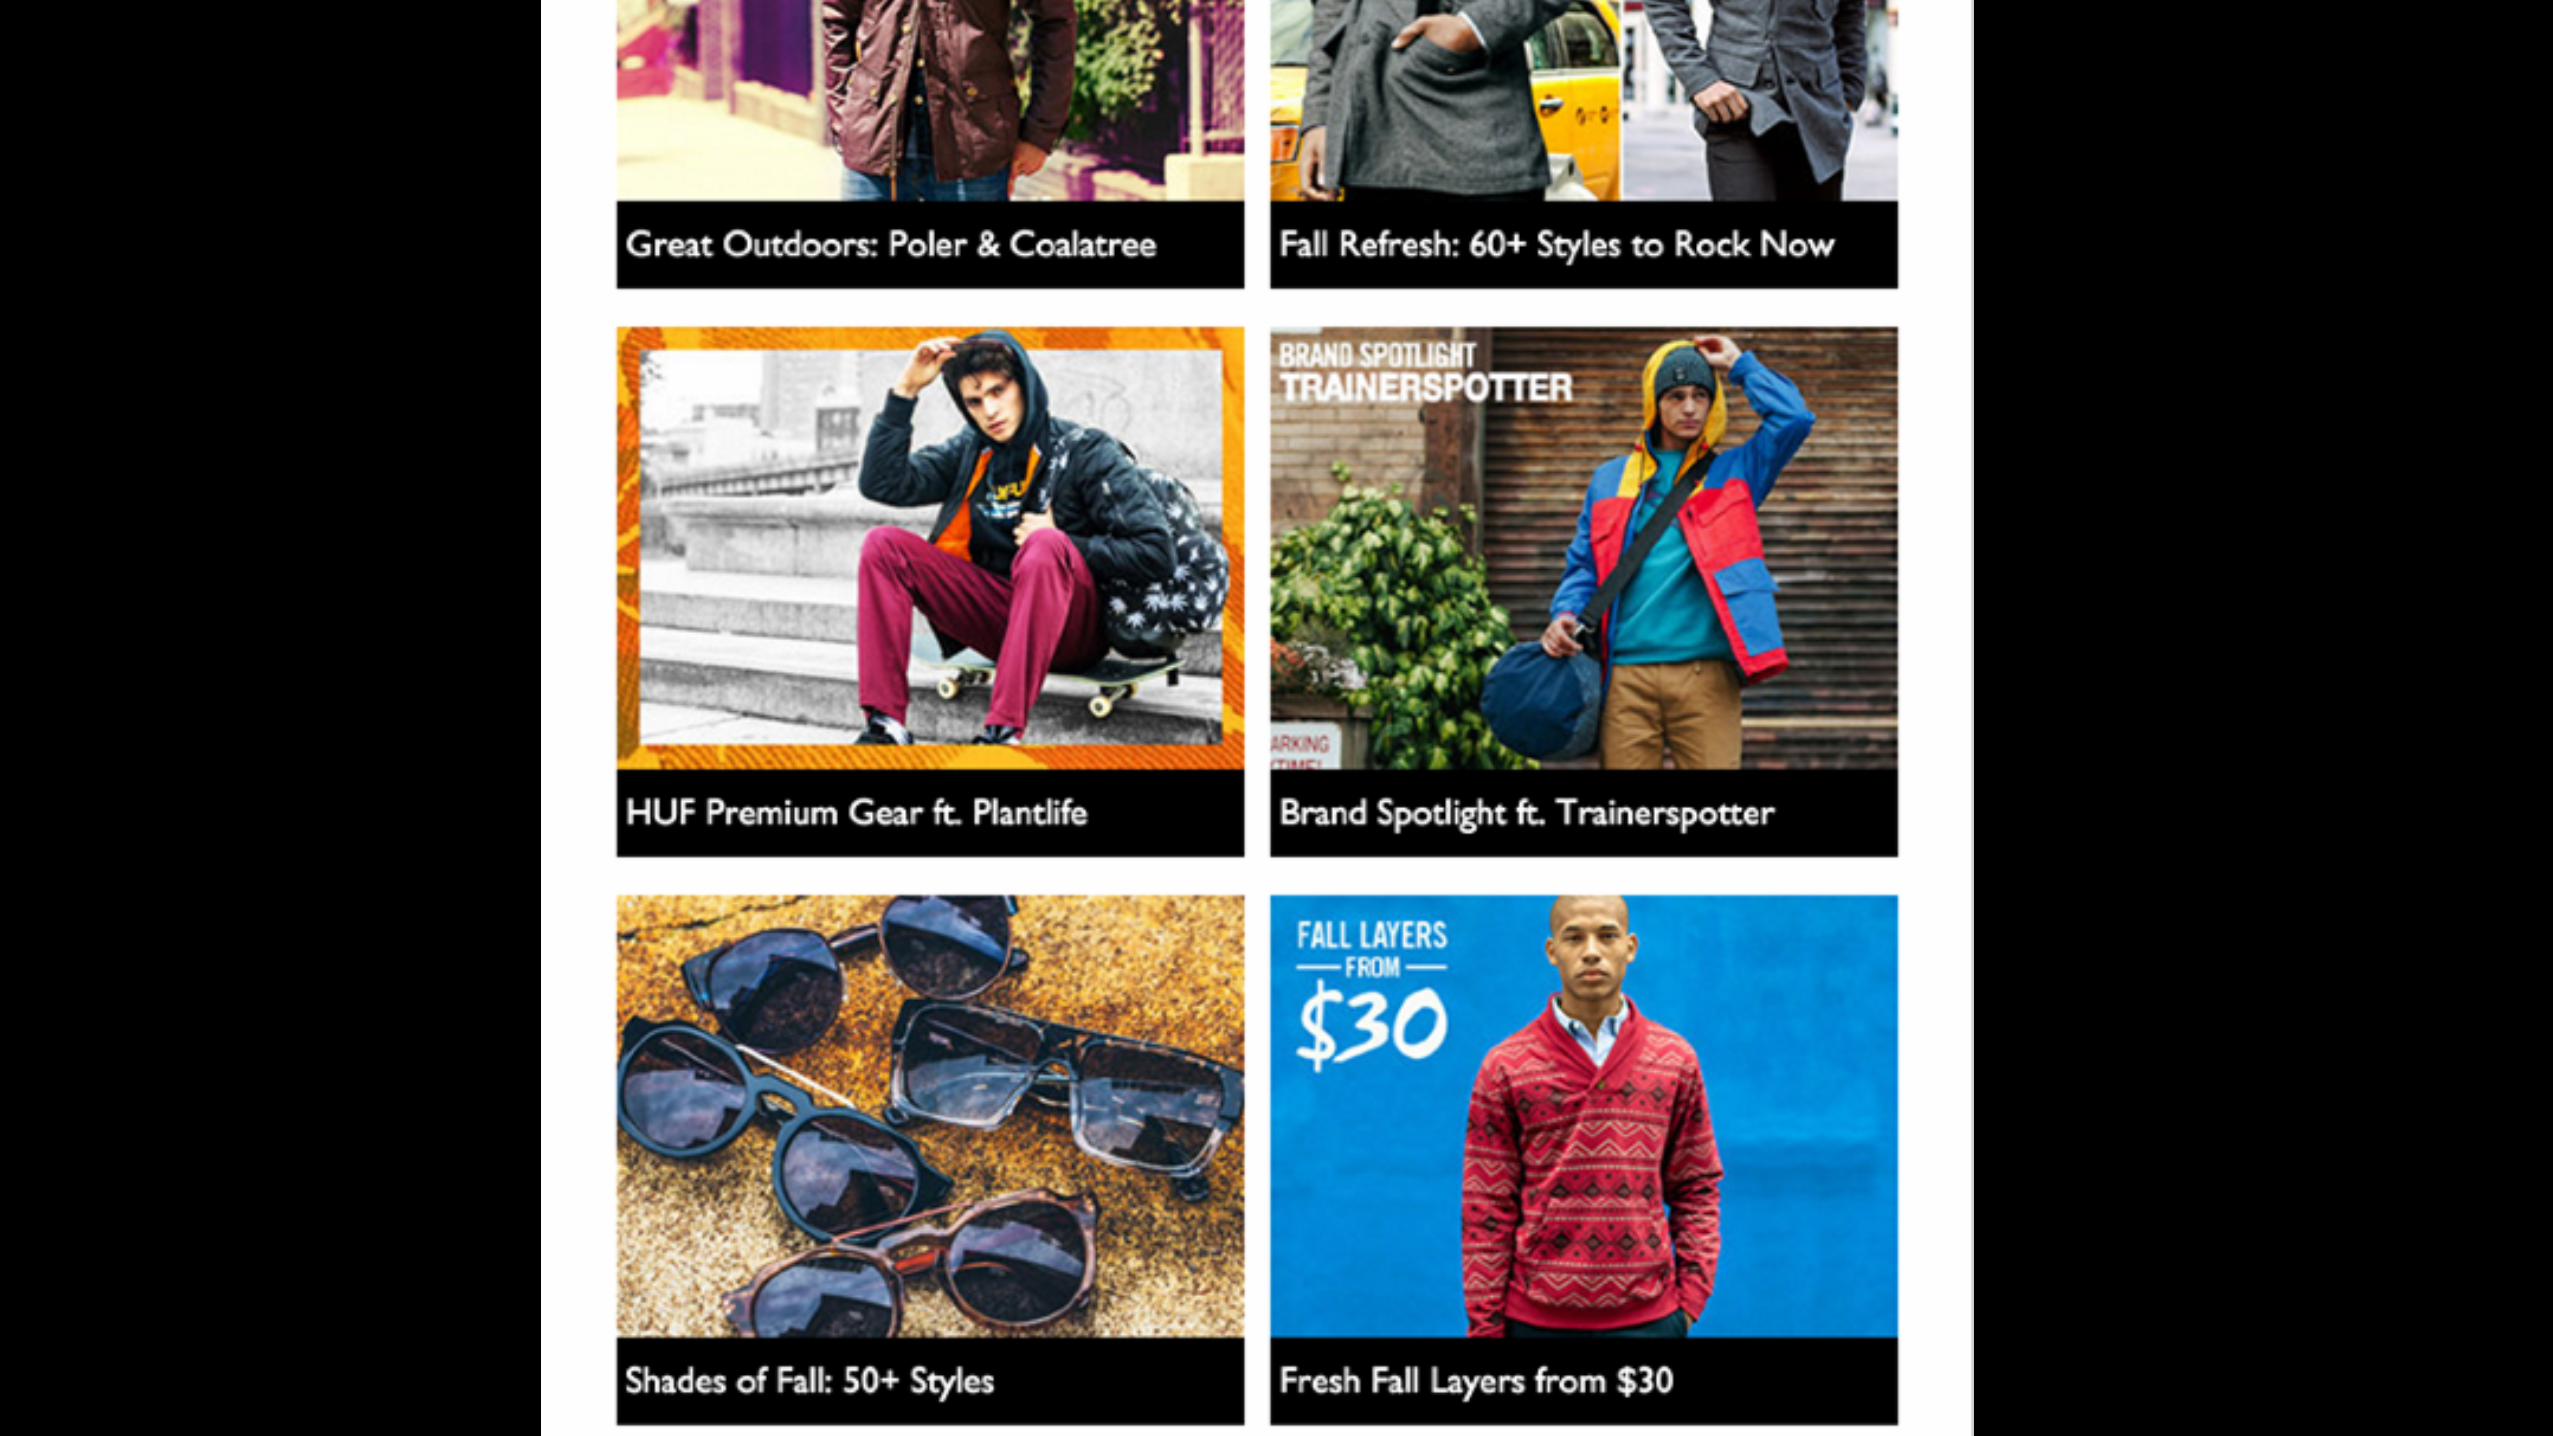

Gray UX
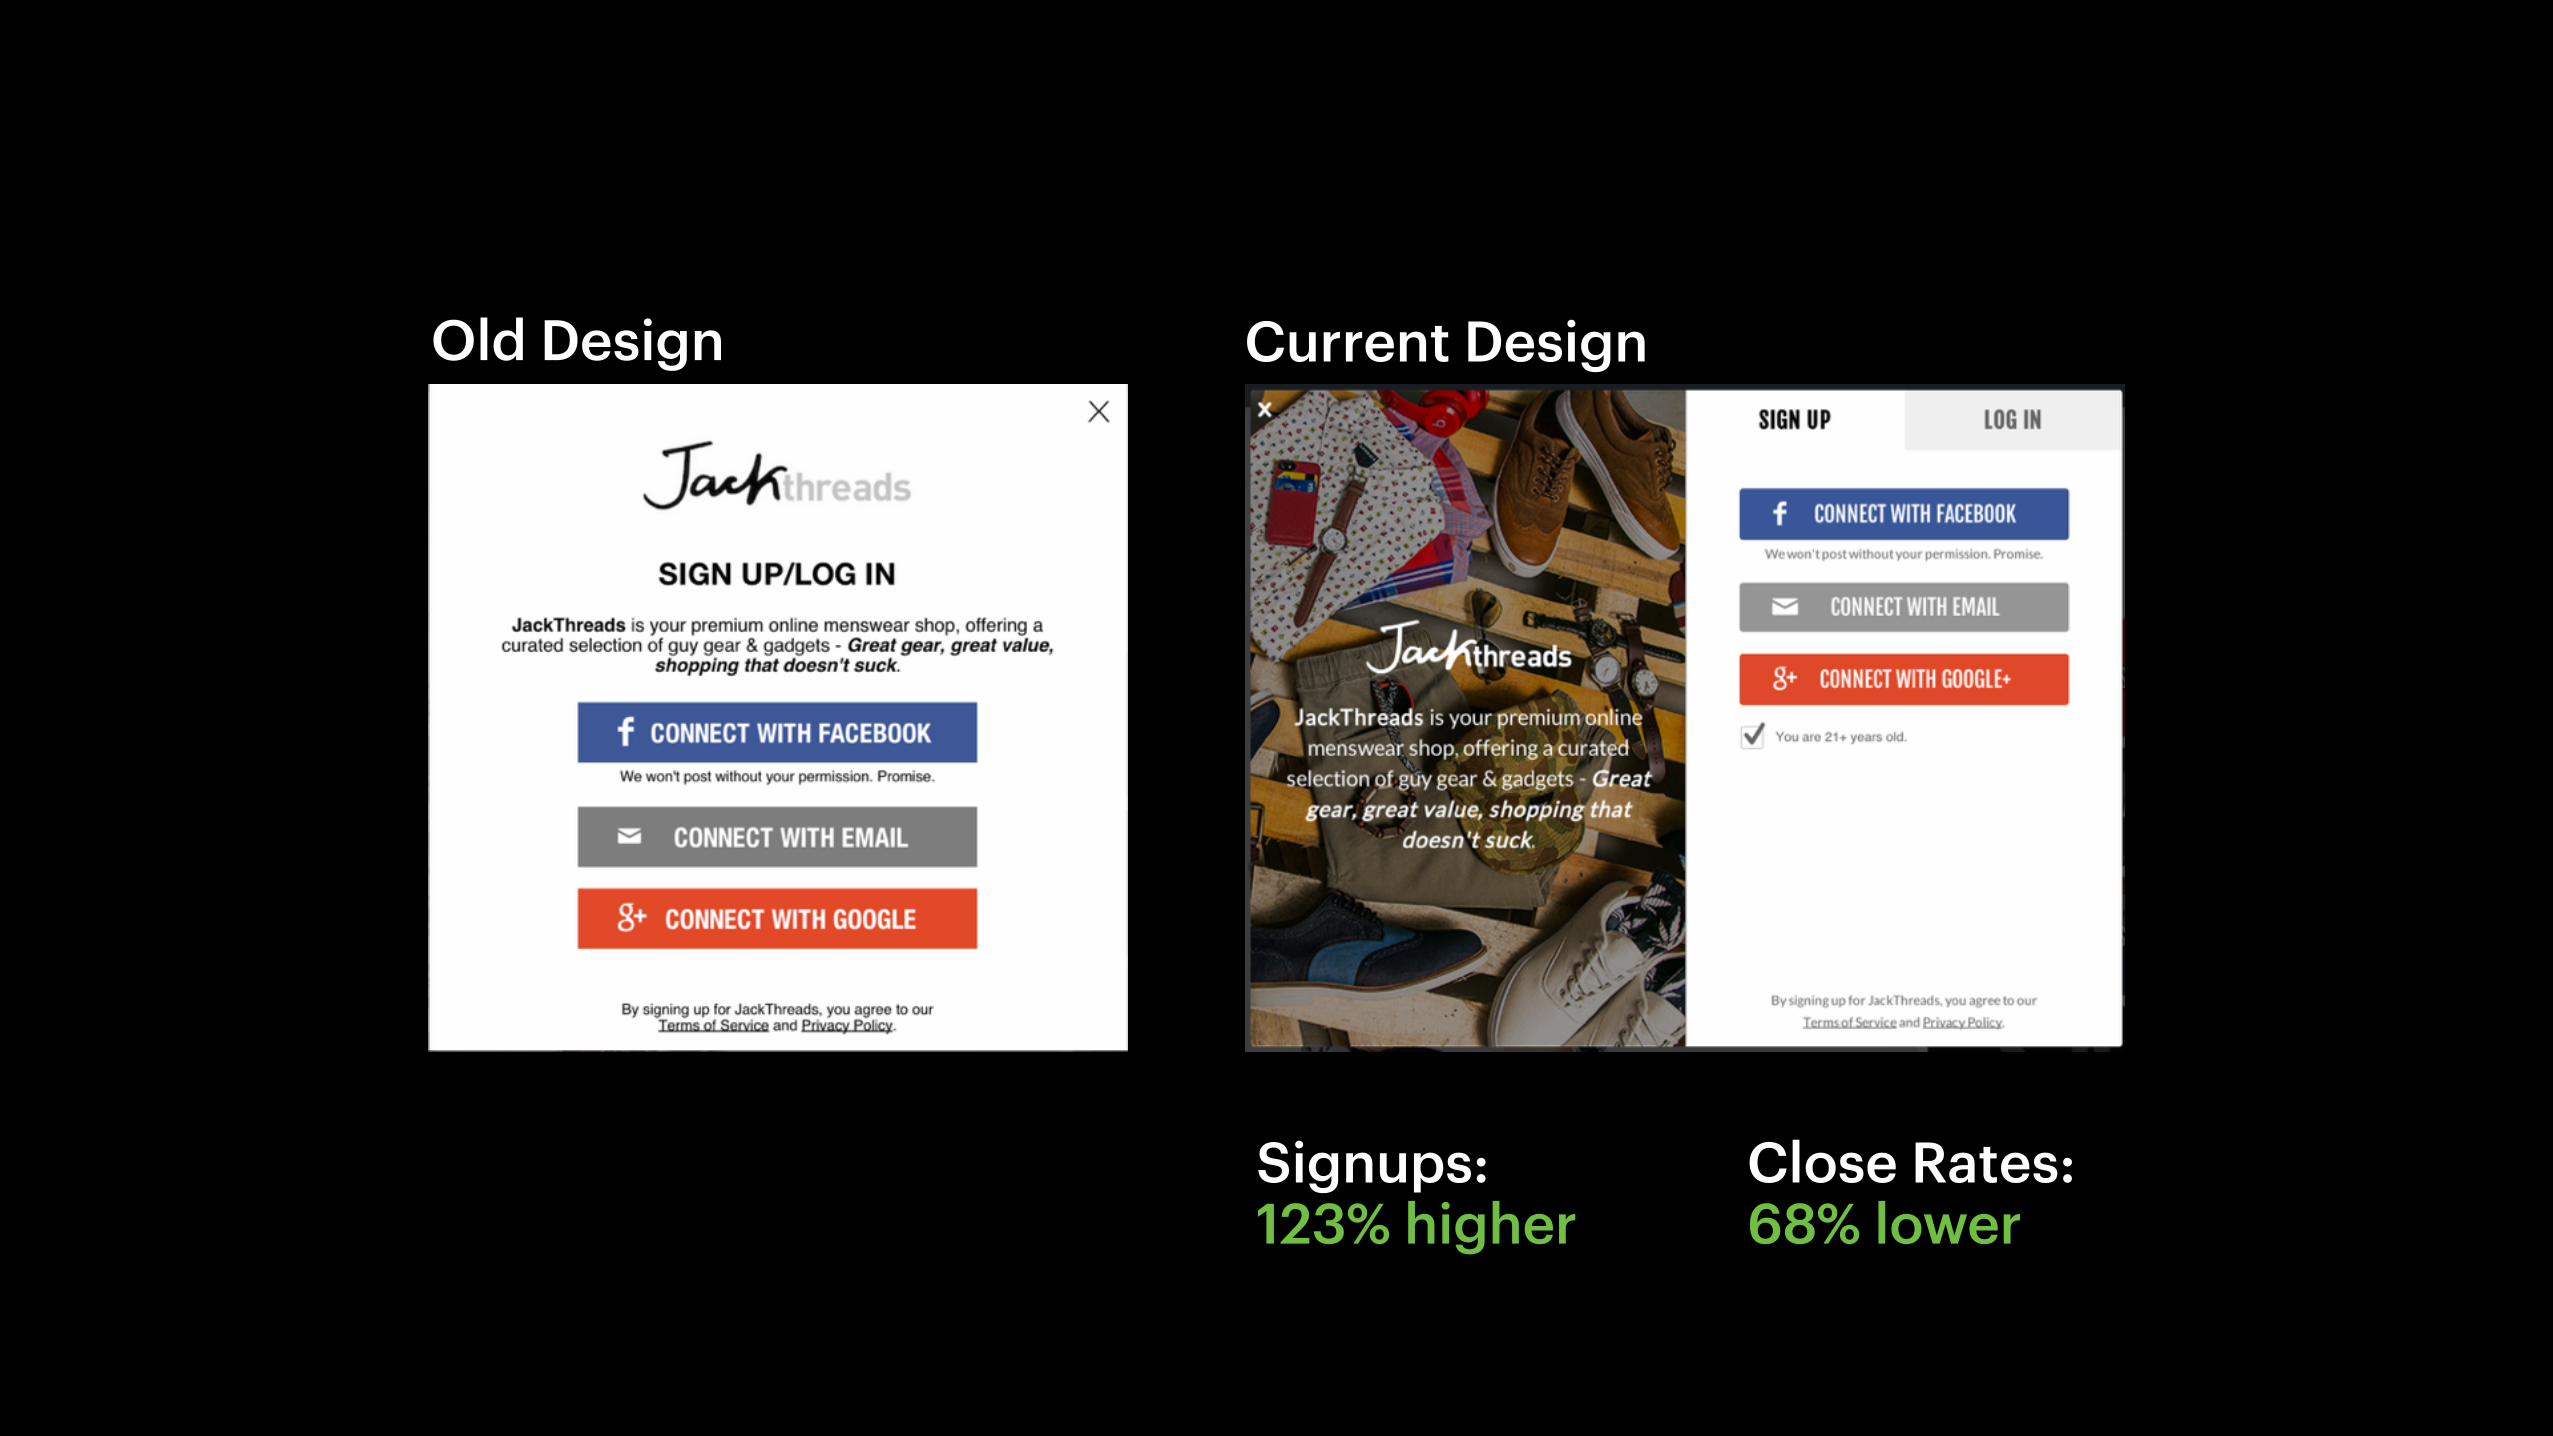
Old Design Current Design
Signups: 123% higher
Close Rates: 68% lower

The Introduction of “Brand”
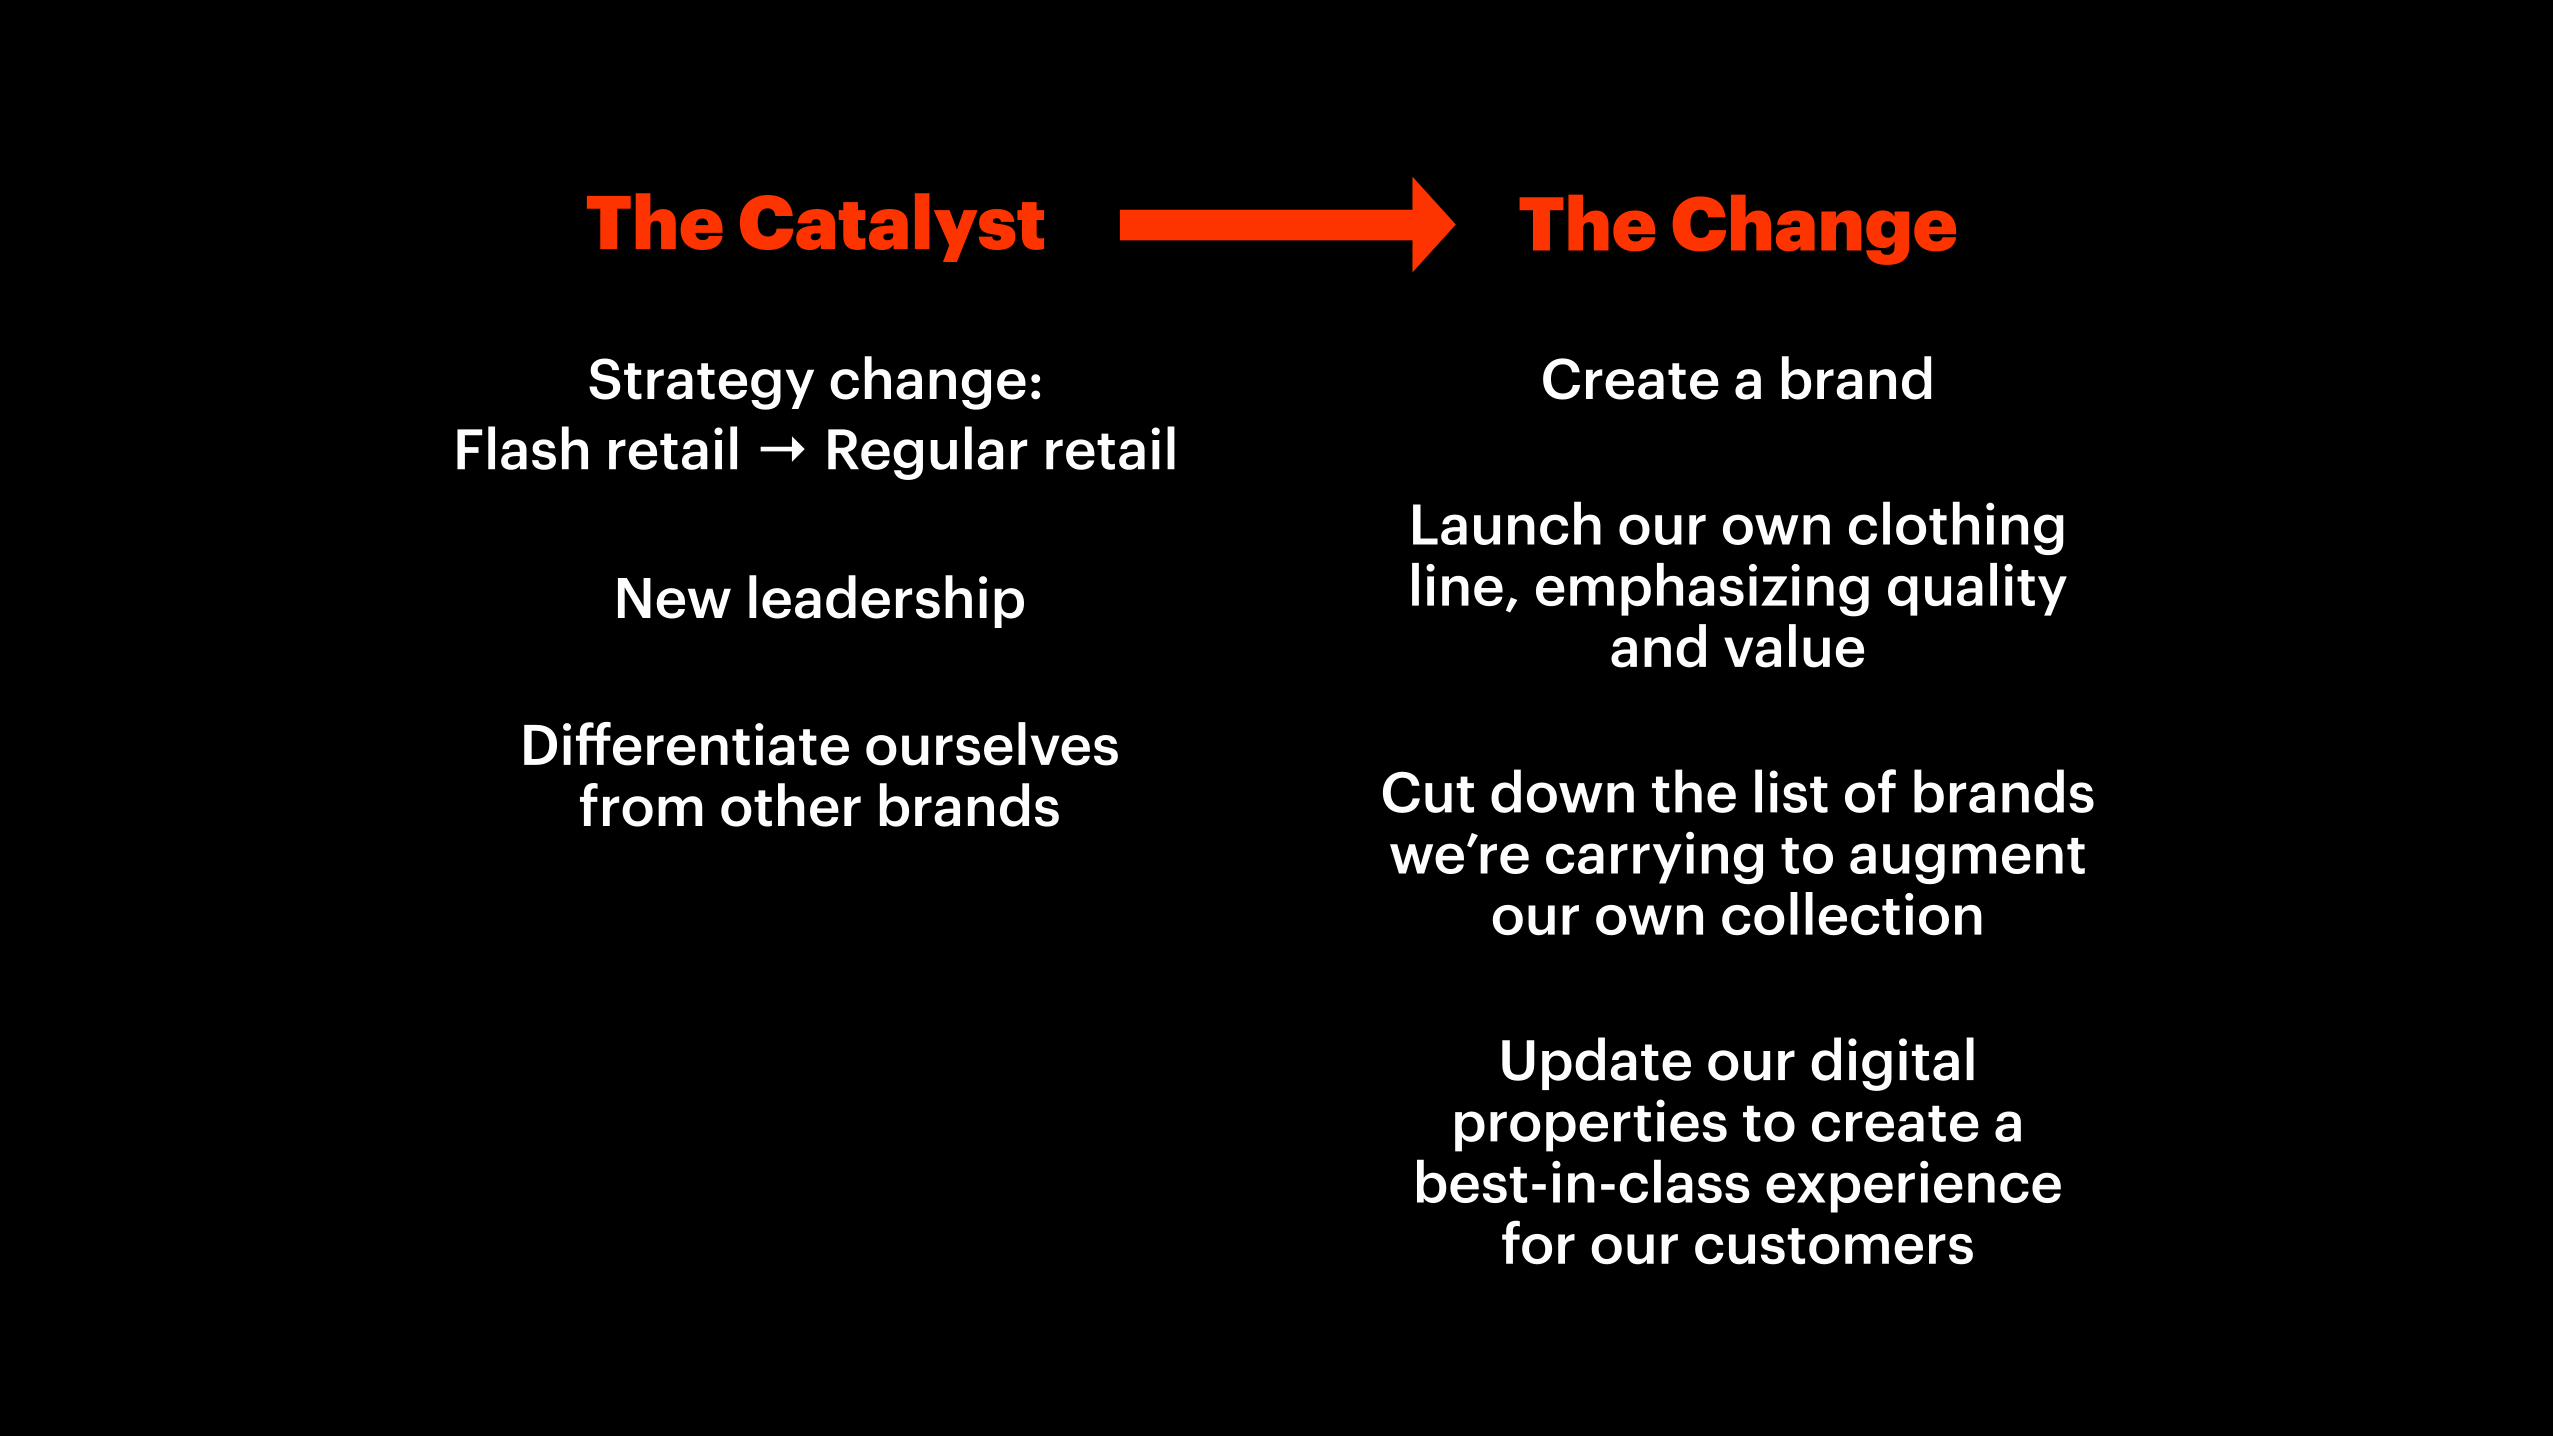
Strategy change: Flash retail → Regular retail
The Change
New leadership
Differentiate ourselves from other brands
The Catalyst
Create a brand
Launch our own clothing line, emphasizing quality
and value
Update our digital properties to create a
best-in-class experience for our customers
Cut down the list of brands we’re carrying to augment
our own collection
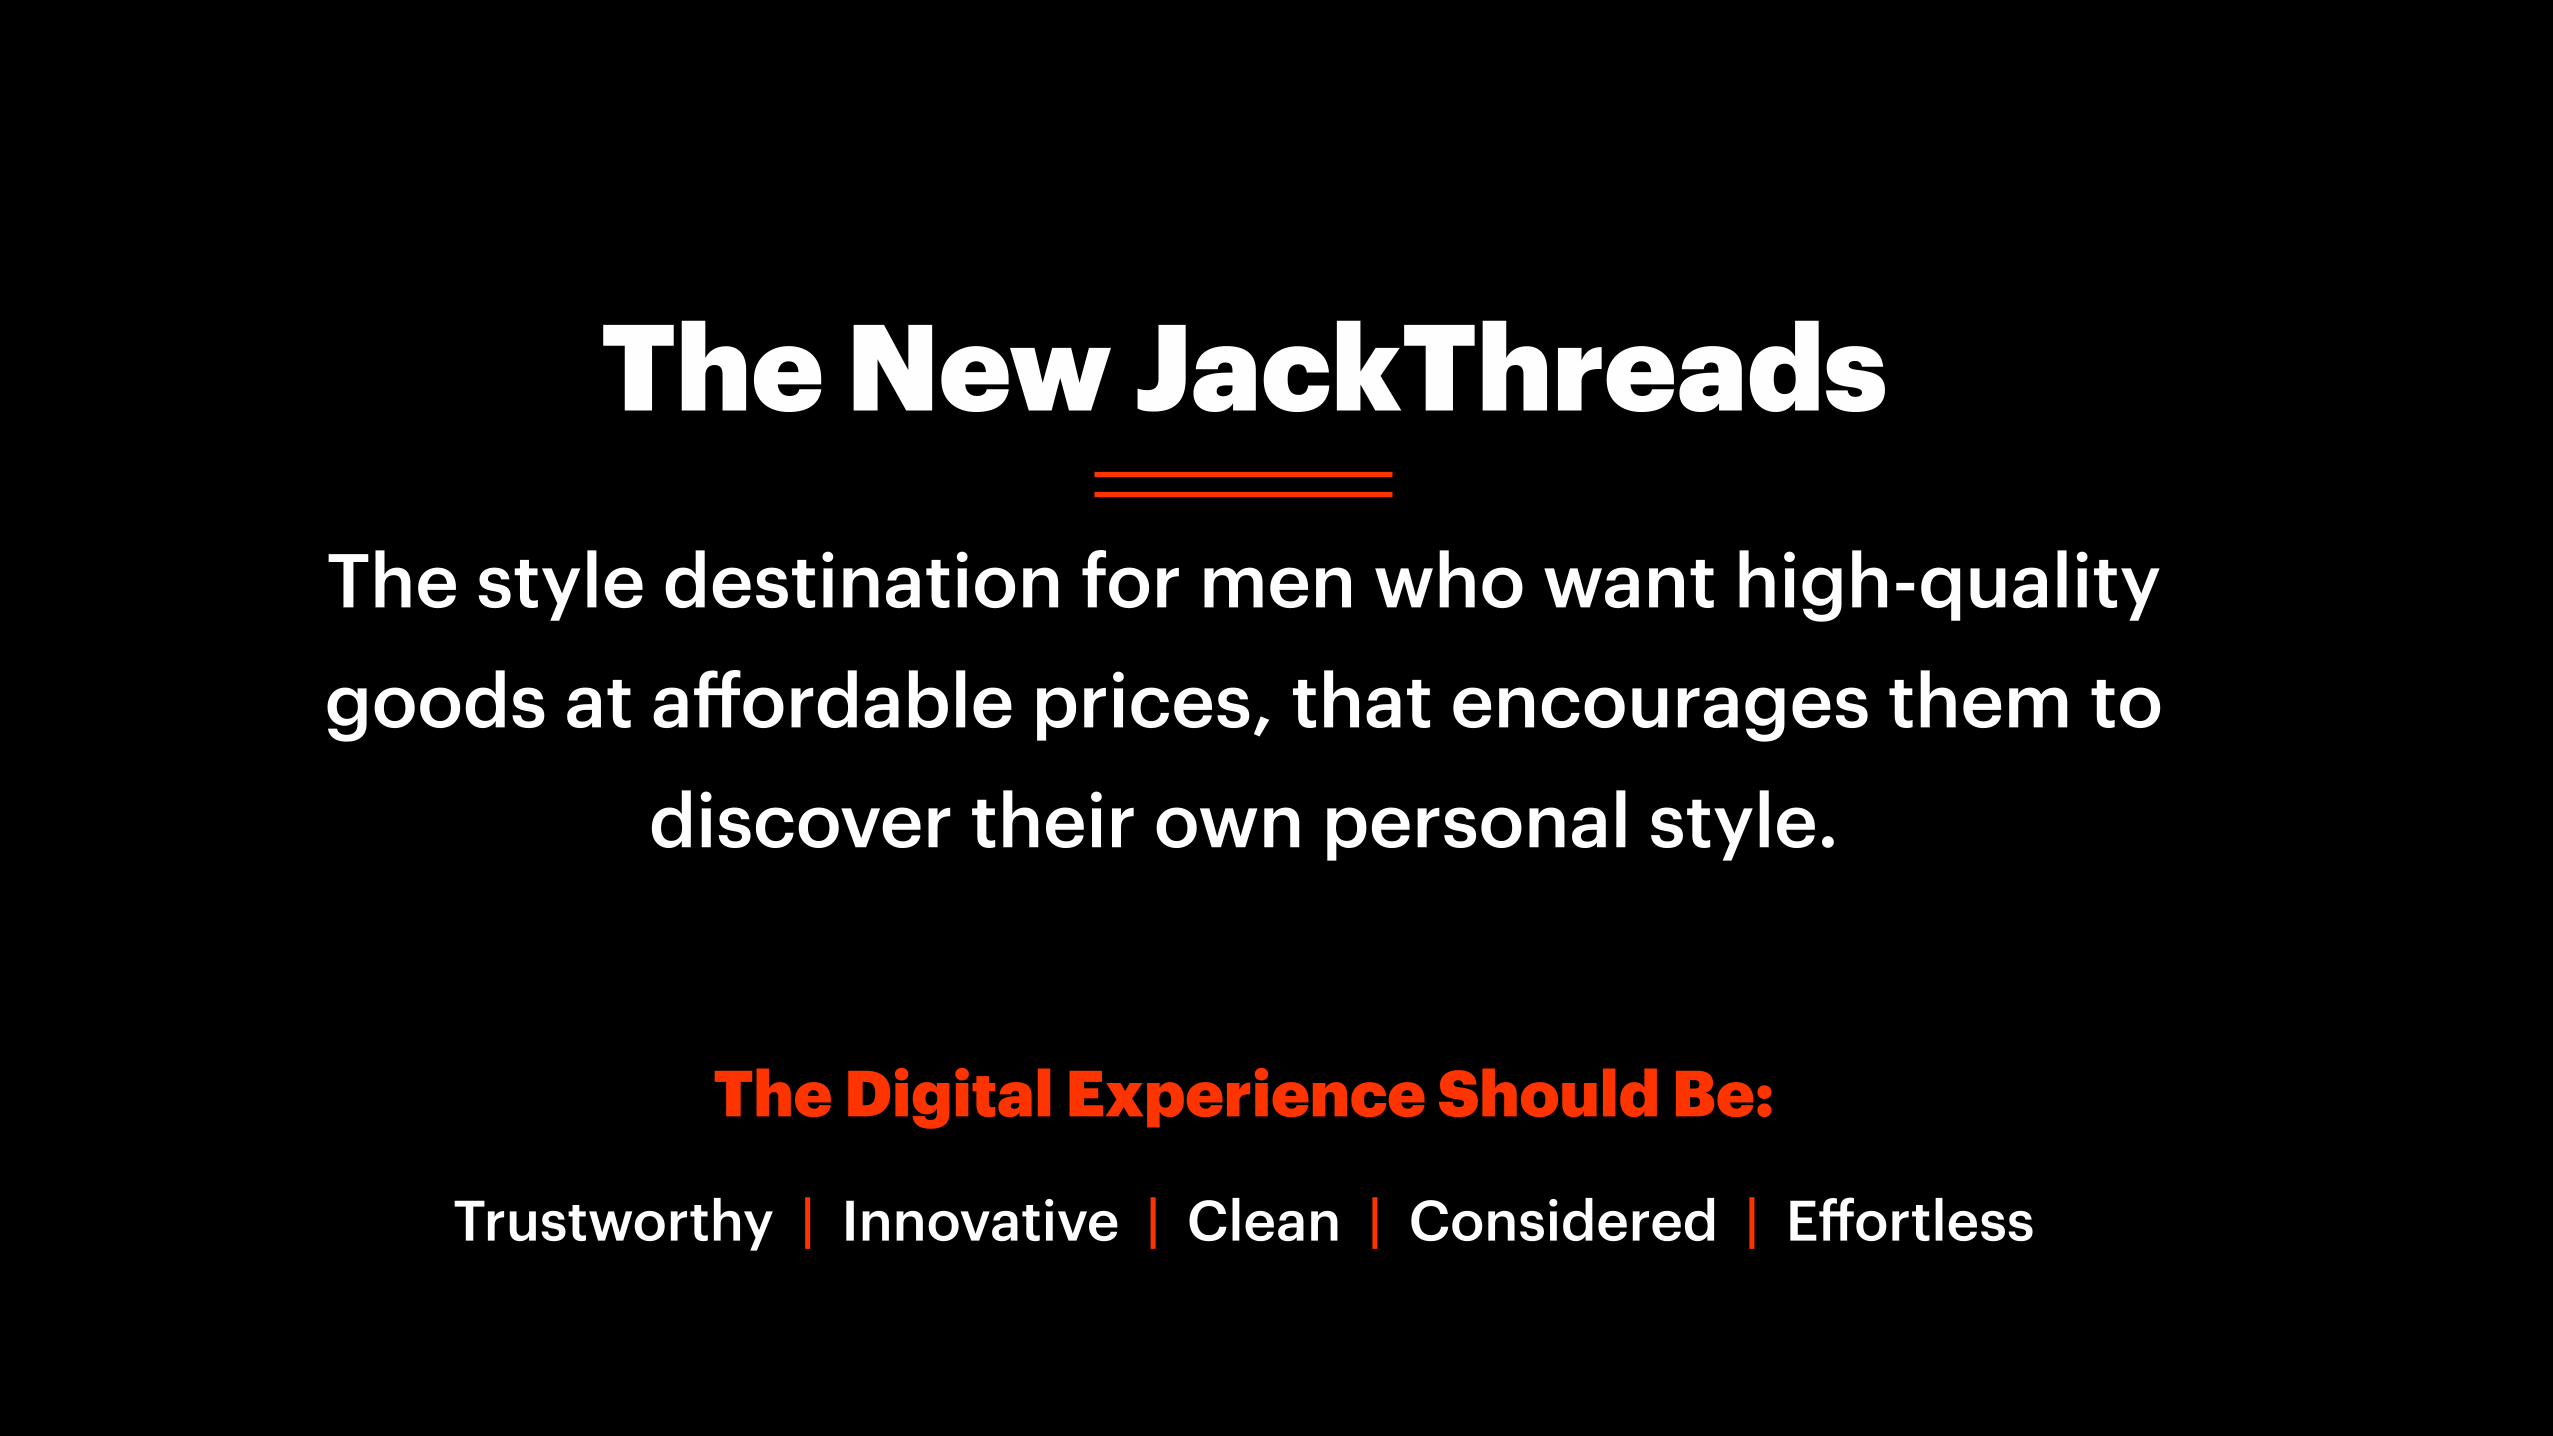
The New JackThreads The style destination for men who want high-quality goods at affordable prices, that encourages them to
discover their own personal style.
The Digital Experience Should Be:
Trustworthy | Innovative | Clean | Considered | Effortless
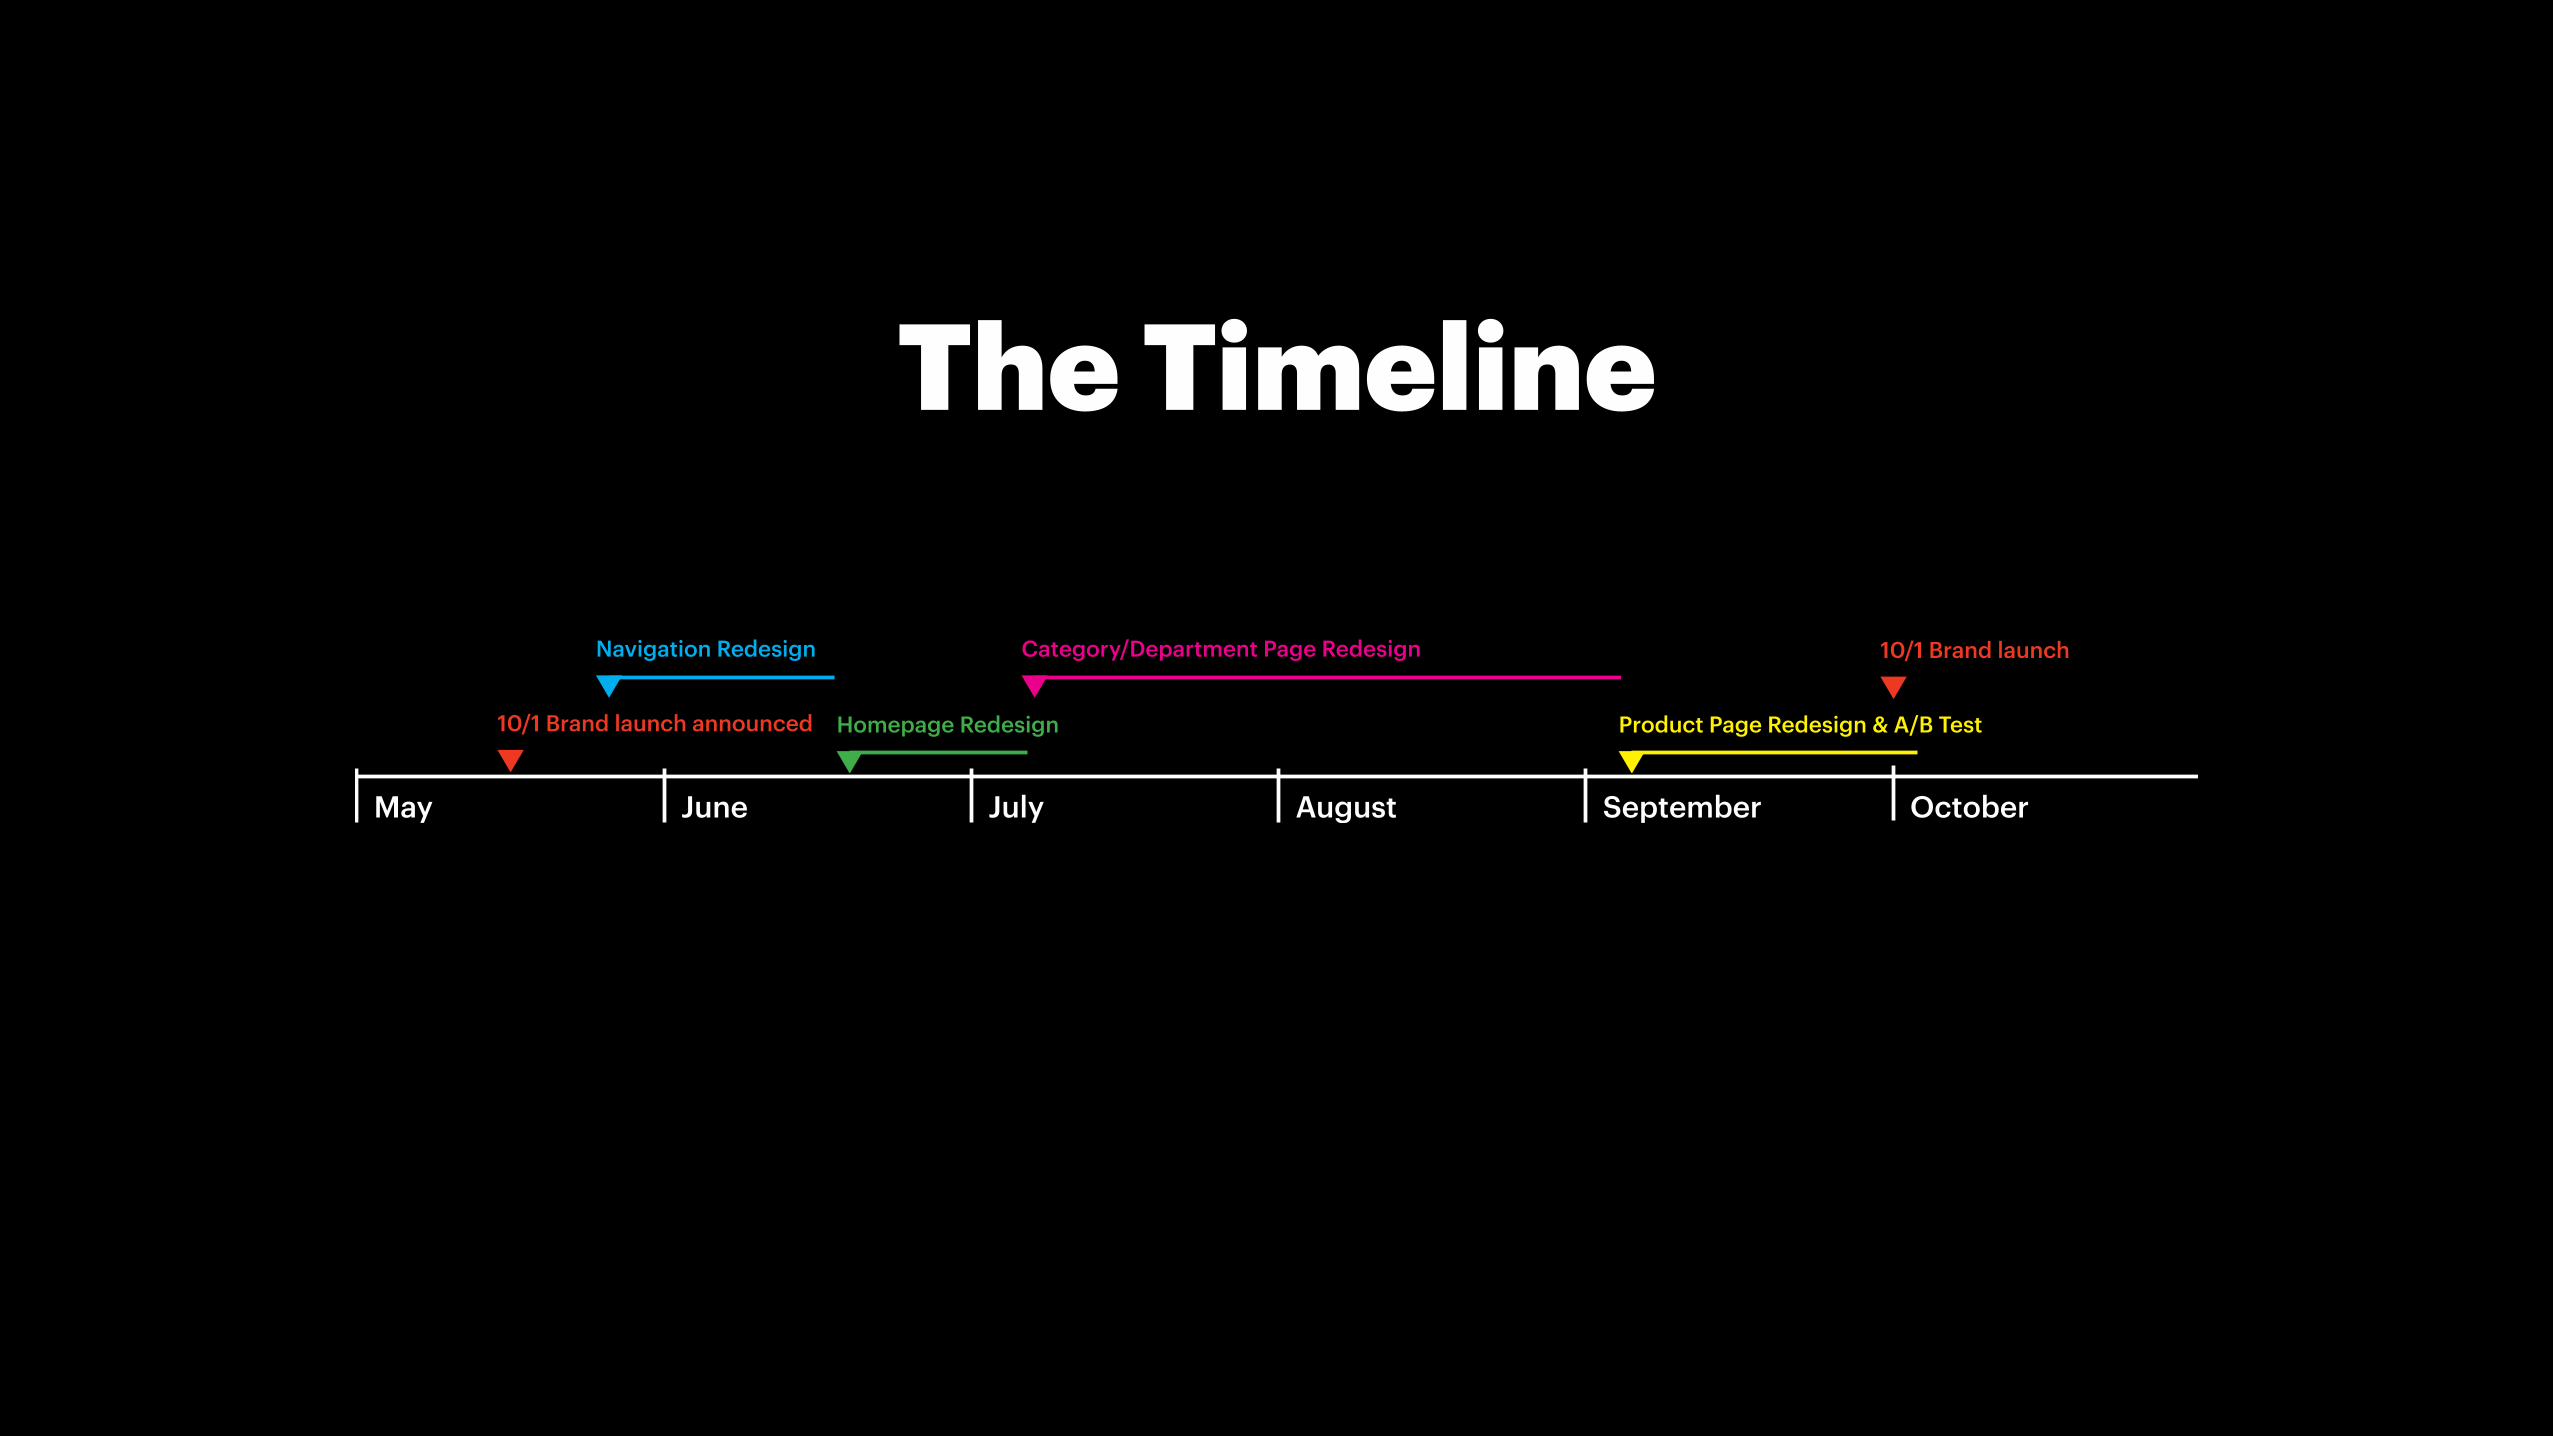
May June July August September October
10/1 Brand launch announced
10/1 Brand launchNavigation Redesign
Homepage Redesign
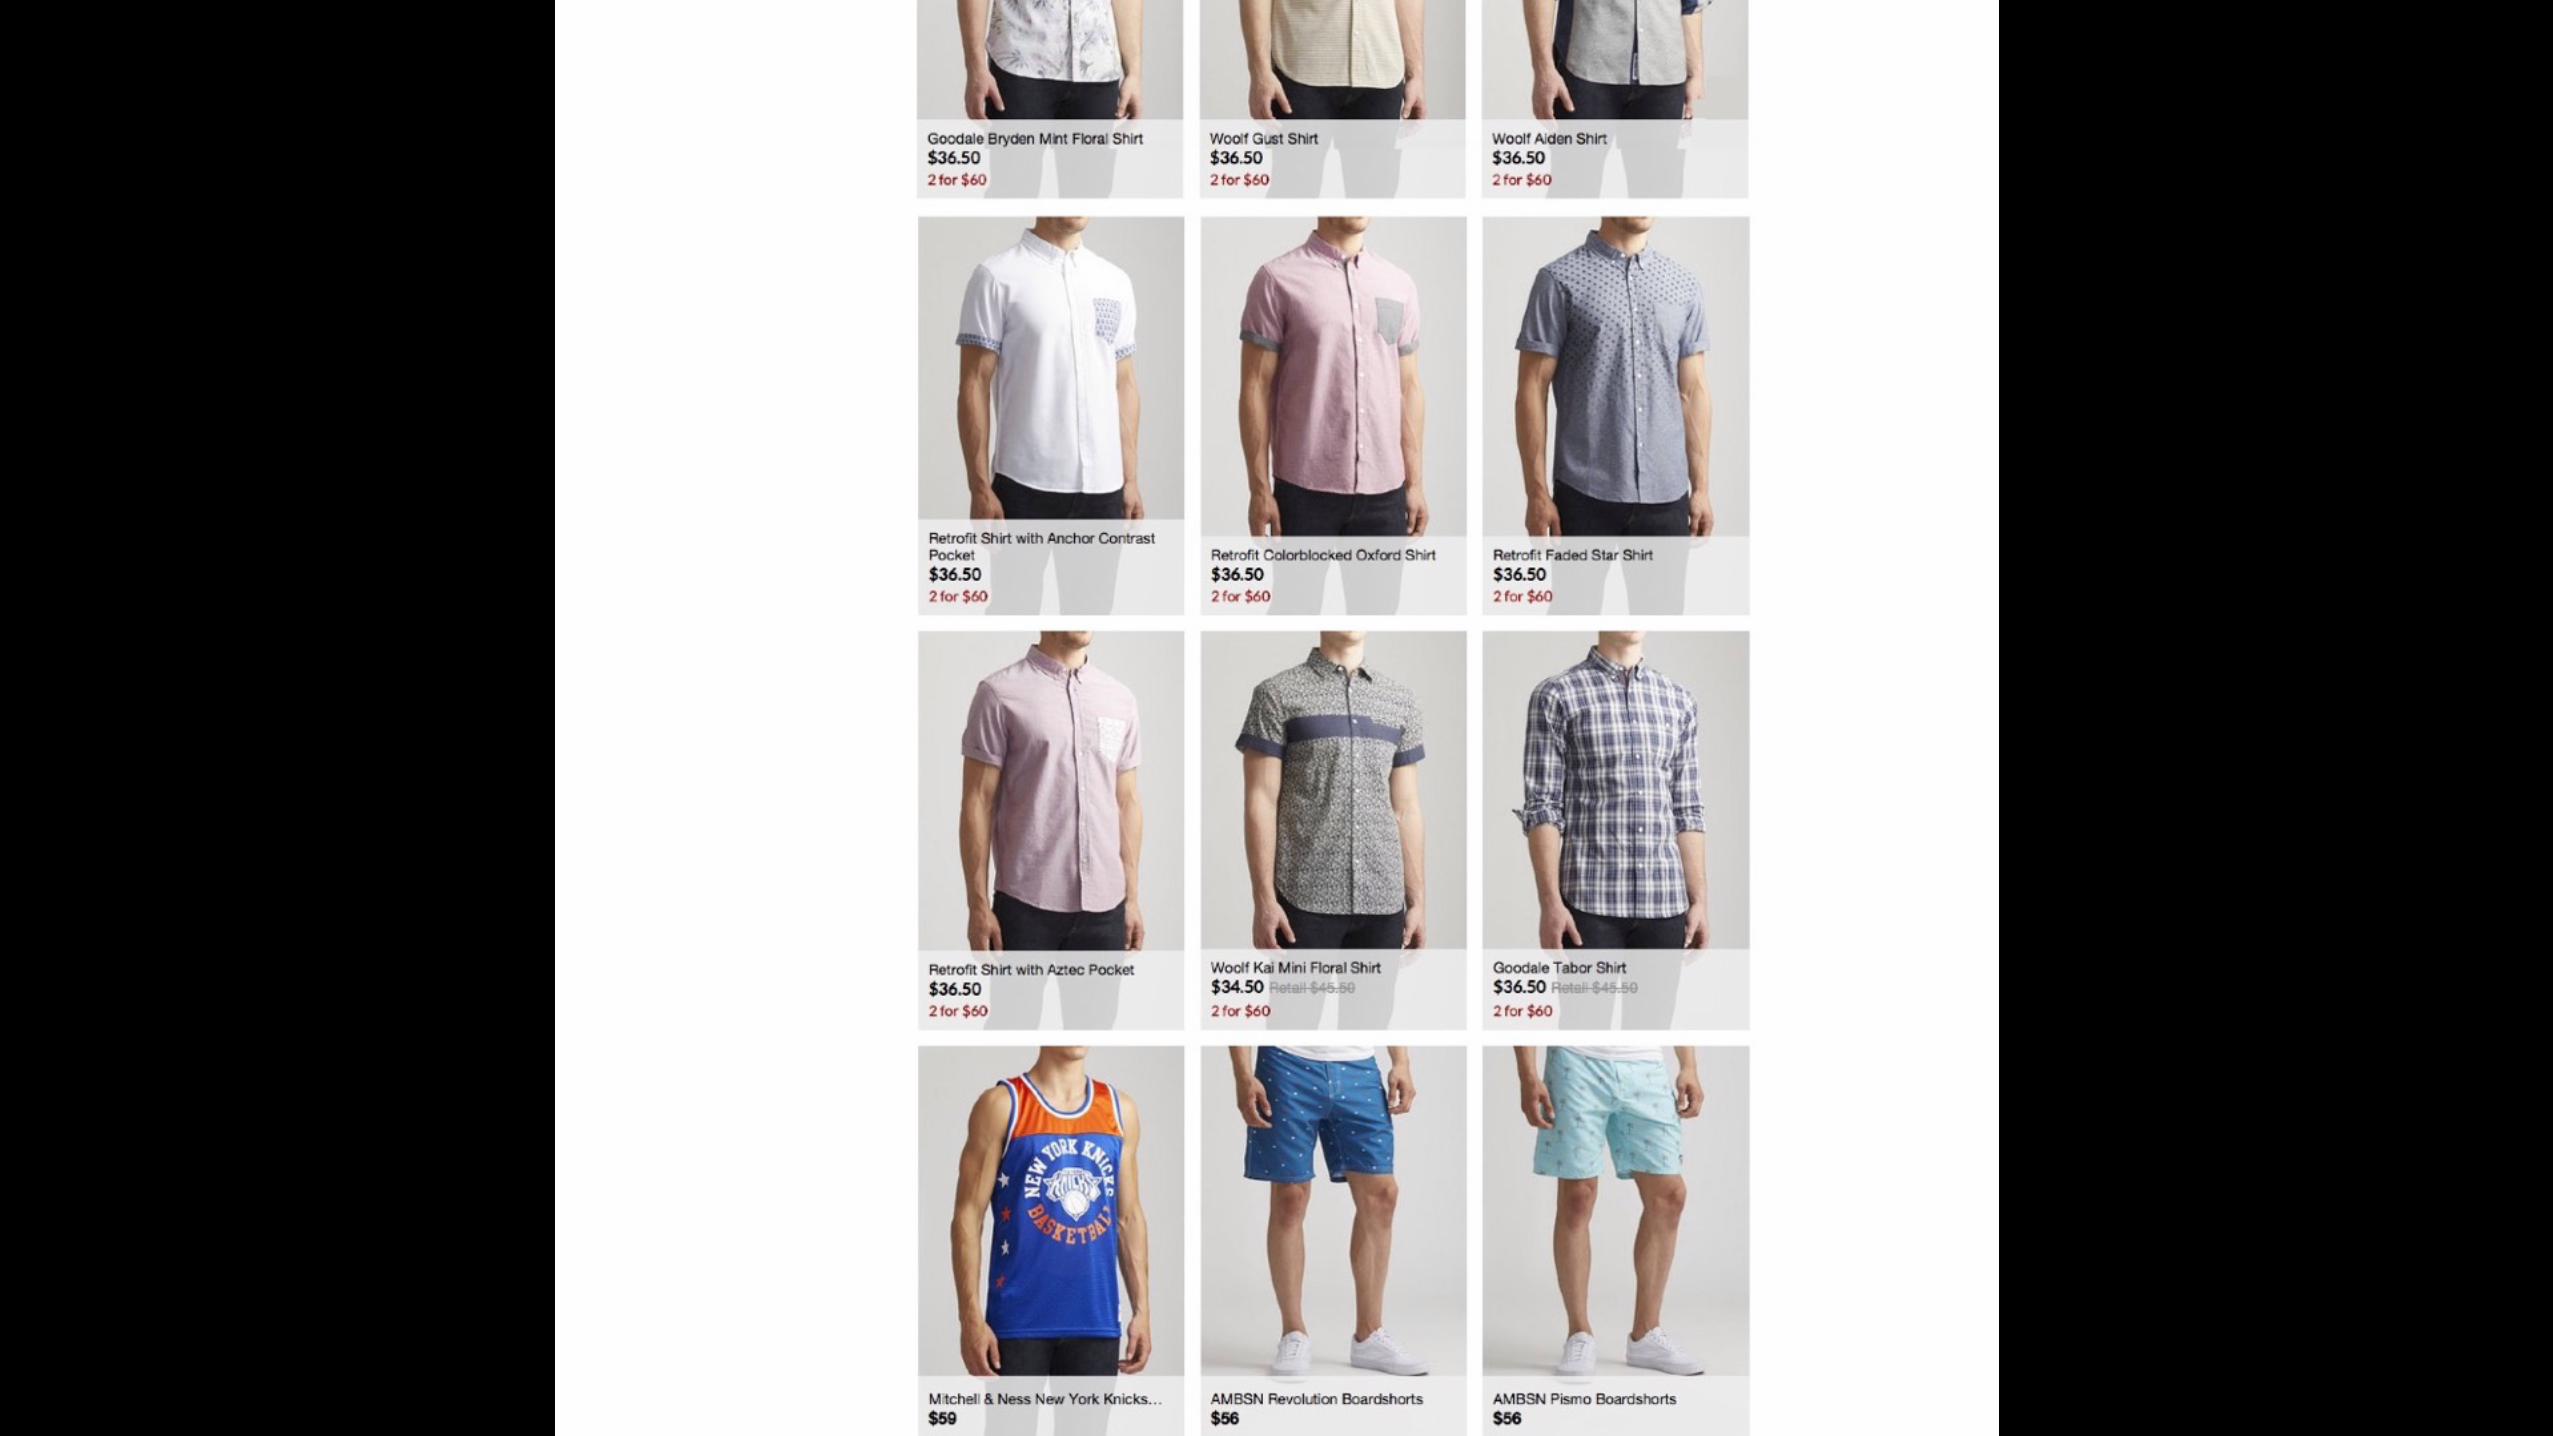
Category/Department Page Redesign
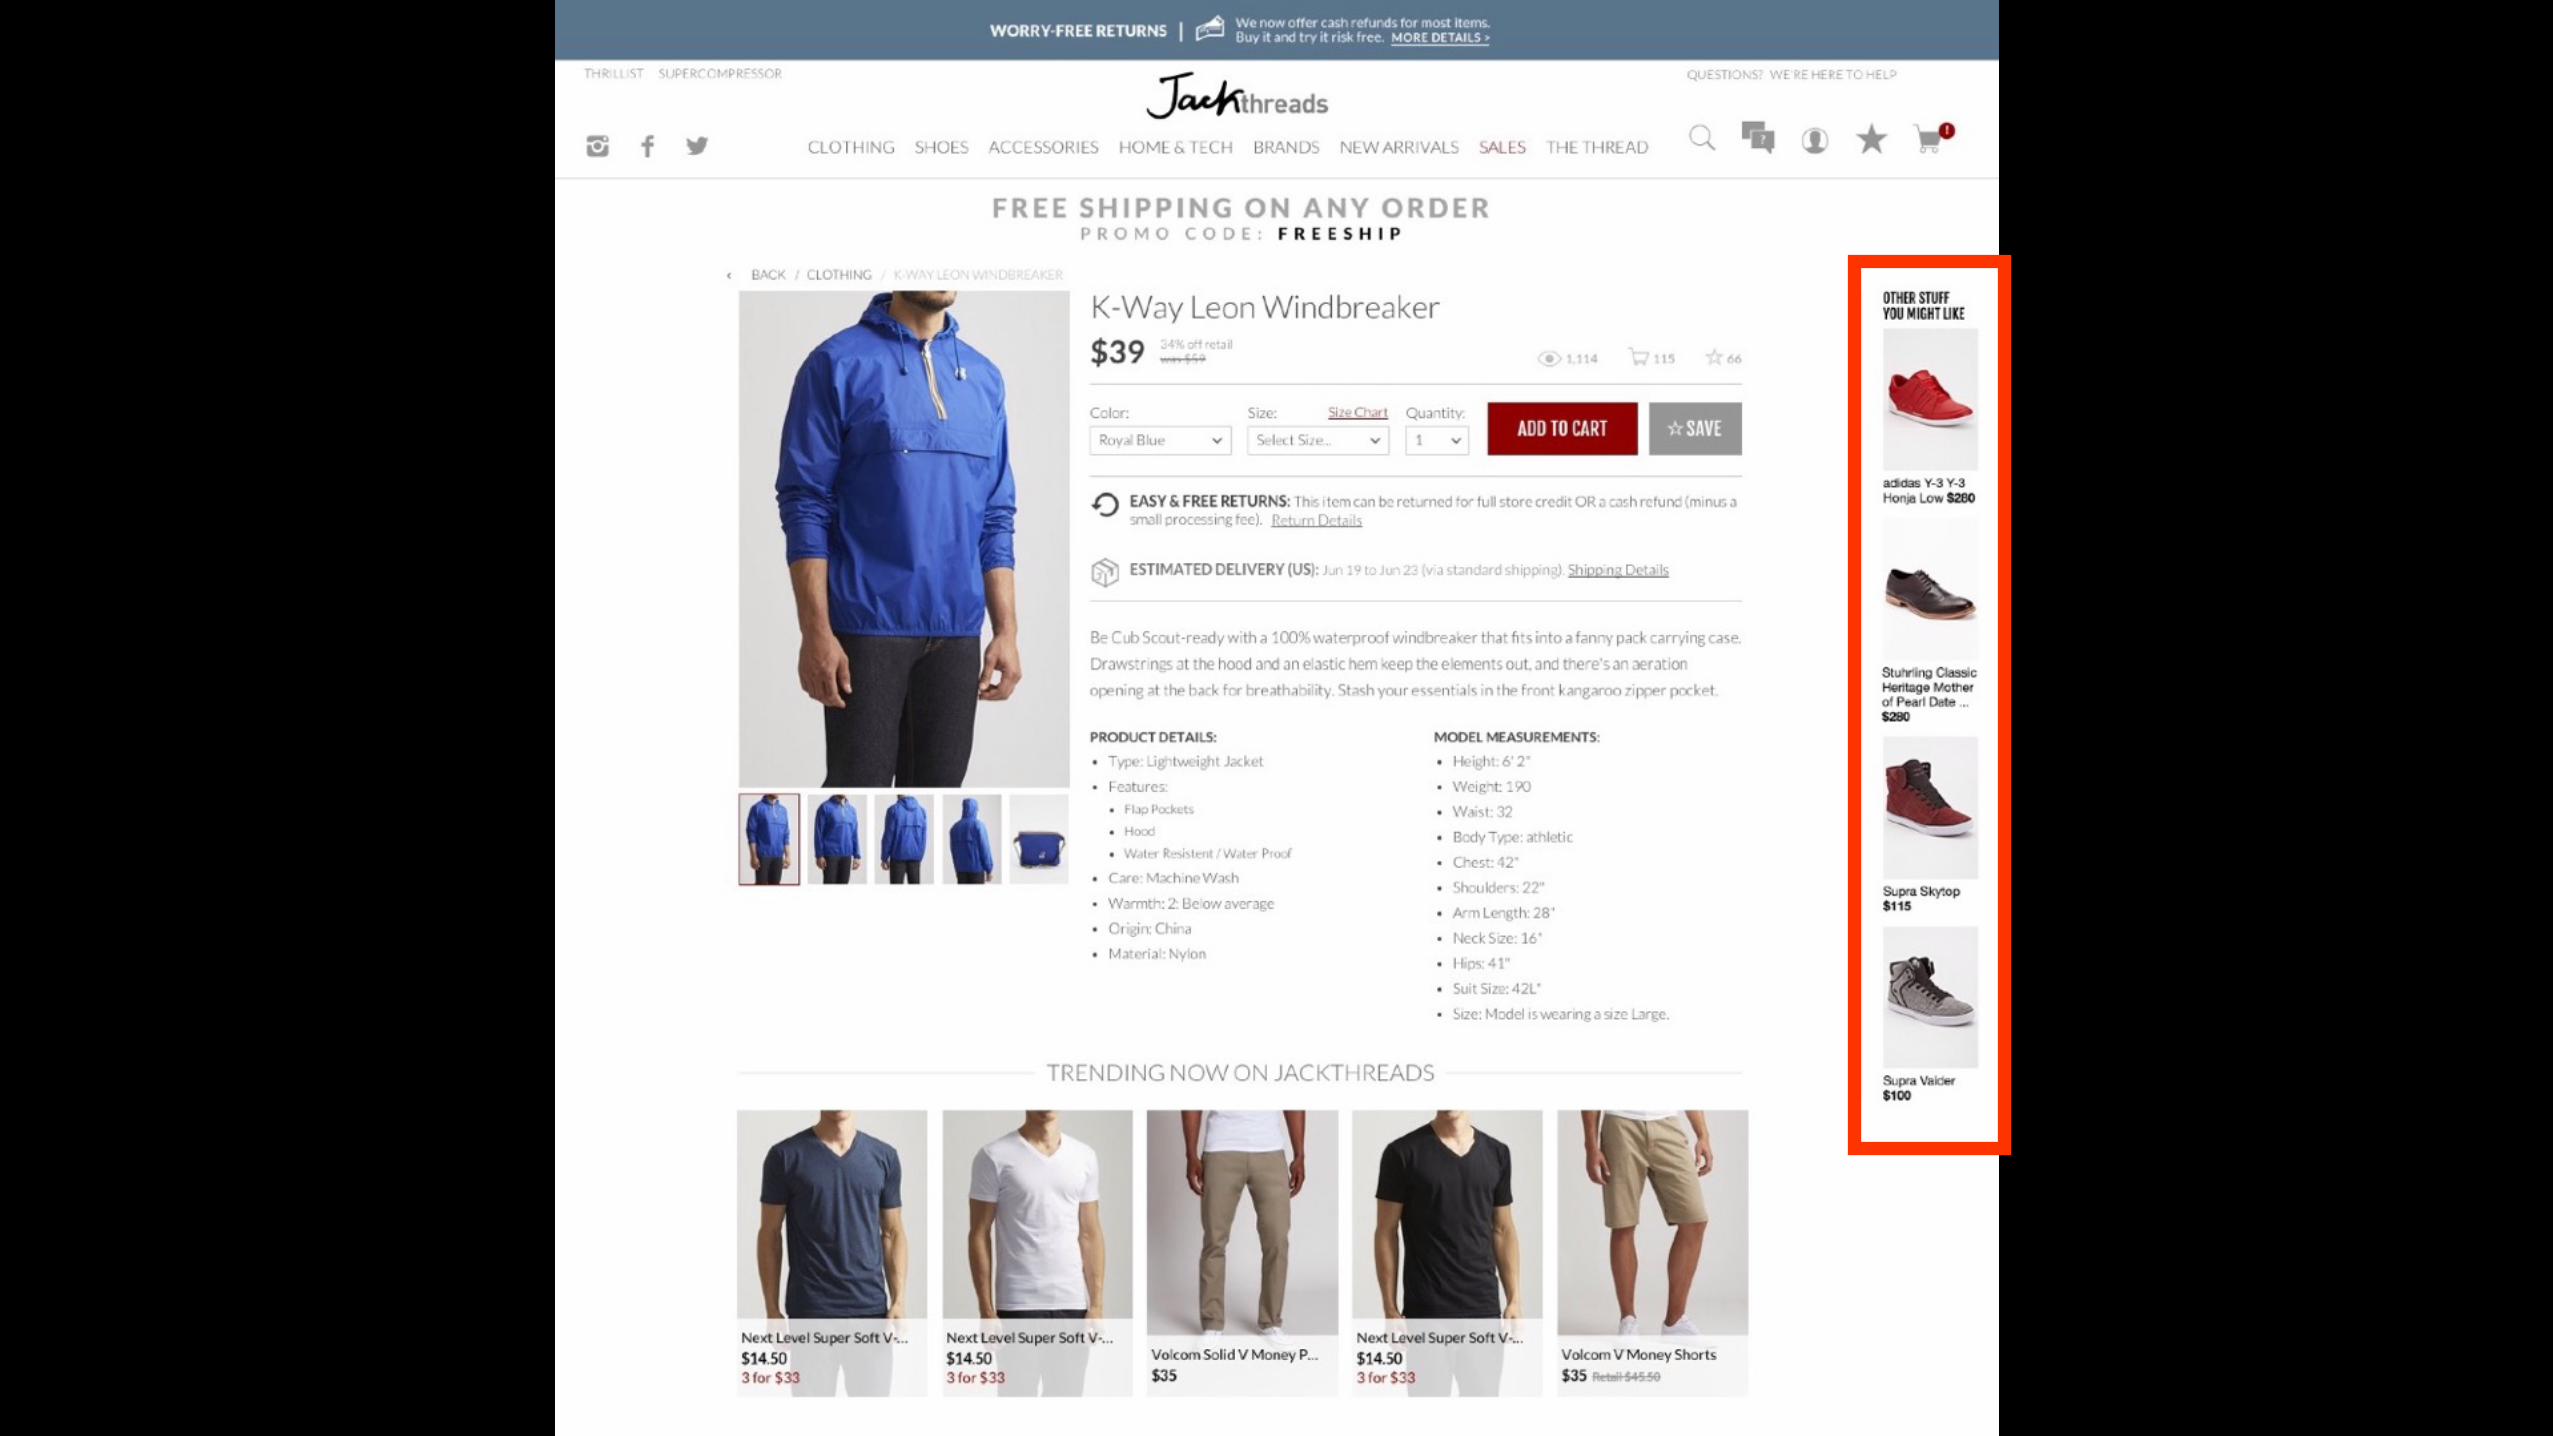
Product Page Redesign & A/B Test
The Timeline

Global Navigation Redesign Objective: Improve usability and increase usage of navigation.
Considerations: • New logo, font, and brand color being launched on 10/1 • Homepage redesign and category/department page
redesign projects will immediately follow this one
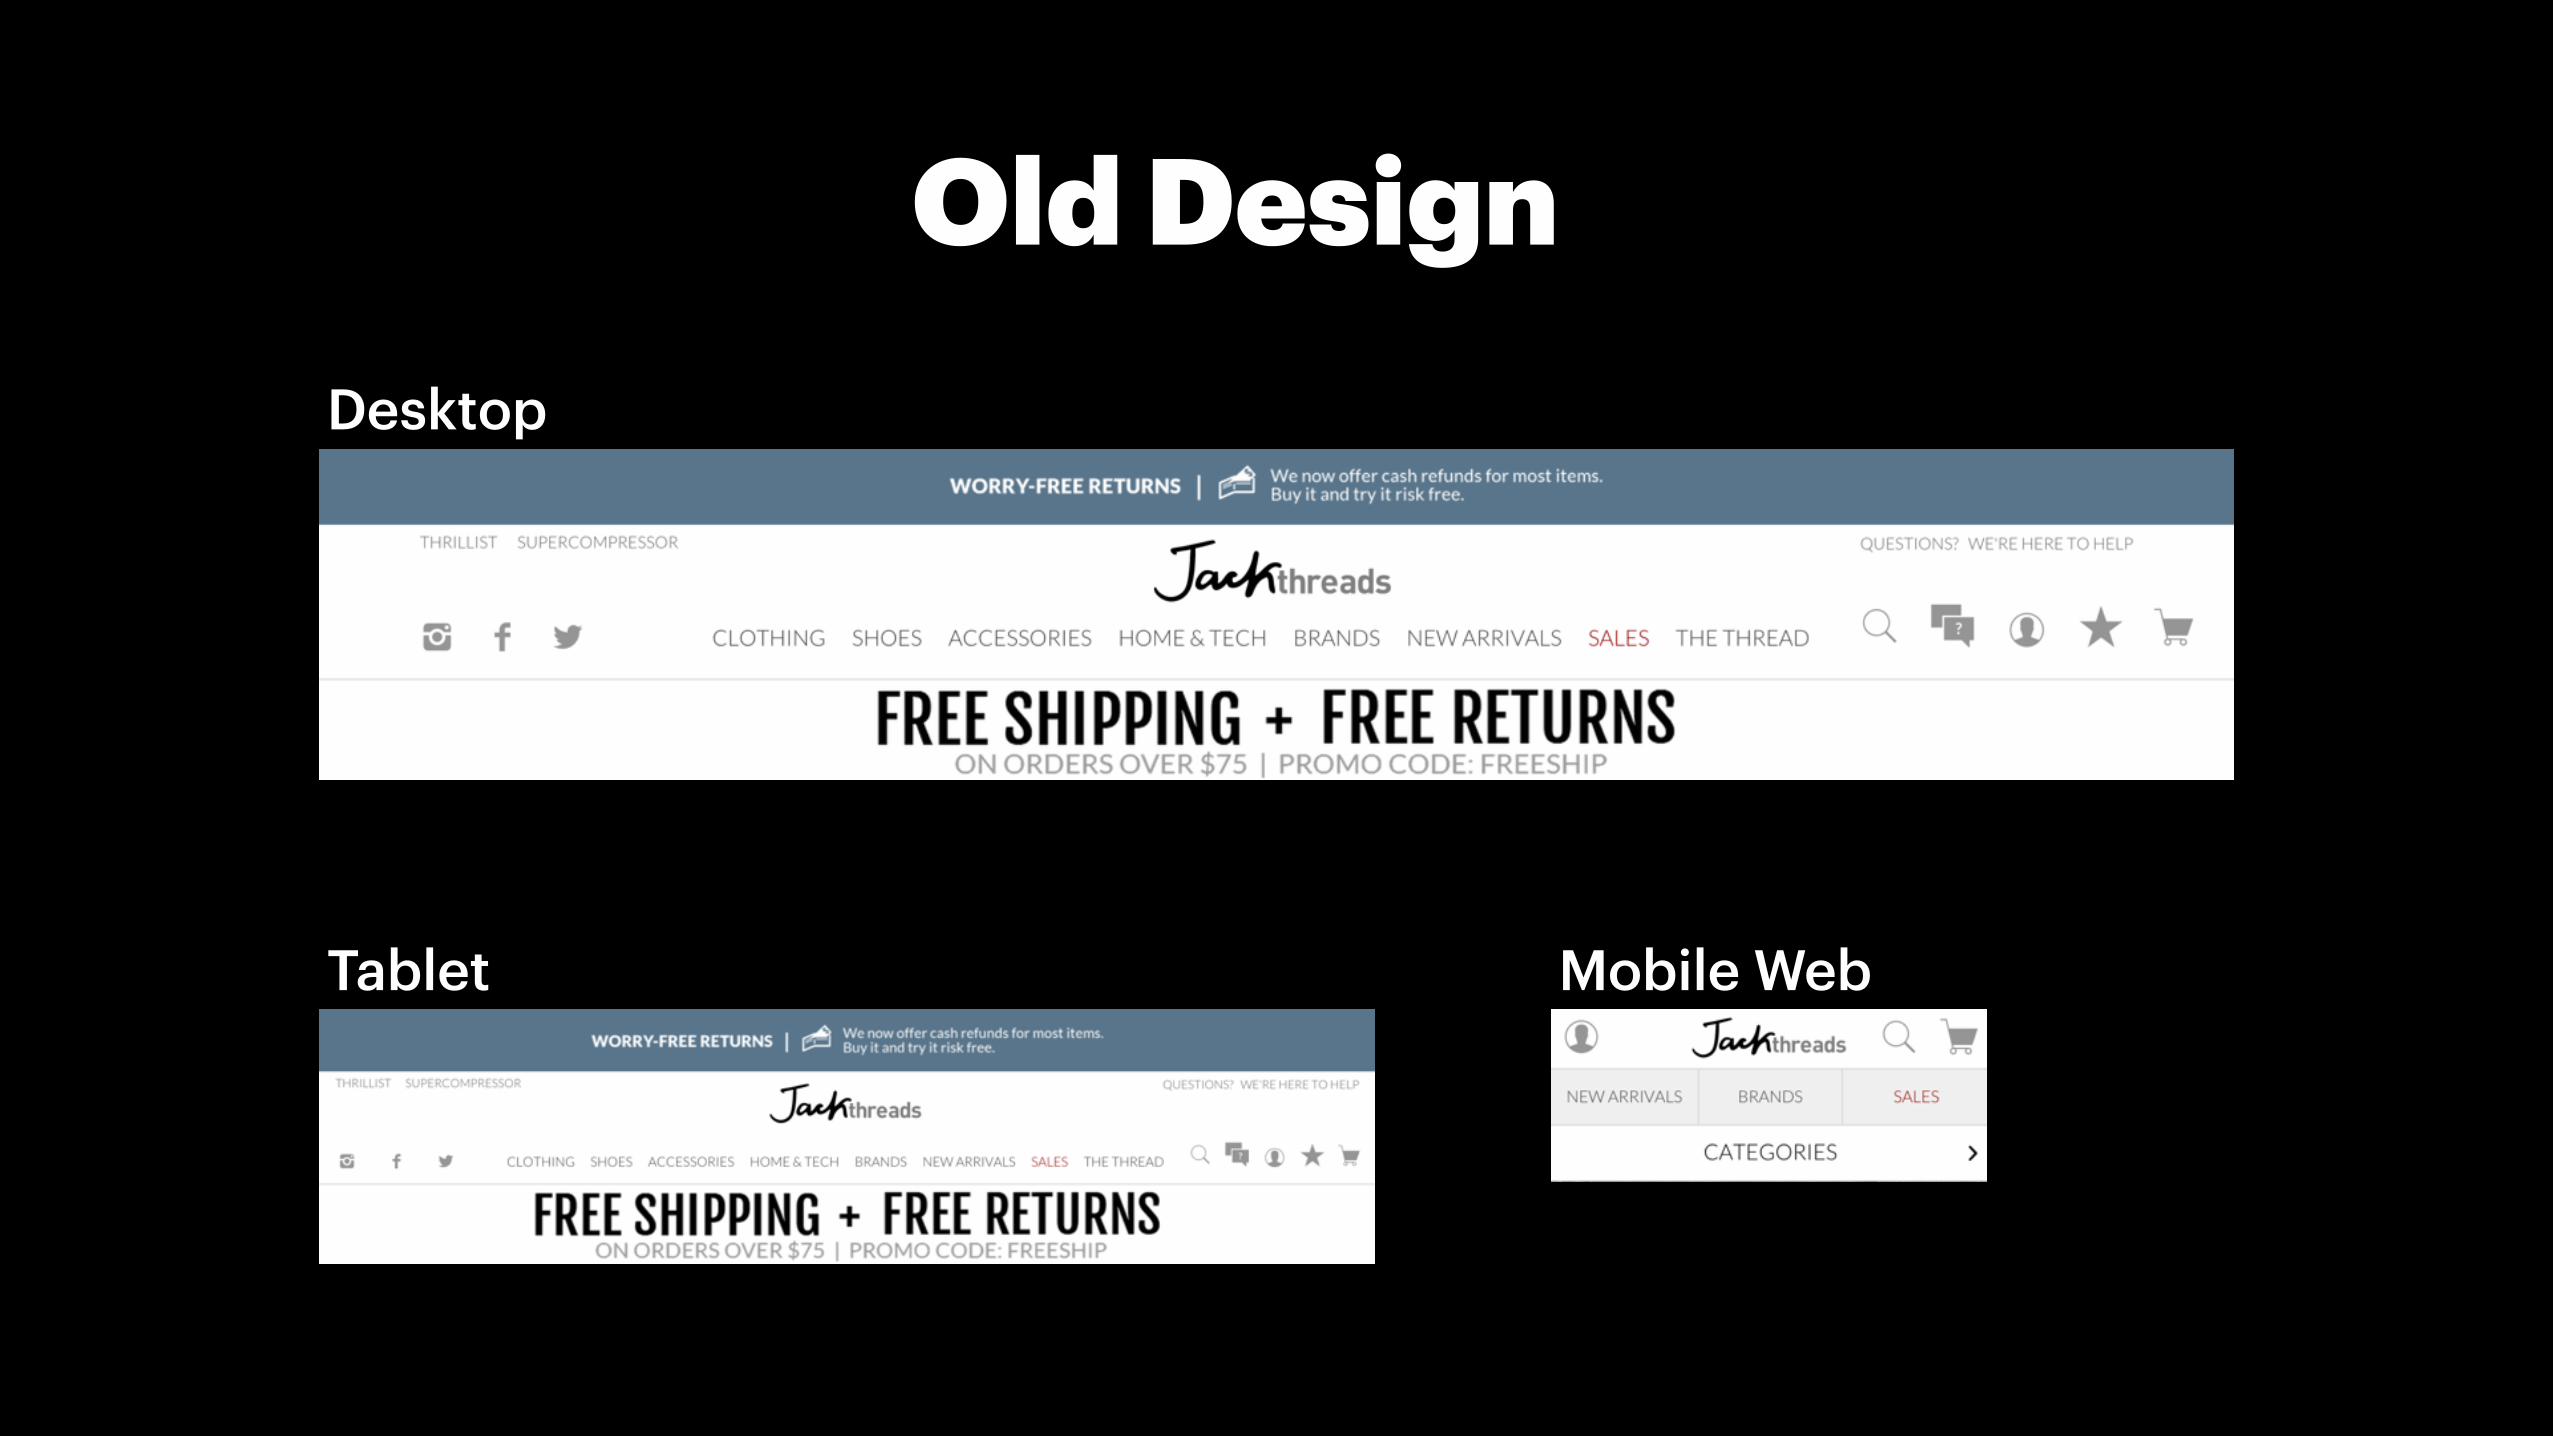
Desktop
Tablet Mobile Web
Old Design

EXTRA 20% OFF SITEWIDE 24 HOURS ONLY | PROMO CODE: 420
SOME EXCLUSIONS APPLY*
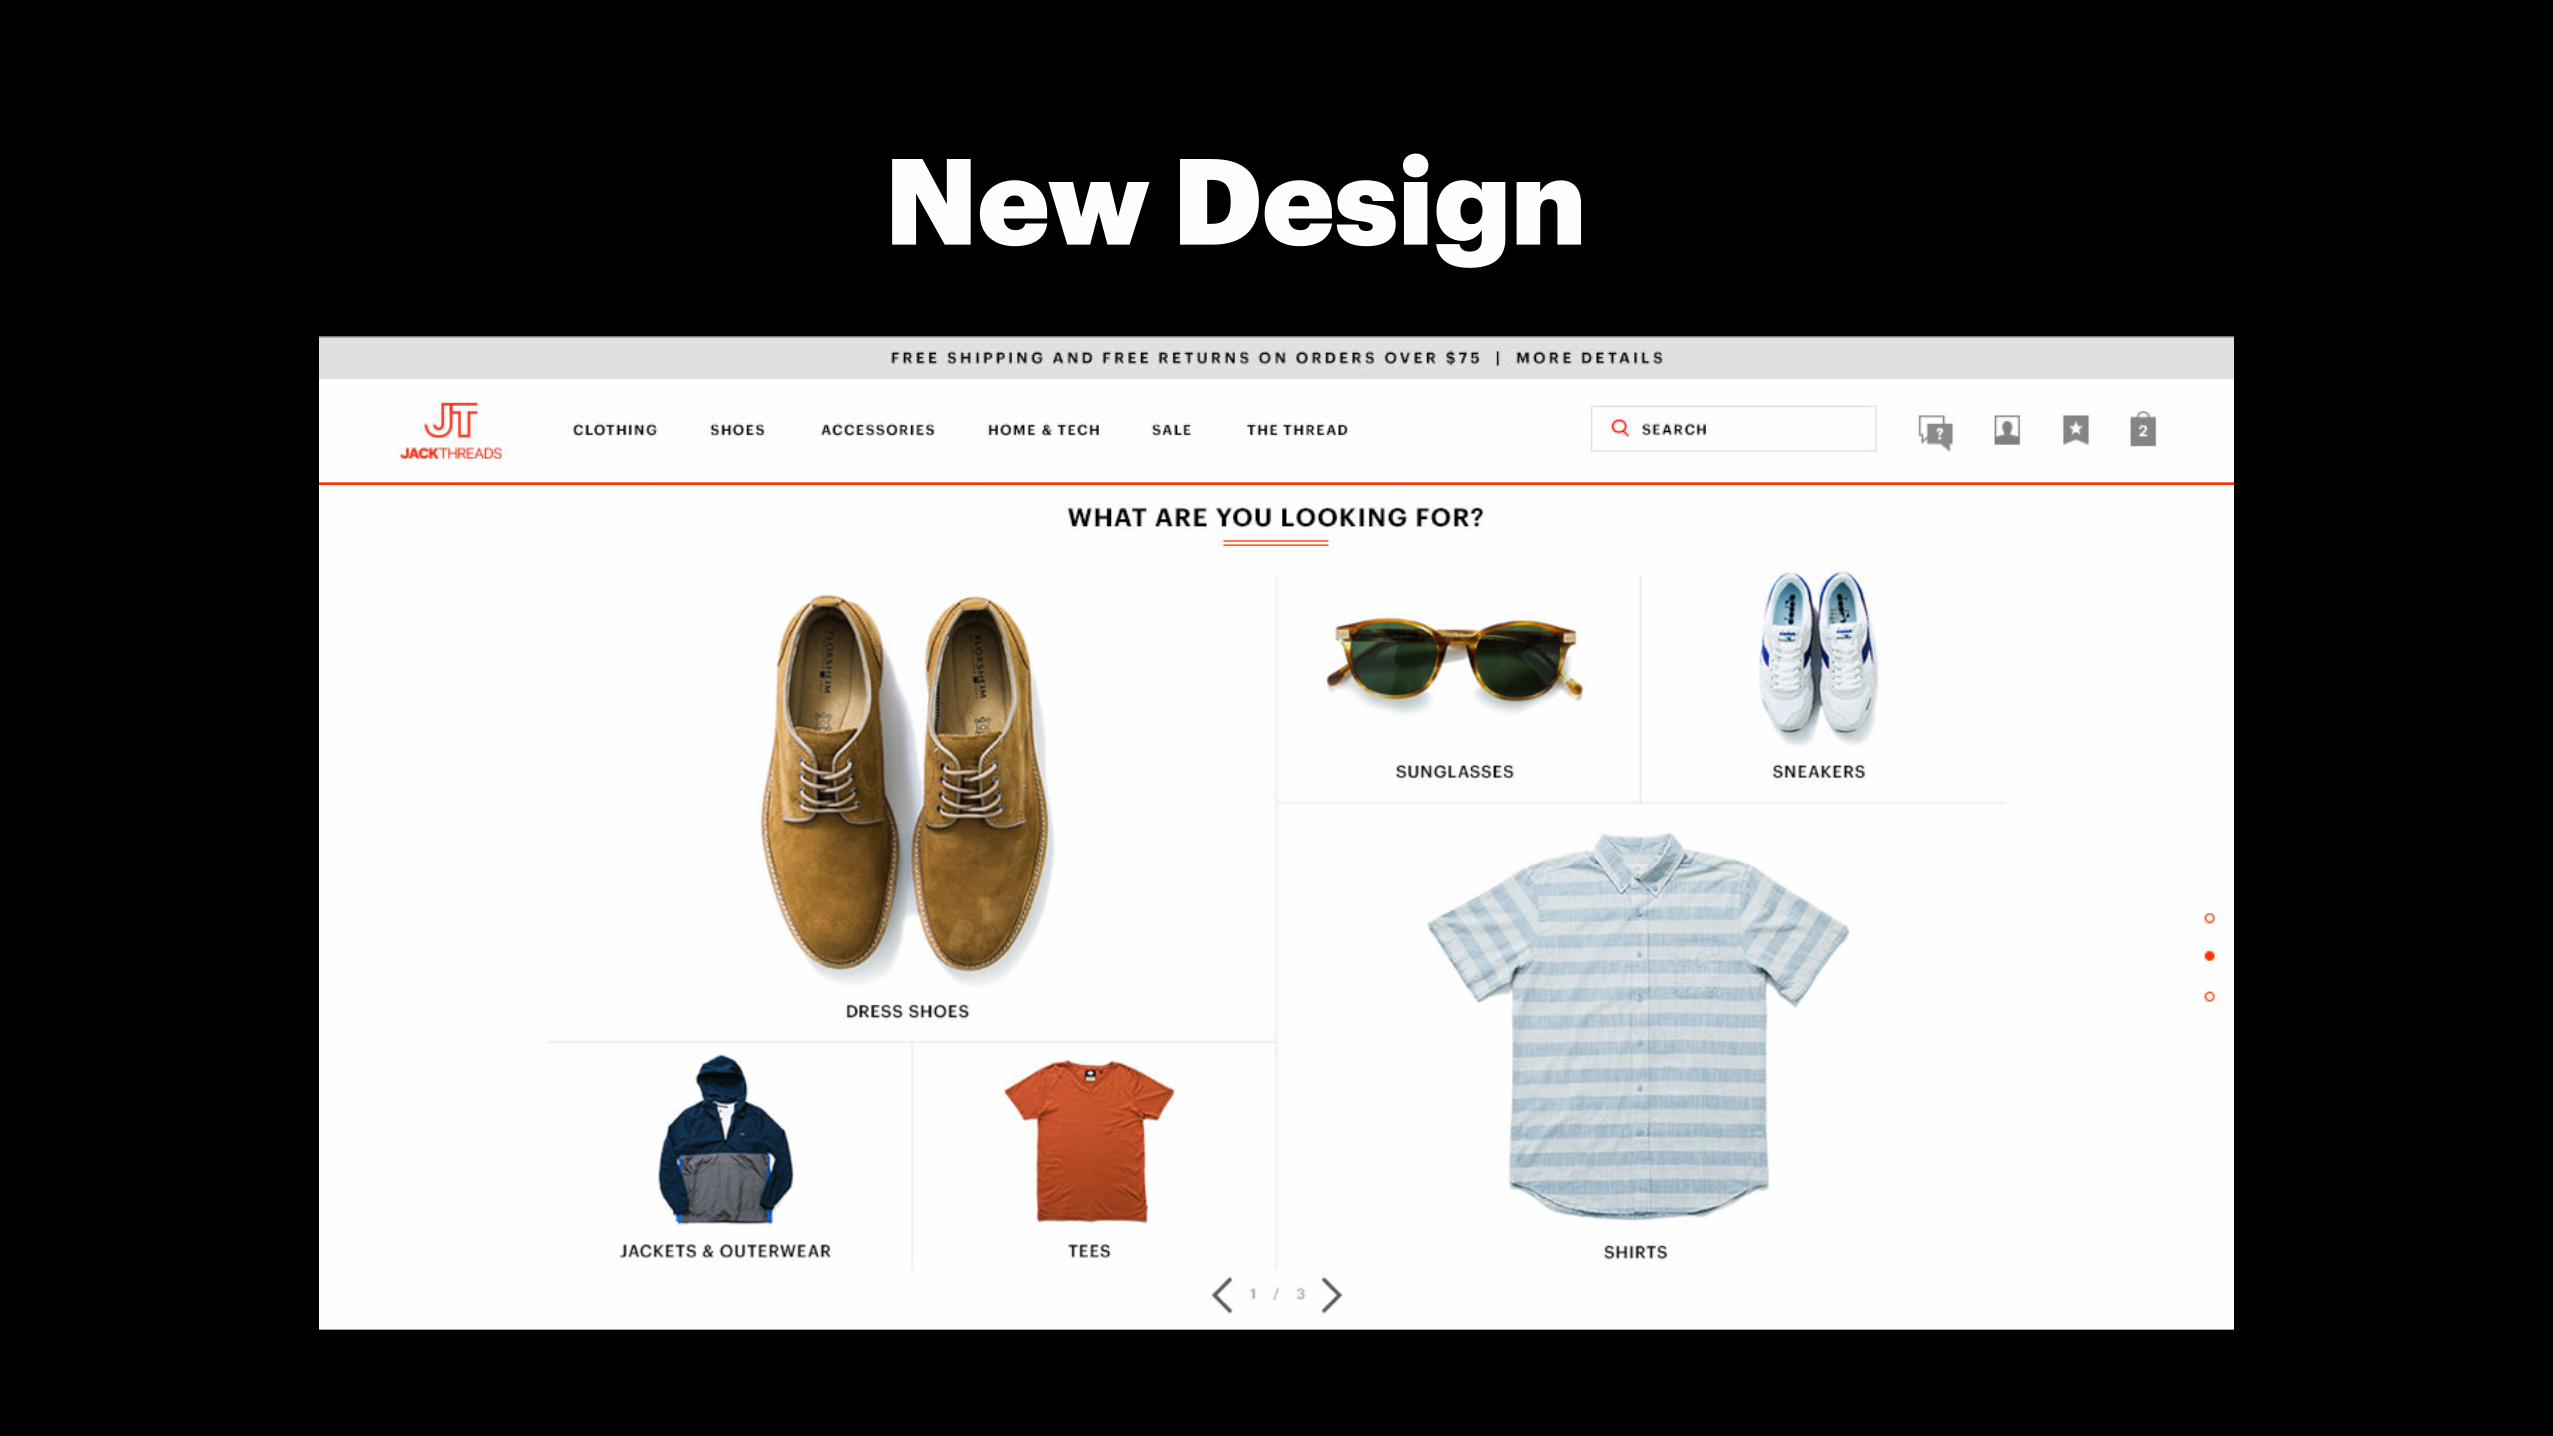
Desktop
Tablet Mobile Web
New Design
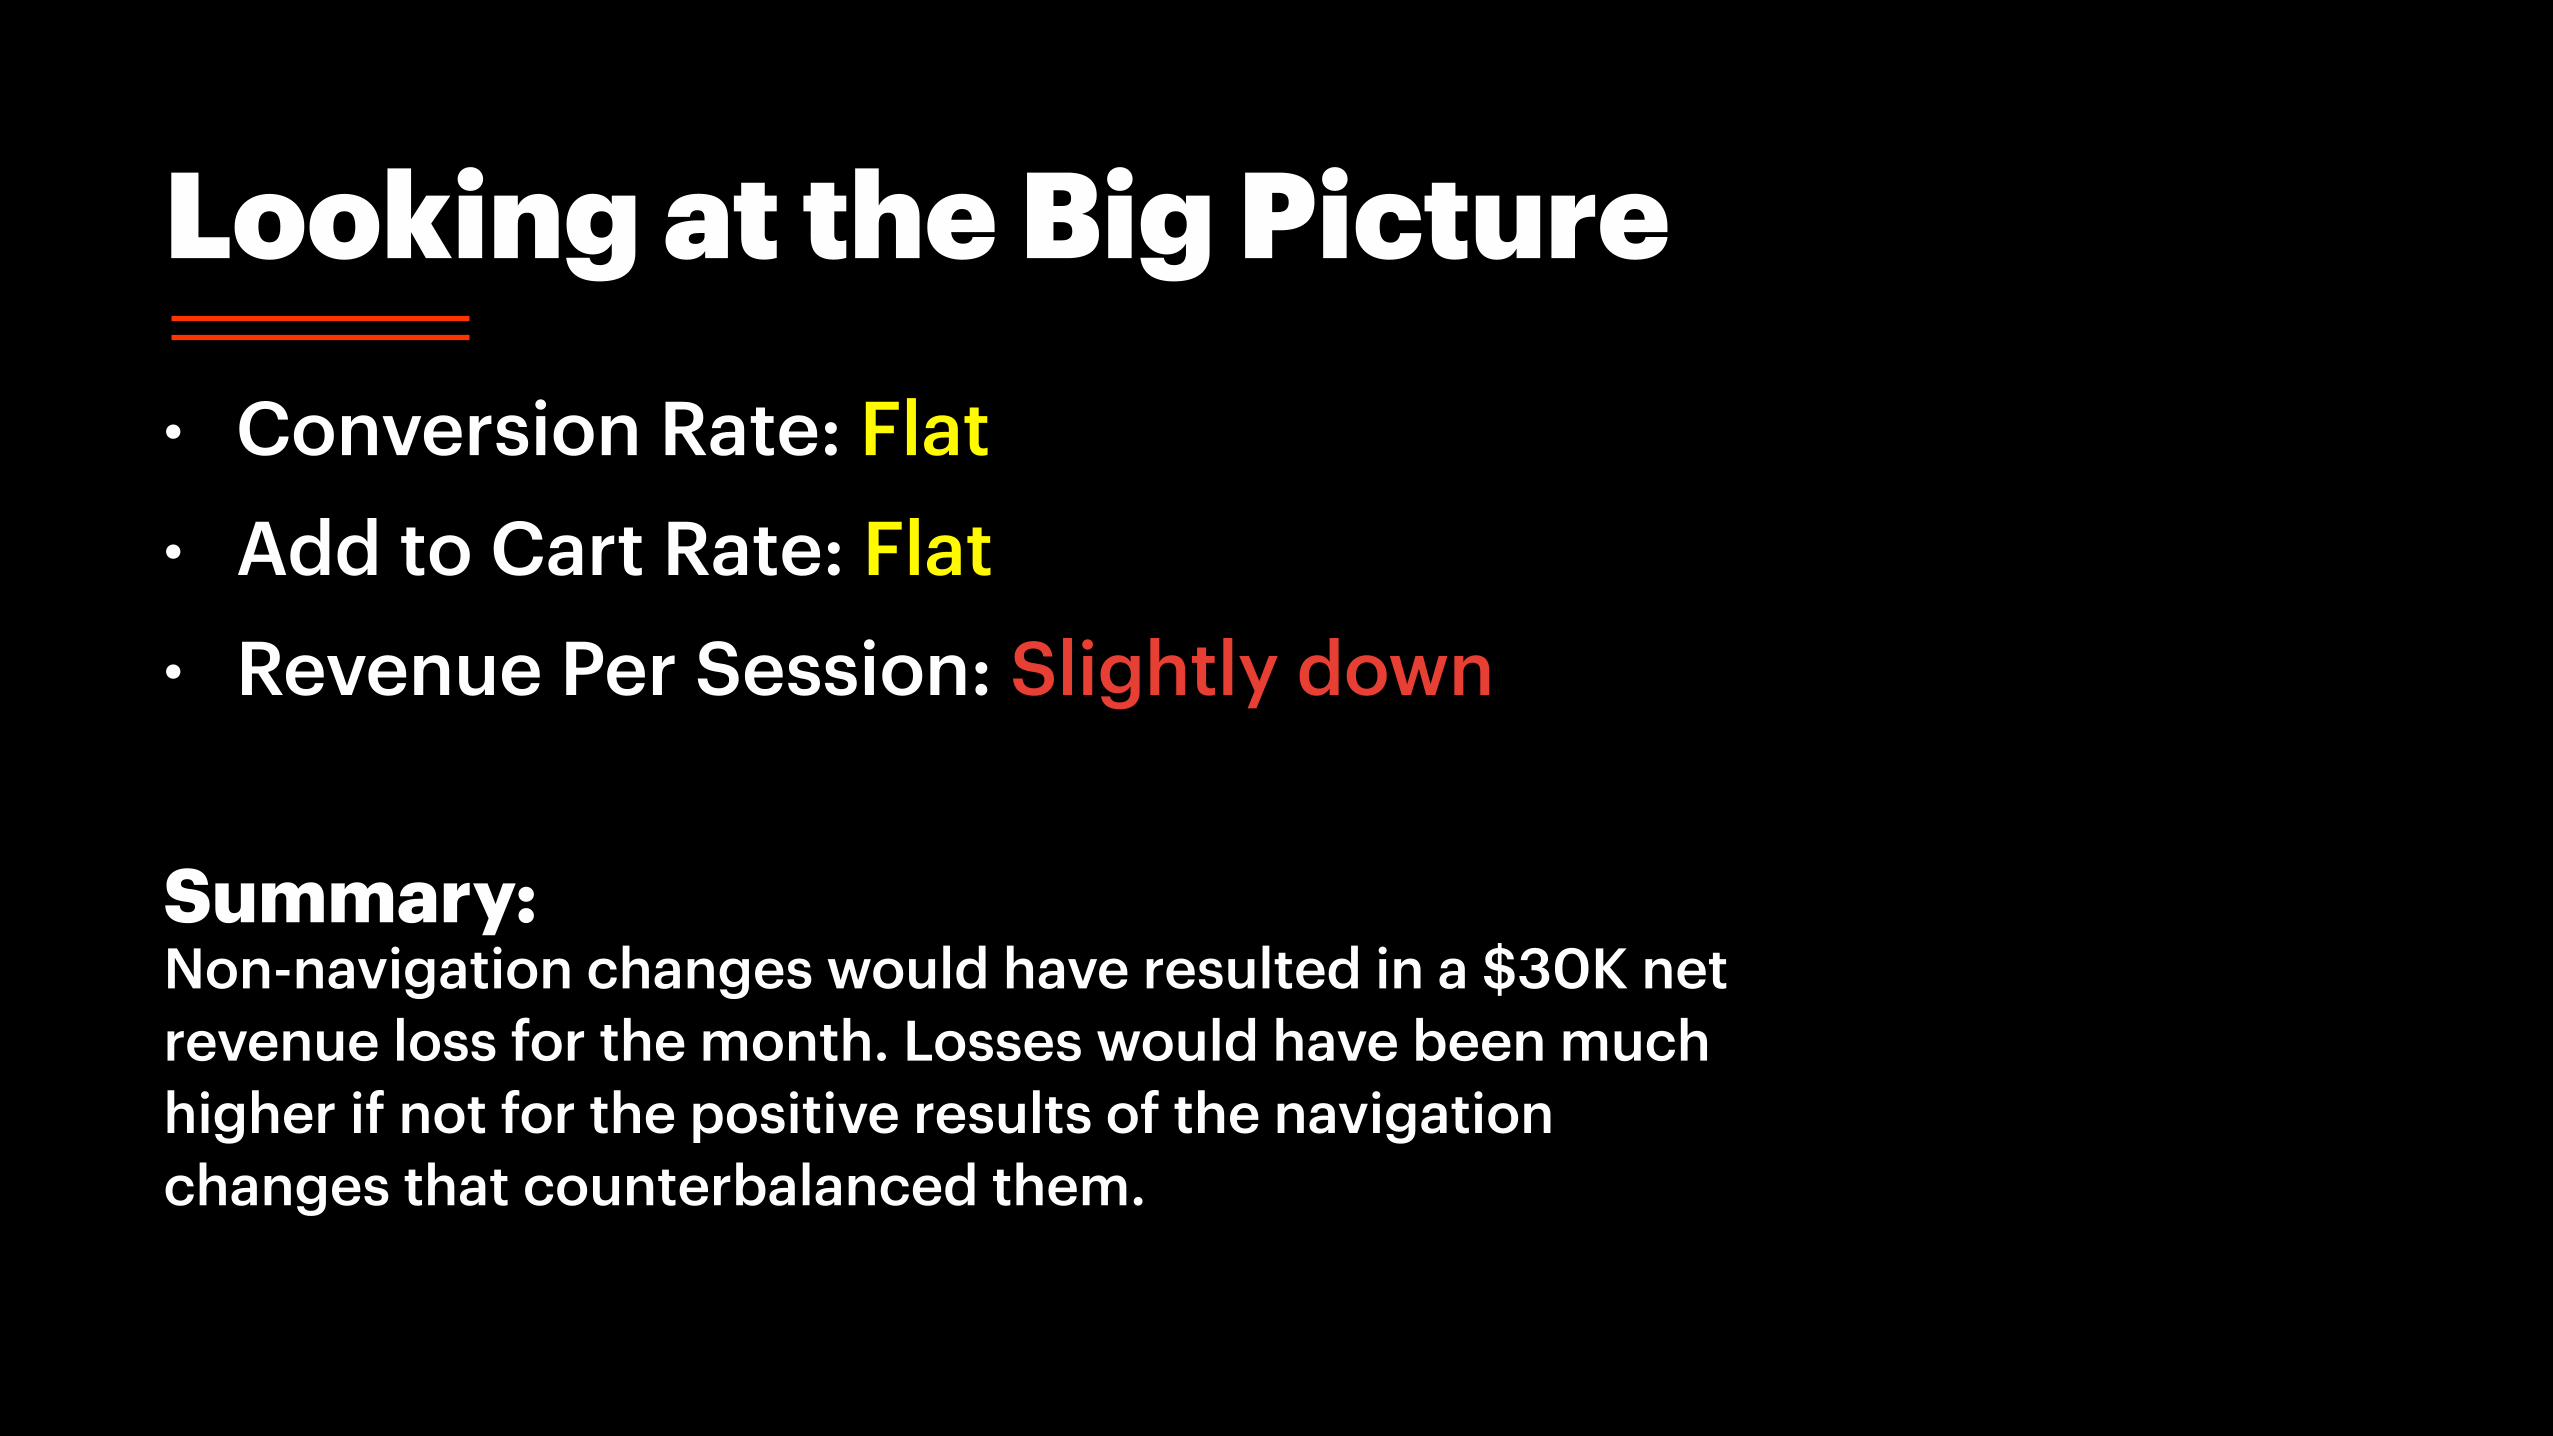
Summary: Non-navigation changes would have resulted in a $30K net revenue loss for the month. Losses would have been much higher if not for the positive results of the navigation changes that counterbalanced them.
Looking at the Big Picture • Conversion Rate: Flat • Add to Cart Rate: Flat • Revenue Per Session: Slightly down

Colorgate Test
Conversion Rate: 4% higher
Per Session Value: 3% higher
Revenue Estimate for the Month: $50K increase
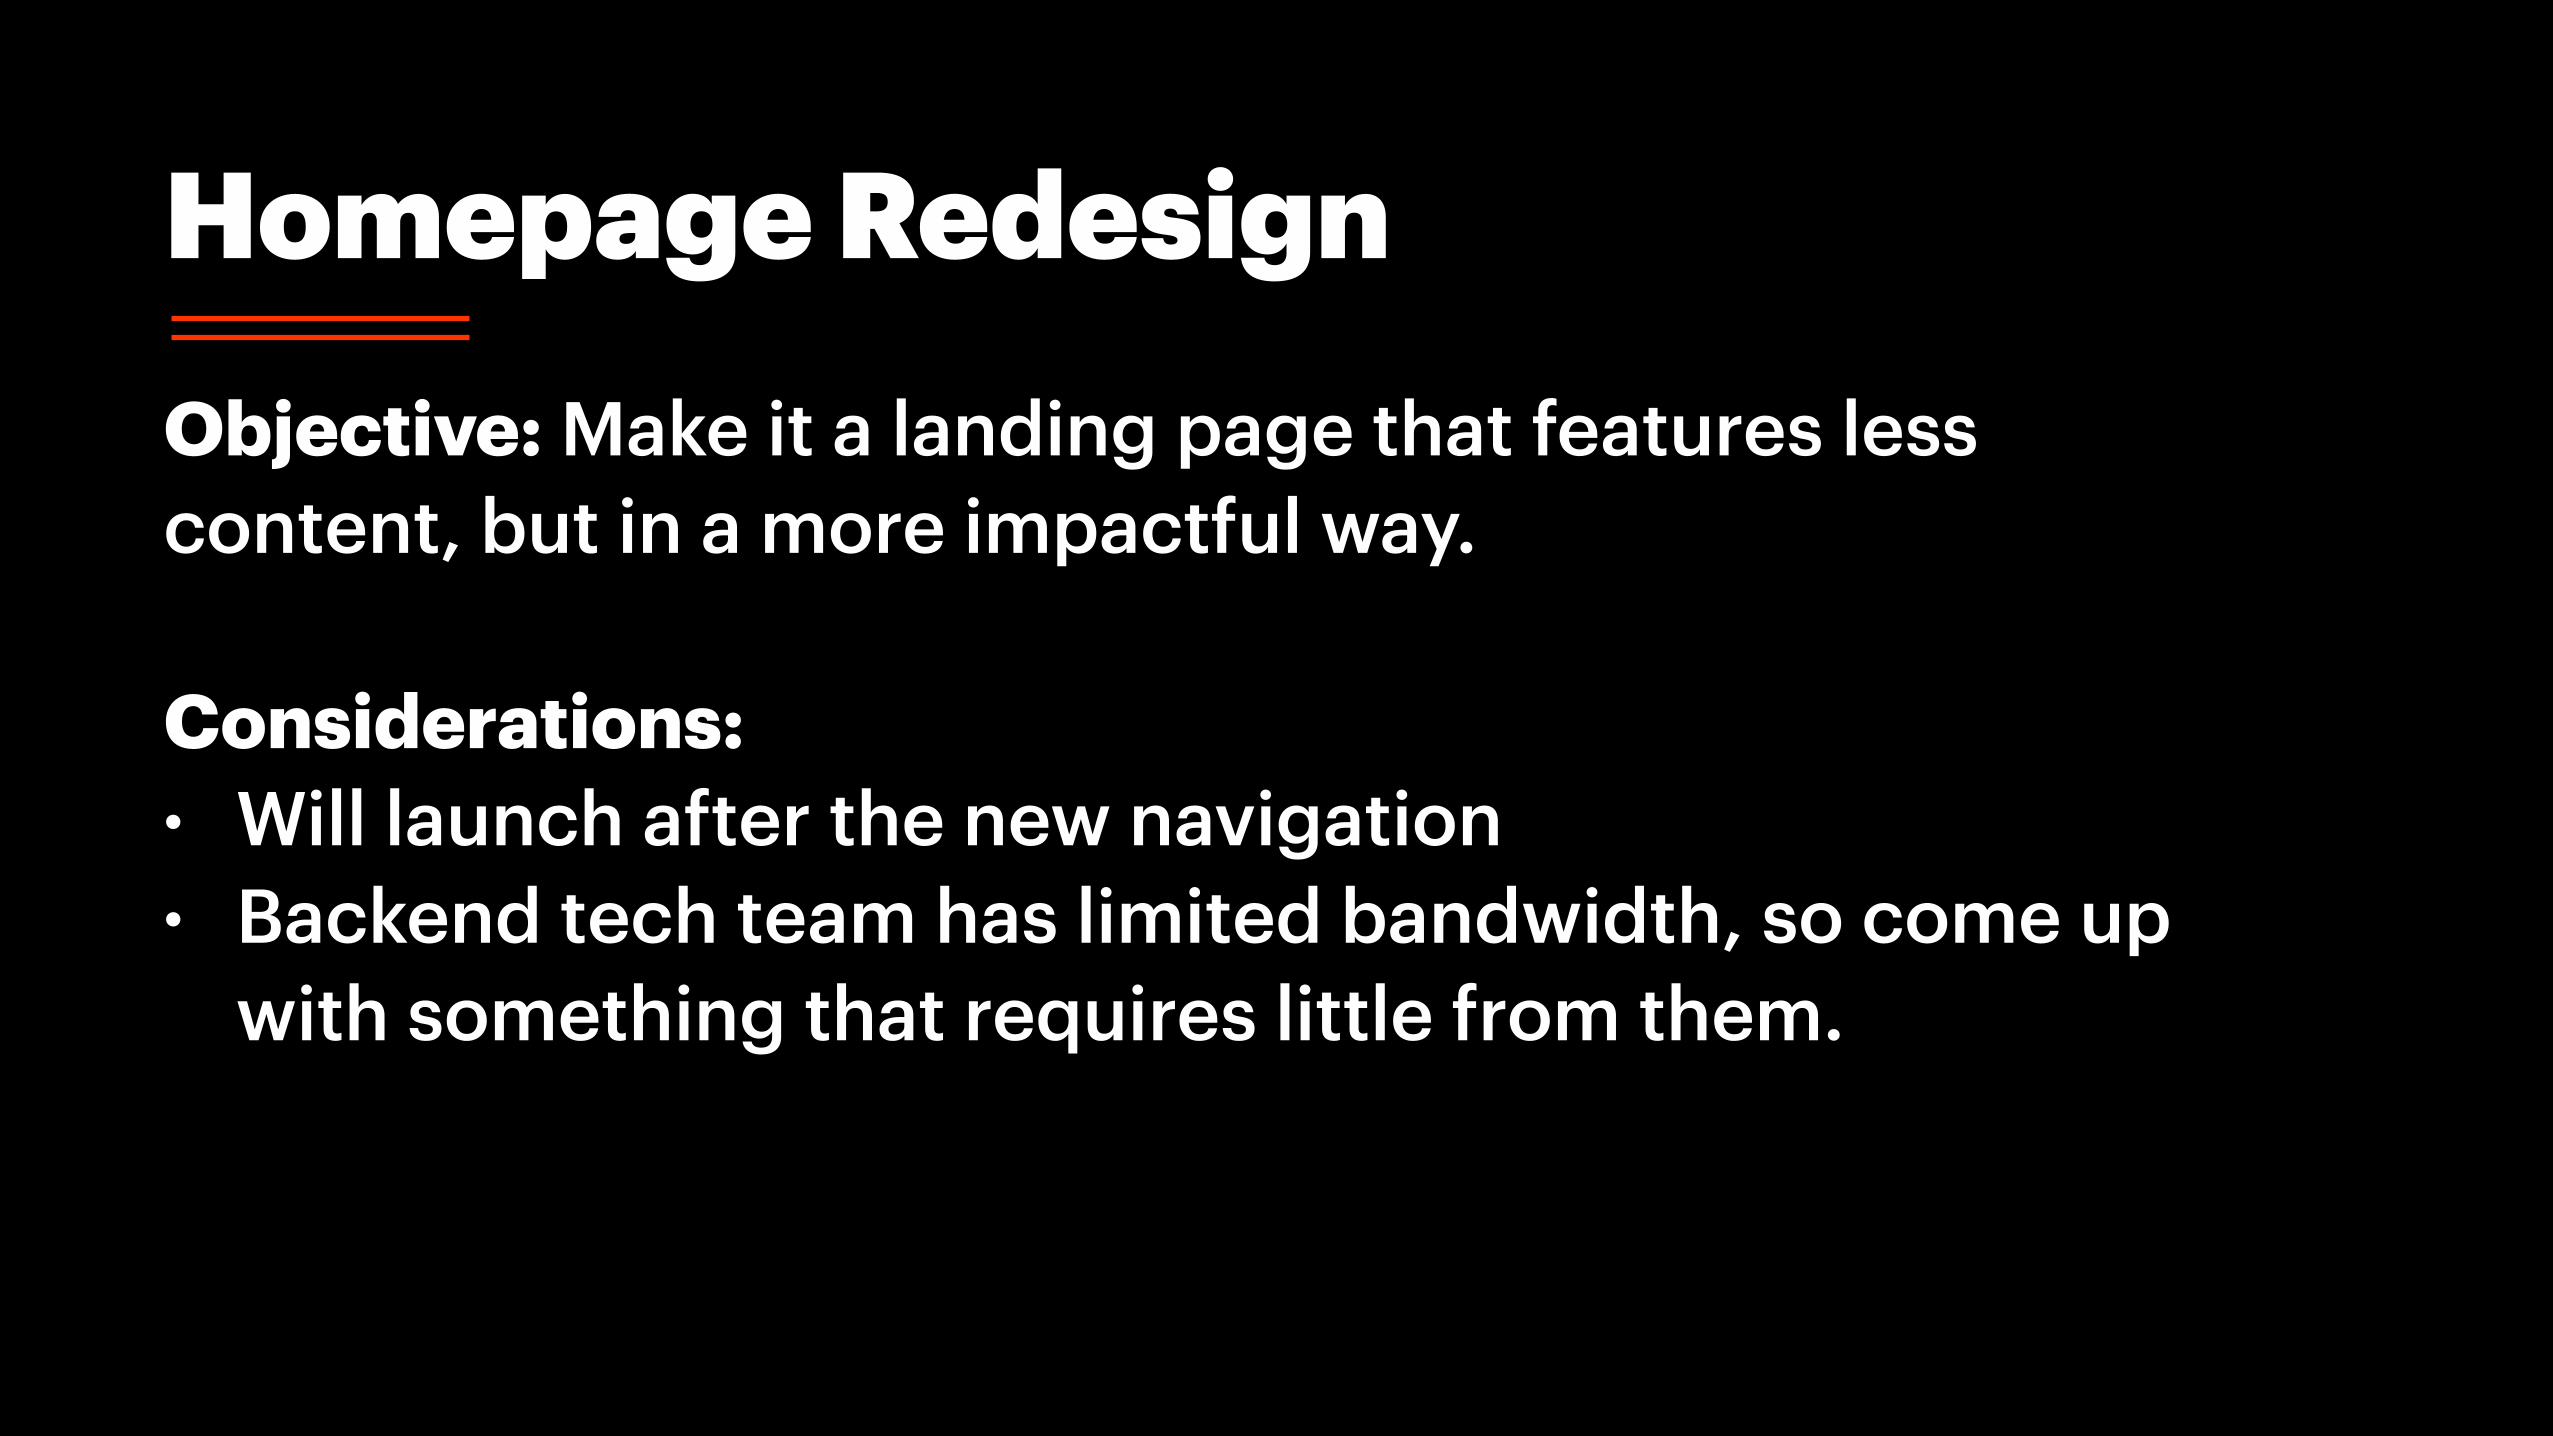
Homepage Redesign Objective: Make it a landing page that features less content, but in a more impactful way.
Considerations: • Will launch after the new navigation • Backend tech team has limited bandwidth, so come up
with something that requires little from them.
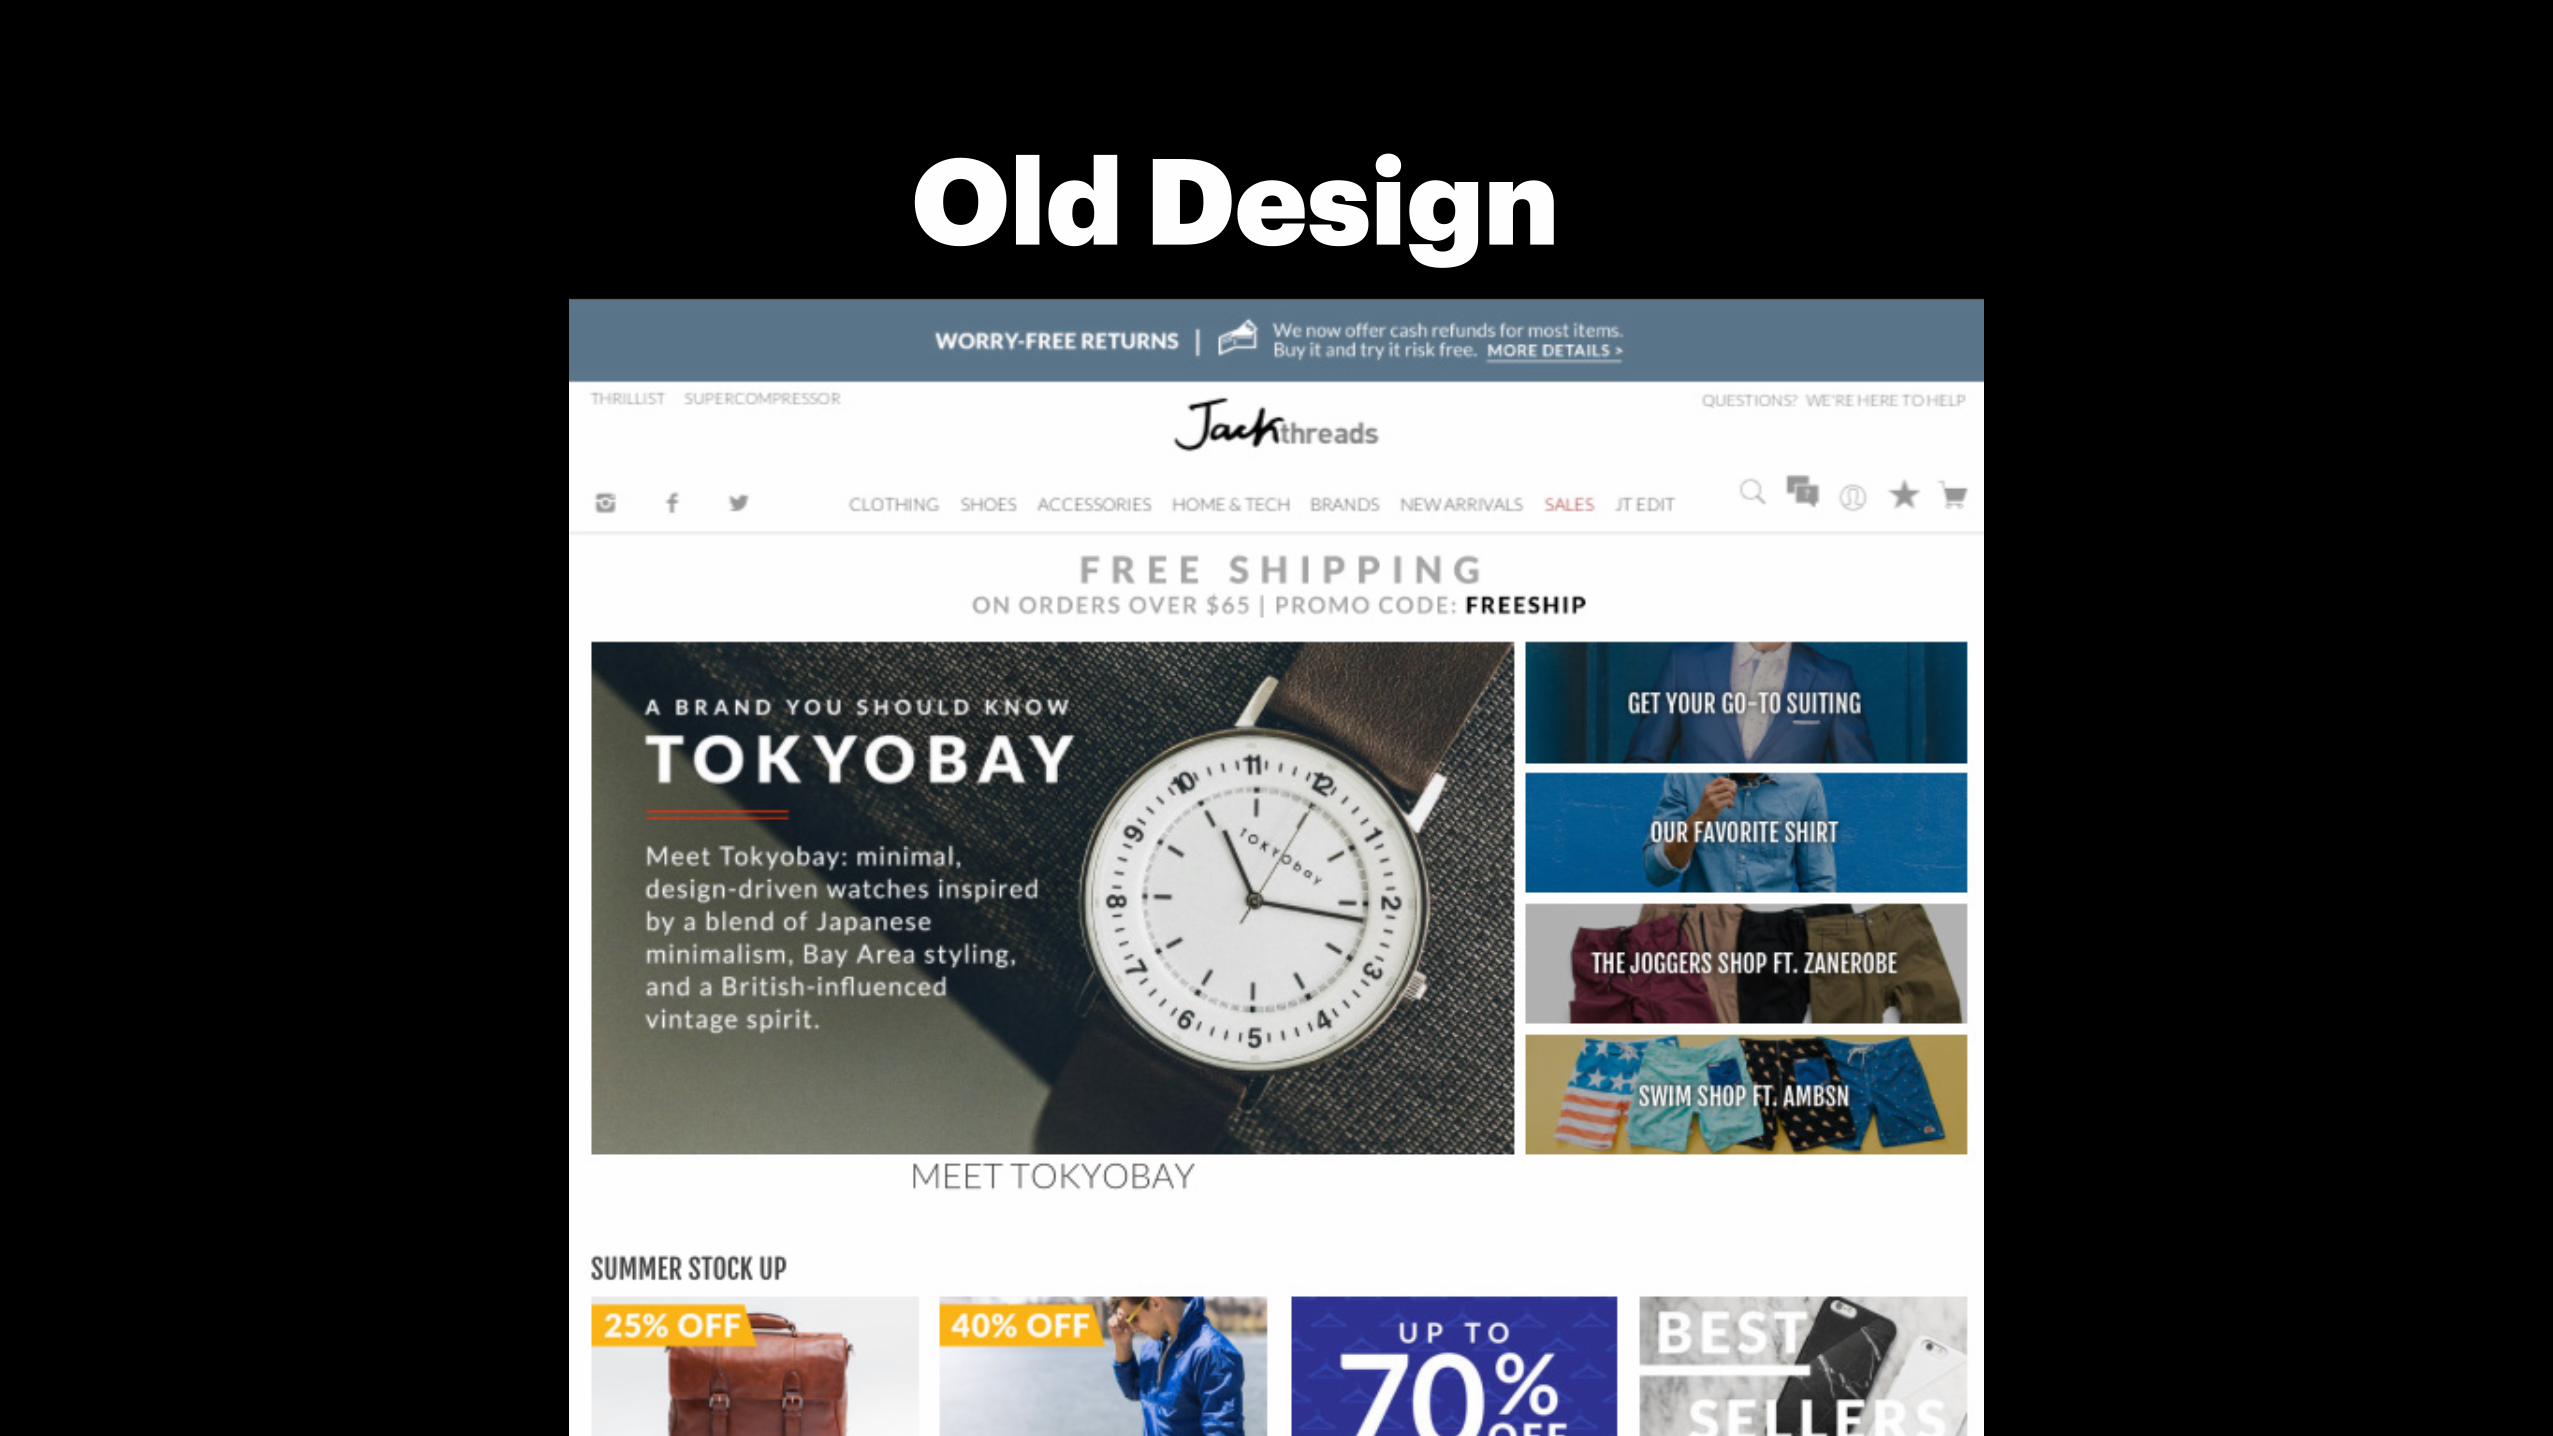
Old Design

Old Design
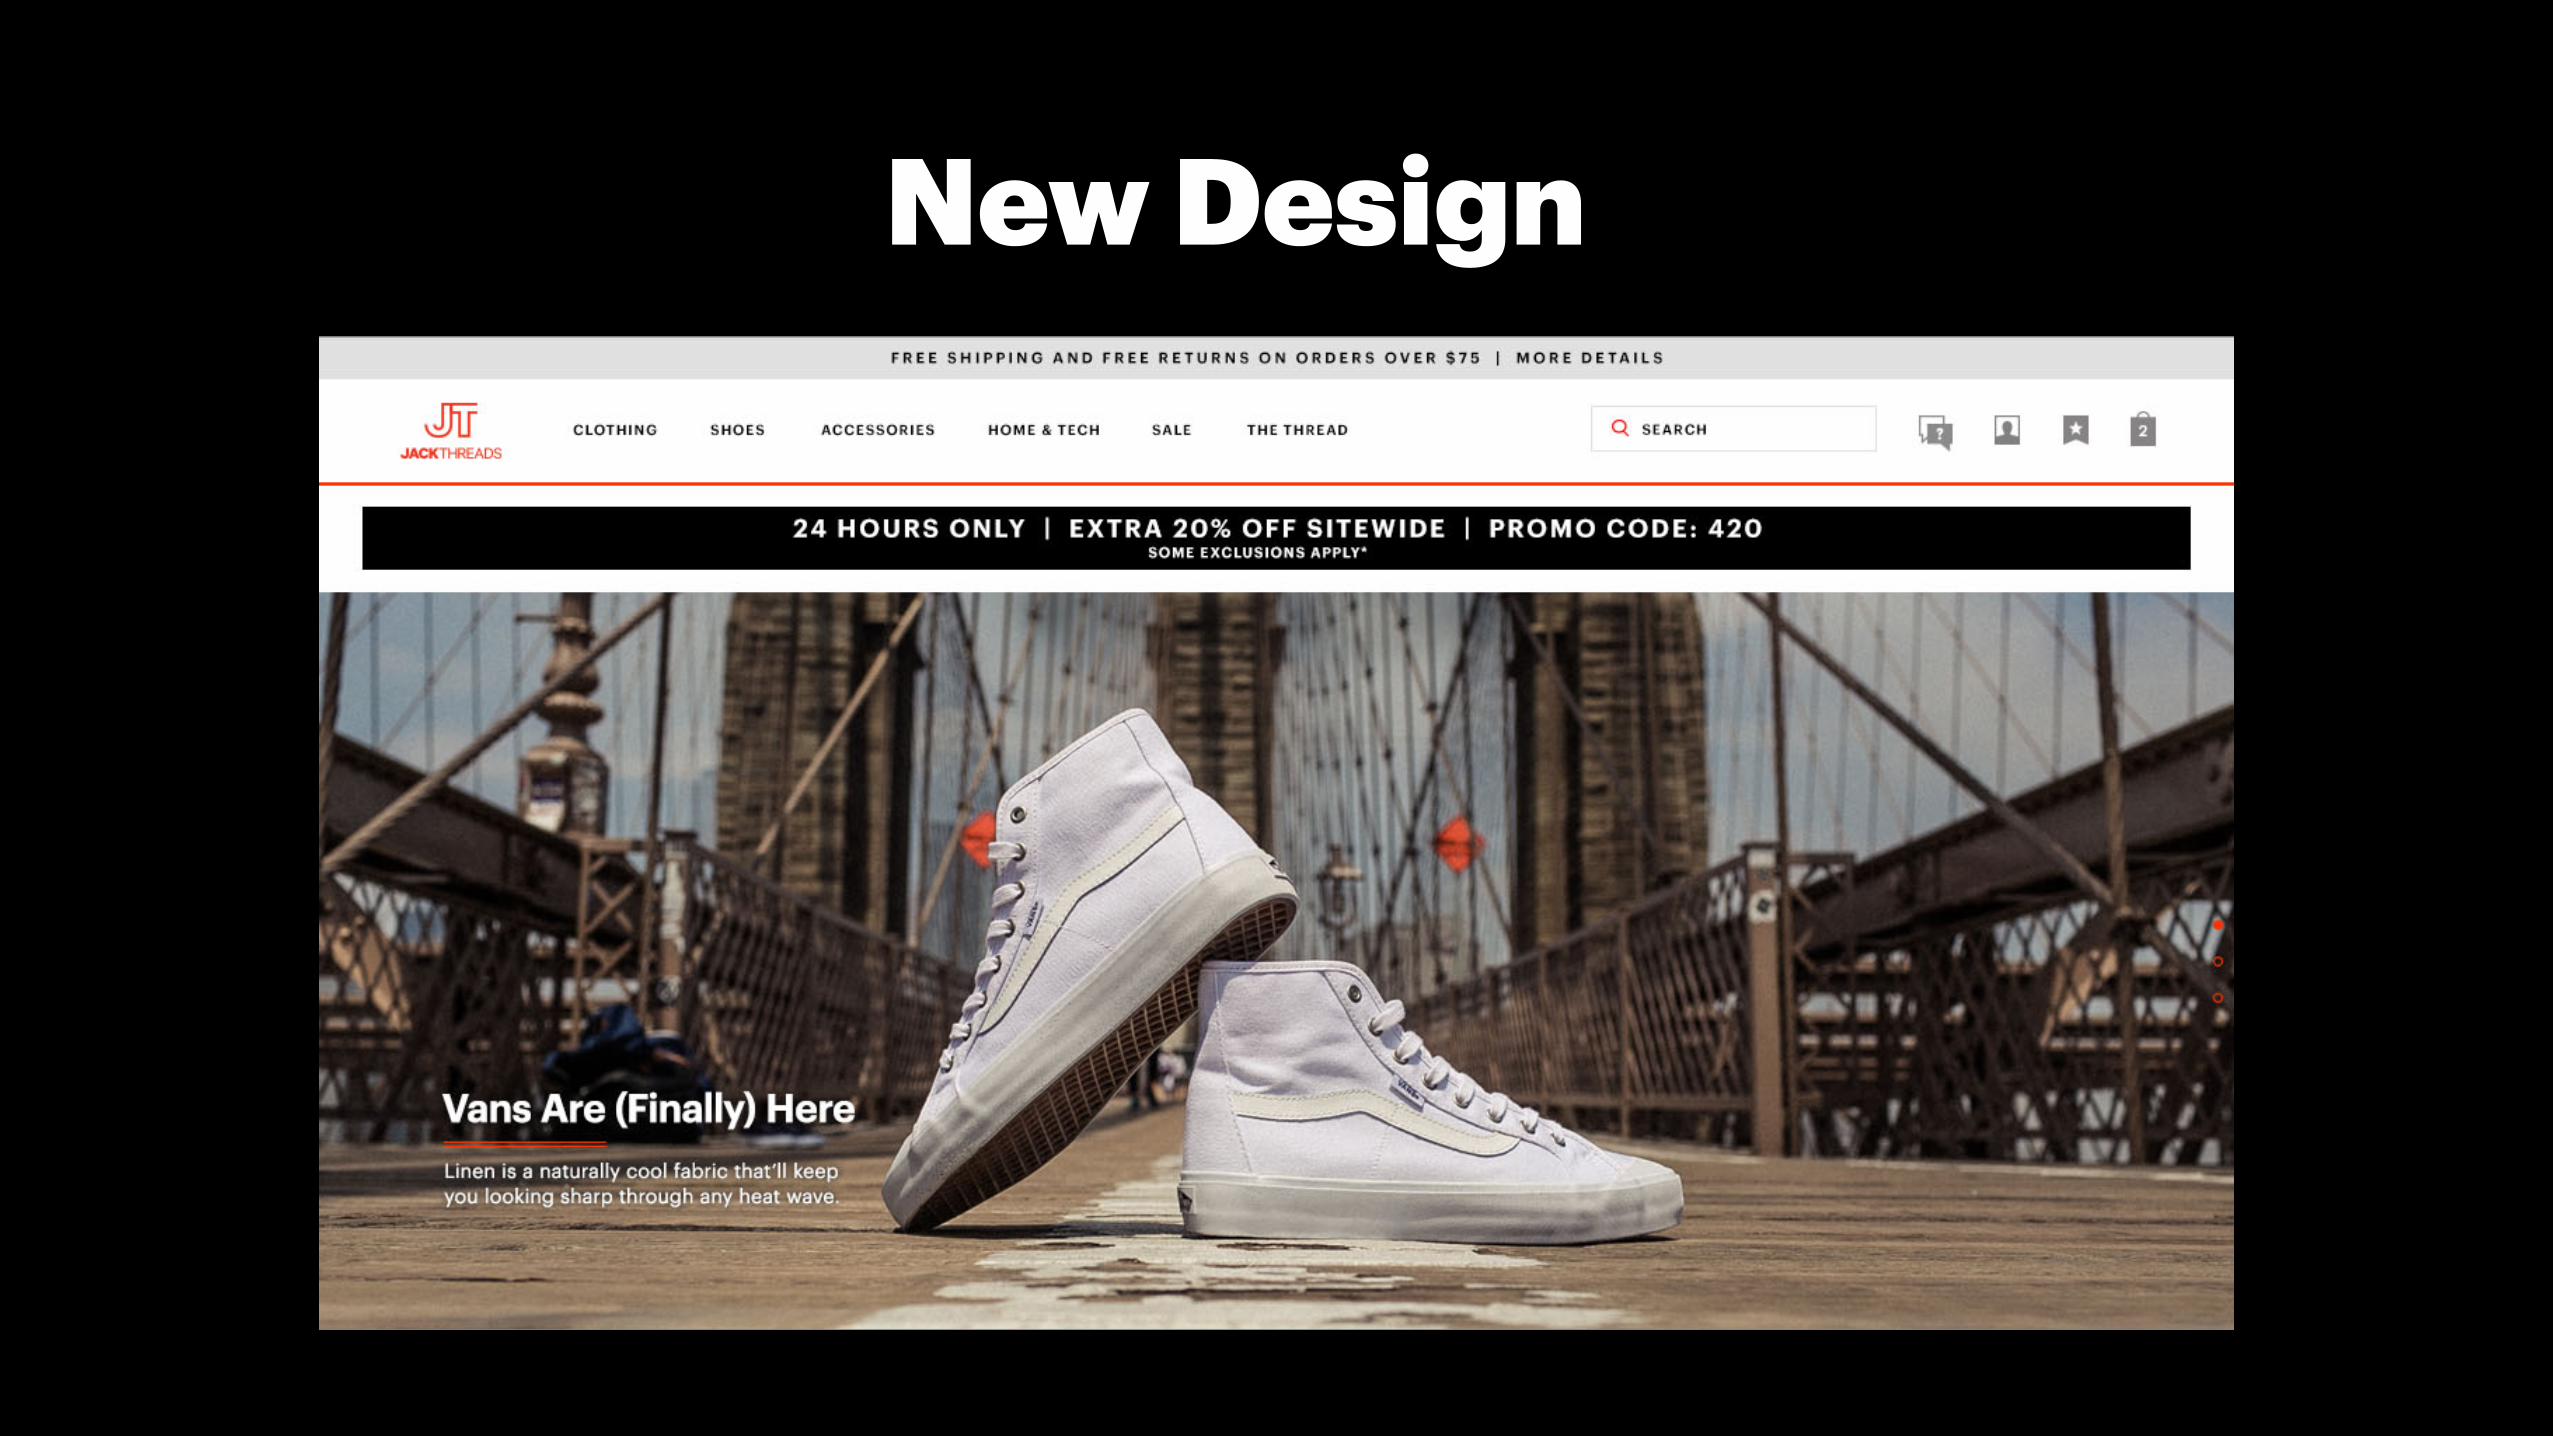
New Design
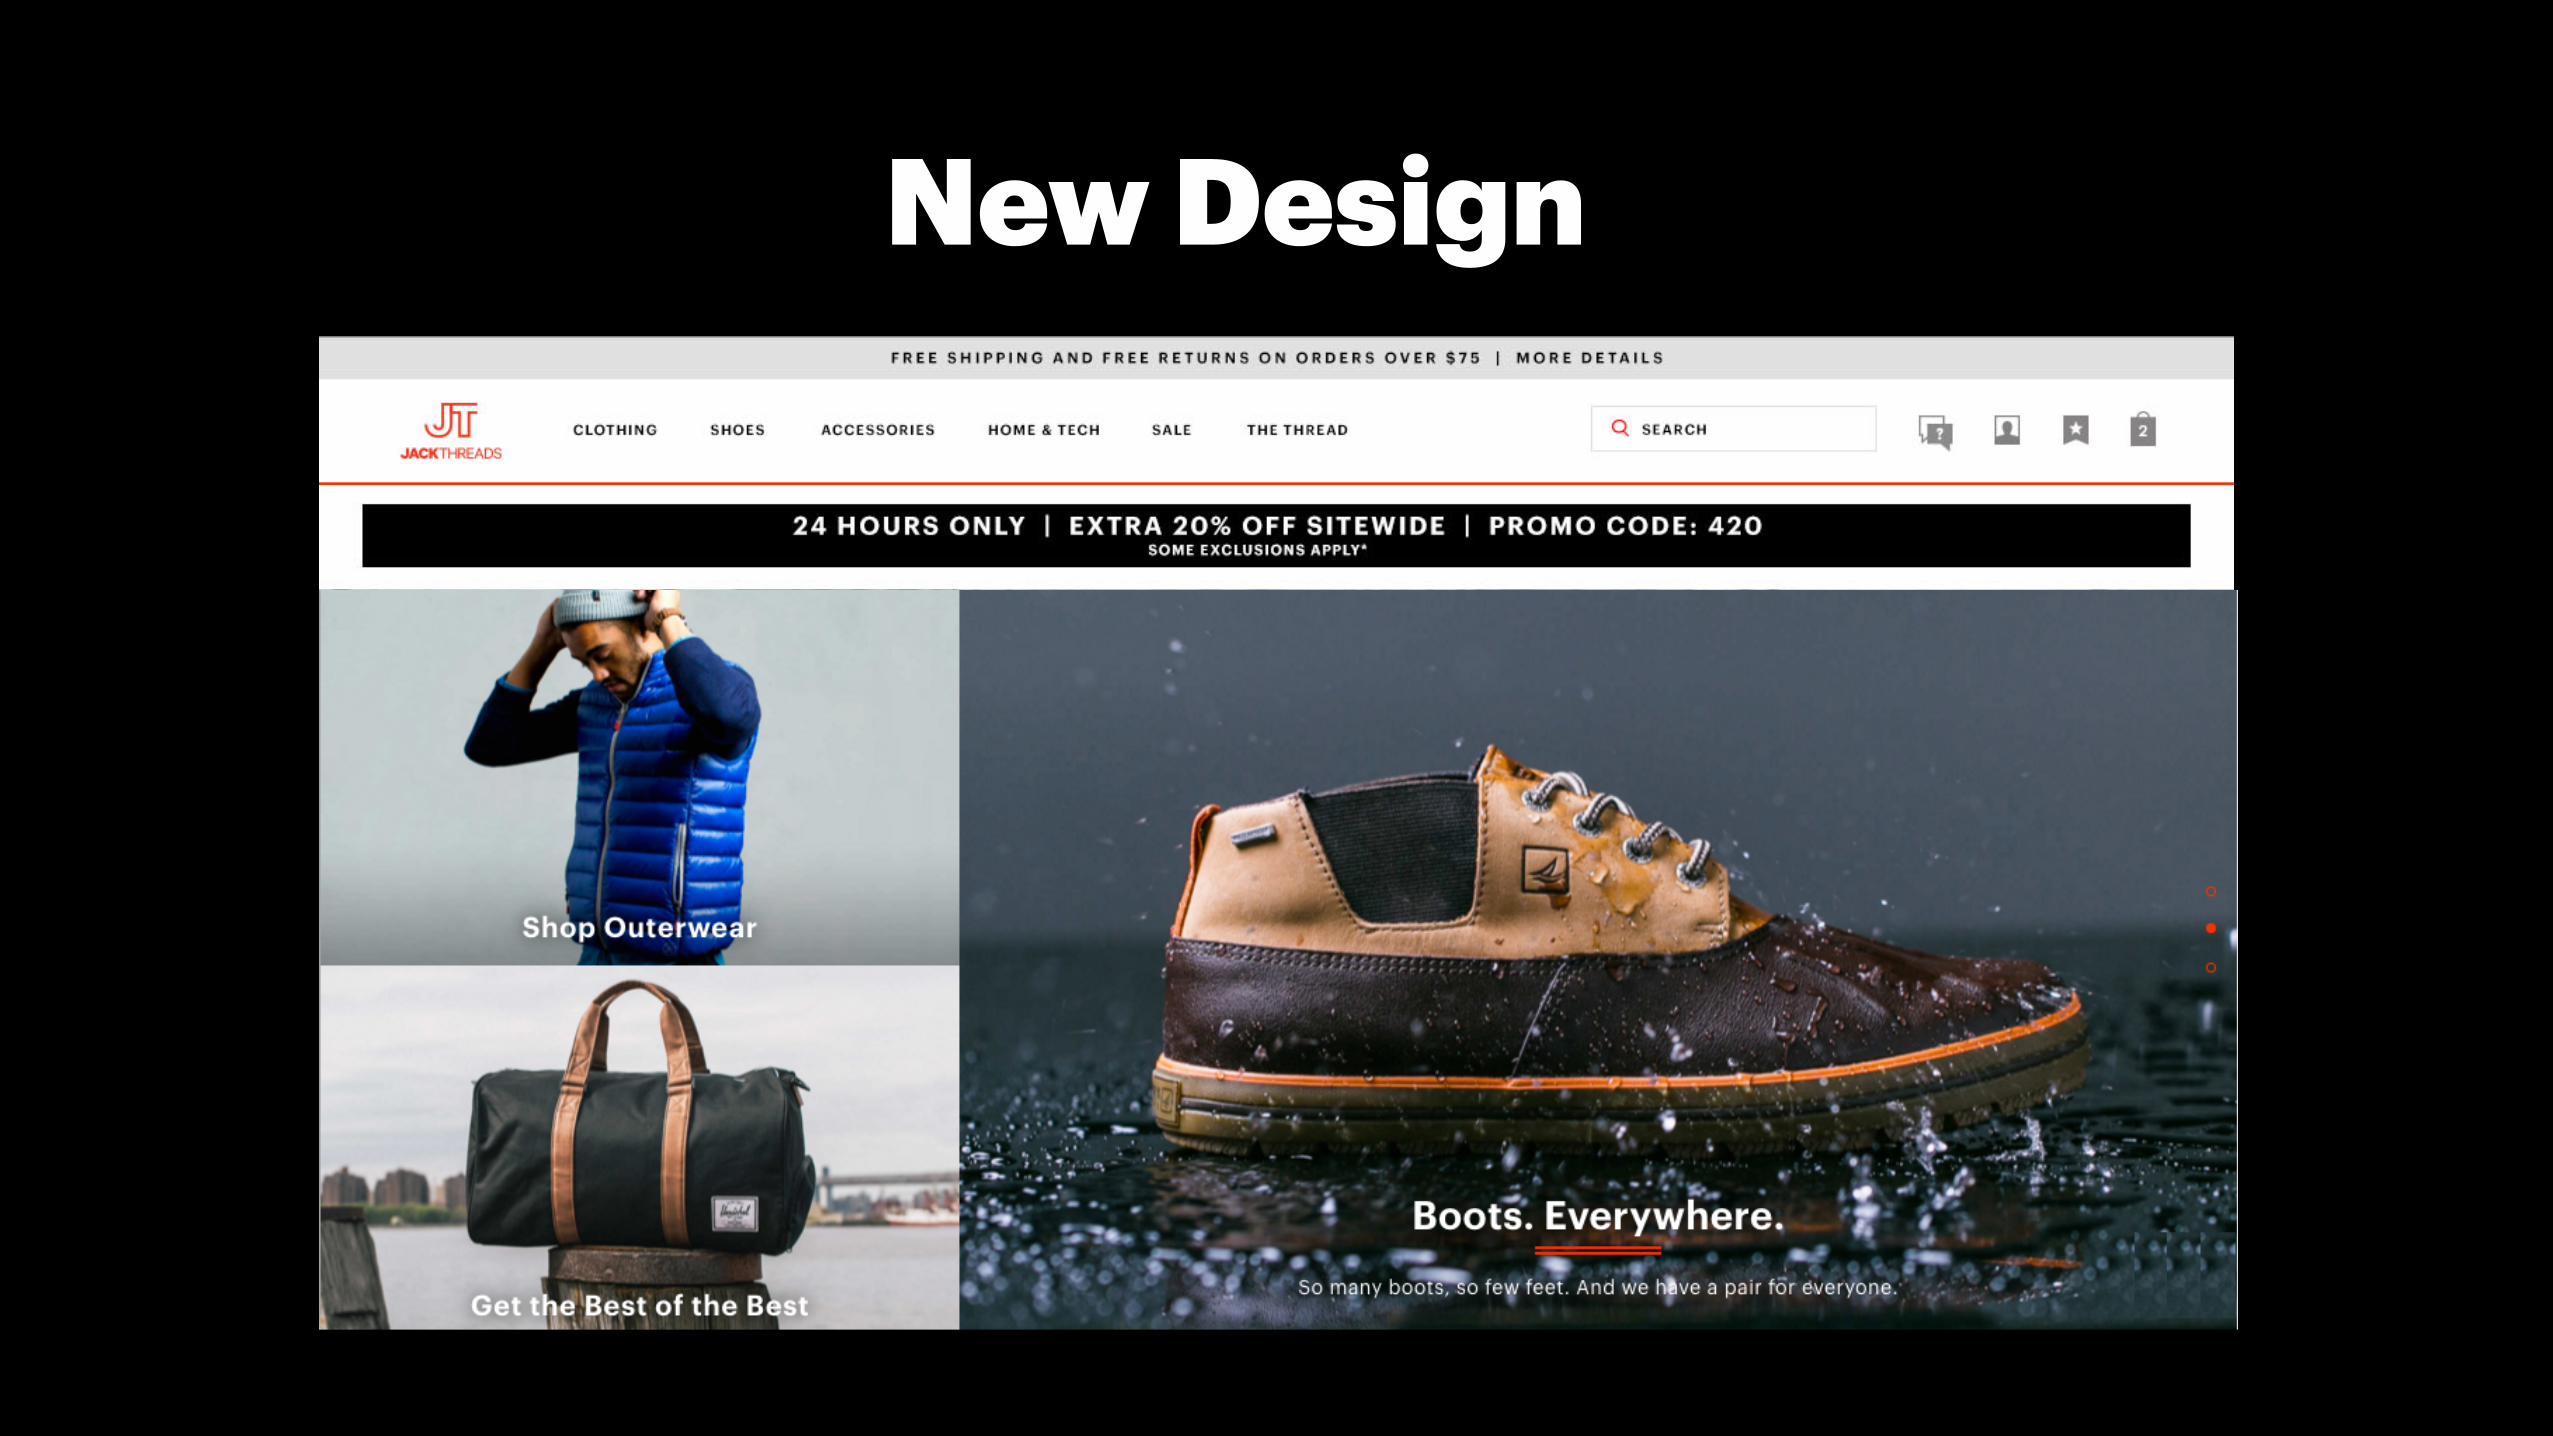
New Design
New Design
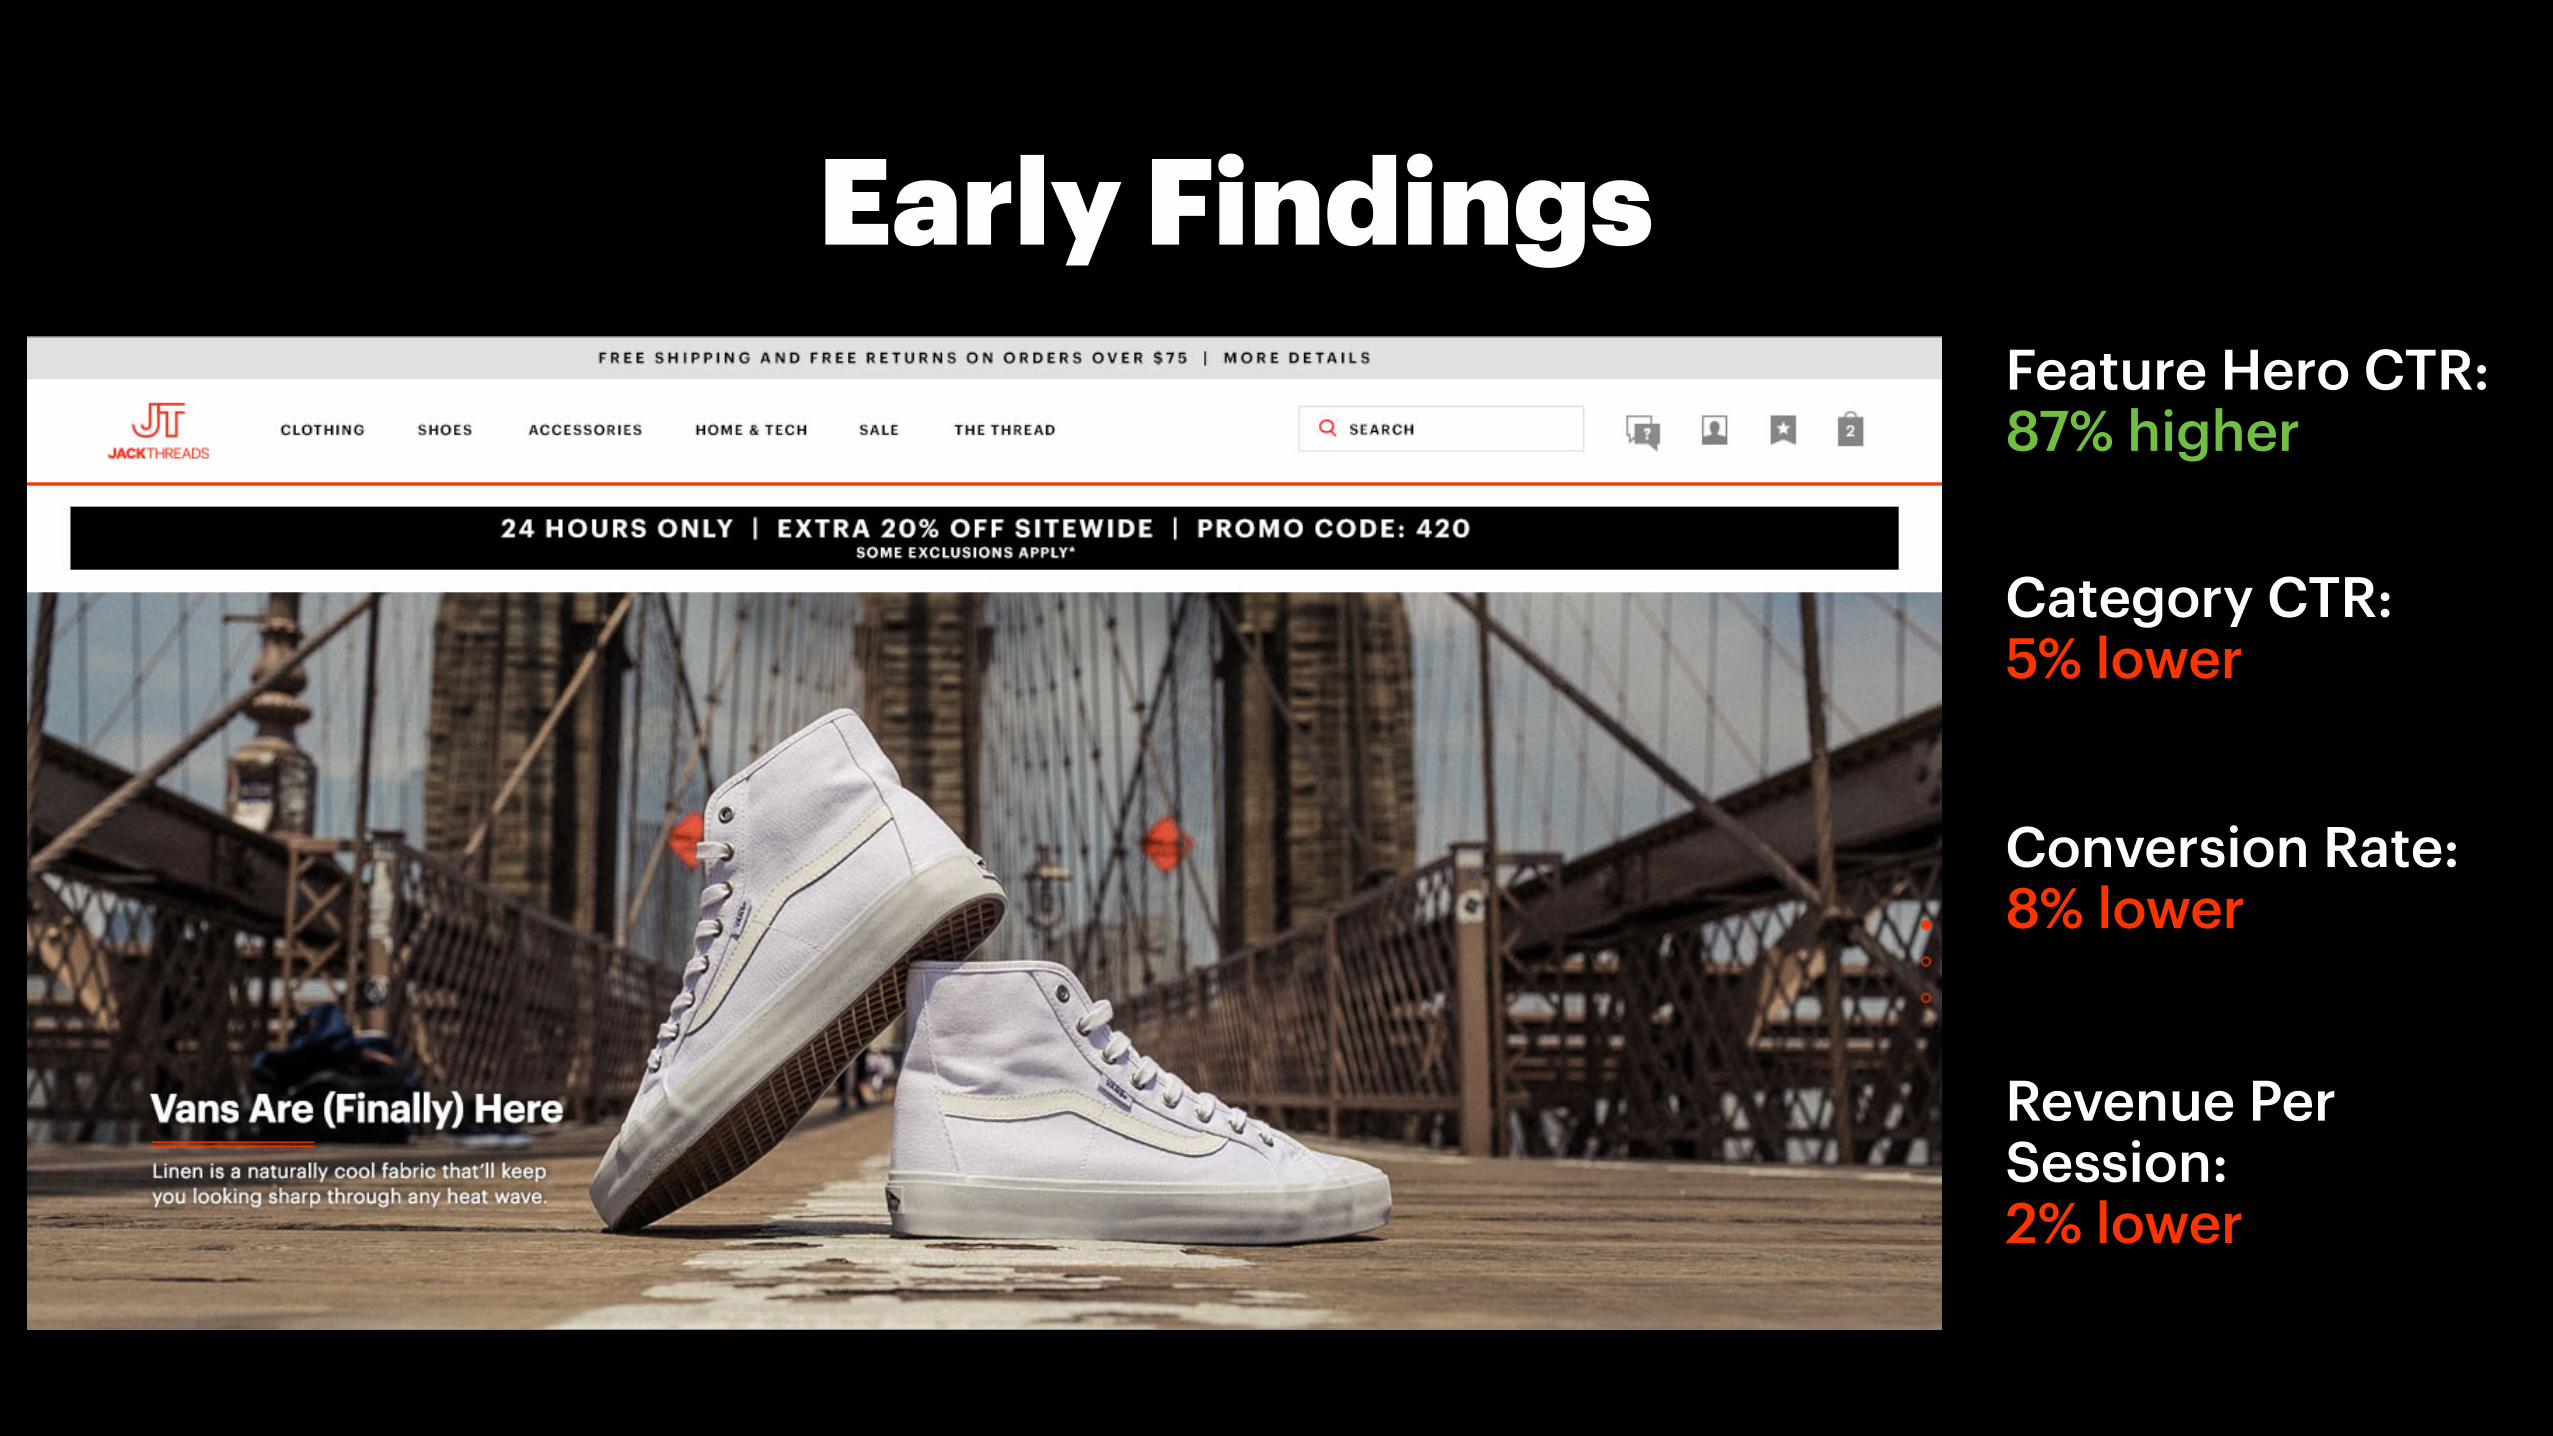
Early FindingsFeature Hero CTR: 87% higher
Category CTR: 5% lower
Conversion Rate: 8% lower
Revenue Per Session: 2% lower

Data > Insights > Brand Lens > Design

![Defining Brand at Refinery29 [FirstMark's Design Driven]](https://static.fdocuments.us/doc/165x107/5870705b1a28ab48378b770b/defining-brand-at-refinery29-firstmarks-design-driven.jpg)