
Consideration of Comments Response Project...Consideration of Comments: Project 2007-12 Frequency...
28
Consideration of Comments Project 2007-12 Frequency Response The Frequency Response Drafting Team thanks all commenters who submitted comments on the first formal posting for Project 2007-12 Frequency Response. These standards were posted for a 45‐day public comment period from October 25, 2011 through December 9, 2011. Stakeholders were asked to provide feedback on the standards and associated documents through a special electronic comment form. There were 43 sets of comments, including comments from approximately 133 different people from approximately 86 companies representing all 10 of the Industry Segments as shown in the table on the following pages. All comments submitted may be reviewed in their original format on the standard’s project page: http://www.nerc.com/filez/standards/Frequency_Response.html If you feel that your comment has been overlooked, please let us know immediately. Our goal is to give every comment serious consideration in this process! If you feel there has been an error or omission, you can contact the Vice President of Standards and Training, Herb Schrayshuen, at 404‐446‐2560 or at [email protected] . In addition, there is a NERC Reliability Standards Appeals Process. 1 1 The appeals process is in the Reliability Standards Development Procedures: http://www.nerc.com/standards/newstandardsprocess.html .
Transcript of Consideration of Comments Response Project...Consideration of Comments: Project 2007-12 Frequency...

Consideration of Comments Project 2007-12 Frequency Response The Frequency Response Drafting Team thanks all commenters who submitted comments on the first formal posting for Project 2007-12 Frequency Response. These standards were posted for a 45‐day public comment period from October 25, 2011 through December 9, 2011. Stakeholders were asked to provide feedback on the standards and associated documents through a special electronic comment form. There were 43 sets of comments, including comments from approximately 133 different people from approximately 86 companies representing all 10 of the Industry Segments as shown in the table on the following pages. All comments submitted may be reviewed in their original format on the standard’s project page:
http://www.nerc.com/filez/standards/Frequency_Response.html
If you feel that your comment has been overlooked, please let us know immediately. Our goal is to give every comment serious consideration in this process! If you feel there has been an error or omission, you can contact the Vice President of Standards and Training, Herb Schrayshuen, at 404‐446‐2560 or at [email protected]. In addition, there is a NERC Reliability Standards Appeals Process.1
1 The appeals process is in the Reliability Standards Development Procedures: http://www.nerc.com/standards/newstandardsprocess.html.

Consideration of Comments: Project 2007-12 Frequency Response 2
Index to Questions, Comments, and Responses
1. The SDT has made minor modifications to the proposed definitions to provide additional clarity. Do you agree that these
modifications provide sufficient clarity? If not, please explain in the comment area …. ............................................. X
2. The SDT has made minor modifications to the Requirements R1 through R4 to provide additional clarity. Do you agree that these modifications provide sufficient clarity to comply with the standard? If not, please explain in the comment area. …. ......................................................................................................................................................... X
3. The SDT has developed VRFs for the proposed Requirements within this standard. Do you agree that these VRFs are
appropriately set? If not, please explain in the comment area. …. ....................................................................... X
4. The SDT has developed Measures for the proposed Requirements within this standard. Do you agree with the proposed
Measures in this standard? If not, please explain in the comment area …. ............................................................ X
5. The SDT has developed VSLs for the proposed Requirements within this standard. Do you agree with these VSLs? If
not, please explain in the comment area.…. ................................................................................................... X
6. The SDT divided the previously posted “Attachment A – Background Document” into two documents to provide additional clarity. The first document “Attachment A- Supporting Document” which details the methods used to develop the events to be analyzed, the FRO, FRM and Frequency Bias Setting. Do you agree that the revised Attachment A – Supporting Document provides sufficient clarity on the methodologies to be used? If not, please explain in the comment
area. …. ................................................................................................................................................. X
7. The second document “BAL-003-1 Background Document” provides information behind the development of the standard. Do you agree that this new document provides sufficient clarity as to the development of the standard? If not,
please explain in the comment area. …. ........................................................................................................ X
8. The SDT has developed a new document titled Attachment B – Process for Adjusting Bias Setting Floor. This document is intended to provide the methodology the ERO will use to reduce the minimum Frequency Bias Setting to become closer to natural Frequency Response. Do you agree that this document provides clear and concise instructions for the
ERO to follow? If not, please explain in the comment area. …. ......................................................................... X
9. The SDT has provided an additional spreadsheet, FRS Form 2, to assist the Balancing Authority in providing the data needed to comply with the proposed standard. Do you agree that this spreadsheet is useful and the instructions are
meaningful? If not, please explain in the comment area. …. ............................................................................ X
10. Please provide any other comments (that you have not already provided in response to the questions above) that you
have on the draft standard BAL-003-1. …. ................................................................................................... X

The Industry Segments are:
1 — Transmission Owners
2 — RTOs, ISOs
3 — Load‐serving Entities
4 — Transmission‐dependent Utilities
5 — Electric Generators
6 — Electricity Brokers, Aggregators, and Marketers
7 — Large Electricity End Users
8 — Small Electricity End Users
9 — Federal, State, Provincial Regulatory or other Government Entities
10 — Regional Reliability Organizations, Regional Entities
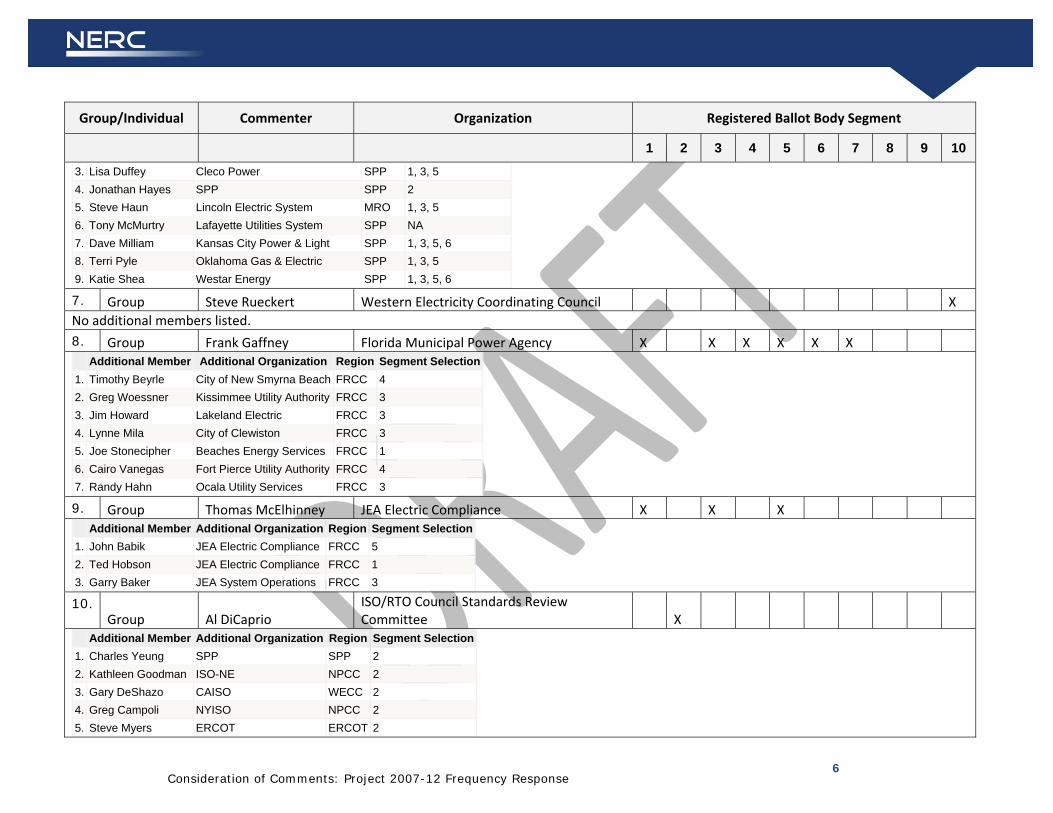
Group/Individual Commenter Organization Registered Ballot Body Segment
1 2 3 4 5 6 7 8 9 10
1. Group Chris Higgins Bonneville Power Administration X X X X Additional Member Additional Organization Region Segment Selection
1. James Murphey BPA WECC 1
2. Bart McManus BPA WECC 1
3. David Kirsch BPA WECC 1
2. Group Jesus Sammy Alcaraz Imperial Irrigation District X X X X X Additional Member Additional Organization Region Segment Selection
1. Tino Zaragoza IID WECC 1
2. Jesus Sammy Alcaraz IID WECC 3
3. Diana Torres IID WECC 4
4. Marcela Caballero IID WECC 5

Consideration of Comments: Project 2007-12 Frequency Response 4
Group/Individual Commenter Organization Registered Ballot Body Segment
1 2 3 4 5 6 7 8 9 10 5. Cathy Bretz IID WECC 6
3. Group Guy Zito Northeast Power Coordinating Council X Additional Member Additional Organization Region Segment Selection
1. Alan Adamson New York State Reliability Council, LLC NPCC 10
2. Greg Campoli New York Independent System Operator NPCC 2
3. Sylvain Clermont Hydro-Quebec TransEnergie NPCC 1
4. Chris de Graffenried Consolidated Edison Co. of New York, Inc. NPCC 1
5. Gerry Dunbar Northeast Power Coordinating Council NPCC 10
6. Brian Evans-Mongeon Utility Services NPCC 8
7. Mike Garton Dominion Resources Services, Inc. NPCC 5
8. Kathleen Goodman ISO - New England NPCC 2
9. Chantel Haswell FPL Group, Inc. NPCC 5
10. David Kiguel Nydro One Networks Inc. NPCC 1
11. Michael R. Lombardi Northeast Utilities NPCC 1
12. Randy MacDonald New Brunswick Power Transmission NPCC 9
13. Bruce Metruck New York Power Authority NPCC 6
14. Lee Pedowicz Northeast Power Coordinating Council NPCC 10
15. Robert Pellegrini The United Illuminating Company NPCC 1
16. Si-Truc Phan Hydro-Quebec TransEnergie NPCC 1
17. David Ramkalawan Ontario Power Generation, Inc. NPCC 5
18. Saurabh Saksena National Grid NPCC 1
19. Michael Schiavone National Grid NPCC 1
20. Wayne Sipperly New York Power Authority NPCC 5
21. Tina Teng Independent Electricity System Operator NPCC 2
22. Donald Weaver Neqw Brunswick System Operator NPCC 2
23. Ben Wu Orange and Rockland Utilities NPCC 1
24. Peter Yost Consolidated Edison Co. of New York, Inc. NPCC 3
4. Group Will Smith MRO NSRF X Additional Member Additional Organization Region Segment Selection
1. MAHMOOD SAFI OPPD MRO 1, 3, 5, 6
2. CHUCK LAWRENCE ATC MRO 1

Consideration of Comments: Project 2007-12 Frequency Response 5
Group/Individual Commenter Organization Registered Ballot Body Segment
1 2 3 4 5 6 7 8 9 10 3. TOM WEBB WPS MRO 3, 4, 5, 6
4. JODI JENSON WAPA MRO 6
5. KEN GOLDSMITH ALTW MRO 4
6. ALICE IRELAND NSP (XCEL) MRO 1, 3, 5, 6
7. DAVE RUDOLPH BEPC MRO 1, 3, 5, 6
8. ERIC RUSKAMP LES MRO 1, 3, 5, 6
9. JOE DEPOORTER MGE MRO 3, 4, 5, 6
10. SCOTT NICKELS RPU MRO 4
11. TERRY HARBOUR MEC MRO 1, 3, 5, 6
12. MARIE KNOX MISO MRO 2
13. LEE KITTELSON OTP MRO 1, 3, 4, 5
14. SCOTT BOS MPW MRO 1, 3, 5, 6
15. TONY EDDLEMAN NPPD MRO 1, 3, 5
16. MIKE BRYTOWSKI GRE MRO 1, 3, 5, 6
17. RICHARD BURT MPC MRO 1, 3, 5, 6
5. Group Gerald Beckerle SERC OC Standards Review Group X X Additional Member Additional Organization Region Segment Selection
1. Andy Burch EEI SERC 5
2. Bob Dalrymple TVA SERC 1, 3, 5, 6
3. Brad Gordon PJM SERC 2
4. Vicky Budreau SCPSA SERC 1, 3, 5, 6
5. Sam Holeman Duke SERC 6, 1, 3, 5
6. Cindy Martin Southern Co SERC 1, 5
7. Scott Brame NCEMC SERC 1, 3, 4, 5
8. Wayne Van Liere LGE-KU SERC 3
9. Larry Akens TVA SERC 1, 3, 5, 6
10. John Troha SERC Reliability Corp. SERC 10
6. Group Robert Rhodes SPP Standards Review Group X Additional Member Additional Organization Region Segment Selection
1. John Allen City Utilities of Springfield SPP 1, 3, 5
2. David Dockery Assocoated Electric Cooperative SERC 1, 3, 5
Consideration of Comments: Project 2007-12 Frequency Response 6
Group/Individual Commenter Organization Registered Ballot Body Segment
1 2 3 4 5 6 7 8 9 10 3. Lisa Duffey Cleco Power SPP 1, 3, 5
4. Jonathan Hayes SPP SPP 2
5. Steve Haun Lincoln Electric System MRO 1, 3, 5
6. Tony McMurtry Lafayette Utilities System SPP NA
7. Dave Milliam Kansas City Power & Light SPP 1, 3, 5, 6
8. Terri Pyle Oklahoma Gas & Electric SPP 1, 3, 5
9. Katie Shea Westar Energy SPP 1, 3, 5, 6
7. Group Steve Rueckert Western Electricity Coordinating Council X
No additional members listed.
8. Group Frank Gaffney Florida Municipal Power Agency X X X X X X Additional Member Additional Organization Region Segment Selection
1. Timothy Beyrle City of New Smyrna Beach FRCC 4
2. Greg Woessner Kissimmee Utility Authority FRCC 3
3. Jim Howard Lakeland Electric FRCC 3
4. Lynne Mila City of Clewiston FRCC 3
5. Joe Stonecipher Beaches Energy Services FRCC 1
6. Cairo Vanegas Fort Pierce Utility Authority FRCC 4
7. Randy Hahn Ocala Utility Services FRCC 3
9. Group Thomas McElhinney JEA Electric Compliance X X X Additional Member Additional Organization Region Segment Selection
1. John Babik JEA Electric Compliance FRCC 5
2. Ted Hobson JEA Electric Compliance FRCC 1
3. Garry Baker JEA System Operations FRCC 3
10. Group Al DiCaprio
ISO/RTO Council Standards Review Committee X
Additional Member Additional Organization Region Segment Selection1. Charles Yeung SPP SPP 2
2. Kathleen Goodman ISO-NE NPCC 2
3. Gary DeShazo CAISO WECC 2
4. Greg Campoli NYISO NPCC 2
5. Steve Myers ERCOT ERCOT 2
Consideration of Comments: Project 2007-12 Frequency Response 7
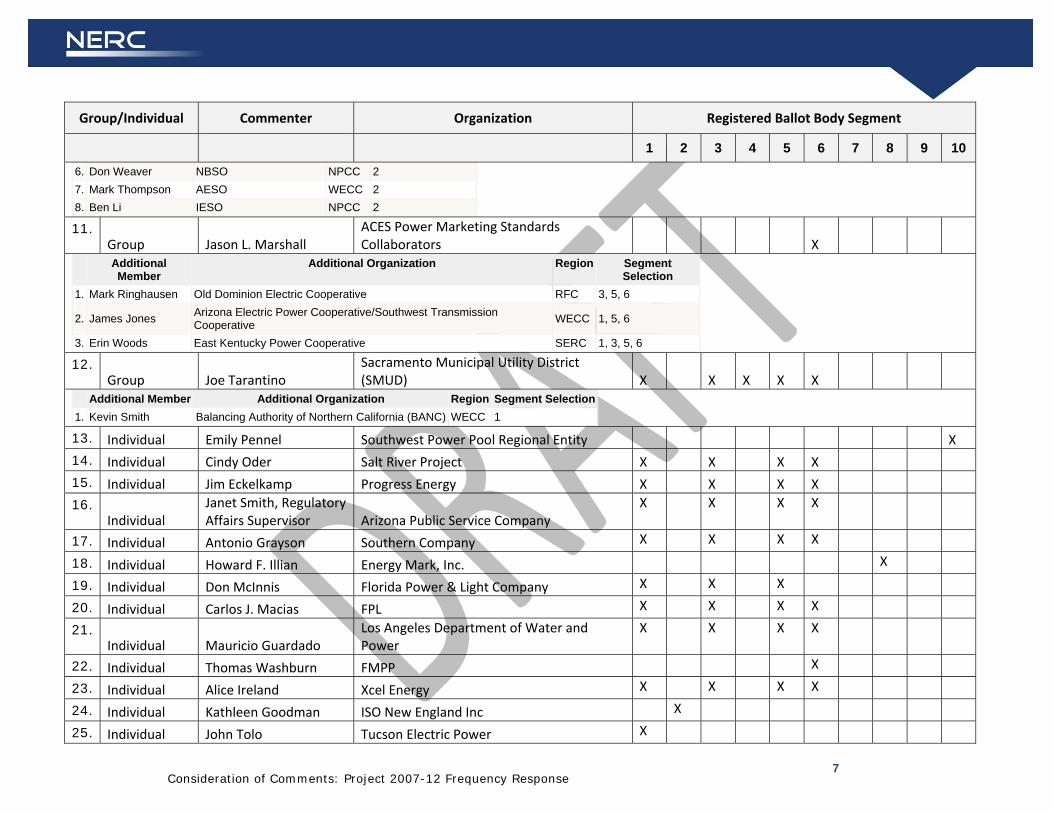
Group/Individual Commenter Organization Registered Ballot Body Segment
1 2 3 4 5 6 7 8 9 10 6. Don Weaver NBSO NPCC 2
7. Mark Thompson AESO WECC 2
8. Ben Li IESO NPCC 2
11. Group Jason L. Marshall
ACES Power Marketing Standards Collaborators X
Additional Member
Additional Organization Region Segment Selection
1. Mark Ringhausen Old Dominion Electric Cooperative RFC 3, 5, 6
2. James Jones Arizona Electric Power Cooperative/Southwest Transmission Cooperative
WECC 1, 5, 6
3. Erin Woods East Kentucky Power Cooperative SERC 1, 3, 5, 6
12. Group Joe Tarantino
Sacramento Municipal Utility District (SMUD) X X X X X
Additional Member Additional Organization Region Segment Selection1. Kevin Smith Balancing Authority of Northern California (BANC) WECC 1
13. Individual Emily Pennel Southwest Power Pool Regional Entity X
14. Individual Cindy Oder Salt River Project X X X X
15. Individual Jim Eckelkamp Progress Energy X X X X
16. Individual
Janet Smith, Regulatory Affairs Supervisor Arizona Public Service Company
X X X X
17. Individual Antonio Grayson Southern Company X X X X
18. Individual Howard F. Illian Energy Mark, Inc. X
19. Individual Don McInnis Florida Power & Light Company X X X
20. Individual Carlos J. Macias FPL X X X X
21. Individual Mauricio Guardado
Los Angeles Department of Water and Power
X X X X
22. Individual Thomas Washburn FMPP X
23. Individual Alice Ireland Xcel Energy X X X X
24. Individual Kathleen Goodman ISO New England Inc X
25. Individual John Tolo Tucson Electric Power X

Consideration of Comments: Project 2007-12 Frequency Response 8
Group/Individual Commenter Organization Registered Ballot Body Segment
1 2 3 4 5 6 7 8 9 10
26. Individual Dennis Sismaet Seattle City Light X X X X X
27. Individual Michael Falvo Independent Electricity System Operator X
28. Individual John Bussman Associated Electric Cooperative Inc X X X X
29. Individual Rich Salgo NV Energy X X X
30. Individual Thad Ness American Electric Power X X X X
31. Individual RoLynda Shumpert South Carolina Electric and Gas X X X X
32. Individual Louis C. Guidry Cleco Corporation X X X X
33. Individual H. Steven Myers ERCOT X
34. Individual Kasia Mihalchuk Manitoba Hydro X X X X
35. Individual Curtis Crews Texas Reliability Entity X
36. Individual Mark B Thompson Alberta Electric System Operator X
37. Individual Anthony Jablonski ReliabilityFirst X
38. Individual Brenda Powell Constellation Energy Commodities Group X
39. Individual Kirit Shah Ameren X X X X
40. Individual Michael Brytowski Great River Energy X X X X
41. Individual Si Truc PHAN Hydro‐Quebec TransEnergie X
42. Individual Greg Rowland Duke Energy X X X X
43. Individual Robert Blohm Keen Resources Asia Ltd. X

Consideration of Comments: Project 2007-12 Frequency Response 9
8. The SDT has developed a new document titled Attachment B – Process for Adjusting Bias Setting Floor. This document is
intended to provide the methodology the ERO will use to reduce the minimum Frequency Bias Setting to become closer to natural Frequency Response. Do you agree that this document provides clear and concise instructions for the ERO to follow? If not, please explain in the comment area.
Summary Consideration:
Organization Yes or No Question 8 Comment
Seattle City Light Negative Answer: Yes Comments: o LADWP and SCL note that Attachment B seems to be reasonable.
Response: Thank you for your comment.
Constellation Energy Commodities Group
No Should be revisited based on the proposed modifications to the requirements.
Response: Attachment B will be revisited when the requirements are modified.
MRO NSRF No : There could be some confusion caused by the Attachment B due to the use of the word “initially” when the reference is made to the current standard. The drafting team should change the word “initially” to “currently” or strike it to avoid the potential confusion.
The second paragraph of Attachment B (which contains the two bullets):The words “initially 1%” in the second bullet contradict with the Table 1 on Attachment B, which states “Initial” and “0.8%”. Suggest deleting the parenthetical in the second bullet as when BAL‐003‐1 is effective it would be referencing an old Standard version. If the initial minimum is intended to be 1% say so in the Table 1.
Consideration of Comments: Project 2007-12 Frequency Response 10
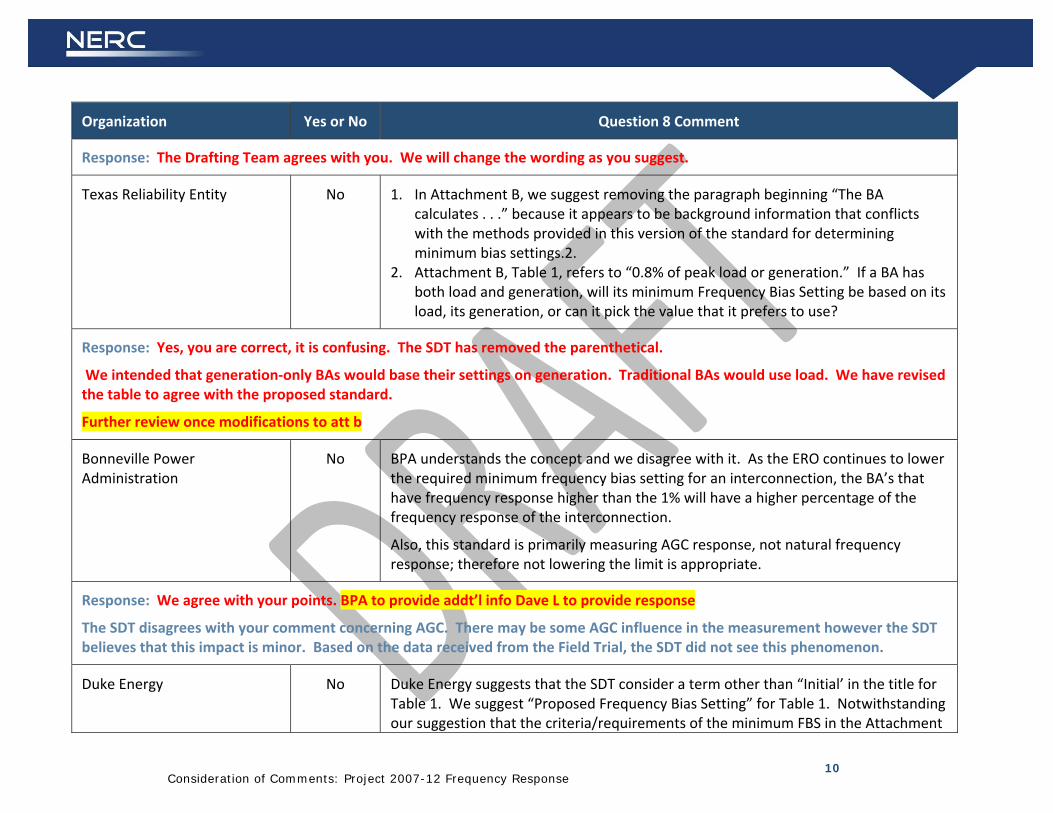
Organization Yes or No Question 8 Comment
Response: The Drafting Team agrees with you. We will change the wording as you suggest.
Texas Reliability Entity No 1. In Attachment B, we suggest removing the paragraph beginning “The BA calculates . . .” because it appears to be background information that conflicts with the methods provided in this version of the standard for determining minimum bias settings.2.
2. Attachment B, Table 1, refers to “0.8% of peak load or generation.” If a BA has both load and generation, will its minimum Frequency Bias Setting be based on its load, its generation, or can it pick the value that it prefers to use?
Response: Yes, you are correct, it is confusing. The SDT has removed the parenthetical.
We intended that generation‐only BAs would base their settings on generation. Traditional BAs would use load. We have revised the table to agree with the proposed standard.
Further review once modifications to att b
Bonneville Power Administration
No BPA understands the concept and we disagree with it. As the ERO continues to lower the required minimum frequency bias setting for an interconnection, the BA’s that have frequency response higher than the 1% will have a higher percentage of the frequency response of the interconnection.
Also, this standard is primarily measuring AGC response, not natural frequency response; therefore not lowering the limit is appropriate.
Response: We agree with your points. BPA to provide addt’l info Dave L to provide response
The SDT disagrees with your comment concerning AGC. There may be some AGC influence in the measurement however the SDT believes that this impact is minor. Based on the data received from the Field Trial, the SDT did not see this phenomenon.
Duke Energy No Duke Energy suggests that the SDT consider a term other than “Initial’ in the title for Table 1. We suggest “Proposed Frequency Bias Setting” for Table 1. Notwithstanding our suggestion that the criteria/requirements of the minimum FBS in the Attachment

Consideration of Comments: Project 2007-12 Frequency Response 11
Organization Yes or No Question 8 Comment
be incorporated into the Standard, Duke Energy has the following concerns with what is proposed:
As cited in our comments to Question 8 in the last posting (extensive, so not repeated here), the secondary control measures of CPS1, CPS2 and the draft Balancing Authority ACE Limit (BAAL) are tightly coupled to the Frequency Bias Setting (FBS), and a reduction of the FBS will impact the secondary control requirements placed upon the BA. Noted in our response to Question 7 above, the statement on page 9 in the “BAL‐003‐1 Background Document”is not correct in stating that Attachment B will “ensure there is no negative impact on other Standards”.The gradual reduction of the FBS will proportionally tighten the secondary control limits for each Balancing Authority. Even if the “natural” Frequency Response in the Eastern Interconnection remains unchanged for the next several years, under the process described allowing the ERO to annually adjust the minimum FBS for the Interconnection, the FBS will eventually be reduced to a value approximately 10% above the calculated response in magnitude, cutting the current CPS1, CPS2 and BAAL limits in the Eastern Interconnection on average by more than half. The current FBS for the Eastern Interconnection is approximately minus 6500 MW/0.1Hz, estimated “natural” Frequency Response is perhaps around minus 2400 MW/0.1Hz. Unlike CPS1 and BAAL where the measures are based upon the FBS of the BA only, CPS2 (dependent upon the FBS of the BA and the Interconnection) will be significantly limiting to the degree that no change in a BA’s own Frequency Response could significantly change its CPS2 limit if the Interconnection FBS drops over time as indicated. At least under CPS1 and the draft BAAL, the BA would have an option of improving its Frequency Response, allowing it to increase its FBS and proportionally the CPS1 and BAAL bounds using the FBS.
Conclusion from our last comments submitted: Duke Energy does not believe there is a reliability need pushing the industry to tighten secondary control to the degree discussed above simply as a result of reducing the Frequency Bias Setting. If the calculated Frequency Response of the Interconnection stayed at its current level, what would be the justification for tightening the secondary control requirements of

Consideration of Comments: Project 2007-12 Frequency Response 12
Organization Yes or No Question 8 Comment
CPS1, CPS2 and the proposed BAAL? Duke Energy supports taking more of the error out of the ACE equation by having the FBS closer to the estimated Frequency Response of the Balancing Authority, however, Duke Energy does not believe the result should be a significant increase in secondary control costs to meet the CPS1, CPS2, or draft BAAL requirements. Duke Energy understands the position placed upon this Standard Drafting Team‐ the secondary control and reserve requirements are not under the scope of the team, however, proper consideration has not been given in Attachment B to the impact lowering the FBS will have on the industry in terms of the requirements placed upon the BA for secondary control and reserve requirements ‐ especially for meeting CPS2. The research discussed in our comments to the last posting support that reducing the FBS while under CPS1 and the draft BAAL may be achievable, however a CPS2 bound cut potentially in half or lower will place unreasonable bounds on a BA, requiring control actions even when the BA may be operating in support of the Interconnection frequency. Given the significant impacts discussed, Duke Energy believes that additional provisions must be in place for the Industry to approve each subsequent revision to the calculation of the minimum Frequency Bias Setting, rather than leave it as a decision made only by the ERO.
Response: I agree.
Slow reduction & monitored – can be reversed Don B
Sacramento Municipal Utility District (SMUD)
No In addition to the requirements, reducing frequency bias obligation results in generation tripping closer to the set point. It seems that Lowering the Minimum Frequency Bias Setting from 1% to .8% will result in a lower response, which in turn will lower the natural frequency response. Over time it seems this pattern would lead to poorer response.
Response: BPA response??

Consideration of Comments: Project 2007-12 Frequency Response 13
Organization Yes or No Question 8 Comment
NV Energy No In Attachment B, it seems unclear whether the initial FB setting is supposed to be 1% of BA peak load or 0.8% as shown in the table. In general, I was extremely confused about what the required FB setting should be. R5 indicates a percentage of load found in Att B, but Att B indicates the greater of Natural Frequency Response or 1% of peak, and then the table that follows indicates 0.8%. At this point, I have no idea what is being stated for the requirement.
Response: Yes, you are correct, it is confusing. We will clarify our meaning. From above
Progress Energy No PGN supports the collective comments of SERC members. We suggest the SDT consider a term other than “Initial’ in the title for Table 1. We suggest “Proposed Frequency Bias Setting” for Table 1
Response: We agree. From above
Independent Electricity System Operator
No Please see our comments under Q6. In brief, we do not agree with including a process description type of document as part of the standard requirement.
Response: ??? response Q6 ??
ISO/RTO Council Standards Review Committee
No Please see our comments under Q6. In brief, we do not agree with including a process description type of document as part of the standard requirement. Process description should be regarded guideline document and not a part of the standard requirement.
Response: ieso
Tucson Electric Power No Reducing a BAs frequency bias setting may have an adverse impact on recovering from a frequency event once you get past the first 8‐10 seconds. A larger bias will allow for actual and sustained AGC generator responses. Industry focus should be on generator governor response within the first 8‐10 seconds.

Consideration of Comments: Project 2007-12 Frequency Response 14
Organization Yes or No Question 8 Comment
Response: The Standard Drafting Team disagrees with your comment. Full recovery is dependent upon the contingent BA recovering from its loss. However, we do agree that secondary frequency support from the non‐contingent BAs may not be as robust.
Northeast Power Coordinating Council
No Refer to the first comment in Question 6.
Response: ??? Q6
Hydro‐Quebec TransEnergie No The methodology proposed to compute the Minimum Frequency Bias Setting (in MW/0,1Hz) could be adverse for the Quebec Interconnection. Hydro‐Quebec uses a variable Bias that is calculated based upon which generator is online and it’s droop setting. Under light load condition, we might have a Bias setting that would be under (in absolute value) than the FRM which is the median value, even though the Bias setting would reflect the grid’s frequency response. This method, as proposed, would mandate us to have a larger Bias that what is really needed. Unlike Eastern Interconnection, we are not over biased. By implementing this new methodology, it would make us over biased. Having a too large Bias could lead to system instability, based on the results of studies from our control specialists. The Minimum Frequency Bias Setting should take into account the wide load span that we can face.
For the variable bias, we could express the Minimum Frequency Bias Setting as a function of monthly peak loads, and remove the Natural Frequency Response term. In addition, there is a gap between Attachment B and the text in R5. See comment 10 for explanation.
Response: ??? Variable Bias issue
Xcel Energy No There could be some confusion caused by the Attachment B due to the use of the word “initially” when the reference is made to the current standard. The drafting team should change the word “initially” to “currently” or strike it to avoid the

Consideration of Comments: Project 2007-12 Frequency Response 15
Organization Yes or No Question 8 Comment
potential confusion.
Response: The Standard Drafting Team agrees with you and we will re‐word Attachment B to avoid confusion.
Florida Power & Light Company
No There is no technical justification provided either in the attachment or background data for the initial starting value of 0.8%. This is acceptable but is arbitary.
Additionally, the last sentense on page 1 of Attachment B should be changed to read " the ERO must reduce ( in absolute value) the minimum Frequency Bias Settings for BA's within that Interconnection, by 0.1 percentage point from its previous annual value, to better match the Frequency Bias Setting to the natural Frequency Response or provide technical justification for not implementing the reduction
Response: You are correct, the starting value is arbitrary. The SDT did not want to make a one step change to immediately reduce the minimum fbs to nat fr. Ratehr a multiyear multi step process would be better for other rel stdds.
The SDT believes that the end result would be the same. The present wording allows for collaboration between the ERO and other entities/groups. The SDT is also concerned with putting a requirement on the ERO within an Attachment when there is not a reliability problem if it were not to happen.
SERC OC Standards Review Group
No We suggest the SDT consider a term other than “Initial’ in the title for Table 1. We suggest “Proposed Frequency Bias Setting” for Table 1
Response: The Standard Drafting Team agrees with you and we will re‐word Attachment B to avoid confusion. From above
South Carolina Electric and Gas
No We suggest the SDT consider a term other than “Initial’ in the title for Table 1. We suggest “Proposed Frequency Bias Setting” for Table 1
Response: The Standard Drafting Team agrees with you and we will re‐word Attachment B to avoid confusion. SERC
ISO New England Inc No We suggest the SDT to first determine if the materials in the revised Attachment A & B are “Guideline” or Technical Background”, or are they “requirements”. If it is the former, then Requirement R1 should not mention Attachment A at all. If it is the

Consideration of Comments: Project 2007-12 Frequency Response 16
Organization Yes or No Question 8 Comment
latter, then the as‐written Attachment A is a mix bag as it on the one hand describes the ERO’s process for supporting the Frequency Response Standard (FRS), in other words, the method and criteria it uses to calculate the frequency bias settings and the FRM, and on the other hand the BA’s obligations to support this process. We strongly disagree that the latter requirements be imbedded in an attachment, especially one that is supposed to provide the technical background and guideline for another entity which, by the way, is not held responsible for complying with the proposed method. An appendix is not regarded as a mandatory requirement.
Response: The process is still being developed at NERC but an Attachment would document processes to be utilized without a measurent saying that you failed the standard.
Southern Company No We suggest using the words, ‘Proposed Frequency Bias Setting’ in the Title of Table 1 instead of the word, ‘Initial’.
Response: serc
ERCOT No While there is no problem with the calculation involved, it is unclear why the SDT elected to assign a grid performance element in this standard to the ERO, who has no functional (registered) role in grid performance. Since this is a cook‐book calculation and transfer of data on frequency performance, why not assign it to the BA?
Response: The Attachment B only outlines a process that the ERO is to use when adjusting the minimum Frequency Bias Setting. The attachment does not place any grid performance requirement on the ERO. The STD also believes that some other authority should have oversight over the minimum setting to prevent abuses and assure fairness.
Seattle City Light Yes o LADWP and SCL note that Attachment B seems to be reasonable.
Response: Thank you for your response.
Energy Mark, Inc. Yes Comment 15: This Yes answer assumes that the SDT addresses Comment 13 under

Consideration of Comments: Project 2007-12 Frequency Response 17
Organization Yes or No Question 8 Comment
Question 6 in these comments.
Response: The Standard Drafting Team has addressed your Comment #13 under Question #6.
Ameren Yes Considering the comments made regarding R5, in question 2, above, which are:
R5. While we agree with the requirement of R5, it should not be at the expense of changing the value of L10 in BAL‐001, R2, which has been accepted by FERC in Order 693. An accommodation should be made so that any changes to the Frequency Bias Setting according to BAL‐003, R5, should not affect the value of L10 used in BAL‐001, R2.
Response: The Standard Drafting Team disagrees with your comment. Since L10 is the function of individual frequency bias settings to the sum of all BA Frequency Bias Settings within an Interconnection and establishes operating boundaries, it would be inappropriate to leave L10 as is when a Frequency Bias Setting changes.
Los Angeles Department of Water and Power
Yes LADWP notes that Attachment B seems to be reasonable
Response: Thank you for your response.
FPL Yes Last paragraph: As stated, would that make the Minimum Frequency Bias Setting 0.7% of peak load or generation? A numerical example shown would help clarify this paragraph.
Response: The SDT has added an example to the Background Document.
Southwest Power Pool Regional Entity
Yes Need to clarify that 2012 Bias setting will be based on 1% of peak load or generation until approval of BAL‐003‐1 by FERC establishing the .08% of peak load or generation minimum threshold.
Response: We agree and we have endeavored to do so. The SDT does point out that the proposed minimum for the first year

Consideration of Comments: Project 2007-12 Frequency Response 18
Organization Yes or No Question 8 Comment
once approved by FERC is 0.8% not 0.08%.
Associated Electric Cooperative Inc
Yes This is a very important document, providing bounds and rationale for and future changes, as well as initial settings going into ballot. As such, it is AECI's understanding that, upon going into effect, this BAL‐003‐1 will utilize these initial settings.
Response: Thank you for your response. agree
Imperial Irrigation District Yes
SPP Standards Review Group Yes
ACES Power Marketing Standards Collaborators
Yes
Salt River Project Yes
FMPP Yes
American Electric Power Yes
Cleco Corporation Yes
Manitoba Hydro Yes
Great River Energy Yes
Keen Resources Asia Ltd. Yes
Western Electricity Coordinating Council

Consideration of Comments: Project 2007-12 Frequency Response 19
Organization Yes or No Question 8 Comment
Florida Municipal Power Agency
JEA Electric Compliance
Arizona Public Service Company
Alberta Electric System Operator
ReliabilityFirst

Consideration of Comments: Project 2007-12 Frequency Response 20
9. The SDT has provided an additional spreadsheet, FRS Form 2, to assist the Balancing Authority in providing the data needed to
comply with the proposed standard. Do you agree that this spreadsheet is useful and the instructions are meaningful? If not, please explain in the comment area.
Summary Consideration:
Organization Yes or No Question 9 Comment
Seattle City Light Negative Answer: No Comments: o LADWP and SCL note that Form 2 is not compatible with prior versions of Excel‐it won’t even open in Excel 2003 (which is still widely used)‐and requests that all spreadsheets and calculation tools developed under 2007‐12 be revised to support common software of the past 10 years.
Response: Excel 2003 versions of all forms have been developed. Add URL
Seattle City Light No o LADWP and SCL note that Form 2 is not compatible with prior versions of Excel‐it won’t even open in Excel 2003 (which is still widely used)‐and requests that all spreadsheets and calculation tools developed under 2007‐12 be revised to support common software of the past 10 years.
Response: Excel 2003 versions of all forms have been developed.
Associated Electric Cooperative Inc
No AECI believes the SDT could spare our industry both confusion and inconsistency, by specifying that identified Interconnection Disturbances include both Point A and Point B to the hour, minute, and second. While this introduces some risk of Entities over‐automating their data‐reports, the benefits for Eastern Interconnection respondents would be tremendous. Cautions and disclaimers should be placed on both Form 1 and Form 2, to assure respondents manually inspect their frequency data and pinpoint the specific inflection‐point samples.

Consideration of Comments: Project 2007-12 Frequency Response 21
Organization Yes or No Question 9 Comment
Response: Form 1 contains the time of the event including the hour, minute and second for t(0) and a graph of frequency data for each event in the list. The time for each BA’s t(0) may vary from this time due to different sample rates of data and physical proximity to the contingency. Since this standard does not identify a “A Point” or “B Point” but calculates an “A Value” and “B Value”, providing an exact time for these provides little value. T(0) is the focus of the measurement process and is the first observed change in frequency of the event. Also added to Form 1, the BA can enter the time zone of their data and the time of t(0) will be converted to the correct time in that zone. We agree that the proper selection of t(0) is important. This can be viewed on the “Graph 20 to 52s” worksheet. When set correctly, the first change in frequency of the event will be exactly in the center of the graph on the vertical grid line.
Bonneville Power Administration
No BPA believes the form is not easily understood and is overly complicated for what it is trying to accomplish. BPA believes the form might work for an internal evaluation, just not for an external audit. Compliance is based on this form. BPA believes the standard needs to be simplified and possibly returned to a data gathering standard.
Response: The addition of “Adjustments” to the analysis did add complexity to the Form. These were added based on comments received from the industry on previous postings. Some of these “Adjustments” may be removed as the field trial progresses if they are not utilized. In the latest Form 2, version 6, the multiple time period averages were removed since the final average period was selected based on the results of the first round of the field trial evaluated last fall. However, Form 2 is important to the standard in that it achieves the requirement of measuring frequency response in the same manner for all Interconnections. Returning Form 2 with Form 1 allows validation of the selection of t(0) which is critical for this requirement.
Order 693
FPL No FRS Form 2 ‐ Two‐second Sample DataInstructions tab/worksheet: What is referred to as or meant by the ‘master event list’?
4. ‐ Regarding 2 second sample rate for 25 minutes starting 2 minutes before event begins and 15 minutes after it begins, does this add up to 25 minutes or are additional minutes being required for collection? Also, FPL can report frequency at this rate, but can only report load in MW every four seconds. Move to 4 second sample rate.6‐8. ‐ Possible to add button to auto‐populate cells C8 and C11 in ‘Entry Data’ tab from the new column C and cell identifying the desired frequency change

Consideration of Comments: Project 2007-12 Frequency Response 22
Organization Yes or No Question 9 Comment
time and simplify these steps?
10. ‐ Clarify where the “Copy” button is. Is it the one in the ‘Data’ tab or worksheet?
Entry Data tab/worksheet:Step 6 should also be or be moved to the “Instructions” worksheet.Are the values in column C in the “Data” worksheet labeled “Total Lost Generation” the same as those in column AQ in the “Evaluation” worksheet? If so, why are they not both labeled “Net Actual Interchange”?
What is the definition of “Non Conforming Load” in column E?
Response: “Master event list” refers to the event list contained in each Interconnection’s Form 1. The inconsistency in the data sample totals has been corrected. The absolute minimum amount of data required for the full analysis is two minutes before the beginning of the event to 15 minutes after the beginning of the event. The calculation rate of “Load” can be at a different rate than the AGC scan rate. The Load data is not used in measuring performance. The variability of Load can impact measured performance and can be observed on the “BA Load Dampening” worksheet graph. On some Interconnections, load dampening can be observed in the data. Using the historian “data sample” collection option, it will fill the spreadsheet with the same value of Load, changing at the calculation rate. The “auto populate” of cells C8 and C11 is a good idea. A couple BAs did this during the first phase of the field trail. The problem is that the event time of t(0) in column C were set using 2 second scan data in one part of the interconnection and the beginning of the event may be shifted one or two scans when frequency is scanned less often. This would make this automation difficult for the value in C8. It is critical for the measure for t(0) to be set correctly. The value of C11 is less critical and is not used in the initial primary frequency response measure. It is only used to demonstrate delivery of primary frequency response during the frequency recovery period. The location of the “Copy” button has been clarified. Step 6 on the “Data Entry” worksheet was added to the “Instructions” worksheet. The values in column C in the “Data” worksheet labeled “Total Lost Generation” is for single BA Interconnections only. It takes the place of “Net Actual Interchange” for multiple BA Interconnections. Column “AO” on the “Evaluation” worksheet is not the same as the “Contingent BA Lost Generation” data on the “Evaluation” worksheet. The “Contingent BA Lost Generation” data is only used by multiple BA Interconnection BAs not Single BA Interconnections. The “Data” worksheet for the “Single BA Interconnection” Forms has an n/a in columns G, H and I and should not be used by these Interconnections. This is noted on their “Instructions” worksheet. This should explain why they are not labeled the same.
Non‐conforming Load is Load that changes abnormally different than the conventional diurnal load pattern of a Balancing Authority Area. Non‐conforming Load becomes significant when the net change within a few minutes is greater than a BA’s L10

Consideration of Comments: Project 2007-12 Frequency Response 23
Organization Yes or No Question 9 Comment
limit. The importance here is that this load change can be ten times larger than some BAs FRO and make measuring the SEFRD inaccurate. An example of non‐conforming load would be an arc furnace of a significant size.
Thank you for your comments and the effort to find each of these items.
ISO/RTO Council Standards Review Committee
No If we are not mistaken, Form 2 is added as the last sheet in the Form 1 spreadsheet file. Apart from that, however, there are other sheets added to the previous Form 1. But this Comment form makes no mention of the changes, nor is there a question in the Comment Form asking whether the additional information should be requested. We believe this is a significant change to the standard and many commenters may have missed the opportunity to comment on it. Compared to the previous version, Form 1 has been significantly expanded to include not only additional sheets but much more comprehensive data requirements even on the Data Entry sheet itself. This makes data submission a very time‐consuming task but the justification for requiring detailed data entry has not been provided. We question the need for such expansion on data entry requirements. We have yet to see the reason for expanding Form 1 in assisting a BA to provide the data needed to comply with the standard, hence we do not see how adding a Form 2 can help in that regard. We suggest the SDT to keep data requirements to only what is minimally needed to support the FRS reporting process. Where the SDT deems additional data entry sheets to be necessary, it should provide the rationale for expanding from a 2 sheet form into a multiple sheet form for additional data collection. Where the SDT deems the additional data sheet or information not necessary to support FRS reporting, then we suggest the SDT to hide those pages not required for the standard so as to avoid confusion, and/or to remove those analytical pages not directly used in the standard.
Response: The SDT points out that there are no additional data requirements. It is possible that you are seeing more spreadsheets due to them being unhidden.
Form 2 is a separate stand‐alone workbook. Form 1 does have a worksheet labeled “BA Form 2 Event Data” that will contain the single event data from each of the BA’s Form 2s. Two additional worksheets were added to Form 1 and several worksheets were deleted. The “TimeZone Ref” worksheet was added to allow the ability of the BA to enter the time zone of their data and the

Consideration of Comments: Project 2007-12 Frequency Response 24
Organization Yes or No Question 9 Comment
spreadsheet would calculate the local time of the event from the UTC time. This was added for the convenience of the BA in collecting the correct data for each event and does not require additional data from the BA. The second worksheet added was a worksheet that displays graphs of frequency for each event and the t(0) selected correctly. This was added to aid the BA with data collection and the selection of t(0) since this seemed to be one of the biggest problems during the first phase of the field trial. This graph worksheet does not require the BA to do anything. It is not used in the analysis and can be deleted. Deleting this worksheet will greatly reduce the size of Form 1. None of the data requirements on Form 1 or Form 2 have changed from previous versions. The absolute minimum data needed for this standard is the date/time, frequency and NAI in columns A, B and C of the “Data” worksheet in Form 2. Columns D through I have been totally optional and can be left blank. Column J is the Bias setting in the ACE equation and is important to BA’s that utilize variable Bias. Column K, BA Load, was added by the drafting team in the beginning to see if Load Dampening could be measured as this has been done for several years on one Interconnection. Column I of the “Data” worksheet is the only optional data that the BA should use when they are the contingent BA during any of the events evaluated. Utilizing this data will allow the BA’s SEFRD to be calculated correctly and give the BA a full sample set for the annual median calculation. Form 2 is necessary to standardize the measurement process on all Interconnections. You are free to hide any analytical worksheets on Form 1 and Form 2. You can do this on your “master” Form 2 and then build each Form 2 for each event using this master. These additional worksheets are available for BAs to utilize if they find that their performance is below the FRO and will aid the analysis of the contributing causes.
Independent Electricity System Operator
No If we are not mistaken, Form 2 is added as the last sheet in the Form 1 spreadsheet file. Apart from that, however, there are other sheets added to the previous Form 1. But this Comment form makes no mention of the changes, nor is there a question on the additional information requested. We have a concern over this omission of attention or oversight. Compared to the previous version, Form 1 has been significantly expanded to include not only additional sheets but much more comprehensive data requirements even on the Data Entry sheet itself. This makes data submission a very time‐consuming task but the justification for requiring detailed data entry has not been provided. We question the need for such expansion on data entry requirements. We have yet to see the reason for expanding Form 1 in assisting a BA to provide the data needed to comply with the standard, hence we do not see how adding a Form 2 can help in that regard. We suggest the SDT to look at the basic need for data submission that would suffice to support the FRS reporting process. Where the SDT deems additional data entry sheets to be necessary, it should

Consideration of Comments: Project 2007-12 Frequency Response 25
Organization Yes or No Question 9 Comment
provide the rationale for expanding from a 2 sheet form into a multiple sheet form for additional data collection.
Response: ISO/rto
Los Angeles Department of Water and Power
No LADWP notes that Form 2 is not compatible with prior versions of Excel‐it won’t even open in Excel 2003 (which is still widely used)‐and requests that all spreadsheets and calculation tools developed under 2007‐12 be revised to support common software of the past 10 years.
Response: Excel 2003 versions of all forms have been developed.
Tucson Electric Power No TEP feels that Form 2 is a useful tool for internal BA use and should not be used for compliance purposes.
Response: Form 2 is not intended to be used to reflect compliance but rather for consistency in reporting.
Form 2 was developed so consistent analysis of each event could be validated. During the first round of the field trial, many BAs selected the incorrect t(0), some provided data that was filtered or utilized data compression techniques that caused the analysis to be incorrect. With Form 2, the selection of t(0) can be quickly evaluated and data quality reviewed. The proper selection of t(0) can be made and Form 1 corrected providing validated consistent results.
MRO NSRF Yes : It would be useful if the drafting team could develop a completed form as an example to help entities better understand the methodologies used in the form
Response: All versions of Form 2 contain actual data for frequency and NAI of an event. Sample data was added for each of the adjustments to demonstrate their use and impact on the analysis.
Xcel Energy Yes It would be useful if the drafting team could develop a completed form as an example to help entities better understand the methodologies used in the form.
Response: All versions of Form 2 contain actual data for frequency and NAI of an event. Sample data was added for each of the

Consideration of Comments: Project 2007-12 Frequency Response 26
Organization Yes or No Question 9 Comment
adjustments to demonstrate their use and impact on the analysis.
Ameren Yes We agree that the spreadsheet is meaningful, but still needs to be vetted through the field trial process, with improvements made based on experience in its use.
Response: We completely agree.
Imperial Irrigation District Yes
Northeast Power Coordinating Council
Yes
SERC OC Standards Review Group
Yes
SPP Standards Review Group Yes
Southwest Power Pool Regional Entity
Yes
Salt River Project Yes
Progress Energy Yes
Southern Company Yes
Energy Mark, Inc. Yes
Florida Power & Light Company
Yes
FMPP Yes

Consideration of Comments: Project 2007-12 Frequency Response 27
Organization Yes or No Question 9 Comment
ISO New England Inc Yes
NV Energy Yes
American Electric Power Yes
South Carolina Electric and Gas
Yes
Cleco Corporation Yes
Manitoba Hydro Yes
Constellation Energy Commodities Group
Yes
Great River Energy Yes
Hydro‐Quebec TransEnergie Yes
Duke Energy Yes
Keen Resources Asia Ltd. Yes
Western Electricity Coordinating Council
Florida Municipal Power Agency
JEA Electric Compliance

Consideration of Comments: Project 2007-12 Frequency Response 28
Organization Yes or No Question 9 Comment
ACES Power Marketing Standards Collaborators
Sacramento Municipal Utility District (SMUD)
Arizona Public Service Company
ERCOT
Texas Reliability Entity
Alberta Electric System Operator
ReliabilityFirst


