Conservation Strategy: Where It Matters Most
26
Conservation Strategy: Where It Matters Most Integrating Demographics, Socioeconomic Lifestyles and Biodiversity Final Report Kim Struthers Candidate for the degree of Master of Geographic Information Systems Department of Geography College of Earth and Mineral Sciences The Pennsylvania State University Advisor: Dr. Justine Blanford
Transcript of Conservation Strategy: Where It Matters Most

Conservation Strategy: Where It Matters Most Integrating Demographics, Socioeconomic Lifestyles and Biodiversity
Final Report
Kim Struthers
Candidate for the degree of Master of Geographic Information Systems
Department of Geography
College of Earth and Mineral Sciences
The Pennsylvania State University
Advisor: Dr. Justine Blanford

2
Introduction
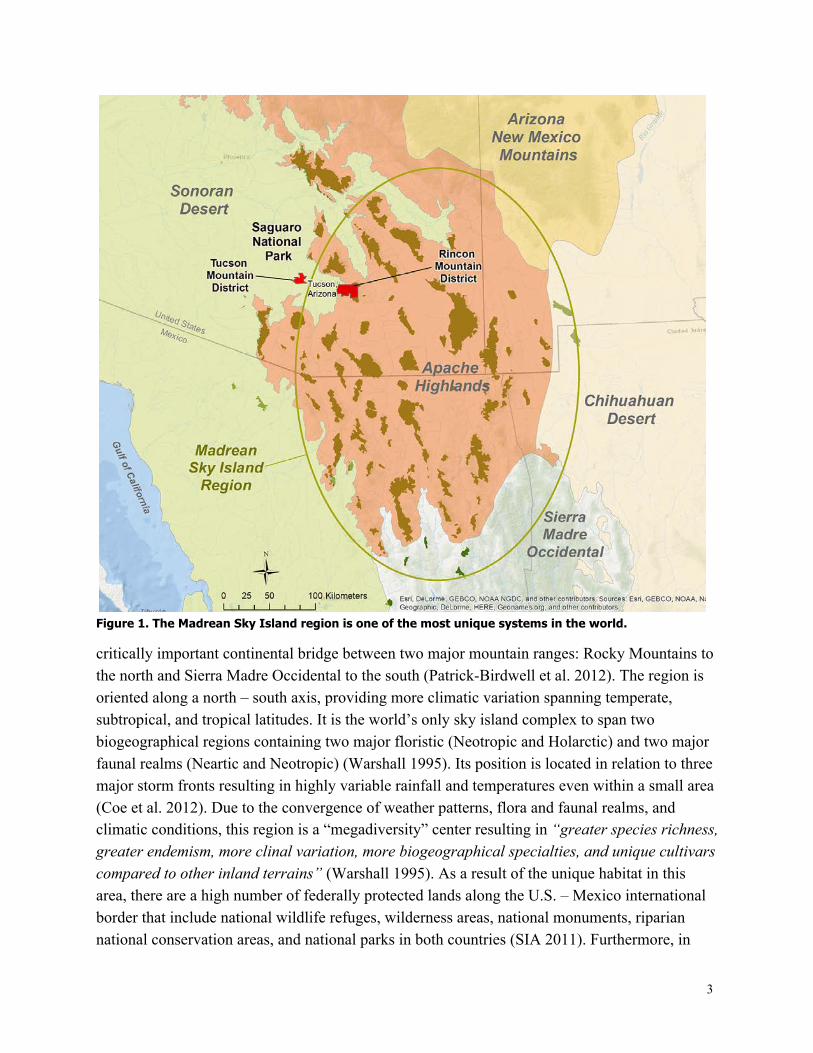
Rapidly changing climate, development of land, and growing populations pose increasing conversion risks for habitats and associated fauna managed by conservation agencies such as the National Park Service (NPS) (Monahan et al. 2012; Svancara et al. 2009; Theobald 2010). Climate change effects are expected to impact Southwestern United States more greatly than other areas in the continental U.S. Most climate change projection models for the Southwest estimate less precipitation (Christensen et al. 2007; Seager et al. 2007) and increased droughts (Seager et al. 2007). In fact, many models predict a 3-6 oC increase over the next 100 years (Kupfer et al. 2005), creating stress on vegetation communities and those species that have coevolved within those habitats, especially ones located at higher elevations (NPS-SODN 2014a). Climate change will affect a variety of freshwater and terrestrial ecosystems (Scholes and Settele 2014), threatening species that rely upon unique habitats such as sky islands (McCormack et al. 2009). “Sky islands” originally coined by Weldon Heald (1951) refer to high-elevation habitats that are isolated by valleys and act as barriers to dispersal due to inhospitable lowlands (e.g. plateaus, ridges, paramos, and alpine meadows) (McCormack et al. 2009). However, in some cases, these valleys can provide a bridge for dispersal depending on the area and ecology of the species. Although isolation has facilitated divergence (e.g. avian species in New Guinean montane habitats (Mayr & Diamond 1976), the connectedness between isolated habitats has also been shown to impact a species' population structure and distribution (DeChaine and Martin 2005). This dynamic interplay of processes can result in high endemism (e.g. vertebrate species in Tanzania and Kenya (Burgess et al. 2007)); various taxa in the Mexican sky islands (Peterson et al. 1993), and due to the isolation of populations, sky islands can provide a window into evolutionary processes and diversity through the divergence of populations that harbor unique genetic and phenotypic diversity (McCormick et al. 2009). Throughout the world there are approximately 20 sky island complexes, each with a distinct origin, spatial arrangement, age, and climate history (see McCormack et al. 2009 and Warshall 1995 for some examples). Of these, the Madrean Sky Island region extends from southeastern Arizona and southwestern New Mexico, US, and northwest region of Sonora and Chihuahua, Mexico (Figure 1). The United States portion of the Madrean complex is composed of 30-40 forested continental islands separated by mountains and valleys (Warshall 1995), encompassing a total area of 40,536 km2 (Warshall 1995). It is surrounded by two of North America’s intervening deserts and grasslands that meet at the confluence of four major ecosystems: the Colorado Plateau, the Sierra Madre Occidental, and the Sonoran and Chihuahuan deserts (Patrick-Birdwell et al. 2012). It is a
3
Figure 1. The Madrean Sky Island region is one of the most unique systems in the world.
critically important continental bridge between two major mountain ranges: Rocky Mountains to the north and Sierra Madre Occidental to the south (Patrick-Birdwell et al. 2012). The region is oriented along a north – south axis, providing more climatic variation spanning temperate, subtropical, and tropical latitudes. It is the world’s only sky island complex to span two biogeographical regions containing two major floristic (Neotropic and Holarctic) and two major faunal realms (Neartic and Neotropic) (Warshall 1995). Its position is located in relation to three major storm fronts resulting in highly variable rainfall and temperatures even within a small area (Coe et al. 2012). Due to the convergence of weather patterns, flora and faunal realms, and climatic conditions, this region is a “megadiversity” center resulting in “greater species richness, greater endemism, more clinal variation, more biogeographical specialties, and unique cultivars compared to other inland terrains” (Warshall 1995). As a result of the unique habitat in this area, there are a high number of federally protected lands along the U.S. – Mexico international border that include national wildlife refuges, wilderness areas, national monuments, riparian national conservation areas, and national parks in both countries (SIA 2011). Furthermore, in

4
2005, the Madrean pine-oak woodland was designated a biological hotspot by Conservation International (Patrick-Birdwell et al. 2012), and Birdlife International (2014) designated Mexico’s Sierra Madre Occidental as an Endemic Bird Area. Within this archipelago, Saguaro National Park’s (NP) Rincon Mountain District (RMD) is one of the Madrean sky islands in the U.S.; however, the park’s other district, Tucson Mountain District, is located in the Sonoran Desert ecosystem only and is not considered to be one of the sky islands. Both park districts are located just outside Tucson, Arizona city limits in Pima County (Figure 2).
Figure 2. Saguaro National Park's mountain districts are separated by the city of Tucson, Arizona.
RMD was established in 1933 (and TMD was added to the park at a later date) to preserve and protect saguaro cacti, diverse biotic communities, cultural and archeological features, and scientific, scenic, and wilderness values (NPS 2014a). Between the two districts’ 37,005 ha, they support five biomes, which are characterized by distinct vegetation communities and ecological diversity. The biomes within RMD, from lowest elevation to highest, are thornscrub, semi-desert grassland, interior chaparral, Madrean (oak-pine) woodlands, and temperate forest biomes, ranging from 814 – 2641 meters in elevation (Figure 3). This includes all of the globally

5
recognized biomes except for the tundra (NPS-SODN 2014b). These communities are under threat from a variety of human impacts that include climate change, land use change and population increases. Human Impact Threats on Saguaro National Park According to the IPCC (2014), both climate and land use changes have resulted in increased frequency of droughts and aridity in drier climates
(Scholes and Settele 2014). Monahan and Fisichelli (2014) found that climatic conditions around the NP have already shifted beyond the historical range of variability, with four temperature variables representing the warmest on record. Surveys of present day sky island plant distributions compared to those taken in 1963 revealed that the Southwest is experiencing rapid vegetation changes with significant upward movement of lower elevation boundaries and contractions in elevational range as a result of a decrease in mean annual rainfall and a 0.25°C/decade increase in mean annual temperatures (Brusca et al. 2013). Thus, areas most at risk are those located at the higher elevations, with even small increases in temperature likely pushing existing habitats higher, potentially leading to local extinctions of species (NPS-SODN 2014b). The NPS’ Sonoran Desert Inventory and Monitoring Network (SODN) analyzed 100 years of Sonoran Desert vegetation data in three different plant communities, comparing change in plant cover to annual precipitation and temperatures. They found that a decrease in abundance of dominant Sonoran Desert plants in years with high temperatures has occurred (NPS SODN 2012). Although these resilient sky island systems have endured large-scale shifts in climate throughout the Pleistocene, the quickened pace of human-induced climate change may have potentially devastating consequences to their biodiversity and evolutionary potential (McCormack et al. 2009).
Figure 3. The Rincon Mountain District contains five of the world's biomes.

6
Land cover/land use change and population growth alter ecosystem functions through habitat fragmentation and land cover conversions. These impacts reduce connectivity between habitats, food sources, and protective vegetative cover for native species (Monahan et al. 2012). Changes in land use have been small between 1973 and 2000 for the Madrean Archipelago due to sparse population throughout the ecoregion, mountainous terrain, lack of water, and high percentage of federal lands (Ruhlman et al. 2014). Any changes that did take place resulted primarily in the conversion of grassland/shrubland to mining and agriculture. However, in general, population has been increasing rapidly throughout Arizona, especially in areas surrounding Tucson and Phoenix. Between 1950 and 2000 there was a 584% increase in population (Pima County Association of Governments n.d.), and the U.S. Census Bureau’s (2005) interim state population projections predict Arizona to be the second highest state for population growth between 2000-2030, increasing by 109% (U.S. Census Bureau 2012). Monahan et al. (2013) examined landscape dynamics surrounding the NP and reported that when the park was established in 1933, the city of Tucson had a population less than 40,000, with dirt roads separating the park from the city (Monahan et al. 2013). Now, with rapid urbanization and ever-increasing rates of population growth, species are threatened. It is anticipated that population growth will continue, in particular throughout the areas adjacent to both park districts. The increased development has occurred in the form of residential and commercial buildings as well as in the number and size of roads. Direct impacts of roads on wildlife species include mortality due to collisions, whereas, indirect impacts include behavioral changes such as traffic noise avoidance. Traffic-independent impacts include increasing edge effects that result from the fragmentation of habitats, which have been known to alter species populations by increasing bird predation by domesticated cats and/or by altering mammal movements (Monahan et al. 2012). Recently, Swann and Perkins (in Gottfried et al. 2013) conducted a camera trap study in Saguaro NP to systematically document the diversity and distribution of mammals and found that several species may already be extirpated as a result of increasing urbanization shifting species movements and/or decreasing available habitat. Species vulnerability With the threats of changing climate, increasing population growth, and rapid land use/cover conversions from natural to developed, conserving species in areas most critical to their survival needs is of utmost importance. Understanding how and where these rapid changes will impact species the most is important for developing adaptive conservation management strategies. In 2000, Pima County developed a Sonoran Desert Conservation Plan (SDCP) in response to rapid land use and climate changes that included over 200 technical reports addressing elements such as critical habitats, biological corridors, riparian areas, and mountain parks throughout the county (Pima County 2014). The overall biological goal of the plan was to ensure long-term

7
survival of native species and their environments by identifying areas that will remain natural (Pima County 2014). Studies that focused on mammal movements (e.g., jaguars and black bears) throughout the Madrean Sky Island region identified regions that are the “seas” (grasslands) between sky islands as areas in need of conservation. Atwood et al. (2011) modeled the connectivity of black bears throughout the sky island archipelago and identified the corridors most often occurred within the lower elevation desert and desert-scrub environments. Specifically, jaguar was recorded by camera traps, occurring in close proximity to water sources, which were often located at lower elevations (Atwood et al. 2011) and associated with riparian habitat. For mammal movements, it appears as if urbanization / development throughout the areas identified as habitat corridors will be the most threatening factor to the continued existence of the species. The Audubon Climate Report (2014) identified 314 North American bird species that are most threatened by climate change, 50 of which are either threatened or endangered as a result of climate change in Arizona. Comparing Saguaro’s bird list (Certified Species List 2014) to the 50 species listed in the Audubon Climate Report, 24 are in common. Falk (2013) posits that it is a combination of climate change and severe disturbances, such as high severity fires or insect outbreaks, which are often influenced by land use changes, that will largely influence ecosystem changes throughout the Madrean Sky Island complex. Others assessed climate change vulnerability throughout the desert southwest (Coe et al. 2011; Comer et al. 2012; Scholes and Settele 2014) and land use change throughout national parks (Hansen et al. 2014), predicting negative impacts to species, especially ones located at higher elevations. Saunders et al. (2009) identified Saguaro NP as one of 25 parks most at risk due to climate change, including the possible extirpation of the iconic Saguaro (Carnegiea gigantea), and Hansen et al. (2014) identified the park as one of the most threatened national parks due to land use change. The National Park Service’s Climate Change Action Plan (2012-2014) encourages parks to assess vulnerability of park natural resources and requires knowing what resources are vulnerable and where to focus conservation efforts. While there are many uncertainties about species responses to climate and land use changes, flexible management approaches will undoubtedly need to be factored into any conservation strategy. However, most protected areas are not self-contained ecosystems, and many of those species that utilize resources within protected areas are also dependent upon resources located outside political boundaries to fulfill some phase of their life cycle. The General Accounting Office (1994) identified fewer than 10% of endangered species within the U.S. occurred exclusively on public land, and due to human activities, it is estimated that two in every three species are in decline (Actionbioscience 2015). This loss of biodiversity has been identified as an important contributor to the decline of key ecosystem services that humans rely upon for medicine and agriculture and that other species depend upon for their survival needs and processes (Millennium Ecosystem Assessment 2005).

8
Couple these facts with an ever-increasing human population that poses conversion risks for habitats and associated fauna surrounding protected areas, many resources are in peril, likely resulting in extirpation or extinction of populations (Monahan et al. 2012; Svancara et al. 2009; Theobald 2005; Theobald 2010). Proactive management strategies need to be employed that engage local citizens in conservation efforts. Communities throughout Tucson, specifically those surrounding Saguaro NP, appear to be supportive of conservation efforts. One proactive approach is to identify areas predicted to be the most impacted by future threats and identify the characteristics of residents within those areas to develop effective outreach strategies for increased public involvement. This type of information could be used within an conservation adaptation-planning context to increase habitat connectivity, prioritize species monitoring locations, and mitigate threats when and where feasible. Tucson Conservation Tucson’s conservation ethic can be traced back to as early as 1961 when the Rincon Area Plan was the first developed through the Pima County planning process that focused on environmental and lifestyle issues. The plan was developed using a review committee comprised of citizens who requested the consideration of future land use planning (Behlau 2000) “to relate residential densities to topography and to minimize grading for the protection of public health and desert vegetation. Another consideration was to include a provision for developing a range of affordable housing types within the planning area” (p. 107 Behlau 2000). However, the committee was in disagreement over planning recommendations for an area near Saguaro NP’s RMD. A Ranching interest group wanted the area near the park to be zoned as general rural instead of suburban ranch and requested a separate plan for what became the Rincon Valley Area Plan (Behlau 2000). Owners of undeveloped land within the planning area desired higher residential or business zoning. Eventually the plan was approved, although controversially, subdividing the traditional 16-ha-plus ranches into 4-8 ha ‘ranchettes’ (Briggs et al. 1997). The plan was updated in 1979, and by the 1980s, several ranches were divided into 0.40-ha private residential neighborhoods (A. Gibson, per comm., 1996 as cited in Briggs et al. 1996). The 1979 plan remained the official one for the Rincon area until October 1992; the decade in which the City of Tucson reached Saguaro NP’s RMD. In the early 90s, and more than 25 years in the making, a planned resort and residential development south of the RMD was initiated. It was a contested project – one of preservation versus development, but in the end, the Rincon Institute, which is a non-profit environmental group, was created to guide the development in a more environmentally sensitive way. The

9
original development plan was scaled back from 21,000-units to 2,000-3,000 homes, from four resorts to one, from three golf courses to one, and from 243 hectares of shopping centers to a 20 to 30.4 hectare commercial center and smaller areas of commercial developments (Davis 2013). In addition, the park purchased approximately 769 hectares (1,900 acres) of high quality riparian habitat, which was originally part of the development, expanding the park’s southern boundary. Riparian habitat in Arizona is one of the highest priority habitats for protection, supporting 60-75% of all Arizona species during some phase of their life cycles (Pima County nd). Tucson Resident Perceptions and Attitudes of Wildlife and Urban Encroachment Public surveys of residents surrounding Saguaro NP have been conducted (Harris and Shaw 1997, Yeasmin 2011, and Casey et al. 2005) in addition to numerous other surveys in other locations (Thornton and Quinn 2009, Shumway et al. 2014, McFarlane et al. 2007) to gauge attitudes and perceptions about wildlife and impacts from urban encroachment as well as perceptions about protected areas. Yeasmin (2011) analyzed land use change and surveyed residents mostly within a 3.2 km (2 mi) mile area (a slightly larger area was surveyed to the south) surrounding RMD. Residents were asked about their perceptions of wildlife and their habitats, possible conflicts with wildlife, possible solutions, and basic personal information such as gender and education level as well as how frequently they visited the park. Residents were also polled to determine ways to minimize the impacts of near-by urban growth on RMD. The study revealed that residential buildings increased dramatically (71.53%) within the study area from 1992 to 2007, resulting in very rapid land use changes. The residents within the same area believed that increased urbanization negatively impacted local wildlife but only moderately. Neighbors greater than two miles from RMD were even less likely to believe that housing developments, in particular, were as serious of a threat to local wildlife. Residents were also asked about their perceptions on reducing possible wildlife conflicts in various ways, including placement of road developments, managing pets, and the frequency of observing selected wildlife species, both dead and alive. They perceived impacts from housing and road developments on wildlife diversity to be the same degree as the land use change, which was moderate. Residents also ‘strongly supported’ increased communication efforts between authorities, developers and neighbors, and environmental education programs to increase awareness relative to urbanization effects on protected areas and species (Yeasmin 2011). Harris and Shaw (1997) conducted a public perception survey within a 1.6 km (1 mi) zone of large federal protected areas throughout Tucson, Arizona. The survey was intended to identify resident interests in wildlife and their attitudes toward the protected areas and developments in their neighborhoods. Living near protected areas was very important to residents and was a
10
factor in choosing where they lived. Over 91% of residents had a scenic view of a protected area, and while hiking was identified as a popular recreational activity, it occurred infrequently. Residents believed that their proximity to protected areas increased the amount of wildlife in their neighborhoods, and most of the residents provided food and/or water (80%) for wildlife, but only 8% provided water using Arizona Game and Fish Department’s recommended method. Residents believed that low density housing (1 acre+ per house) was the most appropriate zoning for land close to protected areas. Free-roaming dogs were often observed and perceived unfavorably by residents. Most supported regulations that would prohibit unleashed dogs. Most residents were also concerned about pet (e.g., cats, dogs) predation by wildlife and damage to such things as gardens and electrical wires. Additionally, some residents identified sounds originating from coyotes and woodpeckers as undesirable. Another survey conducted by Casey et al. (2005) assessed the knowledge and attitudes of residents toward mountain lions (Puma concolor) in the area surrounding Tucson. There was local support for mountain lion conservation efforts; however, knowledge about the mammal’s biology was minimal. Most of the respondents (76%) believed increased environmental education opportunities would benefit their understanding of mountain lions and conservation. Some commonalities between the Tucson-area public surveys included a great appreciation for the natural beauty and quiet that protected areas offered. Living near a protected area and the associated aesthetics were major determining factors for where residents chose to live. Also, while there seemed to be an inherent conservation ethic shared among residents, the wildlife impacts from urbanization, degree of urbanization, and wildlife biology were not well understood. Socio-economic and Demographics of Park Users (proxy for local residents) Many socio-demographic variables influence both interest and use of parks by local and non-local residents. These include age, sex, race, ethnicity, and household composition, as well as socio-economic factors such as education, income levels, disability, and home ownership. Other user-centered variables also potentially influence park use, including residential location, physical mobility (e.g., car-ownership), time resources (e.g., working poor), attitudes towards nature, and leisure preferences. For example, Niepoth (1973) suggested that, among other factors, physical fitness, age, income, time, knowledge/awareness, and skills are important correlates of park use. Leisure researchers find that various ethnoracial groups exhibit distinct preferences for leisure settings, have diverse reasons for visiting parks, and favor different activities (for detailed reviews, see Husbands and Idahosa 1995; Floyd 2001). African-Americans reputedly enjoy more sociable, sports orientated, urban park settings, whereas Whites are said to focus on

11
individualism and apparently prefer settings that offer secluded nature experiences and dog-walking (Washburn 1978; Hutchison 1987; Taylor 1989; Talbot and Kaplan 1993; Johnson et al. 1998; Floyd and Shinew1999; Virden and Walker 1999; Tierney et al. 2001; Gobster 2002; Payne et al. 2002; Ho et al. 2005). Asians appear to value ‘scenic beauty’ over recreational functionality (Gobster 2002; Payne et al. 2002; Ho et al. 2005), whereas Latinos are said to desire ‘a more developed environment’ with good access to group facilities such as parking, picnic tables and restrooms for informal social activities (e.g., picnicking with extended family groups) (Baas et al. 1993; see also Hutchison 1987; Irwin et al. 1990). Thus park use incorporates elements of: (1) the socio-demographic characteristics of park users and non-users – as suggested by leisure research; (2) the political ecology and amenities of the park itself – e.g., landscape design, vegetation, and facilities, features of surrounding neighborhoods and land uses, management regime; (3) the historical and cultural landscapes of park provision – such as discriminatory land-use practices, philosophy of park design, or politics of development; and (4) individual perceptions of park spaces – eg, accessibility, safety, conviviality, or sense of welcome, all mediated by personal characteristics, and the park’s political ecology, history, and cultural landscape. Through leveraging leisure research information about park users, conservation agencies can customize outreach messaging to local residents residing in areas of high conservation potential. And since very few protected areas are large enough to encompass self-contained ecosystems, they must rely upon the larger, surrounding areas and local partnerships to support the life cycles of the species important to an area (Coggins 1987). Saguaro NP staff reinforced this concept when they stated that “collaboration with organizations, communities, and other partners as one of the most important means to mitigate the cause of global climate change and adapt to its effects.” They further stated that the scale of climate change impacts far exceeded the ability of any one organization to effectively respond and that an integrated, cooperative adaptive strategy applied across large geographic areas would provide more informed, comprehensive, and successful results” (NPS 2014, p.16). Develop Decision Support Framework for Conservation Efforts Thus, the primary goal of this study was to develop a decision support framework for park staff to target conservation outreach efforts with local residents surrounding RMD. By integrating an ecological perspective that extended beyond park administrative boundaries and using existing GIS data sets to assess high species rich areas, unprotected areas, and high projected housing density locations, the areas where conservation efforts should be focused were identified. Using socioeconomic and demographic data for the populations within those identified areas provided

12
information on who lived in those high priority areas. The results were combined in a decision-support matrix, containing information to help managers effectively develop and target outreach efforts to achieve conservation goals. Methods and Results The methodology, data sets and interim results of the study are summarized in the following steps and shown in Figure 7.
Step 1: Added RMD boundary and created a 1.6 km (1 mi) buffer. Pima County supervisors identify a one-mile buffer around protected areas as high priority conservation zones, which became the study area for this project (refer to Figure 4).
Step 2: Added species richness and protected areas data and clipped both data sets by the study area.
Species Richness Data Set: As part of the effort to develop a conservation plan for Pima County, county officials identified the most vulnerable plants and animals throughout the county. Forty-four species (4 plants, 7 mammals, 8 birds, 5 fish, 2 amphibians, 6 reptiles, and 12 invertebrates) were selected based on their current, anticipated, or possible designation as a Threatened or Endangered species and because of their anticipated decline as a result of proposed activities related to development and associated infrastructure projects (Huckelberry 2008). Fifteen of these species have been documented within RMS, with one species, Gila topminnow, being already extirpated from the park. The potential habitat for each species was modeled at a resolution of 9.3 hectares (23 acres) and compiled into one data layer that was used to determine the areas of high biological value within the interactive zone. Key environmental characteristics that comprised each species’ habitat were identified. These characteristics included vegetation / land cover, streams, groundwater, elevation, slope, aspect, geology, and soils data. A total of 115 characteristics were scored as potential habitat for each species, resulting in a habitat matrix. The matrix defined the model’s parameters for GIS grid analysis, using 100 m grid cells. Grids for each species were “stacked” and summed to represent all applicable characteristics for each species resulting in the habitat model (Pima County 2001).
Step 3: Erased the protected areas from the species richness data set, which resulted in the unprotected species rich areas output.
Protected Area Data Sets: Areas outside RMD’s boundary differ by ownership and management mandates but remain critical for many park species’ survival. Using Pima County’s data set that included the Protected Areas Database of the US (PAD-US) from the USGS’ Gap Analysis Program (2012) and additional county lands identified for mitigation purposes, the lands that

13
were either currently protected or identified for future protection were erased from the species richness layer, leaving only those areas without any planned protection.
Step 4: Converted the unprotected species rich area from polygon to raster.
Areas of High Biodiversity with No Protection The locations within the study area (i.e., interaction zone) with the highest species richness and no current or future protection status are shown in Figure 4. The highest species diversity areas were located to the northwest and southwest of RMD’s boundary.
Figure 4. Areas of high species richness without current or future protection.
Step 5: Extracted SERGoM data by mask, using the study area as the mask.
SERGoM Data Set: Future land use change and population increases were represented as projected housing density rasters (100 m resolution) for 2000, 2010, 2020, 2030, 2060, and 2090 based on Theobald’s (2005) Spatially Explicit Regional Growth Model (SERGoM) (NPS 2014b). SERGoM forecasts changes on a decadal basis using county specific population estimates and variable growth rates that are location-specific. Distribution of projected growth was based on accessibility to the nearest urban core, defined as development >100 ha. The model

14
assumed that housing density would not decline, which is consistent with population projections throughout all of Arizona (Pima Association of Governments n.d.). Spatial Analyst’s ‘extract by mask’ tool was used to clip the raster to the study area.
Step 6: Raster Calculator was used to determine the percent change between the current (2010) and 2000, 2020, 2030, 2060 SERGoM data sets. Based on the results, the raster for 2010/2060 percent change was used since all remaining years analyzed showed growth throughout the same areas as 2060, but 2060 represented the largest area (i.e., cumulative projected growth).
Step 7: Used Raster Calculator to add the SERGoM 2010/2060 percent change raster to the unprotected species rich areas raster, which created the ‘High Priority Conservation Areas’ shown in Figure 5.
The results for the percent change in housing growth analysis, using the SERGoM data revealed areas of highest growth for all years of analysis within the study area, occurred in the southwest region of the park. These results were consistent with the U.S. Census Bureau population change that occurred between 2000 and 2010.
High Priority Conservation Area/Need Results: Six locations of high conservation need were identified (sites A-F) (Figure 6).
Figure 5. Unprotected high species rich areas and high projected future housing growth.

15
Figure 6. Six areas of high conservation need were identified (A-F) after adding unprotected high species rich areas and high projected housing growth rasters.
Step 8: Developed a priority matrix to rank the ‘Areas of High Conservation Need’, identifying highest to lowest priority areas based upon selected criteria shown in Table 1.
These six locations were prioritized using the ranking criteria shown in Table 1. The criteria included:
• whether areas were already within RMD’s legislated boundary, which would provide a certain degree of increased protection (even though these areas are not managed by the NPS);
• whether the high conservation need area was adjacent to another high conservation need area, increasing connectedness of high priority areas; or
• whether the high conservation need area was adjacent to a current/future protected area, affording greater protection from potential habitat conversion.
Table 1. Ranking criteria for high conservation need (HCN) areas
HCN Areas
Not
in RMD
Adjacent Protected Area (non-NPS)
Adjacent High Priority Area
Size
of HCN Area
Priority Ranking 1=Low
A 1 3 4 B 1 1 C 2 2 D 1 1 4 6 E 1 1 1 5 8 F 1 6 7

16
These criteria were selected based on maximizing any conservation efforts by preserving habitat connectedness thereby reducing fragmentation. The prioritization criteria also included the size of the areas identified for highest conservation need. Overall, locations E and F ranked highest for conservation need; locations D and A followed in priority ranking. Then locations C and B, ranked as lowest priority. A flowchart summarizing steps 1-8 is shown in Figure 7.
Figure 7. Flowchart of study methods steps 1-8 and high priority location results, shown in the map.
Step 9: The socioeconomic and demographic characteristics of the residents living in high priority areas E and F were obtained U.S. Census Bureau’s 2000 and 2010 data and using ESRI’s (2015) Tapestry Segmentation data set. U.S. Census Bureau 2000 and 2010 Census Tracts: Pima County’s U.S. Census Bureau population and ethnicity data sets from 2000 and 2010, including the SF1 files, were used to determine total and percent change of population and ethnic composition between 2000 and 2010 for high priority areas E and F (Pima County GIS 2015). A large portion of the tracts included USGS GAP status lands that either did not allow and/or included very low housing densities that would unlikely be further developed, such as those lands located within the park’s boundary. As a result, these areas were removed using the overlay analysis erase tool. For the purposes of

17
reporting the population and ethnic composition changes more accurately, the original configuration of the tracts were retained even though they extended beyond the one-mile study area, and two tract areas were modified (i.e., combined in two areas) to maintain the same tract configurations between the U.S. Census Bureau’s 2000 and 2010 data sets, allowing comparison between the two decades. The total population surrounding RMD nearly doubled from 2000 to 2010, representing an 89.2% growth rate, with population densities increasing from 113.8 mi2 in 2000 to 215.4 mi2 in 2010. The population change within each tract from 2000 to 2010 ranged from 3% to 432%, with the largest amount of the growth occurring southwest (432%) and primarily south (136%) of the park (Figure 8), which also corresponded to the areas with more ethnic diversity. The smallest change in population growth occurred in the northern tracts.
Figure 8. All areas surrounding RMD increased in population between 2000 and 2010 ranging from 3-432%.
The general trend in ethnic composition was one of increasing diversity from areas in the north to south. In general, more Whites resided in the northern tracts. Although diversity increased in areas south of the park, the population was still predominately White. In all areas, Whites and Hispanics accounted for 90+% of the ethnic groups, except for the southwestern area in 2000 when both races comprised only 89.4% of the population. The ‘other’ category of ethnicity

18
represented the next highest percent ethnic composition. Asian, Black, and American Indian races combined ranged from 2.7-6.8% of the ethnic group composition change between 2000 and 2010. The highest concentration of these three races was in the areas where the population increased by 35% and 432% between 2000 and 2010. The number of Hawaiians throughout the census tracts were negligible, therefore were not included in the analysis. A summary of the percentage of ethnic groups surrounding RMD for 2000 and 2010 is presented in Table 2. Table 2. Percentage of ethnic groups surrounding the Rincon Mountain District for 2000 and 2010.
ESRI (2015) Tapestry Segmentation of the United States: The corresponding demographic characteristics of the populations within areas E and F were obtained using ESRI’s Tapestry Segmentation (2015) tract-level data. Tapestry Segmentation is a geodemographic marketing system that classifies U.S. neighborhoods based on U.S. Census Bureau socio-economic data variables, including population, age, income, sex, race, home value, marital status and demographic compositions (ESRI n.d.). Cluster analysis is the general approach used by ESRI, which is the most common method used for market segmentation. A combination of statistical analysis, including the iterative partition K-means algorithm to create the initial clusters (i.e. market segments), followed by the application of Ward’s hierarchical minimum-variance method to group the clusters was used. This combination provided a complementary match of the strengths of each technique. The Tapestry Segmentation classifies U.S. neighborhoods into 67 segments based on the buying and lifestyle characteristics of residents within those neighborhoods. Each segment is grouped into one of 14 LifeMode Summary Groups that reflect general lifestyles (ESRI 2015). The LifeMode Summary Groups for locations E and F included Family Landscapes and Cozy Country Living, and included the Soccer Moms and Green Acres segments, respectively. The Soccer Mom segment of the population is comprised of younger families often with children. These families are very busy with careers and raising a family. They rely on technology to help them manage time more efficiently, and they seek family-oriented activities for recreation.

19
The Green Acres segment is typically older and no longer has children in the household. They don’t rely on technology as much as the Soccer Mom segment and have a tendency to be more conservative in their political views and lifestyles. They enjoy outdoor activities and often have pets. As previously shown and discussed, the ethnic compositions of both segments south of the park are similar, and analysis of the U.S. Census Bureau’s 2000 and 2010 SF1 data revealed that between 2000 and 2010 the ethnic composition within these two areas changed more rapidly than any other area surrounding RMD. The results for the ESRI (2015) Tapestry Segmentation and U.S. Census Bureau’s population and ethnic counts for high priority locations E and F area shown in Figure 9.
Figure 9. Flowchart for study methods step 9, showing the socio-economic and population results for highest priority conservation areas E and F.
Discussion/Conclusions Areas surrounding protected areas are often integral to species conservation and maintaining biodiversity, especially in such a biologically unique area such as the Rincon Mountain sky island. The public surveys of Tucson residents conducted by Yeasmin (2011), Harris and Shaw (1997) and Casey et al. (2005) found that while locals placed a high value on living adjacent to protected areas and on wildlife conservation, there was a lack of accurate knowledge and understanding of wildlife biology and associated human-caused impacts. This lack of knowledge may inadvertently threaten the resources that make the area so unique. This is where a strategic approach to developing conservation efforts can have a positive impact to these same resources.

20
To frame conservation possibilities, a decision support framework was developed (Appendix A), which included significant characteristics of the two highest priority areas of conservation need. These characteristics include information about the physical, ecological, potential partners, and outreach strategies for conservation managers to use while developing outreach strategies. A framework such as the one created for this study can guide the customization of outreach campaigns by appealing to groups in ways that are more relevant based on their lifestyle characteristics. And while it’s likely that land use and climate changes are inevitable throughout this region, outreach efforts can help foster partnerships that focus on shared conservation goals creating scientifically credible solutions in areas where efforts matter most. Limitations While this assessment was a multi-species focus, with a coarse (23-acre) resolution, targeting one or a few species may be more effective for developing specific and measureable conservation strategies. Actual species occurrence data will help target and further refine high priority conservation areas. In addition, ESRI’s Tapestry Segmentation system is tailored towards marketing efforts, which may not be as useful for extrapolating socieconomic characteristics for developing effective conservation outreach efforts; however, it does provide insights as to the characterisitics of the populations residing in those areas. Future Research Needs
1) Focus on species that are tied to specific management goals (vs. multi-species) and create a monitoring plan that measures results of conservation actions.
2) Expand area of assessment gaining a broader landscape-scale perspective, which would likely be more relevant to larger species such as jaguar, mountain lion, black bear, etc.
3) Use species occurrence data vs. habitat models to more accurately predict areas of highest conservation need.
4) Continue socioeconomic monitoring of residents located in high conservation need areas to refine outreach messaging accordingly. Assess selected high priority areas at a finer scale (e.g., census block), especially if having difficulty with establishing partnerships/buy-in from local communities.
5) Analyze outreach effort needs from a multi-disciplinary approach that includes cultural and ranch use sites, as well as other disciplines and/or management goals (e.g., soundscape, night sky, viewshed preservation).
Acknowledgements I’d like to thank my advisor, Dr. Justine Blanford, for her help and guidance throughout this process. I’d also like to thank Pima County and the NPS NPScape Program for the GIS data sets.

21
References Actionbioscience. 2015. Population and the environment: the global challenge. Available at
http://www.actionbioscience.org/environment/hinrichsen_robey.html (accessed September 14, 2015).
Atwood, Todd C.; Young, Julie K.; Beckmann, Jon P.; Breck, Stewart W.; Fike, Jennifer A.; Rhodes, Jr., Olin; and Bristow, Kirby D., "Modeling Connectivity of Black Bears in a Desert Sky Island Archipelago" (2011). USDA National Wildlife Research Center – Staff Publications. Paper 1013.http://digitalcommons.unl.edu/icwdm_usdanwrc/1013
Audubon Climate Report. 2014. The Audubon birds and climate change report. Available at http://climate.audubon.org/all-species(accessed September 14, 2014).
Baas, J.M., A. Ewert, and D.J. Chavez. 1993. Influence of ethnicity on recreation and natural environment use patterns: managing recreation sites for ethnic and racial diversity. Environmental Management 17, 523–29.
Behlau, F. 2000. A history of land use in Pima County. 188 p. Birdlife International. 2014. Endemic Bird Area factsheet: Sierra Madre Occidental and trans-
Mexican range. Available from http://www.birdlife.org (accessed September 14, 2014). Briggs, M.K. 1996. Riparian ecosystem recovery in arid lands. The University of Arizona Press.
Tucson, Arizona. Briggs, M., M.K. Schmid, and W.L. Halvorson. 1997. Monitoring riparian ecosystems and
inventory of riparian habitat along Rincon Creek near Tucson, Arizona. USGS Technical Report No. 58. 88 p.
Brusca, R.C., Wiens, J.F., Meyer, W.M. Eble, J. Franklin, K. Overpeck, J.T. and Moore, W. 2013. Dramatic response to climate change in the Southwest: Robert Whittaker's 1963 Arizona Mountain plant transect revisited. Ecology and Evolotion. 3(10): 3307–3319
Burgess N, Butynski T, Cordeiro N, Doggart N, Fjeldsa J, et al. (2007) The biological importance of the Eastern Arc Mountains of Tanzania and Kenya. Biological Conservation 134: 209–231.
Casey, A.L., P.R. Krausman, W.W. Shaw, and H.G. Shaw. 2005.StreKnowledge of and attitudes toward mountain lions: a public survey of residents adjacent to Saguaro National Park, Arizona. Human Dimensions of Wildlife, 10:29–38.
Certified Species List: NPSpecies – The National Park Service biodiversity database. IRMA portal version. Avaialble at https://irma.nps.gov/NPSpecies/(accessed September 30, 2014).
Christensen, J.H., B. Hewitson, A. Busuioc, [and others]. 2007. Regional climate projections. In: Solomon, S., D. Qin, M. Manning, Z. Chen, M. Marquis, K.B. Averyt, M. Tignor, and H.L. Miller, eds. Climate Change 2007: The Physical Science Basis. Contribution of Working Group I to the Fourth Assessment Report of the Intergovernmental Panel on Climate Change. Cambridge, United Kingdom: Cambridge University Press.
City of Tucson. 2015. Tucson update-population. Available at https://www.tucsonaz.gov/hcd/tucson-update-population (accessed Sept. 15, 2015).
Clark, W.C. 1985. Scales of climate impacts. Climatic Change, 7, 5-27. Coe S.J., D.M. Finch, and M.M. Friggens MM. 2012. An assessment of climate change and
vulnerability of wildlife in the Sky Islands of the southwest. General Technical Report RMRS-GTR-XXX. Fort Collins, CO: U.S. Department of Agriculture, Forest Service, Rocky Mountain Research Station.

22
Coggins, G.C. (1987) Protecting the wildlife resources of national parks from external threats. Land and Water Law Review, 22, 1-27.
Comer, P. J., B. Young, K. Schulz, G. Kittel, B. Unnasch, D. Braun, G. Hammerson, L. Smart, H. Hamilton, S. Auer, R. Smyth, and J. Hak.. 2012. Climate Change Vulnerability and Adaptation Strategies for Natural Communities: Piloting methods in the Mojave and Sonoran deserts. Report to the U.S. Fish and Wildlife Service. NatureServe, Arlington, VA. Davison, J.E., S. Coe, D. Finch, E. Rowland, M. Friggens, and L.J. Graumlich. 2011. Bringing indices of species vulnerability to climate change into geographic space: an assessment across the Coronado National Forest. Biodiversity Conservation 21: 189-204.
Davis, T. 2013. Rocking K closer to development; smaller-scale project will start contruction within two years. Tucson.com Arizona Daily Star. Available at http://tucson.com/business/local/rocking-k-closer-to-development-smaller-scale-project-will-start/article_ab1d61ef-26af-533e-9836-d25ba6dc6a45.html (accessed September 5, 2015).
DeChaine E, and A. Martin. 2005. Marked genetic divergence among sky island populations of Sedum lanceolatum (Crassulaceae) in the Rocky Mountains. American Journal of Botany 92: 477.
ESRI. n.d. Tapestry segmentation reference guide. 96 p. ESRI. 2015. 2015 Tapestry Segmentation. Accessed via Penn State’s on-line GIS services. Falk, D.A. 2013. Are Madrean ecosystems approaching tipping points? Anticipating interactions
of landscape disturbance and climate change. USDA Forest Service Proceedings RMRS-P-67. 40-47pp.
Floyd, M.F. 2001. Managing parks in a multicultural society: searching for common ground. Managing Recreation Use 18, 41–51.
Floyd, M.F. and K.J. Shinew. 1999. Convergence and divergence in leisure style among whites and African Americans: towards an interracial contact hypothesis. Journal of Leisure Research 31, 359–84.
General Accounting Office. 1994. Report to congressional requesters. Endangered Species Act. Information on species protection on nonfederal land. Available at http://www.gao.gov/archive/1995/rc95016.pdf (accessed Spetember 14, 2015).
Gottfried, Gerald J.; Ffolliott, Peter F.; Gebow, Brooke S.; Eskew, Lane G.; Collins, Loa C., comps. 2013. Merging science and management in a rapidly changing world: Biodiversity and management of the Madrean Archipelago III; 2012 May 1-5; Tucson, AZ. Proceedings. RMRS-P-67. Fort Collins, CO: U.S. Department of Agriculture, Forest Service, Rocky Mountain Research Station.
Hansen, A.J., N. Piekielek, C. Davis, J. Haas, D. Theobald, J. Gross, W. Monahan, S. Running. 2014. Exposure of US National Parks to Land Use and Climate Change 1900-2100. Ecological Applications 24: 484-502. http://dx.doi.org/10.1890/13-0905.1
Harris, L.K. and W.W. Shaw. 1997. Urban neighbors’ wildlife-related attitudes and behaviors near federally protected areas in Tucson, Arizona, USA. Natural Areas Journal 17: 144-148.
Heald, W. F. 1951. Sky islands of Arizona. Natural History 60: 56-63,95-96. Ho, C., V. Sasidharan, W. Elmendorf, F.K. Willits, A. Graefe, and G. Godbey. 2005. Gender and
ethnic variations in urban park preferences, visitation and perceived benefi ts. Journal of Leisure Research 37, 281–306.
23
Huckelberry, C.H. 2008. Pima County multiple species conservation plan monitoring program. 171 p.
Husbands, W. and P. Idahosa. 1995. Ethnicity and recreation behavior: a review and critique of the literature. Canadian Ethnic Studies 27, 84–98.
Hutchison, R. 1987. Ethnicity and urban recreation: whites, blacks and Hispanics in Chicago’s public parks. Journal of Leisure Research 19, 205–22.
Irwin, P.N., W.C. Gartner, and C.C. Phelps. 1990: Mexican-American/Anglo cultural differences as recreation style determinants. Leisure Sciences 12, 335–48
Johnson, C.Y., J.M. Bowker, D.B.K. English, and D. Worthen. 1998. Wildland recreation in the rural south: an examination of marginality and ethnicity theory. Journal of Leisure Research 30, 101–20.
Kupfer, J.A., J. Balmat, and J.L. Smith. 2005. Shifts in the potential distribution of sky island plant communities in response to climate change. USDA Forest Service Proceedings RMRS-P-36. Pages 485-490.
Mcfarlane, Bonita L. R. Craig, G. Stumpf-Allen, and David O. T. Watson. 2007. Public Acceptance of Access Restrictions to Grizzly Bear (Ursus arctos) Country. Human Dimensions of Wildlife, 12:275–287.
McCormack, J.E. Huang, H. and Knowles, L.L. 2009. "Sky Islands" Encyclopedia of Islands. University of California Press: Berkeley, CA.
Millennium Ecosystem Assessment. 2005. Ecosystems and human well-being. Available at http://millenniumassessment.org/documents/document.354.aspx.pdf (accessed Septermber 6, 2015).
Monahan, W. B., J. E. Gross, L. K. Svancara, and T. Philippi. 2012. A guide to interpreting NPScape data and analyses. Natural Resource Technical Report NPS/NRSS/NRTR—2012/578. National Park Service, Fort Collins, Colorado.
Monahan, W. B., D. E. Swann, and J. A. Hubbard. 2013. Landscape dynamics of Saguaro Na-tional Park. Natural Resource Report NPS/NRSS/NRR—2013/615. National Park Service, Fort Collins, Colorado.
Monahan, W.B. and N.A. Fisichelli. 2014. Climate Exposure of US National Parks in a New Era of Change. PLoS ONE 9(7): e101302. doi:10.1371/journal.pone.0101302.
Mayr E, and J. Diamond. 1976. Birds on islands in the sky: origin of the montane avifauna of Northern Melanesia. Proceedings of the National Academy of Sciences 73: 1765–1769
National Park Service. 2012. Climate change action plan 2012-2014. U.S. Department of the Interior. 36p.
National Park Service. 2014a. Foundation document. Saguaro National Park. 72 p. National Park Service. 2014b. NPScape Standard Operating Procedure: Housing Measure –
Current and Projected Housing Density. Version [2014-MM-DD]. National Park Service, Natural Resource Stewardship and Science. Fort Collins, Colorado.
National Park Service SODN. 2012. Plant Responses to Climate Change in the Sonoran Desert: Recent Research and Findings. Sonoran Desert Network information brief. 4p.
National Park Service SODN. 2014a. Saguaro National Park. Available at http://science.nature.nps.gov/im/units/sodn/parks/sagu.cfm (accessed August 29, 2014).
National Park Service [NPS] SODN. 2014b. Sonoran desert ecosystem. Available at http://science.nature.nps.gov/im/units/sodn/sonoran.cfm#biome (accessed August 29, 2014).

24
Niepoth, W. 1973. Users and non-users of recreation and park services. In Gray, D. and Pelegrino, D.A., editors, Reflections on the recreation and park movement, Dubuque, IA: W.C. Brown Company, 131–42.
Patrick-Birdwell, C. and S. Avila-Vilegas, J. Neeley, and L. Misztal. et al. 2012. Mapping and Assessing the Environmental Impacts of Border Tactical Infrastructure in the Sky Island Region in Gottfried, Gerald J.; Ffolliott, Peter F.; Gebow, Brooke S.; Eskew, Lane G.; Collins, Loa C., comps. 2013. Merging science and management in a rapidly changing world: Biodiversity and management of the Madrean Archipelago III; 2012 May 1-5; Tucson, AZ. Proceedings. RMRS-P-67. Fort Collins, CO: U.S. Department of Agriculture, Forest Service, Rocky Mountain Research Station.
Payne, L.L., A.J. Mowen, and E. Orsega-Smith. 2002: An examination of park preferences andbehaviors among urban residents: the role of residential location, race and age. Leisure Sciences 24, 181–98.
Peterson A, Flores-Villela O, Leon-Paniagua L, Llorente-Bousquets J, Luis-Martinez M, et al. (1993) Conservation priorities in Mexico: moving up in the world. Biodiversity Letters 33–38.
Pima County Association of Governments. n.d. Population growth. Available at http://www.pagnet.org/tabid/36/default.aspx(accessed September 14, 2014).
Pima County Association of Governments. n.d. A vision for riparian protection. Available at http://www.pima.gov/cmo/sdcp/Riparian.html (accessed September 14, 2016).
Pima County. 2000. Sonoran Desert conservation plan. Available at http://www.pima.gov/cmo/sdcp/intro.html (accessed June 15, 2015).
Pima County. 2001. Priority vulnerable species. Sonoran Desert Conservation Plan. 407p. Pima County. 2014. Pima County government. Available at http://webcms.pima.gov/(accessed
September 14, 2014). Pima County. 2015. Pima County Geographic Information Systems GIS Library Contents. Available at http://gis.pima.gov/data/contents/all.cfm?sortby=of. Pope, S.E., Fahrig, L. and H.G. Merriam. 2000. Landscape complementation and metapopulation
effects on leopard frog populations. Ecology, 81, 2498-2508. Powell, B. F, W. L. Halvorson, and C. A. Schmidt. 2006. Vascular Plant and Vertebrate
Inventory of Saguaro National Park, Rincon Mountain District. OFR 2006-1075. U.S. Geological Survey, Southwest Biological Science Center, Sonoran Desert Research Station, University of Arizona, Tucson, AZ.
Ruhlman, J., L. Gass, and B. Middleton. 2014. Contemporary Land-Cover Change from 1973 to 2000 in the Madrean Archipelago Ecoregion. Available at http://landcovertrends.usgs.gov/west/eco79Report.html (accessed September 14, 2014).
Sauders, S, T. Easley, and S. Farver. 2009. National parks in peril the threats of climate disruption. Rocky Mountain Climate Organization and Natural Resources Defense Council. Denver, Co.
Scholes, R. and J. Settele. 2014. IPCC WGII Chapter 4: Terrestrial and inland water systems. Available at http://ipcc-wg2.gov/AR5/images/uploads/WGIIAR5-Chap4_FGDall.pdf (accessed October 10, 2014).
Seager, R. et al. 2007. Model projections of an imminent transition to a more arid climate in Southwestern North America. Science 316: 1181-1184pp.
Sheppard, P.R., A.C. Comrie, G.D. Packin, K. Angersbach, and M.K. Hughes. 2002. The climate of the US Southwest. Climate Research 21:219-238.

25
Shumway, N., L. Seabrook, C. McAlpine, and P. Ward. 2014. A mismatch of community attitudes and actions: A study of koalas. Landscape and Urban Planning 126 (2014) 42–52.
Sky Island Alliance. 2011. Skyislandalliance.org (accessed November 1, 2011) Swann, D. and N. Perkins. 2012. Inventory of Terrestrial Mammals in the Rincon Mountains
Using Camera Traps in the Sky Island Region in Gottfried, Gerald J.; Ffolliott, Peter F.; Gebow, Brooke S.; Eskew, Lane G.; Collins, Loa C., comps. 2013. Merging science and management in a rapidly changing world: Biodiversity and management of the Madrean Archipelago III; 2012 May 1-5; Tucson, AZ. Proceedings. RMRS-P-67. Fort Collins, CO: U.S. Department of Agriculture, Forest Service, Rocky Mountain Research Station.
Svancara, L.K., J.M. Scott, T.R. Loveland, and A.B. Pidgorna. 2009. Assessing the landscape context and conversion risk of protected areas using satellite data products. Remote Sensing of Environment 113: 1357–1369pp.
Talbot, J.F. and R. Kaplan. 1993. Preferences for nearby natural settings: ethnic and age variations. In Gobster, P., editor, Managing urban and high-use recreation settings, St. Paul, MN: US Department of Agriculture, Forest Service, 93–97.
Taylor, D.E. 1989. Blacks and the environment: towards an explanation of the concern and action gap between blacks and whites. Environment and Behavior 21, 175–205.
Theobald, D.M. 2005. Landscape patterns of exurban growth in the USA from 1980 to 2020. Ecology and Society 10:32. (online) http://www.ecologyandsociety.org
Theobald, D.M. 2010. Estimating natural landscape changes from 1992 to 2030 in the conterminous US. Landscape Ecology: DOI 10.1007/s10980-010-9484-z. 13 p.
Thornton, C. and M.S. Quinn. 2009. Coexisting with cougars: public perceptions, attitudes, and awareness of cougars on the urban-rural fringe of Calgary, Alberta, Canada. Human–Wildlife Conflicts 3(2):282–295.
United States Census Bureau. 2012. Table 1: Ranking of census 2000 and projected 2030 state population and change.Available at http://www.census.gov/population/projections/data/state/projectionsagesex.html(accessed October 12, 2014).
United Sates Environmental Protection Agency. 2012. Landscape ecology. Available at http://www.epa.gov/esd/land-sci/gap-status.htm (accessed October 4, 2014).
United State Fish and Wildlife Service. 2008. Endangered and threatened wildlife and plants; determination of threatened status for the polar bear (Ursus maritimus) throughout its range. Federal Register 73: 28212-28303.
Virden, R.J. and G.J. Walker. 1999. Ethnic/racial and gender variations among meanings given to, and preferences for, the natural environment. Leisure Sciences 21, 219–39.
Warshall, P. 1995. The Madrean Sky Island Archipelago: A planetary overview. In: DeBano, L.H., P.F. Folliott, A. Ortega-Rubio, G. Gottfried, R.H. Hamre, and C.B. Edminster, tech. coords. Biodiversity and management of the Madrean Archipelago: The Sky Islands of southwestern United States and northwestern Mexico. 1994 Sept. 19-23; Tucson, AZ. Gen. Tech. Rep. RM-GTR-264. Fort Collins, CO: U.S. Department of Agriculture, Forest Service, Rocky Mountain Forest and Range Experiment Station. 669p.
Washburn, R.F. 1978. Black underparticipation in wildland recreation: alternative explanations. Leisure Sciences 2, 201–10.
Wiens, J.A. (1989) Spatial scaling in ecology. Functional Ecology, 3, 385-397. Yeasmin, D. 2011. A framework for evaluating and assessing the effects of urban growth on

26
protected areas. Dissertation Submitted to the Faculty of the School Of Natural Resources And The Environment in partial fulfillment of the requirements for the degree of Doctor Of Philosophy. University of Arizona. 172 pages.