CONSERVATION STATUS OF SALMO RIVER RAINBOW … ReportPUBLIC... · Diver counts of rainbow trout in...
80
CONSERVATION STATUS OF SALMO RIVER RAINBOW TROUT: RADIO TELEMETRY INVESTIGATIONS OF HABITAT USE AND ABUNDANCE PREPARED BY: JOHN HAGEN AND JAMES S. BAXTER Prepared For: Columbia Basin Fish and Wildlife Compensation Program, Columbia-Kootenay Fisheries Renewal Partnership/Columbia Basin Trust BC Hydro Salmo Watershed Streamkeepers Society Beaumont Timber BC Ministry of Water, Land and Air Protection July 2004 COLUMBIA BASIN FISH & WILDLIFE COMPENSATION PROGRAM www.cbfishwildlife.org
Transcript of CONSERVATION STATUS OF SALMO RIVER RAINBOW … ReportPUBLIC... · Diver counts of rainbow trout in...
CONSERVATION STATUS OF SALMORIVER RAINBOW TROUT: RADIOTELEMETRY INVESTIGATIONS OFHABITAT USE AND ABUNDANCE
PREPARED BY:
JOHN HAGEN AND JAMES S. BAXTER
Prepared For:
Columbia Basin Fish and Wildlife Compensation Program, Columbia-Kootenay Fisheries Renewal Partnership/Columbia Basin Trust
BC HydroSalmo Watershed Streamkeepers Society
Beaumont TimberBC Ministry of Water, Land and Air Protection
July 2004
COLUMBIA BASINFISH & WILDLIFECOMPENSATION
PROGRAM
www.cbfishwildlife.org

Conservation Status of Salmo River Rainbow Trout:Radio Telemetry Investigations of
Habitat Use and Abundance
John Hagen1 and James S. Baxter2
Prepared for:
Columbia-Kootenay Fisheries Renewal Partnership/Columbia Basin TrustColumbia Basin Fish and Wildlife Compensation Program
BC HydroSalmo Watershed Streamkeepers Society
Beaumont TimberBC Ministry of Water, Land and Air Protection
July 31, 20041 John Hagen and Associates, 110 Union Street, Nelson B.C. V1L 4A22 BC Hydro, 601-18th Street, Castlegar B.C. V1N 4G7

ii
EXECUTIVE SUMMARY
• Prior to 2001, biologists were unable to assess the conservation status of therainbow trout (Oncorhynchus mykiss) population inhabiting the mainstem of theSalmo River due to limited information about trends in abundance, habitat use,and life history. To address these deficiencies, we initiated during 2001 a multi-year study of habitat use and population size for this population employing radiotelemetry as a primary investigative tool.
• Three years of radio telemetry investigations of habitat use by adult and sub-adulttrout (>300 mm) suggested that: (i) holding water during the summer low waterperiod was limited to a few relatively large pools containing deep water and/orwood cover; (ii) overwintering habitat consisted of areas of deeper water andabundant wood or boulder cover; (iii) radio tagged fish utilized primarilymainstem areas (including sidechannel areas) for spawning, with only limited useof tributaries; and (iv) off-channel areas within the flood plain provided importantrefuge habitat during high water events. A channelized section of the mainstemriver extending from the town of Salmo downstream to Hellroaring Creek wasconspicuously avoided by radio tagged trout, which was likely due to an absenceof pool habitat and cover. The close association of rainbow trout elsewhere in themainstem Salmo with deep water and cover suggests that habitat restoration workin this section, to create more area with depth and cover, may be of benefit to thepopulation.
• Although diver counts of trout in streams are commonly used to monitor troutabundance, few studies have directly investigated the relationships between divercount accuracy and watershed physical conditions. We utilized diverobservations of radio tagged trout, made during periodic surveys of a countingarea located downstream of the town of Salmo, to estimate diver observerefficiency and its relationship with horizontal underwater visibility and dischargeduring July of 2001, 2002, and 2003. Results from the three years of the studysuggested that diver observations of radio tagged trout can be reliably used toestimate observer efficiency, but also that the relationships of observer efficiencyto underwater visibility and discharge exhibit interannual variability. Changes invisibility and discharge, which were highly correlated with each other, were goodpredictors of observer efficiency observations during July 2002 and July 2003, butobserver efficiency did not change with changes in these variables during July2001, a year in which mid-summer levels of flow were reached earlier in thesummer than in any other year within the last decade. Overall relationships ofobserver efficiency to visibility and discharge for all three years’ combined datawere significant. Because the overall observer efficiency/visibility relationshipwas more precise than that for observer efficiency and discharge, and becausevisibility can be more practically measured and varies from one stream reach toanother, this relationship was chosen as the basis for adjusting diver counts oftrout to generate population estimates in the Salmo River mainstem.

iii
• Population estimates incorporating observer efficiency estimates and expectationsfor error were made for the mainstem Salmo River between the Hall Creekcanyon and Seven Mile Reservoir. Estimated adult (>400 mm) populations were233 + 27, 166 + 17, and 195 + 36 for July 2001, July 2002, and July 2003,respectively. The estimates suggest that the population size may be approachingminimum levels considered adequate for conservation. Due to the small size ofthe Salmo River rainbow trout population and the possibility that it is to somedegree demographically and genetically isolated, special management actions toensure the population’s future viability and to maintain the quality of the fisherymay be warranted. A change to a catch-and-release regulation on a portion of theSalmo mainstem, arising from the above results, was implemented on anexperimental basis beginning with the 2003 angling season. Continuedabundance monitoring, especially if it is accompanied with a willingness toexperiment with alternative harvest regulations, is the key to learning about thepopulation’s status relative to meaningful conservation and management targets.

iv
ACKNOWLEDGMENTS
Funding for this project over the past three years was provided by BC Hydro (Seven MileUnit 4), BC Hydro (Castlegar), the Columbia-Kootenay Fisheries RenewalPartnership/Columbia Basin Trust (Cranbrook), the Columbia Basin Fish and WildlifeCompensation Program (Nelson), Beaumont Timber (Salmo) and the Salmo WatershedStreamkeepers Society (Salmo). In-kind funding was provided by the BC Ministry ofWater, Land and Air Protection (Nelson). We appreciate the long term commitment thatall these organizations have made to this ongoing study.
The successful completion of this study was made possible only as a result of the co-operation of a large number of organizations and individuals within the followingorganizations.
Columbia-Kootenay Fisheries Renewal Partnership/Columbia Basin Trust
Bill Green, Les Brazier, and Kenton Andreashuk provided comments on the project,while Jaime Christales provided administrative assistance.
BC Hydro
BC Hydro supplied the radio tags that were utilized for the study and provided equipmentand personnel. Specifically Ric Olmsted, Gary Birch and Dave Wilson were instrumentalin providing funds and expertise for the project, with Ric providing assistance with fishcapture. Dean den Biesen, Shawn Ord, Dave Hunter, and Clint Tarala also assisted in thefield.
BC Ministry of Water, Land and Air Protection
The BC Ministry of Water, Land and Air Protection provided tracking equipment andpersonnel to aid in the completion of the project. Specifically John Bell and Jeff Burrowsassisted with swims, fish capture, and tracking. Murray Pearson assisted with swims.Albert Chirico and Colin Spence ensured collection permits were put in place to allowfish capture. Jay Hammond provided insight into project requirements and managementissues.
Salmo Watershed Streamkeepers Society
Community volunteers that are members of the Salmo Watershed Streamkeepers Societyassisted with various components of the project. Brian Henderson and Gerry Nellestijnassisted with swims, fish capture, and tracking.

v
Mountain Water Research and Scott Decker and Associates
Jeremy Baxter provided technical assistance with all aspects of this project. Scott Deckeralso assisted with the project during swims, and through discussion. Aaron Shepardassisted with swims.
Columbia Basin Fish and Wildlife Compensation Program
Steve Arndt provided assistance in the field with fish capture, tagging, and diver surveys.Harald Manson initiated and monitored the contract. Beth Woodbridge providedadministrative assistance.
Canadian Columbia River Intertribal Fisheries Commission
Jim Claircoates assisted with project data collection.
Fisheries and Oceans Canada
Brian Ferguson and Jayson Kurtz provided field assistance.
Geosense Consulting Ltd.
Graham Smith provided mapping logistics.
Kokanee Helicopters
Duncan Wassick ensured aerial tracking could be undertaken.
Water Survey of Canada
Gordon Corcoran and Brent Tipple provided discharge data for the study period.
Frank Communications Inc.
Alice Nellestijn produced the excellent poster for this project
West Kootenay Fly Fishing Club
The club provided a letter of support for the project.

vi
TABLE OF CONTENTS
EXECUTIVE SUMMARY ................................................................................................ iiACKNOWLEDGMENTS ................................................................................................. ivTABLE OF CONTENTS................................................................................................... viLIST OF TABLES............................................................................................................ viiLIST OF FIGURES ......................................................................................................... viiiLIST OF APPENDICES.................................................................................................... ix
INTRODUCTION .............................................................................................................. 1Background..................................................................................................................... 1Conservation Biology ..................................................................................................... 1Study Design................................................................................................................... 3
METHODS ......................................................................................................................... 6Study Area ...................................................................................................................... 6Radio Telemetry.............................................................................................................. 9Diver Counts ................................................................................................................. 10Data Analyses ............................................................................................................... 11
Size and age at maturity............................................................................................ 11Observer efficiency ................................................................................................... 12Population estimates ................................................................................................. 12
RESULTS ......................................................................................................................... 14Transmitter Distribution and Biological Sampling....................................................... 14Habitat Use ................................................................................................................... 18
Summer ..................................................................................................................... 18Winter........................................................................................................................ 18Spawning locations ................................................................................................... 21
Observer Efficiency ...................................................................................................... 252001 Population Size Estimates.................................................................................... 33
Parameter estimation................................................................................................ 33Population estimates ................................................................................................. 34
2002, 2003 Population Size Estimates.......................................................................... 34Parameter estimation................................................................................................ 34Population estimates ................................................................................................. 36
DISCUSSION................................................................................................................... 39Critical Habitats, Population Spatial Structure, and Diversity ..................................... 39Abundance and Population Growth Rate...................................................................... 41Accuracy of Diver Counts of Trout .............................................................................. 43Conclusions and Recommendations ............................................................................. 46
REFERENCES ................................................................................................................. 49

vii
LIST OF TABLES
Table 1. Age, life history, and growth from scales of Salmo River rainbow trout sampledduring springtime of 2001 (standard errors in parentheses). .................................... 18
Table 2. Known rainbow trout redd locations in the Salmo River, 2002. ...................... 22
Table 3. Regression analysis summary, Salmo River rainbow trout observer efficiencystudy.......................................................................................................................... 29
Table 4. Diver counts of rainbow trout in the index section of the Salmo River, 2001. 33
Table 5. Diver counts of rainbow trout in the Salmo River watershed, July 22-25,2002........................................................................................................................... 35
Table 6. Diver counts of rainbow trout in the Salmo River watershed, July 07-17,2003........................................................................................................................... 35
Table 7. Population estimates for rainbow trout in the Salmo River watershed, July 22-25, 2002..................................................................................................................... 36
Table 8. Population estimates for rainbow trout in the Salmo River watershed, July 07-17, 2003..................................................................................................................... 37
Table 9. Overall population estimates for the mainstem Salmo River in July,2001-2003. ................................................................................................................ 38

viii
LIST OF FIGURES
Figure 1. The Salmo River watershed study area............................................................... 7
Figure 3. Relationship between fork length (mm) of sampled Salmo River rainbow troutand relative scale radius (mm) measured from scale photographs. .......................... 17
Figure 4. Fork length (mm) of Salmo River rainbow trout at first spawning, back-calculated according to the Fraser-Lee formula (Duncan 1980) from the scale radius(mm) at the annulus where evidence of spawning was suggested............................ 17
Figure 5. Summer locations of radio tagged rainbow trout in the Salmo River watershed,2001-2003. ................................................................................................................ 19
Figure 6. Winter locations of radio tagged rainbow trout in the Salmo River watershed,2001-2003. ................................................................................................................ 20
Figure 7. Spawning locations of radio tagged rainbow trout in the Salmo Riverwatershed, 2002-2004. .............................................................................................. 23
Figure 8. Observer efficiency estimates (number of tagged fish seen relative to thenumber known to be present) versus horizontal underwater visibility for three years(2001-2003) of periodic surveys in the Salmo River, British Columbia. ................. 27
Figure 9. Observer efficiency estimates (number of tagged fish seen relative to thenumber known to be present) versus log-transformed discharge past the WaterSurvey of Canada station for three years (2001-2003) of periodic surveys in theSalmo River, British Columbia................................................................................. 28
Figure 10. Observer efficiency estimates (number of tagged fish seen relative to thenumber known to be present) versus horizontal underwater visibility for three years’combined data (2001-2003) from periodic diver surveys in the Salmo River, BritishColumbia................................................................................................................... 30
Figure 11. Observer efficiency estimates (number of tagged fish seen relative to thenumber known to be present) versus log-transformed discharge past the WaterSurvey of Canada station for three years’ combined data (2001-2003) from periodicdiver surveys in the Salmo River, British Columbia. ............................................... 31
Figure 12. Counts of untagged rainbow trout >300 mm (solid circles) and >400 mm(open circles) versus horizontal underwater visibility for three years (2001-2003) ofperiodic surveys in the Salmo River, British Columbia. .......................................... 32
Figure 13. Water discharge (m3/sec) in the Salmo River over the June 1 to August 1period in 2001, 2002, and 2003 and the fourteen-year average for that period........ 44

ix
LIST OF APPENDICES
Appendix I – Photographic Plates .................................................................................... 53
Appendix II – 2001-2003 Salmo River Rainbow Trout Capture Data ............................. 61
Appendix III – Scale Measurements, Salmo River Rainbow Trout, June 2001 ............... 64
Appendix IV – Diver Survey Data from the Observer Efficiency Study Section of theSalmo River, 2001-2003 ........................................................................................... 67

1
INTRODUCTION
BackgroundDemand for quality trout stream fishing experiences is high in British Columbia, and thisdemand appears to be growing in the Kootenay Region particularly. The Salmo River,with its low flows, clear water, well-defined holding pools, and rainbow trout(Oncorhynchus mykiss) that can reach sizes of 500 mm or more, provides the highestquality small- to medium-sized stream fishery in the Nelson area. Angler effort has notbeen measured for the Salmo River, but appears to have been of light to moderateintensity in recent years, and until 2003 an angler harvest had been permitted with a dailylimit of two rainbow trout over 300 mm. However, snorkel surveys of the systemconducted in 2000, to investigate movements and abundance of other species, suggestedthat the rainbow trout population of the Salmo was small and possibly depleted (Baxterand Nellestijn 2000). Concerned local residents and fisheries agency staff have alsoexpressed the belief that the Salmo population was of small size, so we felt it possiblethat the population’s status was of conservation concern.
Assessing the current status of the population from a data review was impossible, as noinformation existed about trends or current levels of adult trout abundance, criticalhabitats, or population spatial structure. This lack of information prevented regionalfisheries staff at the BC Ministry of Water, Land and Air Protection (MWLAP) frommaking knowledgeable management decisions regarding the population. For this reason,MWLAP staff believed that a population estimate for the Salmo River, or at least anindex of relative abundance, should be established as soon as possible (J. Hammond,former regional fisheries biologist, Nelson, B.C.; personal communication). Duringspring 2001, we initiated a study of the habitat use and conservation status of the SalmoRiver’s rainbow trout population, which had the financial and/or in-kind support ofMWLAP, BC Hydro, Beaumont Timber, the Columbia Basin Fish and WildlifeCompensation Program, the Columbia-Kootenay Fisheries RenewalPartnership/Columbia Basin Trust, the Salmo Watershed Streamkeepers Society, and theWest Kootenay Fly Fishing Club.
Conservation BiologyMcElhany et al. (2000) introduced the ‘viable salmonid population’ (VSP) concept anddefined it as an “independent population that has a negligible risk of extinction due tothreats from demographic variation (random or directional), local environmentalvariation, and genetic diversity changes over a 100-year time frame.” They identifiedfour parameters for determining a population’s conservation status relative to thisdefinition, which we have employed here out of convenience:
Abundance. Population dynamics processes, including demographic stochasticity,genetic process (severe inbreeding and long-term genetic losses/genetic drift), and theeffects of environmental stochasticity and catastrophes, work differently in smallpopulations. It can be stated generally, however, that extinction risks posed by theseforces are magnified greatly at very small population sizes (Simberloff 1988; Nunney and
2
Campbell 1993). Empirical studies of extinction in mammals and birds have generallysuggested that an adult population size of N < 50 is clearly insufficient for a population'slong-term persistence, populations of 50 < N < 200 are marginally secure, and those of N> 200 are secure at least over time frames as limited as those used in the studies(reviewed in Boyce 1992).
Population growth rate. The population growth rate is the trend in the population’sabundance and is either positive (increasing population) or negative (declining). At smallpopulation sizes it appears that demographic and environmental stochasticity are moreimmediate and potent threats than are inbreeding and genetic drift. However, under asituation of negative population growth rate all of these can be likened to the final deaththroes of an organism that was already known to be dying (Caughley 1994). Theanthropogenic external agents that forced the decline (negative population growth rate) tothese population sizes in the first place - often overharvest and habitat destruction insalmonid populations - are far more important than any of the above, and extinction islikely unless these agents are identified and corrected and the negative population growthrate reversed.
Population spatial structure. A salmonid population’s spatial structure affects extinctionrisk through processes increasing resilience to environmental stochasticity (variability inenvironmental conditions) and through evolutionary processes (genetic diversity) thataffect a population’s ability to respond to environmental change. A population consistingof multiple, connected sub-populations are generally thought to be more robust toextinction forces than is a single group (Simberloff 1988).
Diversity. Phenotypic and genetic diversity is an important part of salmonid populationviability, for three general reasons. First, diversity allows a population to use a widerrange of environmental conditions. Second, it protects a species against short-termspatial and temporal changes in the environment, and third it provides the raw materialfor surviving long-term environmental changes (McElhany et al. 2000). Gene flow viastrays from other populations and sub-populations is one potential source of diversity thatcan be cut off by human actions such as dams (which have affected the Salmo Riverpopulation). Conversely, stocking hatchery fish, which occurred in the Salmo Riverwatershed between 1924 and 1953, can dilute important genetic adaptation of thepopulation if a large degree of introgression (successful interbreeding) between the nativeand hatchery fish occurs.
Genetic and demographic mechanisms of extinction at small population sizes havereceived much attention by workers in conservation biology (reviewed in Simberloff1988; Caughley 1994), and generally accepted theory and population size guidelines areemerging. However, Caughley (1994) has pointed out that the anthropogenic agents thatforce negative growth rates, critically low population sizes, unconnected relictpopulations, and insufficient or poorly adapted genetic diversity are not as easilygeneralized and quantitative investigations usually must be on a situation-specific basis.The goal is to get these agents within the reach of analytical methods. Towards this endCaughley (1994) recommended first studying the natural history of the population -

3
ecology, context, and abundance - in order to identify putative agents of populationdecline, then confirming the causal linkage via carefully monitored managementexperiments. The program of study initiated in the Salmo River watershed during earlysummer 2001 and continued through to the spring of 2004 was designed to gather thenatural history information - particularly habitat use, life history, and populationabundance - required by regulatory agencies prior to undertaking adaptive management.This report presents results of the population monitoring studies conducted during July2001, July 2002, and July 2003, and the adult rainbow trout habitat use study for rainbowtrout radio tagged during the summer of these three years.
Study DesignOur principal objectives for this study of the Salmo River watershed’s rainbow troutpopulation were twofold:
1. To establish the relative importance of habitats throughout the Salmo Riverwatershed for the rainbow trout population, for evaluation of protection, restoration, andenhancement priorities as well as population spatial structure.
2. To establish an index of abundance that could be related to the size of the adultrainbow trout population (and that incorporated estimates of uncertainty), and would besufficiently cost-effective for the long-term monitoring required to investigate populationabundance and growth rate.
We chose radio telemetry as a method for investigating habitat use by Salmo Riverrainbow trout, a technique that has been utilized frequently in British Columbia for thesepurposes. Our goal during the first year of the study (2001) was to distribute radio tagsthroughout the watershed in proportion to the relative abundance of taggable fish - if eachfish had an equal chance of receiving a tag and then habitat use could be quantified fromthe telemetry record rather than merely described. A smaller number of fish were alsoradio tagged during 2002 and 2003 and provided habitat use information, although all ofthese tags were distributed in one section of the river for use in the population estimationstudy.
The Salmo is typically clear enough in summer to permit the technique of diver countsfor trout population census. We assumed that this would be the most desirable approach(if reliable), as diver counts are a quick, inexpensive, and non-destructive method that canbe employed in relatively deep, swift water. Although underwater observation by divershas long been used as a research technique in behavioural studies of fish in streams (e.g.Keenleyside 1962; Fausch and White 1981; Campbell and Neuner 1985; Bonneau andScarnecchia 1998), evaluations of the technique’s reliability for salmonid populationcensus have been mixed. In order to evaluate the reliability of diver counts for assessing

4
population status on the Salmo River, therefore, we also conducted a multi-year programof research into their accuracy relative to watershed physical conditions.
Quantitative evaluation of underwater census techniques has been limited, and much of ithas been focused on their suitability for enumeration of juvenile salmonids or streamresidents of small body size (Griffith 1981; Hankin and Reeves 1988; Mullner andHubert 1998; Roni and Fayram 2000). Relatively little is known about the accuracy ofdiver counts, or factors affecting it, for fluvial salmonid populations comprising largerindividuals. Comparisons of subsequent passes by divers (Schill and Griffith 1984) givean indication of the replicability of counts, but a true test of their accuracy requires anindependent method of population estimation. In a study designed to assess the accuracyof diver counts using a secondary method, Northcote and Wilkie (1963) poisoned astream section with rotenone after underwater census to learn that divers had observedonly 59% of the rainbow trout and 64% of the mountain whitefish (Prosopiumwilliamsoni) present, even though counts at that location had been replicable. Mark-recapture studies employing underwater census as the recapture method have also beenutilized to independently evaluate the accuracy of population estimates derived fromdiver counts. There are only a small number of published accounts, but from these itappears that system-to-system variability can be high, with species differences and theamount of instream cover being potential variables that can affect the accuracy of divercounts (Slaney and Martin 1987; Zubik and Fraley 1988; Young and Hayes 2001).
Quantitative descriptions of factors that affect accuracy of diver counts within a givenriver system and salmonid population could allow the development of models forpopulation estimation that account for changes in these variables from year-to-year andwithin a season, thereby improving the precision of population estimates. Recently, in astudy designed to parameterize an area-under-the-curve model for estimating adultsteelhead abundance in the Cheakamus River, British Columbia, Korman et al. (2002)deployed radio tags in steelhead that had also received visual tags for a diver-based mark-recapture study. As the number of marked fish in the surveyed stream section could beknown with certainty, multiple recapture surveys over a much longer time period and arange of watershed conditions were possible. In their study, discharge and horizontalunderwater visibility explained between 69 and 78% of the variation in diver observerefficiency.
In our study, we wished to investigate the effects of changes in stream physicalconditions such as underwater visibility and discharge on the accuracy of underwatercounts of a fluvial rainbow trout population, as well as inter-annual variability in theseeffects. Divers obtained counts of trout in two size categories, >300 mm and >400 mm,in a stream section in which radio tagged fish that had also received a visual mark werepresent. We related the accuracy of the counts (number of tagged fish seen by divers as aproportion of the number known to be present – hereafter referred to as observerefficiency) to levels of horizontal underwater visibility and discharge on the survey dates,which took place over the three year period from 2001-2003 over the range of watershedconditions naturally occurring in July, when the annual population census occurs. Thegoal of the research was to parameterize a model if possible for expanding future dive

5
counts into a population estimate and for estimating confidence intervals, which wouldpreclude the need for costly annual mark-recapture studies.

6
METHODS
Study AreaThe Salmo River rises from the Selkirk Mountains 12 km southeast of Nelson, B.C.(Figure 1). The river flows in a southerly direction for approximately 60 km from itsorigin to the confluence with the Pend d’Oreille River (Seven Mile Reservoir). TheSalmo is a 5th order stream, and has a total drainage basin area of roughly 1,300 km2.Elevation in the basin ranges from 564 meters at its confluence to 2,343 meters at theheight of land. Within this elevation range, the system is comprised of twobiogeoclimatic zones. At lower elevations, the valley lies within the Interior Cedar-Hemlock zone, while areas in the higher elevations are found within the EnglemannSpruce-Subalpine Fir zone (Krajina 1959).
The Salmo River has a total of eight 2nd and 3rd order tributaries (including Apex Creek,Clearwater Creek, Hall Creek, Barrett Creek, Ymir Creek, Porcupine Creek, Erie Creek,and Hidden Creek) and two 4th order tributaries (Sheep Creek and the South SalmoRiver) (Figure 1). The Water Survey of Canada maintains a gauging station on the SalmoRiver downstream of the town of Salmo. Mean annual discharge in the Salmo River(1949-1976) was 32.5 m3/s, with mean monthly minimum and maximum values of 7.5and 128.5 m3/s, respectively. Runoff reaches a peak in May, with the highestflows between April and July each year.
In addition to rainbow trout, many other fish species are distributed in the watershed.These include bull trout (Salvelinus confluentus), eastern brook trout (S. fontinalis),mountain whitefish (Prosopium williamsoni), largescale sucker (Catostomusmacrocheilus), longnose sucker (C. catastomus), northern pikeminnow (Ptychocheilusoregonensis), longnose dace (Rhinicthys cataractae), redside shiner (Richardsoniusbalteatus), and slimy sculpin (Cottus cognatus). Natural populations of steelhead trout(anadromous O. mykiss) and chinook salmon (O. tshawytscha) have been extirpated fromthis system due to past hydroelectric development on the lower Columbia River.
Fish Capture and TaggingFor 2001, the design for the habitat use study specified that each taggable fish have anequal probability of receiving a tag, with the assumption being that movements of theradio tagged fish would be representative of the population as a whole. Of the 30 radiotags used for the study in 2001, 29 tags were initially available and were allocated to thevarious stream sections in proportion to the relative abundance of harvestable (>300 mm)rainbow trout in each section. This was determined at the outset of the project by divercounts conducted by two teams of divers on June 18 and June 19, 2001, with theassumption being that observer efficiency was comparable along the length of the Salmo.The majority of the watershed thought to contain trout of adequate size for radio tagging(>350 mm) was surveyed (Baxter 1999, 2001), a section extending from the Hall Creekconfluence downstream approximately 40 km to a point located 5.7 km from the SevenMile Reservoir at the top of a steep canyon reach. The canyon reach itself was omitted

7
Figure 1. The Salmo River watershed study area.

8
because of safety concerns at that time. All rainbow trout captures during spring 2001were made by angling in the mainstem Salmo River from June 1 to June 30 (oneadditional fish was captured and radio tagged on September 19). Angling therefore hadbeen initiated prior to the diver counts, but effort and success were insufficient to exceedallocations for each stream section prior to their being established by the divers. Gearutilized included artificial lures and flies, as well as salmon egg bait.
In 2002 and 2003 resources were insufficient for the large number of radio tags requiredto replicate the habitat use study. However, in order to learn about interannual variabilityin the accuracy of diver counts a small number of radio tags were purchased in each yearand deployed in the section used for the observer efficiency study, located downstream ofthe town of Salmo. Freshet conditions lasted longer in 2002, delaying the onset oftagging and diver counts. Rainbow trout captures were made between June 10 and July4. In 2003 rainbow trout captures took place between June 13 and June 20.
Methods for surgically implanting tags in suitable rainbow trout were the same for allyears. To facilitate handling and reduce stress on the fish, trout were held prior to andafter tagging in zippered tubes made from black, rubberized fabric with flow-throughends (Appendix I-Plate A). Fish selected for radio tagging in 2001 were a minimum of350 mm in fork length and 0.50 kg in weight so that the weight of the radio tag did notexceed 2% of the fish weight. In 2002 and 2003 the threshold minimum size for radiotagged trout was increased to 400 mm, after considering life history data from scaleanalysis, and the larger size of radio tags used in 2002 and 2003. Sterile conditions weremaintained at the surgery site with the operating biologist using surgical scrub to sterilizehis hands and donning sterile latex gloves. All operating instruments and radio tags weresterilized and disinfected in a container filled with 50% benzylkonium chloride diluted indistilled water at a concentration of 1000 PPM. A solution of Vidalife (SyndelInternational Inc., Vancouver, B.C.) at a concentration of 75 PPM was sprayed on allhandling nets, the surgery trough and added to the anaesthetic bath to reduce the loss ofthe slime coating of the fish.
Radio tags utilized for this study were manufactured by Lotek Wireless Inc. (Newmarket,Ontario). Tags used were model MCFT-3EM (11 mm diameter, 49 mm length, 4.3 gweight in water, operational life >598 days). The tags were programmed to beoperational for a total of 8 hours a day, and were digitally coded tags transmitting at a 2.5or 5 second burst rate on one of four frequencies.
Once it had been decided that a captured trout would receive a radio transmitter, the fieldsurgery station was set up (Appendix I-Plate B) while the fish was allowed to recoverfrom capture (typically for a minimum of 10 minutes). The fish was then anaesthetizedin water containing diluted clove oil (emulsified in 95% ethanol) at a concentration of100 PPM (Prince and Powell 2000). When the trout had reached the stage of anaesthesiawhere it had lost its equilibrium and no longer responded to external stimuli, it wasremoved from the anaesthetic bath and placed on its back in a V-trough lined with foam(Appendix I-Plate C). Irrigation of the gills of the fish was started immediately uponremoval from the bath (Appendix I-Plate C). A 3-4 cm incision was then made into the

9
abdominal cavity (left hand body side wall about 3-5 cm anterior of the pelvic fins) usinga scalpel fitted with a curved (No. 12) blade (Appendix I-Plate D).
After the incision was complete, a 16-gauge stainless steel needle was inserted throughthe abdominal wall posterior to the incision and back out the incision. The antenna of theradio tag was then threaded through the needle and the needle was pulled out, leaving theantenna protruding from the abdominal cavity and laying along the side of the fish. Theradio tag was then inserted into the abdominal cavity, and the incision was closed withthree interrupted sutures of braided silk on a cutting needle (Appendix I-Plate E). Theantenna of the radio tag was then sutured to the body wall with one interrupted suture(Appendix I-Plate F) to prevent movement and irritation by the antenna at the exit pointfrom the body wall. Finally the closed incision and exit point of the antennae wereswabbed with Betadine (Syndel International, Inc., Vancouver, B.C.), and the fish wasplaced in a flow through tube for recovery for at least 10 minutes.
Biological sampling for rainbow trout captured in 2001 was more extensive than in 2002and 2003. First, a small section of the adipose fin was removed and stored, along with alabel, in a vial of 95% ethanol for genetic analysis (Taylor 2002). Following this asample of at least 10 scales was removed for aging analysis, and two orange T-anchortags (Floy Tag, Seattle, WA) were inserted into punctures on either side of the fish’s backat the posterior insertion of the dorsal fin. Sex (if mature), fork length (mm), girth (mm),mass (g), Floy tag numbers, radio tag frequency and code, genetic sample number,condition at time of release, and tagging location were recorded. Biological samplingduring spring 2002 and spring 2003 differed from 2001 in that fin and scale samples werenot taken and fish mass was not measured. Radio tagged trout in 2002 and 2003 receivedwhite and blue Floy tags, respectively, to distinguish them from fish tagged during 2001.
Radio TelemetryAll of the telemetry information used for the study’s analyses was collected by mobiletracking, either by: i) pontoon boat along the counting section on the same day as divercounts; ii) helicopter during surveys of most of the watershed, frequently concurrent withbull trout telemetry surveys (Baxter 2002); or iii) a combination of foot, boat, and vehiclesurveys (according to stream navigability and proximity of roads to the channel) over thewhole stream length used by radio tagged fish. Helicopter flights occurred on August 13and September 8, 2001, January 11, April 22, May 2, May 31, and December 11, 2002,September 2, 2003, and March 3, 2004. Tracking took place approximately bi-monthlybetween the completion of diver counts in late July 2001 and the onset of the spawningperiod in April 2002, when tracking was approximately weekly until mid-June. A singleover-winter tracking event (helicopter flight) in each year was the only tracking eventafter the completion of diver counts in summer 2002 and summer 2003, primarily toidentify overwintering areas and determine which of the radio tagged fish were likely stillalive. As it had been in spring 2002, spawning tracking was approximately weeklyduring the migration and spawning period extending from April to mid-June of 2003. In2004, a total of seven tracking events occurred between May 4 and June 9.
10
Radio reception for surveys on foot or by boat along the river channel was through awhip antenna attached directly to a portable receiver. During helicopter surveys a two-element antenna was attached to the base of one of the helicopter’s skids, and wasoriented with the elements perpendicular to the water surface. The two-element antennawas attached to the roof rack of a truck during vehicle-based surveys. During all surveyspositions of tagged fish were recorded on prepared, 1:20,000 maps that showed distancesfrom the mouth as marks located every 0.1 km. During telemetry surveys along riverchannels in spring 2002, potential spawning areas were surveyed for redds if dischargeand visibility conditions were suitable. Discharge and visibility conditions in spring 2003and spring 2004 were not suitable for redd surveys.
During the observer efficiency study an observer with a receiver followed the divingteam at a distance in a pontoon boat, and collected radio telemetry information about thenumber of tagged fish present in the study reach on each survey date. The telemetryinformation was not relayed to the divers prior to their surveying of the potential holdingwater. Conversely, the diving team would stop and relay information to the telemetryoperator as soon as a radio tagged fish had been observed. The telemetry notes were thenused to identify the individual fish that had been seen, so observations of tagged fish,along with movement data, were used to estimate how many fish had survived surgeryand were alive at the time of the survey.
Diver CountsThe counting section of the Salmo River used for estimating observer efficiency extendedfrom the end of Carney Mill Road, near the town of Salmo, downstream approximately 9km to an access point along Highway 3 at a former bridge crossing. We conducted 4-7underwater surveys of the study reach per year, which took place as water levels droppedfrom high, post-freshet conditions in early July to much lower, mid-summer levels asAugust approached. In 2001 surveys began upon the completion of radio tagging, but in2002 and 2003 we waited approximately a week before beginning the counts, to allowfish to recover more fully from surgeries. We attempted to complete underwaterenumeration within the time period between approximately 0900 and 1500 hours PacificStandard Time, to ensure that lighting conditions were optimal. Four experienced diverswere used on each survey of the study area, which was sufficient to cover the entireusable width for most of the surveyed distance. Where possible a diver’s ‘lane’ extendedapproximately 5 m toward shore from his swimming position, with the two offshoredivers positioned back-to-back in the middle of the stream. When the usable wettedwidth exceeded 20 m one or more of the divers would extend his lane width and lookboth ways, with frequent stops required to discuss whether duplication in counts hadoccurred. In areas where the usable width was less than 20 m, one or more divers wouldwalk around the constriction or drift through behind the line of observers. We consideredmethods described elsewhere for organizing divers across the stream, such as markedropes (Northcote and Wilkie 1963) or polyvinyl chloride pipes (Schill and Griffith 1984)held between divers, to be impractical for the Salmo River due to the length of the studyreach and the need to travel efficiently, and the steep, complex nature of some areaswithin the section.
11
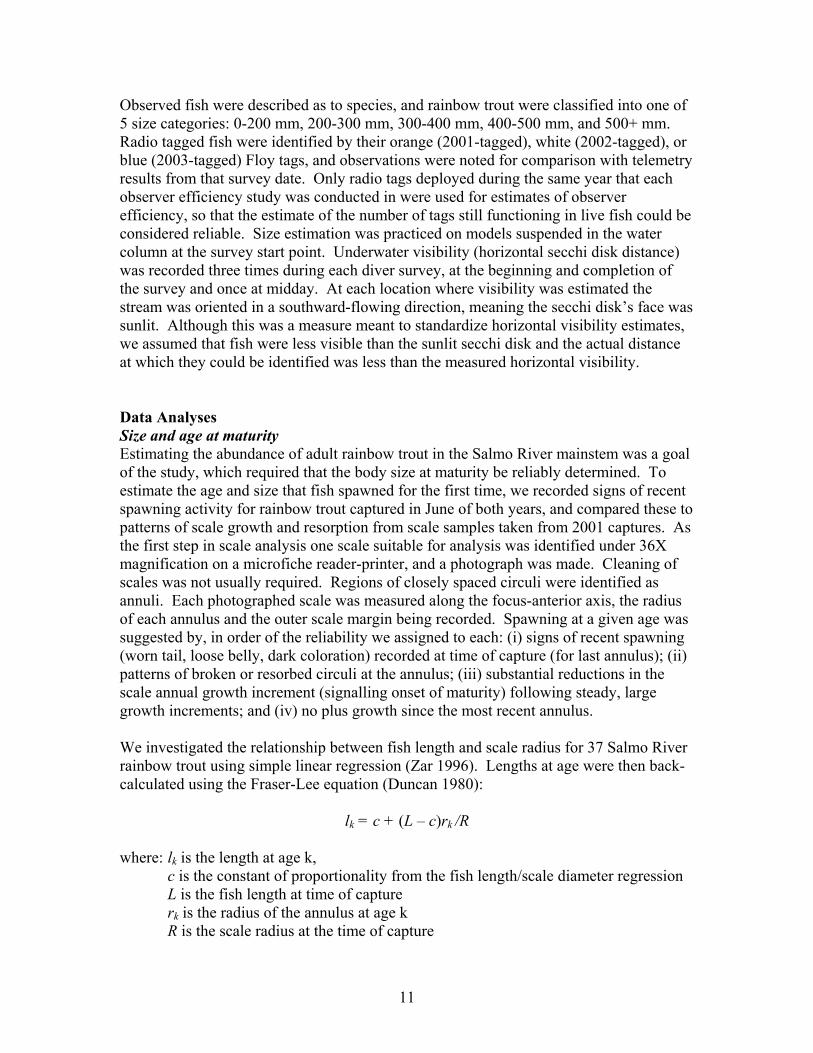
Observed fish were described as to species, and rainbow trout were classified into one of5 size categories: 0-200 mm, 200-300 mm, 300-400 mm, 400-500 mm, and 500+ mm.Radio tagged fish were identified by their orange (2001-tagged), white (2002-tagged), orblue (2003-tagged) Floy tags, and observations were noted for comparison with telemetryresults from that survey date. Only radio tags deployed during the same year that eachobserver efficiency study was conducted in were used for estimates of observerefficiency, so that the estimate of the number of tags still functioning in live fish could beconsidered reliable. Size estimation was practiced on models suspended in the watercolumn at the survey start point. Underwater visibility (horizontal secchi disk distance)was recorded three times during each diver survey, at the beginning and completion ofthe survey and once at midday. At each location where visibility was estimated thestream was oriented in a southward-flowing direction, meaning the secchi disk’s face wassunlit. Although this was a measure meant to standardize horizontal visibility estimates,we assumed that fish were less visible than the sunlit secchi disk and the actual distanceat which they could be identified was less than the measured horizontal visibility.
Data AnalysesSize and age at maturityEstimating the abundance of adult rainbow trout in the Salmo River mainstem was a goalof the study, which required that the body size at maturity be reliably determined. Toestimate the age and size that fish spawned for the first time, we recorded signs of recentspawning activity for rainbow trout captured in June of both years, and compared these topatterns of scale growth and resorption from scale samples taken from 2001 captures. Asthe first step in scale analysis one scale suitable for analysis was identified under 36Xmagnification on a microfiche reader-printer, and a photograph was made. Cleaning ofscales was not usually required. Regions of closely spaced circuli were identified asannuli. Each photographed scale was measured along the focus-anterior axis, the radiusof each annulus and the outer scale margin being recorded. Spawning at a given age wassuggested by, in order of the reliability we assigned to each: (i) signs of recent spawning(worn tail, loose belly, dark coloration) recorded at time of capture (for last annulus); (ii)patterns of broken or resorbed circuli at the annulus; (iii) substantial reductions in thescale annual growth increment (signalling onset of maturity) following steady, largegrowth increments; and (iv) no plus growth since the most recent annulus.
We investigated the relationship between fish length and scale radius for 37 Salmo Riverrainbow trout using simple linear regression (Zar 1996). Lengths at age were then back-calculated using the Fraser-Lee equation (Duncan 1980):
lk = c + (L – c)rk /R
where: lk is the length at age k,c is the constant of proportionality from the fish length/scale diameter regressionL is the fish length at time of capturerk is the radius of the annulus at age kR is the scale radius at the time of capture

12
Observer efficiencyWe compared observer efficiency (radio tags seen / radio tags known to be present) withtwo variables representing physical conditions for the surveys, horizontal underwatervisibility (m) and discharge (m3/s), using simple linear regression for untransformed andlog-transformed data, respectively. We also used regression analysis to evaluate therelationships between diver counts of untagged fish and physical conditions, and therelationships between discharge and visibility. Only radio tags deployed during the sameyear that each observer efficiency study was conducted in were used for estimates ofobserver efficiency, so that the estimate of the number of tags still functioning in live fishcould be considered reliable. Regressions were compared among years by multipleanalysis of covariance (MANCOVA - Tabachnick and Fidell 2001).
Population estimatesFor 2001, we generated the population estimates for Salmo River rainbow trout greaterthan 300 mm (available for harvest) and 400 mm from the estimated parameters C(average count in index section), λ (average diver observer efficiency), and r (averagerelative distribution of radio tags to the index section) utilizing stochastic simulations(Hilborn and Mangel 1997) within a Microsoft Excel spreadsheet. Each populationestimate N was the average of 1,000 calculations of:
N = C / (λ * r)
where in every iteration each of the parameter values was generated stochastically fromthe error structure observed for that parameter during the 6 surveys of the countingsection. The 95% confidence intervals for the population estimates were taken to be the2.5% and 97.5% percentiles from the cumulative distribution of the stochasticsimulations.
In 2002 we conducted diver surveys along the majority of the mainstem length known tobe important for adult rainbow trout during the same time period covered by the 2002observer efficiency study. A swift canyon reach extending from the Seven-MileReservoir upstream approximately 5 km was not surveyed. In 2003 this reach wasincluded in the census, as was the mainstem river between the town of Ymir and HallCreek. The population estimates for the surveyed mainstem length were then:
kN = Σ Ci / λi i = 1
where N is the population estimate (>300 mm or > 400 mm), Ci is the diver count forsection i, λi is the estimated observer efficiency for section i, derived from the observerefficiency study, and k is the total number of stream sections. We estimated confidenceintervals from the cumulative distributions of 1000 estimates of N (for each of the twosize distributions), where λi was simulated stochastically for each section based on themost reliable overall relationship of observer efficiency to physical conditions for thecombined data set. Standard errors for individual predictions of observer efficiency werecomputed using formulae in Zar (1996, p. 332), and these formed the basis for the

13
stochastic simulations. Population estimates for both 2001 and 2002 were expandedbased on the 2003 survey data to account for the reaches that were unsurveyed in 2001and 2002 but that do contain trout >400 mm or >300 mm.

14
RESULTS
Transmitter Distribution and Biological SamplingIn 2001 the diver counts of harvestable rainbow trout (>300 mm) along the length of theSalmo River that were the basis for radio transmitter allocation took place on June 18 andJune 19, 2001, after tagging had already been initiated. Our goal was for tagging to becompleted as shortly as possible after the distribution swims so that the relativedistribution of tags was still representative. Very low densities of harvestable rainbowtrout were distributed upstream of the town of Ymir, located 43 stream kilometers fromthe mouth at the Wildhorse Creek confluence (Figure 1). Harvestable fish were moreprevalent between Ymir and the town of Salmo, with abundances increasing downstreamof Salmo until the sharp peak of relative abundance was reached between Sheep Creekand the former bridge crossing. Harvestable rainbow trout were again less prevalent inhabitats downstream, especially downstream of the South Salmo River confluence.
Tag allocations (of 29 available) were 1, 3, 2, 5, 13, 3, and 2 for the Hall Creek toWildhorse Creek, Wildhorse Creek to Hidden Creek, Hidden Creek to Erie Creek, ErieCreek to Sheep Creek, Sheep Creek to former bridge, former bridge to South SalmoRiver, and South Salmo River to canyon stream sections, respectively. Radiotransmitters were distributed to rainbow trout angled over the period from June 1 to June30, the earliest period suitable for both the distribution swims and relatively efficient fishcapture (because of prior freshet conditions). Angling was terminated when the abovegoals for tag allocation were approximately met, with 0, 4, 2, 5, 13, 4, and 1 transmittersdeployed, respectively, for the same stream sections mentioned above (Figure 2;Appendix II). It is important to note that some care was taken to ensure that theallocation goals were met exactly for the counting section, located between Carney MillRd. in Salmo and the former bridge site (18 tags total - Erie C. to Sheep C. and Sheep C.to former bridge sections).
In 2002 and 2003, all 10 radio tags available were deployed in the counting sectionbetween Carney Mill Road in Salmo and the former bridge site (Figure 2; Appendix II),as they were to be used primarily in the observer efficiency study.
Capture information and body size data for individual fish are presented in Appendix II,for all three years. Salmo River rainbow trout are large. Fish sampled from the catchranged in size from 250 mm to 600 mm, averaging a robust 450 mm (n = 51; SE = 11mm). Visual evidence of physical maturity or recent spawning was noted, as fishcaptures in June (all three years) and early July (2002) were presumed to have takenplace shortly after the completion of spawning activities. Of the 20 fish that showedevidence of spawning in spring 2001, and the 7 that showed evidence of spawning inspring 2002 (others showed no evidence or there was uncertainty), none were smallerthan 390 mm in length, suggesting that this length was the best estimate of the thresholdbody size for adulthood.

15
Figure 2. Capture locations of radio tagged rainbow trout in the Salmo River watershed,2001-2003.

16
Of the 43 fish sampled for scales in 2001, readable scales were available for 37 fishranging from 250 to 600 mm fork length (Appendix III). Scale diameter was a relativelygood predictor of rainbow trout fork length (Figure 3; r2 = 0.77), allowing back-calculation of lengths-at-age for a scale radius corresponding to a preceding annulus.Back-calculated average lengths-at-age were 310 mm (n = 37; SE = 7.2), 390 mm (n =34; SE = 7.8), 440 mm (n = 29; SE = 9.1), 470 mm (n = 14; SE = 17), and 510 mm (n =2; SE = 54) for ages 3 (end of third winter) to 7, respectively (Table 1). Of 37 readablescales, 27 were considered to have come from mature fish. Evidence of spawning on thescales was often subtle, so we employed as many indications as possible in assessingwhether we should attribute a spawning event to a given annulus. Most Salmo Riverrainbow trout (70%, Table 1) appear to spawn for the first time at age 5s (after their fifthwinter), with smaller numbers maturing at ages 4s (11%) and 6s (19%). Back-calculatedlengths-at-first-maturity appear to agree well with the above visual observations ofmaturity status made during fish tagging, with the majority of fish appearing to havespawned for the first time at fork lengths between 375 and 475 mm (Figure 4). Back-calculated growth increments, which could only be estimated between ages covered bythe regression equation, indicated growth in length is greatest in the fourth and fifth yearsof life and slows substantially after the fifth year (Table 1), supporting the notion thatSalmo River rainbow trout begin spawning predominantly at age 5s.
Survival of Salmo River rainbow trout spawners appears to be high. Repeat spawnersmade up 48% of the sample of mature fish, 11% appeared to have spawned three or moretimes, and one fish in its eighth year appeared to have been a four-time repeat spawnerbased on a spawning checks at ages 4s and 5s (Appendix III). Their relatively goodsurvival suggests that the angling exploitation rate for the population of adult fish,therefore, may be relatively low.
Genetic analyses were conducted by laboratory of Dr. E. B. Taylor, Dept. of Zoology,University of British Columbia, and were done concurrently with analyses of the geneticorigins of wild-spawning rainbow trout in the Canadian portion of the Columbia Riverdownstream of the Keenleyside Dam (Taylor 2002). Genetic samples from the Salmowatershed were available only from Clearwater Creek and the mainstem Salmo River.The Clearwater fish were the most divergent population in the study and exhibited aremarkable lack of genetic variation in the sample, which could be related to theirheadwater status or introduction with a small number of founders. Although the twopopulations (Clearwater and mainstem) were clearly genetically distinct from one anotherthey did tend to share alleles to a large degree, but it was not clear that they were moreclosely related to each other than they were to other populations in the study (E.B.Taylor, fish geneticist, University of British Columbia, Vancouver, B.C.; personalcommunication). It should be noted that the Clearwater Creek sample was taken fromupstream of a migration barrier, and genetic divergence between other tributarypopulations inhabiting reaches accessible to Salmo River spawners and the mainstem fishhas not been investigated.

17
Figure 3. Relationship between fork length (mm) of sampled Salmo River rainbow troutand relative scale radius (mm) measured from scale photographs.
Figure 4. Fork length (mm) of Salmo River rainbow trout at first spawning, back-calculated according to the Fraser-Lee formula (Duncan 1980) from the scaleradius (mm) at the annulus where evidence of spawning was suggested.
0
100
200
300
400
500
600
700
20 40 60 80 100 120 140 160
Relative Scale Radius (mm)
Fork
Len
gth
(mm
)
0
1
2
3
4
5
6
7
8
9
350-375 375-400 400-425 425-450 450-475 475-500 500-525 525-550 550-600
Fork Length (mm)
Freq
uenc
y

18
Table 1. Age, life history, and growth from scales of Salmo River rainbow troutsampled during springtime of 2001 (standard errors in parentheses).
AgeIII IV V VI VII
Sample size n 37 34 29 13 2
Avg. fork length (mm) 312 (6.5) 389 (7.8) 442 (9.1) 470 (17) 512 (54)
Preceding year growth (mm) N/A 76 (4.3) 55 (4.6) 27 (4.1) 16 (1.5)
% mature 0 11 81 100 100
Habitat Use
SummerAs water levels dropped during the summer of 2001, most movements of radio taggedrainbow trout were small migrations of less than 2 km. Some fish (n = 9) mademovements of 5-15 km, however, mainly upstream into deep-water pool habitat (Figure5). In general, fewer locations were used by holding trout as the water dropped. In manycases several radio tagged fish moved into the same pool. Large, deeper pools withabundant overhead or wood cover were particularly important. During summer 2002,which had higher river discharge relative to 200l and 2003 (the two lowest levels ofsummer flow in the past decade), few longer migrations were observed (n = 2). Watertemperature data collected during the summer, identified that water temperatures in themainstem were well below upper limits of suitability for rainbow trout (21 ºC - Scott andCrossman 1973). In the summer of 2003 only one long migration was observed, a troutthat moved downstream 4 km into deep pool habitat. In all years, tributary streams werenot used by radio tagged trout during the summer. For the most part as watertemperatures increased, fish moved into pools and areas of cover along the entire lengthof the mainstem Salmo River downstream of Ymir where these habitats were available.There was, however, an obvious avoidance of the channelized section of low complexityextending from the town of Salmo downstream to Hellroaring Creek (Figure 5). Fish thatmigrated during the summer frequently moved through this section, but only one fishever held in this area for an extended period, during July of 2002.
WinterBy the onset of winter in 2001 some redistribution of trout had taken place. In most casesthese movements were small or non-existent from summer holding locations, but severalfish did make downstream migrations of more than 10 km (Appendix IV; Figure 6).Suitable overwintering locations appeared to consist of mainstem areas of reduced flow

19
Figure 5. Summer locations of radio tagged rainbow trout in the Salmo Riverwatershed, 2001-2003.

20
Figure 6. Winter locations of radio tagged rainbow trout in the Salmo River watershed,2001-2003.

21
having an abundance of cover in the form of woody debris, deep pool areas, or bouldersubstrates (Appendix I-Plates G and H). The mainstem river from Salmo to HellroaringCreek was again conspicuously avoided. One fish of note did migrate downstream tooverwinter at the mouth of the Salmo River, and other significant overwintering areaswere located. Similar overwintering habitat use was observed on the only tracking eventof winter 2002/2003, in December 2002, with some fish using the same pool in bothyears for overwintering (Figure 6). During the winter tracking event of 2003/2004, onlythe ten radio tags deployed in trout in early summer of 2003 were still functioning. Thesetrout tracked in March 2004, were found in the same general areas and habitat types thatoverwintering occurred in previous years.
Spawning locationsOf the original rainbow trout radio tagged in the summer of 2001 (n=30), we did notreceive signals from six tags after January of 2002. One of these tags is one known tohave malfunctioned (fish recaptured with radio tag in place), and one fish was assumeddead before the tag signal was lost. It is unknown what the fates of the additional fourtags were. In addition, two tags are known to have been either expelled or removed fromlive fish (angling recaptures), and one fish was assumed to have died soon after capturebased on a complete lack of movement after tag implantation. The remaining 21 radiotagged rainbow trout from 2001 provide data for spawning movements and locations.
During the spring of 2002, weekly tracking events in May and June covered as much ofthe watershed as was feasible and that was thought to provide at least some opportunityfor spawning. An initial tracking survey in the first week of March 2002, identified thatno radio tagged trout had begun spawning migrations. Following this, three trackingevents occurred in April, five tracking events occurred in May, and four tracking eventsoccurred in June. The weekly tracking schedule was an attempt to ensure that the entirepotential spawning period was surveyed, and that the resolution of the surveys wassufficient to detect spawning movements and locations.
The first movement that appeared to be associated with spawning took place in the thirdweek of April, when two radio tagged trout began upstream migrations. Thesemovements occurred during an abrupt increase in discharge in early spring. It appearsthat the spawning period in 2002 extended from early May to mid-June, with peakspawning occurring between the third week of May and early June. This periodcorresponded approximately with mainstem water temperatures of 5°C or greater, andwith the ascending limb of the hydrograph. Redds were identified during trackingsurveys (Appendix I-Plates I and J) as early as May 9 (Table 2; Figure 7) but after mid-May it was virtually impossible to enumerate redds due to high water and poor visibility.
In spring of 2002, radio tagged Salmo River rainbow trout appeared to use primarilymainstem areas for spawning. Suspected spawning locations were distributed along thelength of the mainstem Salmo River where there was suitable habitat (Figure 7).
22
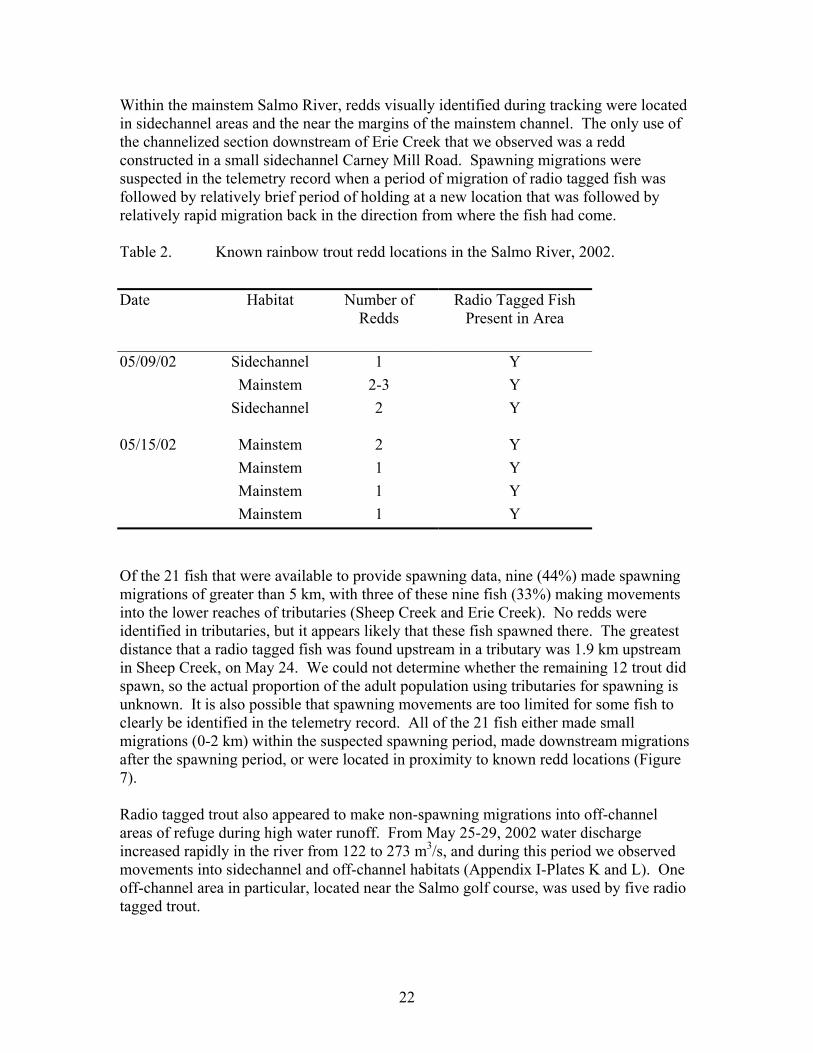
Within the mainstem Salmo River, redds visually identified during tracking were locatedin sidechannel areas and the near the margins of the mainstem channel. The only use ofthe channelized section downstream of Erie Creek that we observed was a reddconstructed in a small sidechannel Carney Mill Road. Spawning migrations weresuspected in the telemetry record when a period of migration of radio tagged fish wasfollowed by relatively brief period of holding at a new location that was followed byrelatively rapid migration back in the direction from where the fish had come.
Table 2. Known rainbow trout redd locations in the Salmo River, 2002.
Date Habitat Number ofRedds
Radio Tagged FishPresent in Area
05/09/02 Sidechannel 1 YMainstem 2-3 Y
Sidechannel 2 Y
05/15/02 Mainstem 2 YMainstem 1 YMainstem 1 YMainstem 1 Y
Of the 21 fish that were available to provide spawning data, nine (44%) made spawningmigrations of greater than 5 km, with three of these nine fish (33%) making movementsinto the lower reaches of tributaries (Sheep Creek and Erie Creek). No redds wereidentified in tributaries, but it appears likely that these fish spawned there. The greatestdistance that a radio tagged fish was found upstream in a tributary was 1.9 km upstreamin Sheep Creek, on May 24. We could not determine whether the remaining 12 trout didspawn, so the actual proportion of the adult population using tributaries for spawning isunknown. It is also possible that spawning movements are too limited for some fish toclearly be identified in the telemetry record. All of the 21 fish either made smallmigrations (0-2 km) within the suspected spawning period, made downstream migrationsafter the spawning period, or were located in proximity to known redd locations (Figure7).
Radio tagged trout also appeared to make non-spawning migrations into off-channelareas of refuge during high water runoff. From May 25-29, 2002 water dischargeincreased rapidly in the river from 122 to 273 m3/s, and during this period we observedmovements into sidechannel and off-channel habitats (Appendix I-Plates K and L). Oneoff-channel area in particular, located near the Salmo golf course, was used by five radiotagged trout.

23
Figure 7. Spawning locations of radio tagged rainbow trout in the Salmo Riverwatershed, 2002-2004.

24
During the spring of 2003, an initial tracking event was conducted in early April, andmonitoring of the same areas surveyed in spring 2002 was then carried out weekly fromlate April to mid-June. Six tracking events took place in May, and two tracking events inJune of 2003.
A total of 12 trout provided data on spawning movements and habitat in spring 2003,three trout that had been initially tagged in 2001 (one of which was retagged in 2002 asthe radio tag had been expelled) and an additional nine that were radio tagged in 2002. In2003, only one trout made an extensive upstream migration of greater than 10 km tospawn, with the majority of trout making small upstream or downstream migrations ofless than 2 km to suspected spawning areas (Figure 7). One trout did not migrate duringthe spawning period but was assumed to have spawned as it had moved upstream from itsoverwintering site. Spawning was concentrated in the last two weeks of May andoccurred quickly as water temperatures rose above 5°C and on the ascending limb of thehydrograph (as in 2002).
Again in 2003, the majority of radio tagged trout (91.7%) were detected only in themainstem Salmo River during the spawning period, with areas associated withsidechannels being important. One fish spawned in Erie Creek approximately 3.0 kmupstream from the mouth. A female trout that moved into Sheep Creek during the 2002spawning period was detected only in the mainstem Salmo River in 2003.
Spawning period radio telemetry observations in the spring of 2004 (for the 10 trout radiotagged in the summer of 2003) were generally consistent with previous years. During theseven tracking events that occurred in May and June all ten trout were tracked on themajority of occasions, and all ten appeared to be alive during the spawning period (Figure7). The telemetry data suggested that the spawning period extended from early May toearly June in 2004, with a peak in activity occurring from mid to late May. Most troutexhibited behaviour consistent with spawning in this two-week period, indicated byrelatively rapid migration (predominantly upstream in 2004) away from overwinteringareas, holding at a potential spawning location for a period of time, and a subsequentmigration in the direction from which it had come.
Only one of the ten trout moved into a tributary during the spawning period. This troutmoved into Sheep Creek, a previously identified spawning tributary, but travelledsubstantially further upstream than had been previously recorded, being found as much as5 km upstream from the mouth during its two-week residence. The overlap in spawningareas for mainstem Salmo River rainbow trout and suspected tributary residentpopulations suggests that there may be a spawning interaction between the fluvial andresident populations. It may also be possible that discharge conditions in the spring of2004 were more suitable for upstream migrations in tributaries relative to the twoprevious years, as the run off during the spawning period was relatively low andsustained.

25
Of the nine trout that did not leave mainstem areas during the spawning period, three aresuspected to have spawned in sidechannel areas parallel to the mainstem channel. A reddwas observed in a sidechannel used by a radio tagged fish during the spawning period. Ingeneral these areas provide ideal habitat characteristics for spawning (lower flows,abundance of gravel, abundance of cover). Other areas where trout were found duringthe spawning period in the mainstem channel of the Salmo River were predominantlyareas where redds have been observed in previous years. These locations were typicallyareas where there was an abundance of gravel in proximity to cover that provided avelocity refuge and/or overhead protection.
Again in 2004, during high discharge events associated with intense precipitation, someradio tagged trout moved into off-channel habitat that provided a velocity refuge. Thesespecific areas were surveyed and do not provide any spawning habitat, but were usedduring high flow events in both 2002 and 2004.
The life history observations of one female trout in particular are worth noting because ofthis fish’s exceptional longevity. On June 20, 2001 the fish was captured, measured at600 mm and implanted with a radio transmitter. At the time of initial capture the femalewas a kelt (Appendix II) and a double repeat spawner, spawning first at age 5 and beingsix years old (Appendix III). In the summer of 2002, this fish was recaptured again as akelt, still 600 mm in length, but had lost its radio tag. This would make it a triple repeatspawner and seven years of age. The trout was implanted with another radio tag in 2002and was seen several times by divers in July of 2002. The fish had reconditioned nicelyduring that summer, and the spawning tracking data suggested that she spawned again inthe spring of 2003. If this was the case, the fish was a four time repeat spawner in herninth year in the spring of 2003.
Observer EfficiencyDuring the first year of the radio telemetry study in 2001 a primary goal was to identifyhabitat use patterns in the watershed, so radio transmitters were deployed in adultrainbow trout along the entire length of the mainstem Salmo River. Eighteen transmitterswere distributed to our 9.0 km observer efficiency study section in spring 2001, andduring surveys between June 28 and July 30 the number of radio tagged trout thatappeared to be alive and were present in the counting section ranged from 11 to 15. Oneradio tagged fish did not move from the surgery site and was never seen by divers, andwas therefore considered dead and not included in the observer efficiency estimates. Tenradio transmitters were deployed in adult trout in 2002, all in the study section. Duringseven surveys of the counting section between July 9 and August 1, the number oftransmitters that were functioning in live fish in the section ranged from 8 to 10. Alltagged fish were visually identified at least once by divers and showed movement in thetelemetry record consistent with their being alive during the entire study period. In 2003we again deployed 10 radio transmitters in the study section, and similar to 2002 all fishwere seen at least once and considered alive for the four surveys between July 2 and July18.

26
Whether an observed rainbow trout was tagged or not was readily apparent to divers in2001 and 2002, when pairs of anchor tags inserted into each fish’s back were orange andwhite, respectively. In contrast, divers considered the blue tags used in 2003 to be lessvisible, and suggested that experience in looking for tagged fish (the antenna trailingbehind the fish and profile of the fish’s back were also clues) was essential to reliablydetermine whether fish seen at a distance were tagged or not. During the annualpopulation census, three of four divers that surveyed our study section on July 10, 2003did not have experience searching for radio tagged fish in fast water, which had not beenthe case for any other survey. Although we used counts of untagged trout from thissurvey in our analyses we did not use the observer efficiency data, which requiredreliable determination of whether fish were tagged or not.
Observer efficiency estimates made from observations of radio tagged trout werepositively related to levels of horizontal underwater visibility in our study reach (Figure8), but the strength of correlation among the variables was inconsistent among years (seeTable 3 for regression data summary). During 2001, the range of visibility conditionsover which observer efficiency estimates were made was limited relative to 2002 and2003, and four of seven estimates were clustered between 10.1 and 11.2 m visibility.Variability in horizontal visibility explained only 4.3% of the variability in observerefficiency for 2001, and the regression was not significant (P = 0.65). In contrast,observer efficiency was significantly related to horizontal visibility in both 2002 (P <0.001) and 2003 (P < 0.001), with 76% and 99.8%, respectively, of the variability inobserver efficiency being explained by visibility changes.
The same patterns in observer efficiency were evident with respect to the three years’discharge data (Figure 9). Variability in log-transformed discharge explained only 3.5%of the variability in observer efficiency for that year, and the regression was notsignificant (P = 0.69). Observer efficiency was significantly and linearly related to log-transformed discharge in both 2002 (P = 0.003) and 2003 (P = 0.018), with 85% and96%, respectively, of the variability in observer efficiency being explained by dischargechanges.

27
Figure 8. Observer efficiency estimates (number of tagged fish seen relative to thenumber known to be present) versus horizontal underwater visibility for threeyears (2001-2003) of periodic surveys in the Salmo River, British Columbia.
0
0.2
0.4
0.6
0.8
1
Obs
erve
r Effi
cien
cy 2001
0
0.2
0.4
0.6
0.8
1
Obs
erve
r Effi
cien
cy
0
0.2
0.4
0.6
0.8
1
4 6 8 10 12 14 16 18Horizontal Visibility (m)
Obs
erve
r Effi
cien
cy
2002
2003

28
Figure 9. Observer efficiency estimates (number of tagged fish seen relative to thenumber known to be present) versus log-transformed discharge past the WaterSurvey of Canada station for three years (2001-2003) of periodic surveys inthe Salmo River, British Columbia.
0.0
0.2
0.4
0.6
0.8
1.0
2.0 2.5 3.0 3.5 4.0 4.5 5.0
Obs
erve
r Effi
cien
cy
0.0
0.2
0.4
0.6
0.8
1.0
2.0 2.5 3.0 3.5 4.0 4.5 5.0
Obs
erve
r Effi
cien
cy
2002
2001
0.0
0.2
0.4
0.6
0.8
1.0
2.0 2.5 3.0 3.5 4.0 4.5 5.0
Ln Discharge (cms)
Obs
erve
r Effi
cien
cy
2003

29
Table 3. Regression analysis summary, Salmo River rainbow trout observerefficiency study.
Year Regression equation r2 P n
2001 Obs = 0.0119Vis + 0.419 0.043 0.66 7Obs = -0.0437LnDis + 0.661 0.035 0.69 7
>300 = 3.56Vis + 97.0 0.153 0.083 7>400 = 0.475Vis + 46.9 0.0096 0.85 7
2002 Obs = 0.0729Vis + 0.249 0.76 0.01 7Obs = -0.437LnDis + 1.94 0.85 0.003 7
>300 = 9.24Vis - 36.1 0.94 <0.001 7>400 = 4.15Vis - 13.5 0.93 <0.001 7
2003 Obs = 0.0618Vis - 0.134 0.998 <0.001 4Obs = -0.498LnDis + 2.08 0.96 0.018 4
>300 = 11.6Vis - 23.7 0.94 0.007 5>400 = 4.82Vis - 9.56 0.87 0.021 5
Combined* Obs = 0.0638Vis - 0.158 0.76 <0.001 17Obs = -0.267LnDis + 1.35 0.48 0.001 18
* Note: outlier from June 28, 2001 removed for Obs vs. Vis regression
Because correlation values for observer efficiency regressions with such few data pointsshould not be considered realistic (Thompson 2003), and because we were interested inwhether general relationships between the variables could be described for populationestimation purposes, we investigated whether combining the three years’ data wasfeasible. We were not able to detect differences statistically among the annual observerefficiency regressions for either visibility (MANCOVA; P = 0.98) or log-transformeddischarge (P = 0.29). A visual inspection of the observer efficiency versus visibilityregression for the combined data set (Figure 10) indicated that the annual dataoverlapped, suggesting that pooling the data was reasonable. For the combined, three-year data set horizontal visibility, which ranged from 5.0 to 16.5 m (average = 10.9 m),was a significant predictor of diver observer efficiency (r2 = 0.62, P < 0.001), whichranged from a minimum 0.13 to a maximum of 0.89 (average = 0.54). We created ageneral relationship of observer efficiency to underwater visibility for use in Salmo Riverpopulation enumeration by removing the outlier from June 28, 2001 (Figure 10;studentized residual = 3.67), after which variation in visibility explained 76% of thevariation in observer efficiency.

30
Figure 10. Observer efficiency estimates (number of tagged fish seen relative to thenumber known to be present) versus horizontal underwater visibility for threeyears’ combined data (2001-2003) from periodic diver surveys in the SalmoRiver, British Columbia.
Log-transformed discharge was also a significant predictor of observer efficiency for thecombined data set (P = 0.001), but explained less of the variation in observer efficiency(r2 = 0.56). Overlap in the annual data (Figure 11) appeared to be less than for theobserver efficiency/visibility plot, suggesting the possibility that the relationship betweendischarge and visibility was not consistent from year to year, but that the observerefficiency/discharge relationships were not precise enough annually to detect itstatistically. We were in fact able to detect a significant difference among the annualrelationships between the discharge and visibility variables (MANCOVA, P = 0.001),although each of these relationships was highly precise on its own. We did not, therefore,make any further use of the overall relationship of observer efficiency to log-transformeddischarge in estimating the population of rainbow trout in the Salmo watershed, asdischarge appeared to be a less reliable as well as a less direct (i.e. cannot be determinedat the time of the survey or specifically in individual stream sections) index of divercount accuracy relative to underwater visibility.
In order to corroborate the relationships of observer efficiency of radio tagged trout tovisibility (Figures 8 and 10), we also examined counts of untagged rainbow trout in thestudy reach (Figure 12). The notion that a positive, linear relationship exists betweenobserver efficiency and horizontal visibility was supported by precise, significant
0
0.2
0.4
0.6
0.8
1
4 6 8 10 12 14 16 18Horizontal Visibility (m)
Obs
erve
r Effi
cien
cy

31
relationships between counts of trout and visibility for both 2002 (>300 mm: r2 = 0.94, P<0.001; >400 mm: r2 = 0.93, P <0.001) and 2003 (>300 mm: r2 = 0.94, P = 0.007; >400mm: r2 = 0.87, P = 0.021). The P–value for the 2003 regression of counts of trout >400mm was not significant after the sequential Bonferroni adjustment of the critical value(Holm 1979, as cited in Rice 1989). The poor quality, non-significant relationshipbetween counts of untagged trout and visibility in 2001 (>300 mm: r2 = 0.48, P = 0.083;>400 mm: r2 = 0.010, P = 0.85) was consistent with the relatively poor observerefficiency relationship for that year.
Figure 11. Observer efficiency estimates (number of tagged fish seen relative to thenumber known to be present) versus log-transformed discharge past the WaterSurvey of Canada station for three years’ combined data (2001-2003) fromperiodic diver surveys in the Salmo River, British Columbia.
0.0
0.2
0.4
0.6
0.8
1.0
2.0 2.5 3.0 3.5 4.0 4.5 5.0
Ln Discharge (cms)
Obs
erve
r Effi
cien
cy

32
Figure 12. Counts of untagged rainbow trout >300 mm (solid circles) and >400 mm(open circles) versus horizontal underwater visibility for three years (2001-2003) of periodic surveys in the Salmo River, British Columbia.
020406080
100120140160180
Cou
nt
020406080
100120140160180
Cou
nt
020406080
100120140160180
4 6 8 10 12 14 16 18
Horizontal Visibility (m)
Cou
nt
2001
2002
2003

33
2001 Population Size EstimatesParameter estimationAverage diver counts (C) of rainbow trout in the index section between June 28 and July30 were 306 (SE = 54.9), 130 (SE = 13.8), 83 (SE = 4.8), 43 (SE = 3.0), and 9 (SE =0.99), for the size classes 0-200 mm, 200-300 mm, 300-400 mm, 400-500 mm, and >500mm, respectively (Table 4; Appendix IV). It is important to note that these estimates donot include the diver counts for June 18, which were made during the surveys along thesurveyed length of the Salmo mainstem. Counts on that date were only for the sizecategory >300 mm in order to increase the distance divers could cover each day, andfurthermore we were interested in the population estimate for July specifically, forcomparison with future surveys. Either strong recruitment to the mainstem Salmo,marked behavioural shifts, or increased observer efficiency relative to larger fish wasdocumented for parr less than 200 mm over the course of the study (Table 4; AppendixIV). Strong patterns were not obvious for other size classes with the possible exceptionof the 200-300 cm fish, which increased to stable levels after a low initial count on June30 (possibly indicating recruitment or observer efficiency changes). It is important tonote, however, that the above comments are only speculative, as these topics were notinvestigated directly.
Table 4. Diver counts of rainbow trout in the index section of the Salmo River,2001.
Date 0-200 mm 200-300 mm 300-400 mm 400-500 mm 500+ mm28-Jun-01 161 64 73 55 704-Jul-01 287 147 77 35 606-Jul-01 195 135 96 42 916-Jul-01 388 135 69 38 818-Jul-01 277 136 92 41 930-Jul-01 528 161 93 49 13Average 306 130 83 43 9
SE 54.9 13.8 4.8 3.0 1.0
Observer efficiency (λ, radio tags seen/radio tags known to be present) for radio tagged,Salmo River rainbow trout averaged 0.57 and was relatively stable (SE = 0.043) over thecounting period as described above. Again, this estimate does not include the observerefficiency estimate for June 18 because counts of rainbow trout on this date were notmade for the size category >400 mm, and we were interested in population estimates forJuly for comparative purposes. It is also important to note the study’s assumption thatobserver efficiency for all rainbow trout greater than 300 mm in length can be describedby observations of tagged fish that were necessarily greater than 350 mm (minimum sizerequirement for the size of the implanted transmitter).
The relative distribution (r) of radio tagged fish to the counting area was relatively stablebetween June 28 and July 30, averaging 47% (SE = 3.0%) of the total. Because the

34
allocation of radio tags was based on the relative distribution of fish >300 mm observedduring the distribution swims, we assumed movements of radio tagged fish wererepresentative of the untagged population as well. After the June distribution swims, 17of 29 radio tags were allocated to the counting area - during the July diver counts 12-16radio tagged rainbow trout were present depending on the survey. One of these taggedfish was assumed to have died shortly after tagging, as it never showed any movementfrom the tagging location and was never seen by divers. It was removed, therefore, fromthe calculation of the observer efficiency and relative distribution estimates.
Population estimatesThe population estimates for Salmo River rainbow trout greater than 300 mm (availablefor harvest) and 400 mm (estimated breeding population) were made utilizing the averagevalues for the parameters and were not based on the regressions with watershed physicalconditions, which were not significant during 2001 as described above. The relativeconsistency and good precision of each, however, suggested that reliable populationestimates based on average values were feasible. Average diver count, observerefficiency, and relative distribution parameters were stochastically simulated 1000 timesand combined to generate an estimate of 496 (SE = 54.2; 95% CI: 401 < N < 606) forrainbow trout >300 mm for the surveyed section of the mainstem Salmo River. Becauserearing habitats in the canyon comprising the lower 5.7 km of the Salmo were not takeninto account in this estimate, the estimate was expanded by a factor equal to the relativeproportion of the 2003 population residing in the unrepresented reaches, or 18%. Theresulting population estimate of rainbow trout >300 mm in the mainstem of the SalmoRiver for 2001 was 605 (SE = 66.1; 95% CE: 489 < N < 739). The relative precision ofthis estimate, expressed as the average confidence interval as a proportion of the mean,was 0.21, within the 0.25 target recommended by Robson and Regier (1964) formanagement experiments. The estimated size of the population of rainbow trout >400mm for the mainstem Salmo was 233 (SE = 27.3; 95% CI: 184 < N < 289). The relativeprecision of this estimate was 0.23, also within the 0.25 threshold. We expect theaccuracy of this latter estimate to be relatively high, as fish >400 mm weredisproportionately represented in the radio tagged group.
2002, 2003 Population Size EstimatesParameter estimationTo estimate the size of the Salmo River rainbow trout population in July 2002 we swamthe mainstem from the town of Ymir (lower Porto Rico Rd. bridge) downstream to thetop of the canyon over a four-day period between July 22 and July 25 inclusive.Rainbow trout observations in all size categories were recorded, unlike the survey of themainstem Salmo in June 2001 (Table 5; Appendix IV). Over five days in July 2003 (July7-July 17), we swam the same stream reaches but with additional swims to includehabitats upstream of Ymir to Hall Creek, and to include the previously-unsurveyed 5.7km canyon reach above Seven Mile Reservoir (Table 6; Appendix IV).
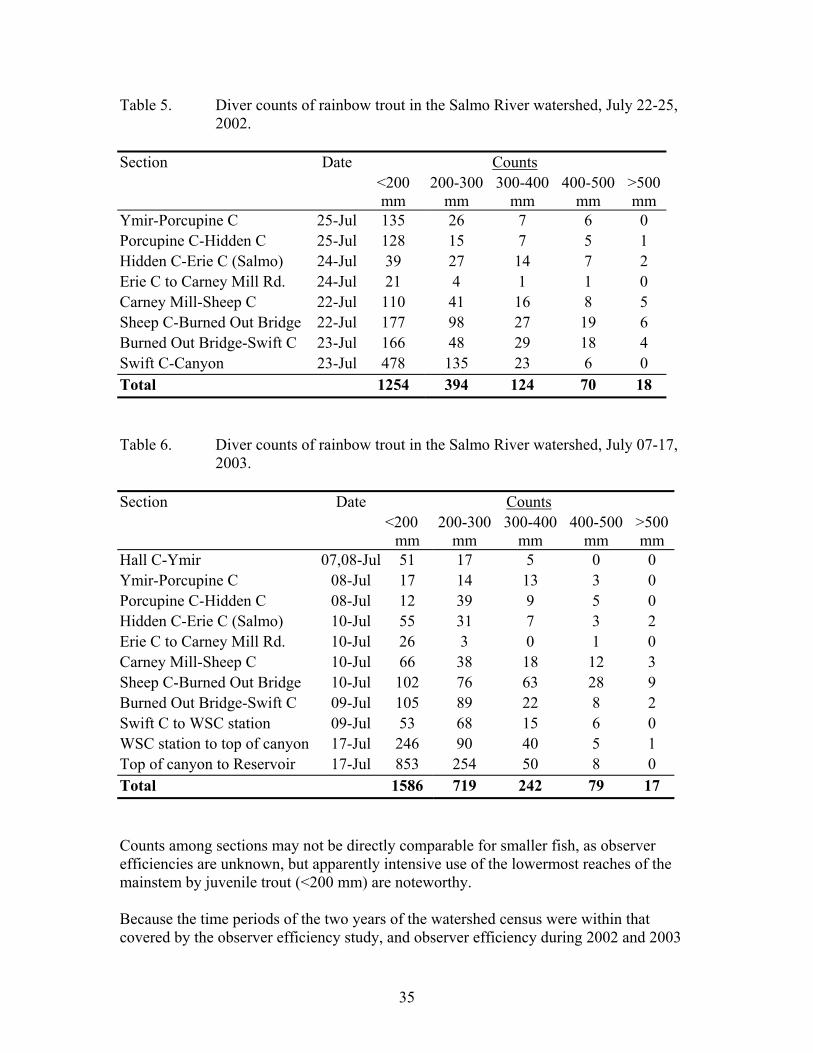
35
Table 5. Diver counts of rainbow trout in the Salmo River watershed, July 22-25,2002.
Section Date Counts<200mm
200-300mm
300-400mm
400-500mm
>500mm
Ymir-Porcupine C 25-Jul 135 26 7 6 0Porcupine C-Hidden C 25-Jul 128 15 7 5 1Hidden C-Erie C (Salmo) 24-Jul 39 27 14 7 2Erie C to Carney Mill Rd. 24-Jul 21 4 1 1 0Carney Mill-Sheep C 22-Jul 110 41 16 8 5Sheep C-Burned Out Bridge 22-Jul 177 98 27 19 6Burned Out Bridge-Swift C 23-Jul 166 48 29 18 4Swift C-Canyon 23-Jul 478 135 23 6 0Total 1254 394 124 70 18
Table 6. Diver counts of rainbow trout in the Salmo River watershed, July 07-17,2003.
Section Date Counts<200
mm200-300
mm300-400
mm400-500
mm>500mm
Hall C-Ymir 07,08-Jul 51 17 5 0 0Ymir-Porcupine C 08-Jul 17 14 13 3 0Porcupine C-Hidden C 08-Jul 12 39 9 5 0Hidden C-Erie C (Salmo) 10-Jul 55 31 7 3 2Erie C to Carney Mill Rd. 10-Jul 26 3 0 1 0Carney Mill-Sheep C 10-Jul 66 38 18 12 3Sheep C-Burned Out Bridge 10-Jul 102 76 63 28 9Burned Out Bridge-Swift C 09-Jul 105 89 22 8 2Swift C to WSC station 09-Jul 53 68 15 6 0WSC station to top of canyon 17-Jul 246 90 40 5 1Top of canyon to Reservoir 17-Jul 853 254 50 8 0Total 1586 719 242 79 17
Counts among sections may not be directly comparable for smaller fish, as observerefficiencies are unknown, but apparently intensive use of the lowermost reaches of themainstem by juvenile trout (<200 mm) are noteworthy.
Because the time periods of the two years of the watershed census were within thatcovered by the observer efficiency study, and observer efficiency during 2002 and 2003

36
appeared to be strongly related to underwater visibility, we were able to estimate observerefficiency for each stream section surveyed from the overall regression of observerefficiency on visibility (Figure 10). Horizontal underwater visibility was recorded foreach day, and that visibility measure was used to estimate observer efficiency using theoverall regression equation (Table 3).
Population estimatesPopulation estimates for each section and their uncertainty (2002: Table 7; 2003: Table 8)were generated by factoring counts together with stochastically simulated observerefficiency values, which were generated from the standard errors for each predicted valueof observer efficiency from the regression relationship (Zar 1996). The overallpopulation estimate for 2003 (Table 8) was derived by summing the stochasticallysimulated section estimates. The Hall Creek to Ymir section that was omitted in 2002was not important for larger rainbow trout in 2003, containing only 1% of the total >300mm and no fish >400 mm (Table 8). However, in 2003 substantial use by larger rainbowtrout occurred in the previously unsurveyed 5.7 km canyon above Seven Mile Reservoir,where 9% of trout >400 mm and 18% of trout >300 mm were found.
Table 7. Population estimates for rainbow trout in the Salmo River watershed, July22-25, 2002.
Section Date Average Observer Estimate >300mm Estimate >400mmvisibility efficiency N LCI UCI N LCI UCI
Hall Creek-Ymir* na 5 0Ymir-Porcupine C 25-Jul 13.8 0.72 18 14 26 8 6 12Porcupine C-Hidden C 25-Jul 13.8 0.72 18 14 26 8 6 12Hidden C-Erie C (Salmo) 24-Jul 11.7 0.55 42 30 71 16 12 28Erie C to Carney Mill Rd. 24-Jul 11.7 0.62 3 2 5 2 1 2Carney Mill-Sheep C 22-Jul 12.1 0.61 48 35 74 21 16 33Sheep C-Burned Out Bridge 22-Jul 12.1 0.61 86 63 141 41 30 68Burned Out Bridge-Swift C 23-Jul 10.7 0.51 99 70 171 43 30 74Swift C-Canyon 23-Jul 10.7 0.54 54 39 94 11 8 19Canyon-Reservoir* na 82 15Total 454 399 586 166 145 216*Note: not surveyed - estimate derived from the proportions of the total count in 2003 found in these sections
The pattern of trout abundance along the mainstem of the Salmo River was roughlysimilar for 2002 and 2003 (Tables 7 and 8). Habitats upstream of the town of Ymir donot appear to be utilized intensively by larger trout, and abundances are relatively lowbetween Ymir and Salmo. Larger trout are almost completely absent from thechannelized section extending downstream of the town of Salmo to Hellroaring Creek(Carney Mill Rd. in Tables 7 and 8). Abundances increase in habitats downstream

37
reaching a peak for both years in the stream section downstream of Sheep Creek. Trout>300 mm in length are abundant along the entire stream length between HellroaringCreek and Seven Mile reservoir, but adult trout >400 mm show a much stronger peak inabundance in the stream section between Sheep Creek and Swift Creek. In 2003 thestream section immediately below Sheep Creek (Table 8: Sheep C-Burned Out Bridge)was particularly important, accounting for almost four times as many >400 mm fish asany other section.
Table 8. Population estimates for rainbow trout in the Salmo River watershed, July07-17, 2003.
Section Date Average Observer Estimate >300mm Estimate >400mmvisibility efficiency N LCI UCI N LCI UCI
Hall Creek-Ymir 07,08-Jul 12.9-13.8 0.67-0.72 8 6 12 0Ymir-Porcupine C 08-Jul 12.2 0.62 26 19 41 5 4 8Porcupine C-Hidden C 08-Jul 12.2 0.62 22 17 36 8 6 13Hidden C-Erie C (Salmo) 10-Jul 13.5 0.70 17 13 27 7 5 11Erie C to Carney Mill Rd. 10-Jul 9.5 0.45 2 1 4 2 1 4Carney Mill-Sheep C 10-Jul 12.8 0.66 50 38 77 23 17 35Sheep C-Burned Out Bridge 10-Jul 9.8 0.46 215 148 429 80 55 159Burned Out Bridge-Swift C 09-Jul 9.3 0.44 73 49 149 23 15 47Swift C to WSC station 09-Jul 7.9 0.34 61 36 213 17 10 61WSC station to top of canyon 17-Jul 9.7 0.46 99 67 198 13 9 26Top of canyon to Reservoir 17-Jul 9.7 0.46 125 84 256 17 12 35Total 700 613 1040 195 169 297
The overall population estimates for 2002 (Table 7) were expanded to account for the19% of rainbow trout >300 mm in unsurveyed sections, and the 9% of trout >400 mm inthese same sections as suggested by the 2003 surveys. In 2002 the estimated size of thepopulation of Salmo River rainbow trout >300 mm was 454 (SE = 40.8; limits of 95%confidence: 399-586), and the estimated size of the population >400 mm was 166 (SE =17.3; limits of 95% confidence: 145-216) at the time of the census. Average confidenceintervals calculated in this manner as proportions of the estimates for 2002 were 0.206and 0.214 for the >300 mm and >400 mm size categories, respectively, within the 0.25threshold recommended by Robson and Regier (1964) for management experiments.Estimates were less precise for 2003 relative to 2002, because of lower values of observerefficiency in important stream reaches (Table 8 vs. Table 7). The estimated size of the2003 population of Salmo River rainbow trout >300 mm was 700 (SE = 120; limits of95% confidence: 613-1040), and the estimated size of the population >400 mm was 195(SE = 35.9; limits of 95% confidence: 169-297) in July. Average confidence intervals asproportions of the estimates for 2003 were 0.305 and 0.328 for the >300 mm and >400mm size categories, respectively. An index based on only one stream section could have

38
shown substantially more variability between the two years than the overall populationestimate.
No clear trend in abundance is evident in the three years’ data (Table 9), although 2002appears to represent a low point in abundance for both >300 mm and >400 mm trout.Abundance estimates of rainbow trout >300 mm range from 454-700 over the three years,and abundance estimates of >400 mm fish range from 166-233.
Table 9. Overall population estimates for the mainstem Salmo River in July, 2001-2003.
95% confidence 95% confidenceYear >300mm SE Interval >400mm SE Interval2001 605 66.1 489-739 233 27.3 184-289
2002 454 40.8 399-586 166 17.3 145-216
2003 700 120 613-1040 195 35.9 169-297

39
DISCUSSION
Critical Habitats, Population Spatial Structure, and DiversityLarger trout inhabit deeper pools of the Salmo mainstem with abundant overhead orwood cover year-round. Such habitat is relatively limited in the Salmo River watershed,especially after discharge through the mainstem has dropped to low levels by mid-summer. Where it is found it is intensively used - we frequently observed several radiotagged fish within the same pool. Stream sections upstream of the town of Ymir lackdeeper pools and few larger rainbow trout were found there. There is a critical lack ofsuch habitat in the stream section between Erie Creek and Hellroaring Creek, where thestream has been channelized and straightened. Anecdotal reports suggest that this sectionof the Salmo once contained abundant deep pools and cover, and was the site of ‘good’rainbow trout fishing. The section now is nearly devoid of larger trout (Tables 7 and 8),illustrating the effects of stream channelization and suggesting that a potentially seriousnet loss of trout habitat has occurred in the watershed.
The discovery that off-channel areas of the floodplain can be extensively used by largertrout, and not just juveniles, during high flows is noteworthy, and suggests that theseareas may form critical habitats during freshet or flood events. Channelization of themainstem river also eliminates access to these off-channel habitats, and may seriouslylimit the amount of sidechannel spawning habitat as well. Preserving fish habitat in theSalmo River watershed will therefore require that watershed and riparian processes thatcreate fish habitat in the mainstem are maintained, through limiting channelizationactivities, maintaining mature riparian vegetation as sources of instream cover, andregulating upstream forestry management to ensure sediment transport and pool in-fillingalong the mainstem is limited to acceptable levels. Because a substantial net loss ofrainbow trout habitat has occurred along the Salmo mainstem due to channelizationactivities, stream restoration activities may be warranted. The building of periodicconstrictions in channelized areas to cause scour and increased pool depth, especially ifassociated with cover structures, may be an appropriate remedial action. Calibrated divercounts will be an effective way to monitor the effects of any such restoration activities ontrout distribution and overall abundance, and can even be conducted at restored areasduring the population census program.
Three years’ telemetry data suggests that rainbow trout spawners in the Salmo watersheduse mainstem channel margins and sidechannels, as well as the lower reaches (up to atleast 5 km) of larger tributaries such as Sheep and Erie creeks. The lower reach of theSouth Salmo River appears to have comparable habitats and access, and it appears likelythat it, too, is utilized to some degree. Little spawning by fluvial rainbow trout occurs inmainstem sections upstream of the town of Ymir. Spawning timing appears to be fromapproximately early May to mid-June, with our best estimate of the peak of spawningbeing late-May.
Diver count data for juvenile rainbow trout (Tables 5 and 6) is of unknown reliability, butwill certainly be an underestimate. Nonetheless, intensive use of the lower reaches of the

40
Salmo mainstem is indicated, which is of higher gradient and larger bed material,implying that many juvenile rainbow trout will swim upstream to inhabit deeper holdingwater as they grow.
The estimated percentage of all living radio tagged rainbow trout appearing to haveentered tributaries during the spawning period was never more than 15%, and none weredetected more than 5.0 km upstream of the tributary’s mouth. It may be, therefore, thattributary populations of smaller rainbow trout are primarily of the stream resident lifehistory. Samples of rainbow trout from the South Salmo River and Sheep Creek includeindividuals up to age 4, also supporting the notion that these fish are residents (Decker2003). However, it should be noted that the estimate of tributary use may be low if notall of the radio tagged rainbow trout spawned. For example, during the springtime 2002spawning period three of the nine radio tagged fish that made migrations during thespawning period of greater than 5 km, or 33%, entered tributaries. Tracking in 2004 of afish 5 km upstream in Sheep Creek also suggested there may be some interaction duringthe spawning period between resident and fluvial forms.
The spatial structure (limits of genetic interactions and rates of gene flow) of populationsof rainbow trout in the Salmo River watershed likely cannot be inferred withoutadditional study, which would require at a minimum tissue sampling and genetic analysisfor tributary populations for comparison with results from mainstem samples (Taylor2002). Gene flow and migrants from tributary populations are likely, but whether thesesignificantly increase genetic and demographic resilience (sensu Simberloff 1988) for themainstem population would be difficult to infer. Hybrids could reasonably be producedfrom ‘sneak’ matings of resident males with fluvial females, but selection in alternativetributary and mainstem niches against intermediate hybrid phenotypes is possible.Residents make limited downstream movements and mature at smaller body sizes andyounger ages than migrants (Elliott 1987). Northcote (1981) found substantialdifferences in spawning timing for resident and migratory rainbow trout in a steeptributary to Kootenay Lake, and attributed them to strong selection in resident fish foremergence after freshet had abated so that they would not be swept downstream. Thefluvial trout of the Salmo River mainstem appear to mature at an exceptionally large bodysize and advanced age, which may reflect adaptations to physical conditions duringspawning in mainstem habitats. In Elliott’s (1987) study he suggested adaptations byresidents in ‘fringe’ habitats would be in response to density-independent mortalityfactors, whereas in highly suitable habitats inhabited by fluvial and migratory fishadaptations would reflect density-dependent population regulation. If selection foradaptations to alternative niches in the Salmo watershed is strong relative to gene flow(few hybrids and they fair poorly), tributary and mainstem populations may begenetically distinct and tributary phenotypes will not be able to replace mainstemphenotypes in habitats left open in a situation of severe population decline.
The genetic origins or relationships of Salmo watershed rainbow trout have not beendetermined (Taylor 2002). Stocking of rainbow trout into the Salmo River watershedtook place sporadically between 1924 and 1953 (BC MWLAP data on file), but it cannotbe assumed that widespread introgression of wild and hatchery genotypes occurred.

41
Wild-spawning, apparently native rainbow trout in the free-flowing portion of theColumbia River below the Keenlyside Dam in Canada show little genetic impact fromRoosevelt Reservoir hatchery stocking programs (Taylor 2002), a result which isconsistent with a growing number of studies addressing this issue (e.g. Moran et al. 1994;Hansen et al. 1995). Until it is established otherwise, we consider it prudent to managethe Salmo mainstem population as if it were genetically unique and native. With respectto other fluvial forms of rainbow trout, the Salmo watershed is now genetically isolated,by the continuous impoundment of the Columbia and lower Pend d’Oreille Rivers, frompopulations downstream. Connectivity with populations upstream, each of which isseparated from the Salmo River by at least one dam, is currently unknown.
Abundance and Population Growth RateThe conservation in perpetuity of wild fish populations is the top management priority forthe BC Ministry of Water, Land and Air Protection (MWLAP). The agency needsassurance that small populations, in particular, do not face an unacceptably highprobability of extinction or severe depletion. Predicting the persistence or extinction ofsmall populations has been a primary focus of the growing discipline of conservationbiology. Because there are many causes of extinction for small populations in addition toanthropogenic agents forcing negative growth rates (those with some theoretical supportinclude demographic stochasticity, environmental stochasticity, severe inbreeding, andlong-term genetic losses - Simberloff 1988; Caughley 1994), predicting the extinctionrisk to a particular population is inexact at best. Speculation about the minimumpopulation sizes necessary to reduce extinction risks to acceptable levels (MVP -minimum viable population size) has been primarily from two perspectives, one based ongenetic processes and the other on stochastic population dynamics. In the genetics-basedapproach the conservation minimum is generally set by i) the risk of fixation ofdeleterious alleles (genetic drift), and/or ii) the requirement for some minimum amount ofgenetic variation that allows the population to evolve, which from this perspective is anessential buffer against environmental change. Conversely, from the perspective of thepopulation dynamics-based approach the conservation minimum is determined accordingto the extinction probabilities set by stochastic demographic processes.
Genetics- and population dynamics-based models of extinction tend to reach similarconclusions about minimum viable population sizes. The importance of genetic drift infixing deleterious alleles in a population is related to Ne, the effective population size,which is a measure of how many individuals are contributing their genes to the nextgeneration (Nunney and Campbell, 1993). Franklin (1981, as cited in Nunney andCampbell 1993) argued that Ne must remain > 50 to for a population to avoid sufferinginbreeding depression, and probably greater still to maintain the genetic diversityrequired for adaptation to a changing environment. Turning this Ne into an equivalent N(number of adults in the population) is not straightforward, because N will increaserelative to Ne with increases in the magnitude of population fluctuations. Arecommended minimum adult population size of at least five times the minimum Ne (N =250) therefore, has been suggested if populations fluctuate significantly (Nunney andCampbell 1993). It is important to note, however, that the importance of genetics in
42
extinction has not been demonstrated sufficiently well to allow specific managementpredictions (Boyce 1992).
Models of extinction due to demographic stochasticity alone (reviewed in Boyce 1992;Nunney and Campbell 1993) support a lower limit to the MVP of approximately N = 100,although the MVP can increase by up to an order of magnitude if populations are subjectto a relatively high degree of environmental stochasticity. Neither genetics- norpopulation dynamics-based models of minimum viable population size areuncontroversial. However, empirical evidence does suggest that the above guidelinesmay be of the appropriate magnitude. Studies of extinction in mammals and birds havesuggested that N < 50 is clearly insufficient for a population’s long-term persistence,populations of 50 < N < 200 are marginally secure, and those of N > 200 are secure atleast over time frames as limited as those used in the studies (reviewed in Boyce 1992).There is a clear need for a review of empirical data with respect to N and long-termpersistence among fish populations and taxa.
Aging analysis and visual observations of maturity status for captured fish (Table 1;Appendix III) suggested that the large majority of Salmo River rainbow trout spawn forthe first time when they are five years old and greater than 400 mm in length. Theestimates of the size of the Salmo River population that is >400 mm fork length,therefore, is the best estimate of the adult population size N. Estimates of rainbow troutN for the mainstem Salmo River between the Hall Creek canyon and Seven MileReservoir were 233 + 27, 166 + 17, and 195 + 36 for July 2001, July 2002, and July2003, respectively. According to the above criteria, the current abundance levels ofSalmo River adult rainbow trout may therefore be close to minimum levels consideredadequate for long-term conservation.
Three years of population estimates is not enough of a time series to investigate thepopulation growth rate (population increasing or declining) for the rainbow trout of theSalmo River mainstem, especially considering that the estimates were by two differentmethods and natural variability in the adult population size N is unknown.Anthropogenic factors forcing negative population growth rates are far more seriousthreats to a population’s long-term persistence than are genetic and demographic factorsassociated with small population sizes (Caughley 1994). Although other anthropogenicagents capable of forcing decline in the Salmo population may exist, angling harvest isthe most obvious and immediate threat. Given the current population size, even a smallnumber of skilled anglers regularly harvesting one adult fish per day from the SalmoRiver could rapidly drive adult rainbow trout abundance to potentially dangerous levels.It is possible, of course, that the Salmo River rainbow trout population is stable under themanagement scenario in place to this point in time, and it may even be at the watershed’scarrying capacity and therefore buffered to some extent from annual variability inrecruitment and harvest. As mentioned, the relatively high incidence of repeat spawningsuggests that exploitation of adult rainbow trout in the Salmo may currently be low.Regular abundance monitoring, especially if it is accompanied with a willingness toexperiment with alternative harvest regulations, is the key to learning about thepopulation’s status relative to meaningful conservation and management targets.

43
Accuracy of Diver Counts of TroutAlthough it is intuitively obvious that good underwater visibility is required for divers tobe able to accurately census fluvial salmonid populations, rarely have the effects ofvariation in visibility on accuracy of diver counts been described quantitatively. In ourstudy, variation in underwater visibility and discharge had significant effects overall onthe accuracy of diver counts of adult rainbow trout in our study reach (Figures 10 and11). Visibility and discharge were highly correlated, and of the two we chose visibility asthe best index of diver count accuracy because of its higher correlation value withobserver efficiency and how practical it is in application: diver count accuracy can bepredicted from a simple measure that can be made prior to initiating the annual censuseffort. The linear regression equation (Table 3) we used to describe the overallrelationship of observer efficiency to visibility provides a basis for adjusting futurecounts of adult trout in the system, in order to generate population estimates, and also forestimating confidence intervals for these estimates. Provided horizontal underwatervisibility is sufficient at the time of the annual population census in July, rainbow troutpopulation abundance estimates should be relatively precise. Average 95% confidenceintervals for the population estimates will be close to target suggested by Robson andRegier (1964) for management purposes provided horizontal visibility is sufficientlyhigh. The comparison of precision for the population estimates for 2002 and 2003 isinstructive. In 2002, when percent relative error (average confidence interval as apercentage of the estimate) was within the 25% target, average visibility in importantstream sections (downstream of Carney Mill Rd.) was 10.7-12.1 m, while in 2003 whenpercent relative error for adult trout was 33%, average visibility in these sections was 7.9-12.8 m but always below 10 m downstream of Sheep Creek. We recommend a lowerthreshold of horizontal secchi disk visibility of 10 m in important stream sections duringthe basin-wide population census. Although there are other sources of variation thatadversely affect the ability of a population estimate time series to detect real changes inabundance, such as natural recruitment variation caused by environmental and biologicalinfluences, precise abundance estimates appear to be crucial for the rapid, sensitivedetection of population impacts from such potential causes as habitat alterations,population enhancements, or harvest management changes (Korman and Higgins 1997;Ham and Pearsons 2000).
Counts of untagged trout in our study provided important corroboration for the observerefficiency relationships derived from observations of radio tagged fish, as theirrelationships to levels of horizontal visibility for each year of the study showed much thesame pattern as did the corresponding observer efficiency relationships (Figures 10 and12). The consistently good precision of the 2002 and 2003 relationships of counts tovisibility, in particular, provided strong support for the notion that the accuracy of divercounts and levels of visibility can be linearly and closely related, but also suggested thatthe quality of the underlying relationship between observer efficiency and visibility hadbeen underestimated by the observations of radio tagged trout. Extreme points in the2002 observer efficiency regression are not reflected in the counts of trout on those dates,and their occurrence may therefore be due mainly to the small sample of radiotransmitters in the study area. There were 8-10 transmitters present for each survey made

44
during July 2002 and July 2003, a relatively small fraction of the number of untaggedtrout of the same size.
The 2001 observations of radio tagged and untagged trout are more problematic tointerpret, as both show insignificant, poor quality relationships with visibility. Therelationships of counts of trout, in particular, are in contrast to the precise, significantrelationships of counts to visibility in 2002 and 2003, suggesting that the poorrelationships could not easily be attributed to sampling error alone. The poor range ofvisibility conditions over which the observations were made, along with the fact thatthese data are from the first year of the study, may have affected the results. Behaviouraldifferences may also have contributed - flows reached mid-summer low levels earlier inthe year than in any other year over the fourteen-year period between 1993 and 2003(Figure 13). Although we did not find the interannual variability in the observerefficiency relationships to be statistically significant, the 2001 results do suggest apotential importance in conducting behavioural studies over a multi-year time frame. Forensuring that variability in the relationships between the accuracy of diver counts andfactors that affect it are realistic, and that relationships can be extrapolated across years,the three-year time period of our study may represent a minimum level of commitment.With respect to fluvial salmonid populations, we are not aware of any studies that haveinvestigated interannual variability in factors that affect the accuracy of underwatercensus methods.
Figure 13. Water discharge (m3/sec) in the Salmo River over the June 1 to August 1period in 2001, 2002, and 2003 and the fourteen-year average for that period.
There are only a small number of published accounts of the accuracy of underwatercensus techniques for fluvial salmonid populations, but from these studies it appears that
0
50
100
150
200
250
01-J
un
08-J
un
15-J
un
22-J
un
29-J
un
06-J
ul
13-J
ul
20-J
ul
27-J
ul
Date
Dis
char
ge (m
3/se
c)
2001
2002
2003
Average (1990-2003)

45
system-to-system variability can be high. During their study in which a surveyed reachwas poisoned with rotenone after underwater census, Northcote and Wilkie (1963)estimated the observer efficiency of a team of divers counting rainbow trout andmountain whitefish. Although their estimate of horizontal visibility (“at least 25 feet”)does not allow a direct comparison with our results, their estimate of 59% observerefficiency for rainbow trout and 64% for mountain whitefish are not greatly different forthe overall average observer efficiency in this study of 54%. Consistently high levels ofobserver efficiency have been reported for westslope cutthroat trout (Oncorhynchusclarki lewisi) in larger rivers with relatively sparse cover. In a mark-recapture studySlaney and Martin (1987) estimated the observer efficiency for underwater counts ofwestslope cutthroat trout of greater than 200 mm length to be 74% despite underwatervisibility of only 3 m, while Zubik and Fraley (1988) found that diver counts were ingood agreement with the mark-recapture estimates at ‘good’ levels of water clarity.Estimates of visibility were made for the latter study and ranged from 4-4.6 m, butbecause they were estimated as the distance at which the species and size class ofobserved fish could no longer be determined they are not directly comparable with ourresults. More recently, observer efficiency estimates for diver counts of westslopecutthroat trout in the Wigwam and Bull rivers in southeastern British Columbia were79% at 12.9 m and 81% at 12.2 m average horizontal secchi disk visibility, respectively(J. Baxter and J. Hagen; unpublished data). Diver counts of brown trout (Salmo trutta)were between 57-66% of the mark-recapture estimates at approximately 7 m horizontalvisibility in one of two New Zealand rivers studied by Young and Hayes (2001), and 21-43% in the other at approximately 10 m visibility. The lower levels of accuracy werefound in the system with more instream cover despite a better level of visibility.
Differences in behaviour among the species studied in the above accounts may contributeto the variation among the observer efficiency estimates. Northcote and Wilkie (1963)observed adult rainbow trout in the Lardeau River, British Columbia under conditions of>10 m underwater visibility, and noted that fish fled laterally as the line of diversapproached, then burst upstream through it, behaviour that could affect counting accuracyin lower visibility conditions. When approached by the line of divers, adult rainbow troutin the Salmo River during this study reacted in the same manner. Young and Hayes(2001) suggested that brown trout in New Zealand rivers react to divers by moving intocover when it was available, behaviour which appeared to have a significant effect onobserver efficiency. In contrast, Schill and Griffith (1984) and Zubik and Fraley (1988)both indicated that westslope cutthroat trout showed little reaction to the presence ofdivers, observations that appear to be true for the subspecies in southeastern BritishColumbia rivers as well. This behaviour must certainly be a factor in the relatively highlevels of observer efficiency observed for the studied populations across a range ofvisibility levels. For westslope cutthroat trout, then, it is possible that observer efficiencyestimates are less system-specific and more precise generally, and calibrationrelationships may be suitable for more general application across the subspecies’ range.
In our study, the relatively good agreement between observations of tagged and untaggedfish relative to underwater visibility changes is consistent with the assumption, implicit inour methods, that adult trout bearing surgically implanted radio transmitters behave in a

46
manner representative of untagged trout in mark-recapture studies. Outfitting markedfish with radio transmitters is attractive because certain assumptions implicit in mark-recapture studies, such as (1) no emigration of marked individuals out of the study area,and (2) no mortality or harvest of tagged individuals, can usually be verified when thelocation of the radio transmitter is known with certainty. This is of obvious benefit instudies such as ours, where multiple recapture surveys are planned over longer timeperiods and over a range of viewing conditions in order to investigate factors that affectcounting accuracy. Other factors than underwater visibility and discharge that may affectthe observer efficiency of fluvial salmonid populations include temperature, availabilityof cover, and light intensity. Our study has suggested that observations of radio taggedindividuals over a representative range of values for the potential factor can establish thevalue of and confidence level for the observer efficiency parameter estimate, and ideallypermit the development of regression models that account for the effect of factorvariation on observer efficiency, thereby improving the accuracy and precision of theabundance estimate.
A principal drawback of the use of radio telemetry in mark-recapture studies is the costlynature of the equipment and the tags themselves, as well as the commitment involved indoing repeated counts, especially if done over a multi-year time period. The cost may bejustifiable in instances where long-term population dynamics monitoring of a fishpopulation is desired, and variability in the observer efficiency of divers (or observers onfoot in certain circumstances) is suspected to be an important component of samplingerror. If relationships of diver observer efficiency to watershed conditions can beconsidered reliable, they can be applied to standard diver counts in future years togenerate calibrated population estimates at a greatly reduced cost relative to annual mark-recapture studies. For example, the annual population census along the mainstem of theSalmo River, which includes virtually all of the habitats used by adult-sized rainbowtrout, can be completed with an effort of only four days for a crew of four divers if annualtagging is not required. The technique of radio telemetry is commonly used in salmonidbehavioural and habitat use studies. With some forethought, these studies may also yieldinformation that is required for population census methods, such as the observerefficiency of diver counts, residence time in spawning areas, or population spatialstructure, making their high cost more justifiable.
Conclusions and RecommendationsThis report documents the results of our investigation by radio telemetry of rainbow trouthabitat use of in the mainstem Salmo River. Summer rearing habitat was limited to a fewrelatively large pools where accumulations of fish were observed. Overwintering habitatconsisted of areas of deeper water in association with cover, and was distributed alongthe length of the Salmo mainstem. Movements of radio tagged fish during the spawningperiod suggested that fluvial, mainstem-dwelling rainbow trout are not spatiallysegregated along the length of the Salmo River, and that spawning takes place insidechannels, along the margins of the mainstem, and in the lower reaches of sometributaries. Off-channel areas appear to be important to Salmo River rainbow troutduring spring freshet. A channelized section of the mainstem, which had limited areas of

47
deeper water and cover, extending from the town of Salmo downstream to HellroaringCreek was conspicuously avoided by radio tagged trout.
The above observations suggest a close association between the population of largerrainbow trout in the Salmo River and areas of deeper water and cover, and it is evenpossible that this habitat type limits the size of the adult population. Efforts to increaserainbow trout habitat capability in the Salmo River watershed, through habitatcomplexing, may be worth consideration, as a population’s resilience to extinction threatsincreases with increases in carrying capacity (see Nunney and Campbell 1993 for review)provided anthropogenic agents forcing negative population growth rates have beenaddressed. However, the ability of any proposed habitat enhancement to increaserainbow trout habitat capability should be evaluated carefully, which likely would requireadditional study. Thorough monitoring, of course, is essential given the experimentalnature of any such manipulation. The channelized sections of the mainstem may providethe best opportunity to improve the habitat for larger rainbow trout, as a substantial netloss of fish habitat at these locations appears to have occurred.
The mainstem Salmo River adult rainbow trout population is relatively small, ofunknown population growth rate, and isolated demographically from downstream fluvialrainbow trout populations. Special management actions to ensure the population's futureviability and to maintain the quality of the fishery, therefore, may be warranted. Catchand release regulations may be effective at increasing population size (e.g. Oliver 1990).We have previously recommended to MWLAP that this step be taken for a portion of theSalmo River watershed, to be applied on an experimental basis. We recommended acatch-and-release zone that included all of the mainstem downstream of Sheep Creek tothe South Salmo River, which encompassed 65% of the harvestable and adult trout, or anadult population of almost 100 individuals in July 2002 prior to implementing the change(Table 7), and a zone for the remainder of mainstem outside this section where a harvestof one trout >300 mm would be allowed. High quality angling experiences at numerousruns and pools, in locations with and without road access, are possible in both portions ofthe watershed. This recommendation was implemented beginning with the 2003 anglingseason.
We recommend that annual or at least periodic diver counts across all sections identifiedin Table 8 continue, so that the effects of the regulation change can be monitored closely.This is the science-based approach to conservation management recommended by recentauthors (Walters and Hilborn 1976; Lande 1993; Caughley 1994), and that may generateresearch data that is of provincial significance. While a positive response to theregulation change is expected, population declines may signal the need for a basin-widecatch and release regulation. Declines of the adult population to levels approaching 50adult individuals should be considered grounds for complete fishery closure, especiallygiven the unknown genetic and demographic structure of the mainstem populationrelative to tributary populations and to other fluvial rainbow trout populations in the Pendd’Oreille basin.

48
Although diver counts of trout in streams are commonly used to monitor populationstatus, few studies have directly investigated the relationships between diver observerefficiency and watershed physical conditions. The results of the three years’ observerefficiency studies reported on here have suggested that underwater visibility can bereliably used to predict observer efficiency (Figure 10). The overall relationship ofobserver efficiency to underwater visibility, therefore, provides the basis for calibratingfuture diver counts in the watershed without the need for costly annual mark-recapturestudies, meaning that population estimates can be acquired in a highly cost-effectivemanner.
It is worth considering whether it is feasible to investigate potential genetic anddemographic relationships between rainbow trout in the Salmo mainstem and otherlocations, and whether the information would be of value in fishery management in thewatershed. It may be possible to obtain this information from analyses of geneticsamples from tributary or other lower Pend d’Oreille populations for comparison with themainstem Salmo River sample, which has already been analyzed (Taylor 2002). Ahabitat use and life history study directed at the tributary residents would also benefit ourunderstanding of their role in the overall rainbow trout population dynamics of thewatershed, as well as point out potential conservation issues faced by these fish.
One final point of recommendation is for continued community involvement andeducation with regard to fisheries issues in the Salmo River watershed. We feel thatstudent involvement (Appendix I-Plate M) and community education through a postercampaign increased community awareness in general of fisheries issues within thewatershed. A workshop organized in the area to discuss rainbow trout biology andmanagement, and oriented to the community, would also be of great benefit.

49
REFERENCES
Baxter, J. S. 1999. Bull trout studies in the Salmo River watershed: 1998 and 1999.Consultant Report Prepared by Baxter Environmental for BC Hydro, Castlegar,BC.
Baxter, J. S. 2001. Bull trout studies in the Salmo River watershed: 2000. ConsultantReport Prepared by Baxter Environmental for BC Hydro, Castlegar, BC.
Baxter, J. S. 2002. Summary of the third year of bull trout (Salvelinus confluentus) radiotelemetry in the Salmo River watershed. Consultant Report Prepared by BaxterEnvironmental for Columbia-Kootenay Fisheries Renewal Partnership and BCHydro, Cranbrook and Castlegar, BC.
Baxter, J. S. and G. Nellestijn. 2000. Report on non-sportfish abundance and migrationpatterns in the Salmo River. Consultant Report Prepared by BaxterEnvironmental for Columbia-Kootenay Fisheries Renewal Partnership andColumbia Basin Trust, Cranbrook, BC.
Bonneau, J. L., and D. L. Scarnecchia. 1998. Seasonal and diel changes in habitat use byjuvenile bull trout (Salvelinus confluentus) and cutthroat trout (Oncorhynchusclarki) in a mountain stream. Canadian Journal of Zoology 76:783-790.
Boyce, M. S. 1992. Population viability analysis. Annual Reviews in Ecology andSystematics 23:481-506.
Campbell, R. F. and J. H. Neuner. 1985. Seasonal and diurnal shifts in habitat utilizedby resident rainbow trout (Salmo gairdneri) observed in western WashingtonCascade Mountain streams. Pages 39-49 in F. W. Olson, R. G. White, and R. H.Hamre, editors. Symposium on small hydropower and fisheries. AmericanFisheries Society, Western Division and Engineering Section, Bethesda,Maryland.
Caughley, G. 1994. Directions in conservation biology. Journal of Animal Ecology63:215-244.
Decker, A. S. 2003. Salmo River tributary fertilization study: baseline monitoringresults (2001-2002) and implications for the experimental design. Report to BCHydro, Burnaby, B.C.
Duncan, K. W. 1980. On the back-calculation of fish lengths; modifications andextensions to the Fraser-Lee equation. Journal of Fish Biology 16:725-730.
Elliott, J. M. 1987. Population regulation in contrasting populations of trout Salmo truttain two lake district streams. Journal of Animal Ecology 56:83-98.

50
Fausch, K. D., and J. R. White. 1981. Competition between brook trout (Salvelinusfontinalis) and brown trout (Salmo trutta) for positions in a Michigan stream.Canadian Journal of Fisheries and Aquatic Sciences 38:1220-1227.
Griffith, J. S. 1981. Estimation of the age-frequency distribution of stream-dwellingtrout by underwater observation. Progressive Fish Culturist 43:51-52.
Ham, K. D., and T. N. Pearsons. 2000. Can reduced salmonid population abundance bedetected in time to limit management impacts? Canadian Journal of Fisheries andAquatic Sciences 57:17-24.
Hankin, D. G. and G. H. Reeves. 1988. Estimating total fish abundance and total habitatarea in small streams based on visual estimation methods. Canadian Journal ofFisheries and Aquatic Sciences 45:834-844.
Hansen, M. M., R. A. Hynes, V. Loeschcke, and G. Rasmussen. 1995. Assessment ofstocked or wild origin of anadromous brown trout (Salmo trutta) in a Danish riversystem, using mitochondrial DNA RFLP analysis. Molecular Ecology 4:189-198.
Hilborn, R., and M. Mangel. 1997. The Ecological Detective: Confronting Models withData. Princeton University Press, Princeton, New Jersey.
Keenleyside, M. H. A. 1962. Skin-diving observations of Atlantic salmon and brooktrout in the Miramichi River, New Brunswick. Journal of the Fisheries ResearchBoard of Canada 19:625-634.
Korman, J., R.N.M. Ahrens, P.S. Higgins, and C.J. Walters. 2002. Effects of observerefficiency, arrival timing, and survey life on estimates of escapement forsteelhead trout (Oncorhynchus mykiss) derived from repeat mark-recaptureexperiments. Canadian Journal of Fisheries and Aquatic Sciences 59:1116-1131.
Korman, J., and P. S. Higgins. 1997. Utility of escapement time series data formonitoring the response of salmon populations to habitat alteration. CanadianJournal of Fisheries and Aquatic Sciences 59:1116-1131.
Krajina, V. J. 1959. Bioclimatic zones in British Columbia. University of BritishColumbia Botanical Series 1:1-47.
Lande, R. 1993. Risks of population extinction from demographic and environmentalstochasticity and random catastrophes. American Naturalist 142(6):911-927.
McElhany, P., M.H. Ruckelhaus, M.J. Ford, T.C. Wainwright, and E.P. Bjorkstedt. 2000.Viable salmonid populations and the recovery of evolutionarily significant units.U.S. Dept. Commer., NOAA Tech. Memo. NMFS-NWFSC-42.

51
Moran, P., A.M. Pendras, E. Garcia-Vazquez, and J.T. Izquierdo. 1994. Electrophoreticassessment of the contribution of transplanted Scottish Atlantic salmon (Salmosalar) to the Esva River (northern Spain). Canadian Journal of Fisheries andAquatic Sciences 51:248-252.
Mullner, S. A. and W. A. Hubert. 1998. Snorkeling as an alternative to depletionelectrofishing for estimating abundance and length-class frequencies of trout insmall streams. North American Journal of Fisheries Management 18:947-953.
Nunney, L., and K. A. Campbell. 1993. Assessing minimum viable population size:demography meets population genetics. Trends in Ecology and Evolution 8:234-239.
Northcote, T. G. 1981. Juvenile current response, growth, and maturity of above andbelow waterfall stocks of rainbow trout, Salmo gairdneri. Journal of Fish Biology18:741-751.
Northcote, T. G., and D. W. Wilkie. 1963. Underwater census of stream fishpopulations. Transactions of the American Fisheries Society 92(2):146-151.
Oliver, G. G. 1990. An evaluation of special angling regulations for cutthroat trout inthe lower St. Mary River. BC Fisheries Management Report No. 97.
Prince, A., and C. Powell. 2000. Clove oil as an anaesthetic for invasive procedures onadult rainbow trout. North American Journal of Fisheries Management 20:1029-1032.
Rice, W. R. 1989. Analyzing tables of statistical tests. Evolution 43:223-225.
Robson, D. S., and H. A. Regier. 1964. Sample size in Petersen mark-recaptureexperiments. Transactions of the American Fisheries Society 93:215-226.
Roni, P., and A. Fayram. 2000. Estimating winter salmonid abundance in small westernWashington streams: a comparison of three techniques. North American Journalof Fisheries Management 20:683-692.
Schill, D. J. and J. S. Griffith. 1984. Use of underwater observations to estimate cutthroattrout abundance in the Yellowstone River. North American Journal of FisheriesManagement 4:479-487.
Scott, W. B., and E. J. Crossman. 1973. Freshwater fishes of Canada. Bulletin 184,Fisheries Research Board of Canada, Ottawa.
Simberloff, D. S. 1988. The contribution of population and community biology toconservation science. Annual Reviews in Ecology and Systematics 19:473-511.

52
Slaney, P. A., and A. D. Martin. 1987. Accuracy of underwater census of troutpopulations in a large stream in British Columbia. North American Journal ofFisheries Management 7:117-122.
Tabachnick, B. G., and L. S. Fidell. 2001. Using Multivariate Statistics. Allyn andBacon, Needham Heights, MA.
Taylor, E. B. 2002. An assessment of the origins of wild-spawning rainbow trout(Oncorhynchus mykiss) in the mainstem Columbia River near Castlegar, BC,using microsatellite DNA. Report to the Columbia-Kootenay Fisheries RenewalPartnership by Department of Zoology and Native Fish Research Group.
Thompson, W. L. 2003. Hankin and Reeves’ approach to estimating fish abundance insmall streams: limitations and alternatives. Transactions of the AmericanFisheries Society 132:69-75.
Walters, C. J., and R. Hilborn. 1976. Adaptive control of fishing systems. Journal of theFisheries Research Board of Canada 33:145-159.
Young, R. G., and J. W. Hayes. 2001. Assessing the accuracy of drift-dive estimates ofbrown trout (Salmo trutta) abundance in two New Zealand rivers: a mark-resighting study. New Zealand Journal of Marine and Freshwater Research35:269-275.
Zar, J. H. 1996. Biostatistical analysis. Prentice Hall, Upper Saddle River, N.J.
Zubik, R. J., and Fraley, J. J. 1988. Comparison of snorkel and mark-recapture estimatesfor trout populations in large streams. North American Journal of FisheriesManagement 8:58-62.

53
Appendix I – Photographic Plates
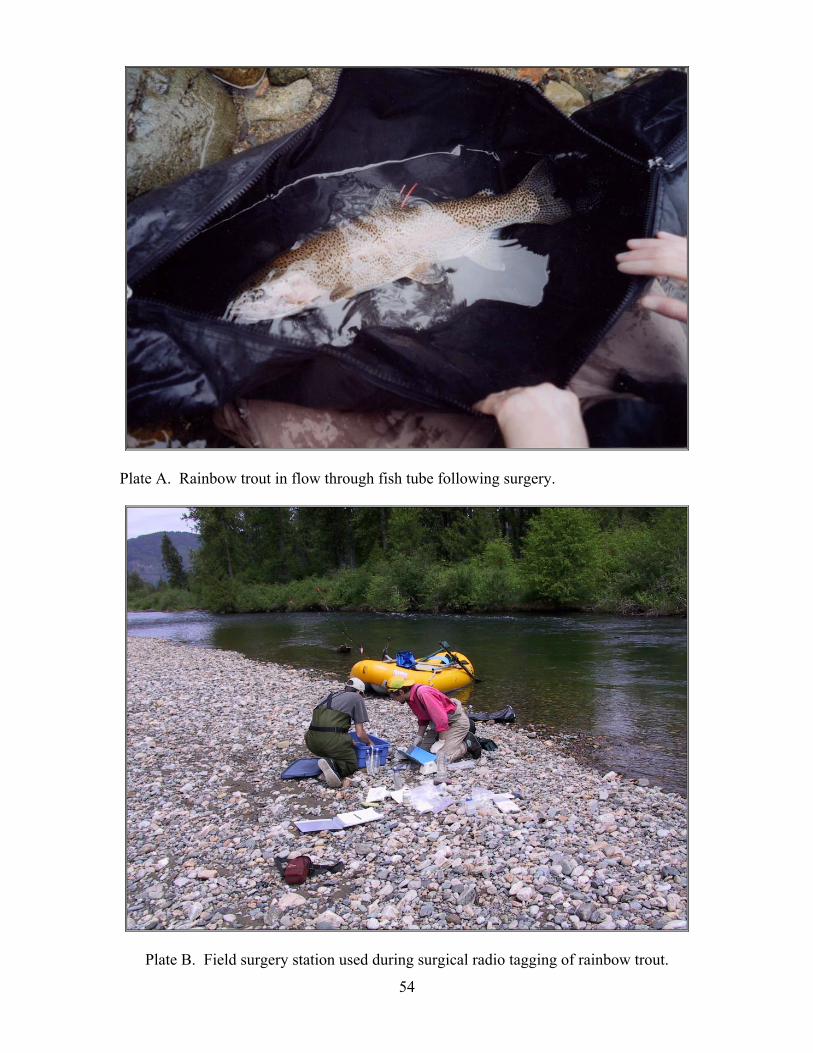
54
Plate A. Rainbow trout in flow through fish tube following surgery.
Plate B. Field surgery station used during surgical radio tagging of rainbow trout.

55
Plate C. Anaesthetized rainbow trout on V-trough prior to incision, and irrigation ofgills.
Plate D. Incision made into abdominal cavity through body wall of rainbow trout prior toinsertion of radio tag.

56
Plate E. Sutures being used to close incision after radio tag is inserted into abdominalcavity of rainbow trout.
Plate F. Suture placed on antennae to prevent movement and irritation at exit point.

57
Plate G. Pool used for overwintering by rainbow trout in the Salmo River.
Plate H. Pool used for overwintering by rainbow trout in the Salmo River.

58
Plate I. Rainbow trout redd location in side channel of Salmo River.
Plate J. Rainbow trout redd location in side channel of Salmo River.

59
Plate K. Off-channel habitat used by rainbow trout in high flow of May 2002.
Plate L. Off-channel habitat used by rainbow trout in high flow of May 2002.

60
Plate M. Students observing a radio tag implant into a rainbow trout.

61
Appendix II – 2001-2003 Salmo River Rainbow Trout Capture Data

62
Fish No. Frequency Code Date RiverKm
Length(mm)
Girth(mm)
Mass(g)
Sex Scales DNA Floy Tag 1 Floy Tag 2 Maturity
A 380 9 06-06-2001 20.2 540 280 1700 F A A 6401 6402 KeltB 06-06-2001 19.1 415 230 800 F B B ?C 420 4 06-06-2001 19 445 240 1000 F C C 6403 6404 KeltD 780 2 06-06-2001 15.5 475 245 1125 F D D 6405 6406 KeltE 380 2 06-06-2001 15.5 450 210 800 M E E 6407 6408 ?F 780 5 06-08-2001 40.5 450 230 1000 F F F 6449 6450G 780 10 06-08-2001 39.9 470 230 1100 M G G 6410 6411 KeltH 420 1 06-12-2001 32.3 570 275 1800 F H H 6391 6392 ?I 06-12-2001 24.4 245 ? I IMM.J 06-20-2001 23.9 310 F J IMM.K 420 8 06-20-2001 23.5 400 195 600 F K K 6357 6358 KeltL 420 9 06-20-2001 23.2 400 200 650 ? L L 6389 6390 Kelt
LO 780 1 09-19-2001 34.6 410 210 725 F LO LO 6301 6302 KeltM 420 10 06-20-2001 22.4 465 215 950 M M M 6359 6388 KeltN 380 5 06-20-2001 20.9 600 290 2100 F N N 6360 6361 KeltO 06-20-2001 20.9 370 180 550 ? O ?P 380 4 06-21-2001 19.9 430 215 750 F P P 6424 6425 KeltQ 06-21-2001 19.9 490 M Q Q ?R 380 6 06-22-2001 5.7 390 200 M R R 6362 6363 KeltU 06-21-2001 18.3 450 M U U ?
SARB-1 420 2 06-01-2001 26.2 465 250 1150 F SARB-1 SARB-1 6351 6352 IMM.SARB-10 420 3 06-12-2001 35.7 360 185 500 F SARB-10 SARB-10 6414 6415 IMM.SARB-11 420 7 06-20-2001 24.4 510 265 1450 F SARB-11 SARB-11 6416 6417 ?SARB-12 780 7 06-20-2001 22.9 570 285 2000 F SARB-12 SARB-12 6418 6419 ?SARB-13 780 9 06-20-2001 22.4 510 240 1300 M SARB-13 SARB-13 6420 6421 ?SARB-14 380 8 06-20-2001 20.8 385 200 600 F SARB-14 SARB-14 6422 6423 IMM.SARB-15 380 1 06-21-2001 21.3 490 230 1100 F SARB-15 SARB-15 6386 6387 KeltSARB-16 380 3 06-21-2001 19.4 445 195 700 M SARB-16 SARB-16 6383 6385 KeltSARB-17 06-21-2001 19 435 220 F SARB-17 SARB-17 ?SARB-18 380 10 06-30-2001 15.7 390 175 350 F SARB-18 SARB-18 6381 6382 KeltSARB-2 780 3 06-06-2001 20.1 455 230 1100 F SARB-2 SARB-2 6399 6400 KeltSARB-3 06-06-2001 20.1 275 ? SARB-3 SARB-3 IMM.

63
Fish No. Frequency Code Date RiverKm
Length(mm)
Girth(mm)
Mass(g)
Sex Scales DNA Floy Tag 1 Floy Tag 2 Maturity
SARB-4 380 7 06-06-2001 18.5 480 235 700 F SARB-4 SARB-4 6397 6398 KeltSARB-5 420 6 06-08-2001 20.2 435 225 850 F SARB-5 SARB-5 6395 6396 KeltSARB-6 780 6 06-08-2001 20.1 425 210 750 M SARB-6 SARB-6 6353 6354 KeltSARB-7 780 8 06-08-2001 15.8 445 220 1000 F SARB-7 SARB-7 6355 6356 KeltSARB-8 420 5 06-08-2001 34.6 470 235 F SARB-8 SARB-8 6393 6394 KeltSARB-9 780 4 06-12-2001 35.7 460 235 F SARB-9 SARB-9 6412 6413 IMM.
1 580 10 06-10-2002 20.6 470 230 M 1 No W7851/W7853 W7854/W7855 Kelt2 580 2 06-10-2002 17.8 480 220 F / No W7923/W7922 W7921/W7920 Kelt3 580 4 07-04-2002 25.7 490 260 F / No W7919/W7918 W7917/W7916 Kelt4 580 1 07-04-2002 25.1 430 225 F 4 No W7915/W7914 W7913/W79125 580 3 07-04-2002 23.9 515 255 F 5 No W7911/W7910 W7907/W79086 07-04-2002 25.2 350 180 F 6 No no tags no tags Maturing
JH-1 580 7 07-02-2002 23.8 460 215 F JH-1 No W7950/W7949 W7948/W7947 KeltJH-2 580 9 07-02-2002 20.2 500 255 F JH-2 No W7946/W7945 W7944/W7943 KeltJH-3 580 8 07-04-2002 19.9 380 205 Imm / No no tags no tags ImmatureJH-4 580 5 07-04-2002 19.5 600 280 F / No 6360 6361 Kelt given new radio tagJH-5 580 6 07-05-2002 19.9 460 225 F / No W7935/W7936 W7937/W7938 KeltJH-6 07-02-2002 23.5 255 ? JH-6 No 6419JH-7 07-02-2002 22.9 570 ? / No 6418 Kelt
J1-03 400 12 06-13-2003 17.0 430 230 M No No 952 955 KeltJ2-03 400 18 06-16-2003 22.9 480 240 F No No 956 959 KeltJ3-03 400 11 06-19-2003 22.9 545 F No No 960 96303-01 400 15 06-13-2003 22.3 530 F No No 901/902 903/904 Kelt03-02 580 9 06-17-2003 19.4 500 F No No 905/906 907/908 Kelt03-03 400 16 06-17-2003 19.4 580 27.5 F No No 909/910 911/912 Kelt03-04 400 20 06-18-2003 22.9 540 28 F No No 913/914 915/916 na03-05 400 19 06-18-2003 20.3 545 30 F No No 917/918 919/920 Kelt03-06 400 14 06-18-2003 20.1 475 24 M No No 921/922 923/924 Kelt03-07 400 17 06-20-2003 19.4 440 F No No 925/926 927/928 Kelt03-08 400 13 06-20-2003 18.2 520 F No No 929/930 931/932 Kelt

64
Appendix III – Scale Measurements, Salmo River Rainbow Trout, June2001
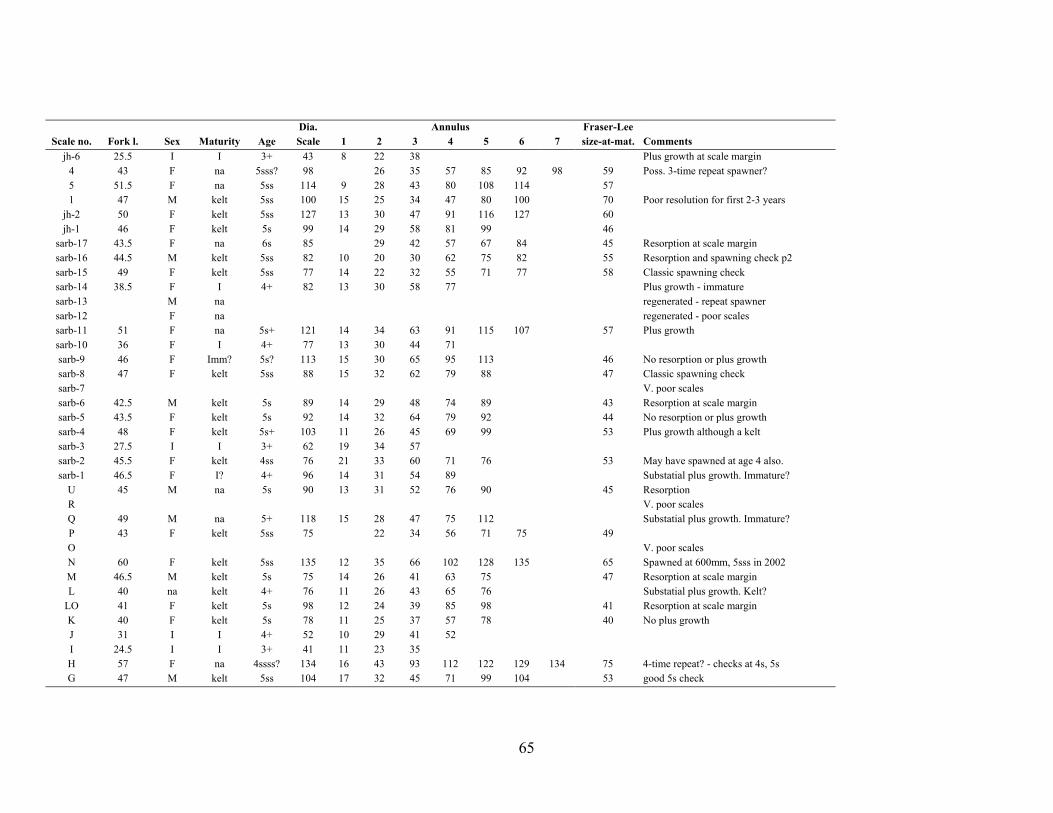
65
Dia. Annulus Fraser-LeeScale no. Fork l. Sex Maturity Age Scale 1 2 3 4 5 6 7 size-at-mat. Comments
jh-6 25.5 I I 3+ 43 8 22 38 Plus growth at scale margin4 43 F na 5sss? 98 26 35 57 85 92 98 59 Poss. 3-time repeat spawner?5 51.5 F na 5ss 114 9 28 43 80 108 114 571 47 M kelt 5ss 100 15 25 34 47 80 100 70 Poor resolution for first 2-3 years
jh-2 50 F kelt 5ss 127 13 30 47 91 116 127 60jh-1 46 F kelt 5s 99 14 29 58 81 99 46
sarb-17 43.5 F na 6s 85 29 42 57 67 84 45 Resorption at scale marginsarb-16 44.5 M kelt 5ss 82 10 20 30 62 75 82 55 Resorption and spawning check p2sarb-15 49 F kelt 5ss 77 14 22 32 55 71 77 58 Classic spawning checksarb-14 38.5 F I 4+ 82 13 30 58 77 Plus growth - immaturesarb-13 M na regenerated - repeat spawnersarb-12 F na regenerated - poor scalessarb-11 51 F na 5s+ 121 14 34 63 91 115 107 57 Plus growthsarb-10 36 F I 4+ 77 13 30 44 71sarb-9 46 F Imm? 5s? 113 15 30 65 95 113 46 No resorption or plus growthsarb-8 47 F kelt 5ss 88 15 32 62 79 88 47 Classic spawning checksarb-7 V. poor scalessarb-6 42.5 M kelt 5s 89 14 29 48 74 89 43 Resorption at scale marginsarb-5 43.5 F kelt 5s 92 14 32 64 79 92 44 No resorption or plus growthsarb-4 48 F kelt 5s+ 103 11 26 45 69 99 53 Plus growth although a keltsarb-3 27.5 I I 3+ 62 19 34 57sarb-2 45.5 F kelt 4ss 76 21 33 60 71 76 53 May have spawned at age 4 also.sarb-1 46.5 F I? 4+ 96 14 31 54 89 Substatial plus growth. Immature?
U 45 M na 5s 90 13 31 52 76 90 45 ResorptionR V. poor scalesQ 49 M na 5+ 118 15 28 47 75 112 Substatial plus growth. Immature?P 43 F kelt 5ss 75 22 34 56 71 75 49O V. poor scalesN 60 F kelt 5ss 135 12 35 66 102 128 135 65 Spawned at 600mm, 5sss in 2002M 46.5 M kelt 5s 75 14 26 41 63 75 47 Resorption at scale marginL 40 na kelt 4+ 76 11 26 43 65 76 Substatial plus growth. Kelt?
LO 41 F kelt 5s 98 12 24 39 85 98 41 Resorption at scale marginK 40 F kelt 5s 78 11 25 37 57 78 40 No plus growthJ 31 I I 4+ 52 10 29 41 52I 24.5 I I 3+ 41 11 23 35H 57 F na 4ssss? 134 16 43 93 112 122 129 134 75 4-time repeat? - checks at 4s, 5sG 47 M kelt 5ss 104 17 32 45 71 99 104 53 good 5s check

66
Dia. Annulus Fraser-LeeScale no. Fork l. Sex Maturity Age Scale 1 2 3 4 5 6 7 size-at-mat. Comments
F 45 F na 5s? 100 14 32 62 87 100 45 No plus growthE 45 M na 5s 91 15 28 41 70 91 45 Resorption at scale marginD regenerated - poor scalesC 44.5 F kelt 4sss 91 15 29 57 78 85 91 62 Based on spawning check at 4s p.2B 41.5 F na 4+ 101 15 39 67 96 Substatial plus growth.Imm?A 54 F kelt 6s 114 16 29 43 78 101 114 54 Resorption at scale margin

67
Appendix IV – Diver Survey Data from the Observer Efficiency StudySection of the Salmo River, 2001-2003

68
Survey Section Observer RB observed Count Count BT EB MW SU NPMdate efficiency 0-20cm 20-30cm 30-40cm 40-50cm 50+cm >30 >4028-Jun-01 upper 0.5 15 14 14 14 0 7 1 0 0 0
lower 0.75 146 50 59 41 7 9 4 47 5total 0.6875 161 64 73 55 7 135 62 16 1 4 47 5
04-Jul-01 upper 0.5 51 32 30 12 3 0 0 0 0 0lower 0.5 236 115 47 23 3 18 12 6 62 0total 0.5 287 147 77 35 6 118 41 18 12 6 62 0
06-Jul-01 upper 0.75 21 25 36 9 5 6 2 0 0 0lower 0.333333 174 110 60 33 4 20 2 4 181 0total 0.4375 195 135 96 42 9 147 51 26 4 4 181 0
16-Jul-01 upper 0.5 150 47 15 13 4 4 5 1 0 1lower 0.375 238 88 54 25 4 6 0 2 169 27total 0.416667 388 135 69 38 8 115 46 10 5 3 169 28
18-Jul-01 upper 1 59 42 33 14 4 1 3 1 0 1lower 0.333333 218 94 59 27 5 0 0 1 180 24total 0.538462 277 136 92 41 9 142 50 1 3 2 180 25
30-Jul-01 upper 0.666667 88 42 27 8 4 2 4 1 0 0lower 0.555556 440 119 66 41 9 8 10 3 135 32total 0.583333 528 161 93 49 13 155 62 10 14 4 135 32

69
Survey Section Observer RB observed Count Countdate Efficiency 0-20cm 20-30cm 30-40cm 40-50cm 50+cm >30 >40 BT<30 BT>30 EBT MW
09-Jul-02 upper 0.25 4 1 0 1 0 1 1 0 6 1 0lower 0.166667 11 13 5 8 1 14 9 0 3 0 1total 0.2 15 14 5 9 1 15 10 0 9 1 1
11-Jul-02 upper 0 9 5 6 5 2 13 7 0 2 0 0lower 0.2 22 9 11 13 1 25 14 1 5 0 0total 0.125 31 14 17 18 3 38 21 1 7 0 0
16-Jul-02 upper 0.333333 63 19 11 2 1 14 3 0 3 8 0lower 0.5 56 31 18 14 4 36 18 1 8 0 0total 0.444444 119 50 29 16 5 50 21 1 11 8 0
18-Jul-02 upper 0.333333 92 37 4 9 1 14 10 0 5 5 0lower 0.666667 184 75 21 17 4 42 21 0 11 7 2total 0.555556 276 112 25 26 5 56 31 0 16 12 2
22-Jul-02 upper 0.666667 110 41 16 8 5 29 13 1 2 16 0lower 1 177 98 27 19 6 52 25 0 5 2 5total 0.875 287 139 43 27 11 81 38 1 7 18 5
30-Jul-02 upper 1 254 90 15 20 2 37 22 0 1 9 0lower 0.6 416 177 42 24 8 74 32 1 4 0 2total 0.75 670 267 57 44 10 111 54 1 5 9 2
01-Aug-02 upper 0.666667 152 72 15 11 2 28 13 0 1 17 0lower 1 189 86 40 31 4 75 35 0 3 0 1total 0.875 341 158 55 42 6 103 48 0 4 17 1

70
Survey Section Observer RB observed Count Countdate efficiency 0-20cm 20-30cm 30-40cm 40-50cm 50+cm >30 >40 BT<30 BT>30 EBT MW
02-Jul-03 upper 19 29 19 5 2 26 7 0 6 0 0lower 21 65 33 14 10 57 24 0 2 0 0total 0.40 40 94 52 19 12 83 31 0 8 0 0
04-Jul-03 upper 9 24 13 11 7 31 18 1 2lower 59 52 28 22 7 57 29 1 14total 0.50 68 76 41 33 14 89 47 2 16 0 0
07-Jul-03 upper 72 37 21 11 6 38 17 0 10 1lower 103 72 33 13 3 49 0 1 7 0 4total 0.50 175 109 54 24 9 86 33 1 17 1 4
10-Jul-03 upper 66 38 18 12 3 33 15 4 6 2lower 102 76 63 28 9 100 37 1 13 7 3total na 168 114 81 40 12 133 52 5 19 9 3
18-Jul-03 upper 55 72 23 7 10 40 17 0 4 0 0lower 236 153 73 38 15 126 53 7 11 4 3total 0.89 291 225 96 45 25 166 70 7 15 4 3