Conservation and management of the Snowy Plover along the Florida Gulf Coast
106
1 CONSERVATION AND MANGEMENT OF THE SNOWY PLOVER ALONG THE FLORIDA GULF COAST: HABITAT SELECTION AND THE CONSEQUENT REPRODUCTIVE PERFORMANCE By RAYA ANN PRUNER A THESIS PRESENTED TO THE GRADUATE SCHOOL OF THE UNIVERSITY OF FLORIDA IN PARTIAL FULFILLMENT OF THE REQUIREMENTS FOR THE DEGREE OF MASTER OF SCIENCE UNIVERSITY OF FLORIDA 2010
Transcript of Conservation and management of the Snowy Plover along the Florida Gulf Coast

1
CONSERVATION AND MANGEMENT OF THE SNOWY PLOVER ALONG THE FLORIDA GULF COAST: HABITAT SELECTION AND THE CONSEQUENT
REPRODUCTIVE PERFORMANCE
By
RAYA ANN PRUNER
A THESIS PRESENTED TO THE GRADUATE SCHOOL OF THE UNIVERSITY OF FLORIDA IN PARTIAL FULFILLMENT
OF THE REQUIREMENTS FOR THE DEGREE OF MASTER OF SCIENCE
UNIVERSITY OF FLORIDA
2010

2
© 2010 Raya Ann Pruner
3
To my Grandma Francis who passed away during this study, but in life inspired me in her passion for birds

4
ACKNOWLEDGMENTS
I am grateful to Marvin Friel for his dedication, support, and assistance to this
project in and out of the field. I thank my two dogs (Mazzy and Snowy) who were
extraordinarily patient and understanding of the long hours I spent in the field. I thank
my family who always encouraged me to follow my passions while stressing the
importance of education. I am indebted to my advisers Steve Johnson and Rob
Fletcher for providing me with this opportunity and for invaluable guidance and input
during this study. I also thank my remaining committee member Debra Miller, for her
interest and guidance particularly in detailing methods for tracking in coastal habitats. I
have had many valuable and interesting discussions with my lab ‘space’ mates in
addition to my fellow graduate students in the WEC department, and I am appreciative
for their assistance and friendship. I am very grateful to Patty Kelly with the U.S. Fish
and Wildlife Service for providing financial support for this study. Thanks also to Rich
Fischer with the Corp of Engineers for additional financial support. I would like to thank
Janell Brush, John Himes, Shea Armstrong, Jeff Gore, and Chris Paxton with the
Florida Fish and Wildlife Conservation Commission (FWC) for providing much needed
equipment and support. I would like to thank the Department of Environmental
Protection (Florida State Parks) staff at both the Northwest regional office and St.
Joseph State Park, particularly Harold Mitchell, Jared Zimmerman, Joe Mitchell, and
Brian Addison. I would like to thank Wendy Jones and the remaining natural resource
staff at Tyndall Air Force Base. Thanks also to the staff at St. Vincent National Wildlife
Refuge for providing access to and from the island for surveys. I am thankful to Steve
Shea and Bill Lynn with the St. Joe Company for allowing me access to their properties.
Barbara Eells, a volunteer with the St. Joe Company, provided invaluable assistance,

5
support and friendship for which I am very grateful. I would also like to thank John
Andrews and Elisa Martinez for assistance with data entry.
6
TABLE OF CONTENTS page
ACKNOWLEDGMENTS .................................................................................................. 4
LIST OF TABLES ............................................................................................................ 9
LIST OF FIGURES ........................................................................................................ 10
ABSTRACT ................................................................................................................... 11
CHAPTER
1 INTRODUCTION .................................................................................................... 12
Coastal Animal Communities - Coastal Habitat ...................................................... 12 Habitat Selection Constraints .................................................................................. 13
Human Activity ................................................................................................. 14 Prey Availability ................................................................................................ 14 Predation .......................................................................................................... 15
Snowy Plover (Charadrius alexandrinus) in Florida ................................................ 16
Project Objectives ................................................................................................... 17
2 THE INFLUENCE OF HUMAN AND PREDATOR ACTIVITY, PREY AVAILABILITY AND PHYSICAL FEATURES OF THE HABITAT ON NEST-SITE SELECTION AND REPRODUCTIVE OUPUT, USING A SUBTROPICAL SHOREBIRD .......................................................................................................... 19
Introduction ............................................................................................................. 19
Methods .................................................................................................................. 23 Study Area ........................................................................................................ 23
Nest Monitoring ................................................................................................ 23 Available Habitat .............................................................................................. 25 Explanatory Variables ...................................................................................... 25
Statistical Analysis .................................................................................................. 28 Nest-Site Selection ........................................................................................... 28 Nest Survival .................................................................................................... 29 Model Selection ................................................................................................ 29
Results .................................................................................................................... 30 Nest-Site Selection ........................................................................................... 30 Nest Survival .................................................................................................... 30
Discussion .............................................................................................................. 31 Human Activity ................................................................................................. 32
Predator Activity ............................................................................................... 33 Physical Features ............................................................................................. 35 Prey Availability ................................................................................................ 37 Conclusions ...................................................................................................... 38
7
3 PREY AVAILABILITY AND PREDATOR ACTIVITY AS PREDICTORS OF SNOWY PLOVER BROOD-REARING SITE SELECTION AND SURVIVAL .......... 49
Introduction ............................................................................................................. 49
Methods .................................................................................................................. 52 Study Area ........................................................................................................ 52 Brood Monitoring .............................................................................................. 53 Explanatory Variables ...................................................................................... 54 Brood-Site Selection ......................................................................................... 57
Brood-Rearing Habitat Use .............................................................................. 58 Statistical Analysis .................................................................................................. 58
Prey Availability ................................................................................................ 58 Brood-Site Selection ......................................................................................... 59
Brood Survival .................................................................................................. 59 Model Selection ................................................................................................ 60
Results .................................................................................................................... 61 Prey Availability ................................................................................................ 61
Brood-Site Selection ......................................................................................... 61 Brood Survival .................................................................................................. 62
Discussion .............................................................................................................. 63
Prey Availability ................................................................................................ 63 Physical Features And Predator Activity .......................................................... 65
Human Activity ................................................................................................. 66 Conclusions ...................................................................................................... 67
4 SYNTHESIS, MANAGEMENT AND RECOMmENDATIONS FOR FUTURE RESEARCH ............................................................................................................ 76
Human Disturbance ................................................................................................ 76
Predator Activity ...................................................................................................... 80 Beyond Productivity ................................................................................................ 81
Winter dispersal And Habitat Requirements ........................................................... 82 APPENDIX
A SPEARMAN’S RANK NON-PARAMETRIC CORRELATION MATRIX FOR VARIABLES INCLUDED IN NEST-SITE SELECTION MODELS ........................... 84
B SPERMAN’S RANK NON-PARAMETRIC CORRELATION MATRIX FOR VARIABLES INCLUDED IN NEST SURVIAL MODELS ......................................... 87
C SPEARMAN’S RANK NON-PARAMETRIC CORRELATION MATRIX FOR VARIABLES INCLUDED IN BROOD-SITE SELECTION MODELS ....................... 90
D SPEARMAN’S RANK NON-PARAMETRIC CORRELATION MATRIX FOR VARIABLES INCLUDED IN BROOD SURVIVAL MODELS ................................... 92

8
LIST OF REFERENCES ............................................................................................... 95
BIOGRAPHICAL SKETCH .......................................................................................... 106

9
LIST OF TABLES
Table page 2-1 Predation descriptions based on predator types present on the beaches in
Florida Panhandle, 2008, 2009........................................................................... 40
2-2 Foraging habitat types of the Gulf Coast of Florida. ........................................... 41
2-3 Explanatory variables considered in the analysis of Snowy Plover Nest-site selection and survival, Gulf Coast of Florida, 2008–2009 ................................... 42
2-4 Nest-Site Selection models based on a priori hypotheses for Snowy Plovers (n= 946) on the Gulf Coast of Florida, 2008, 2009. ............................................ 43
2-5 Number of nest predation events at Snowy Plover nests based on tracking evidence at the nest on the Florida Gulf Coast, 2008, 2009 ............................... 43
2-6 Nest Survival models based on a priori hypotheses for Snowy Plovers (n= 473) on the Gulf Coast of Florida, 2008, 2009 .................................................... 44
2-7 Synthesis of influences: was nest-site selection adaptive or not? ...................... 44
3-1 Brood foraging habitat types of the Gulf Coast of Florida ................................... 69
3-2 Explanatory variables considered in the analysis of Snowy Plover Brood-site selection and survival, Gulf Coast of Florida, 2008–2009 ................................... 70
3-3 Brood-site selection models based on a priori hypotheses for Snowy Plovers (n=451) on the Gulf Coast of Florida, 2008, 2009. ............................................. 71
3-4 Number of chicks present from hatch to fledging by week, rows 1-4 represent week in age of survival. ...................................................................................... 71
3-5 Brood survival models based on a priori hypotheses for Snowy Plovers (n=202) on the Gulf coast of Florida, 2008, 2009. .............................................. 72

10
LIST OF FIGURES
Figure page 2-1 Map of Snowy Plover study sites in the Florida panhandle ................................ 45
2-2 Depiction of predation events by different predator types present on the beaches in the Florida Panhandle ...................................................................... 46
2-3 The probability of Snowy Plover Nest-Site Selection as a function of predictors from the most parsimonious model .................................................... 46
2-4 The probability of Snowy Plovers successfully hatching a nest (26 days incubation) as a function of predictors from the most parsimonious model(s) .... 48
3-1 Predictors influencing invertebrate counts .......................................................... 73
3-2 The probability of Snowy Plover Brood-Site Selection as a function of foraging habitat type based on the most parsimonious model. ........................... 74
3-3 The probability of Snowy Plovers fledgling at least one chick (28 day period) as a function of predictors from the most parsimonious model(s)....................... 75

11
Abstract of Thesis Presented to the Graduate School of the University of Florida in Partial Fulfillment of the
Requirements for the Master of Science
CONSERVATION AND MANGEMENT OF THE SNOWY PLOVER ALONG THE FLORIDA GULF COAST: HABITAT SELECTION AND THE CONSEQUENT
REPRODUCTIVE PERFORMANCE
By
Raya Ann Pruner
May 2010
Chair: Name Steve Johnson Cochair: Robert J Fletcher, Jr. Major: Wildlife Ecology and Conservation
To expand upon the current ecological knowledge of Snowy Plovers, I studied
breeding Snowy Plovers nesting along the Florida panhandle during 2008-09. I
contrasted four alternative hypotheses (prey availability, human activity, predator
activity, and physical features of the habitat) and the influence each had on habitat
selection and reproductive performance during both the nesting and brood-rearing
stages of breeding. I modeled the probability of selection and the daily survival rates as
a function of predictors representing each hypothesis by breeding stage (i.e., nesting,
brood-rearing). Nest-site selection and daily nest survival were a function of all four
hypotheses working in combination. In contrast, brood-site selection was a function of
prey availability alone and daily brood survival was a function of prey availability,
predator activity, and physical features combined. Collectively, this information will
provide for habitat management that will benefit the Snowy Plover. Additionally, my
results provide a unique demonstration of how multiple selective forces influence site
selection and reproductive performance that is relevant to wildlife in general.
12
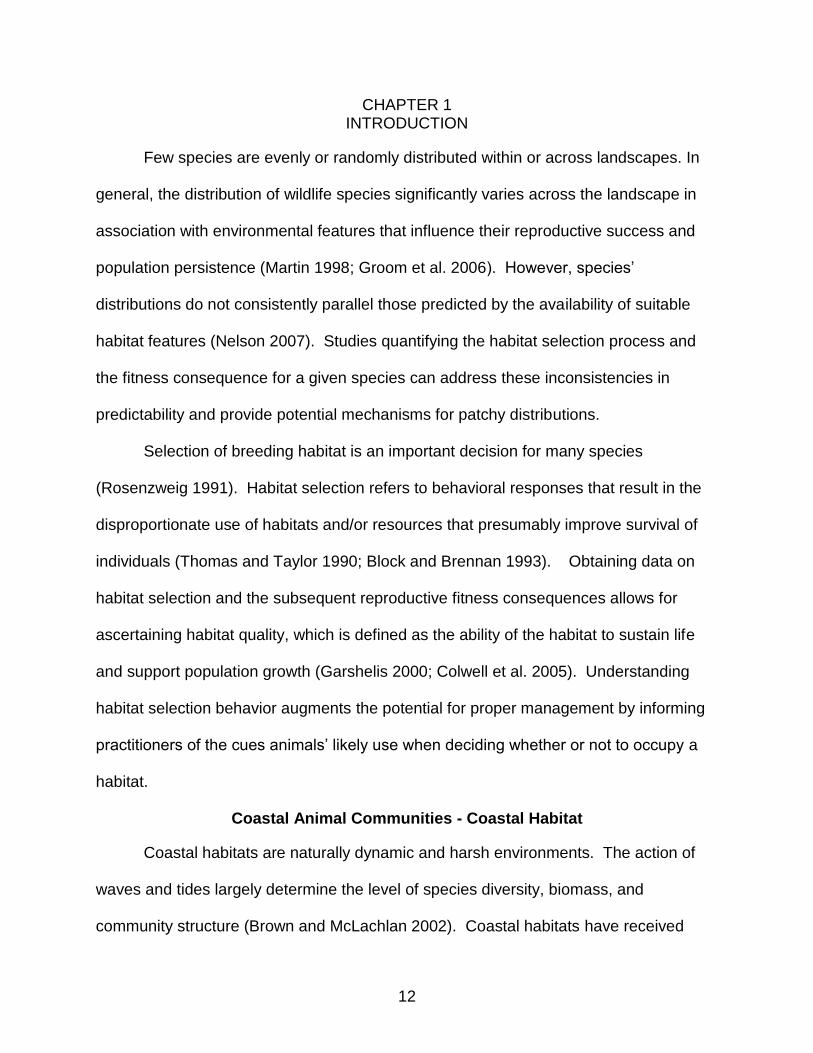
CHAPTER 1 INTRODUCTION
Few species are evenly or randomly distributed within or across landscapes. In
general, the distribution of wildlife species significantly varies across the landscape in
association with environmental features that influence their reproductive success and
population persistence (Martin 1998; Groom et al. 2006). However, species’
distributions do not consistently parallel those predicted by the availability of suitable
habitat features (Nelson 2007). Studies quantifying the habitat selection process and
the fitness consequence for a given species can address these inconsistencies in
predictability and provide potential mechanisms for patchy distributions.
Selection of breeding habitat is an important decision for many species
(Rosenzweig 1991). Habitat selection refers to behavioral responses that result in the
disproportionate use of habitats and/or resources that presumably improve survival of
individuals (Thomas and Taylor 1990; Block and Brennan 1993). Obtaining data on
habitat selection and the subsequent reproductive fitness consequences allows for
ascertaining habitat quality, which is defined as the ability of the habitat to sustain life
and support population growth (Garshelis 2000; Colwell et al. 2005). Understanding
habitat selection behavior augments the potential for proper management by informing
practitioners of the cues animals’ likely use when deciding whether or not to occupy a
habitat.
Coastal Animal Communities - Coastal Habitat
Coastal habitats are naturally dynamic and harsh environments. The action of
waves and tides largely determine the level of species diversity, biomass, and
community structure (Brown and McLachlan 2002). Coastal habitats have received
13
attention world-wide because they appear to be declining on a large spatial scale due to
habitat alteration, recreational use, development and direct disturbance from people and
pets (Chase and Gore 1989; Burger 2000; Lafferty 2001a; Lafferty 2001b). Current
estimates of global population growth predict around 7.1 billion people by 2020 (United
Nations 1998). Of the 7.1 billion people, 75% are predicted to live within 60 km of the
coast (Roberts and Hawkins 1999), leading to increases in direct pressures to coastal
environments and coastal-dependent species (Burger 2000). The greatest threat to
coastal habitats is the serious erosion issues associated with human structures and
activities that disrupt the transport of sand (Brown and McLachlan 2002). In Florida
alone, 700 km of shoreline are threatened by severe erosion as a result of jetties,
groins, and seawalls used to protect coastal development (Finkl 1996). Most often
these structures are built to protect developed lands from the effects of storms (i.e.
hurricanes) (Brown and McLachlan 2002), but they may also prevent the natural
accretion of sand.
Habitat Selection Constraints
Recently, researchers and public land managers are interested in the influences
related to rising sea-levels and anthropogenic alteration on the habitat selection
process. Both have the potential to contribute to habitat loss to wildlife (Brown and
McLachlan 2002), changes in predator communities including mesopredator release
(Groom et al. 2006), and changes in foraging availability (Crooks 2004). All these
effects can have dramatic consequences for population dynamics. In particular, these
impacts could influence the habitat selection process in a number of ways, including
altering the availability of habitat for individuals to chose from, influencing behavioral
14
decision-rules animals use during habitat selection, or by altering the fitness
consequences of habitat selection (e.g., Robertson and Hutto 2006).
Human Activity
Habitat alteration and loss of habitat has intensified the spatial overlap between
wildlife and humans (Weston and Elgar 2007). An increase in human-wildlife contact
alters use patterns within the landscape by excluding individuals from potential habitat
(Gill et al. 2001; Stillman 2003). Consequently, recreational activities are a central
cause of population declines in many species listed as federally threatened or
endangered (Czech et al. 2000). For example, tourism has resulted in increased
recreational pressures on coastal habitats and has contributed to global declines in
coastal-dependent species, particularly shorebirds (Burger 2000; Gill et al. 2001; Lord et
al. 2001; Ruhlen et al. 2003; Yasue and Dearden 2006a). Habitats that appear to be
intact can lose value to wildlife when human activities interfere with behaviors such as
foraging (Lord et al. 1997), roosting (Lafferty et al. 2006), and breeding (Yasue and
Dearden 2006a). Interests in the effects of human disturbance has increased in recent
years (Burger 2000; Gill et al. 2001; Lord et al. 2001; Ruhlen et al. 2003, Lafferty et al.
2006; McCrary and Pierson 2006; Yasue and Dearden 2006a) and have produced an
array of contrasting conclusions and as a result our knowledge of impacts to wildlife
associated with human disturbance are limited.
Prey Availability
For most species food availability is arguably the single most important
determinant for patterns of selection and species occurrences in natural communities
(Frederick et al. 1996; Granadeiro et al. 2004) due to energy requirements associated
with both reproduction and survival (Schekkerman and Visser 2001). Consequently,

15
changes in prey abundance have the ability to alter usage patterns as well as species
settlement patterns within landscapes (Evans and Dugan 1984; Goss-Custard 1984).
These patterns are particularly important for species with precocial young (e.g.
shorebirds, waterfowl). Precocial offspring must have access to a reliable food supply
because the collection of necessary food is shifted to the chick (Schekkerman and
Visser 2001). Thus, food requirements likely influence both nest and brood foraging-
site selection for precocial species. In fact, research on coastal invertebrates in relation
to shorebird habitat use suggests that it is possible for prey abundance to be high
enough to compensate for negative human impacts (Gill et al. 2001; Smith and Faillace
2006; Finn et al. 2007).
Predation
Avian species are generally vulnerable to predation (Martin 1995). In fact,
chronically low reproductive rates have been identified as a major cause for population
declines for many avian species (Martin 1998; Colwell et al. 2005). Many avian species
are influenced by density dependent predation (Schmidt and Whelan 1999).
Consequently the maintenance of low nesting density is an important anti-predator
adaptation for many bird species (Page et al. 1983). However, habitat loss has the
potential to increase conspecific nest density resulting in increased predation pressures
(Himes et al. 2007). In addition to potential impacts due to density-dependence,
predation pressure may increase due to mesopredators associated with human activity,
particularly in relation to garbage (Lafferty 2001a; Groom et al. 2006). Thus, it is
essential to determine predation rates and identify the types of predators that might be
influencing nest success and recruitment.
16
Snowy Plover (Charadrius alexandrinus) in Florida
The Snowy Plover is one of the most imperiled bird species in the U.S. due to its
patchy distribution and wide-spread loss of habitat (Gorman and Haig 2002; Funk et al.
2007). Although controversial (Gorman and Haig 2002; Funk et al. 2007), at least six
morphologically distinct subspecies are recognized (O’Brien et al. 2006), two of which
occur in North America. The Western Snowy Plover (C. a. nivosus) has migratory and
non-migratory populations west of the Rocky Mountains. The Cuban Snowy Plover (C.
a. tenuirostris) has migratory and non-migratory populations on the Gulf Coast of the
U.S. from Louisiana east to Florida, and in the West Indies (Bennett and Wallace 2001).
The Florida Fish and Wildlife Conservation Commission (FWC) has conducted three
state-wide surveys over the past 21 years: 1989 (Chase and Gore 1989), 2002
(Lamonte et al. 2006), and 2006 (Himes et al. 2007). The most recent study
documented 177 breeding pairs in Northwest Florida and 45 breeding pairs in
Southwest Florida (Himes et al. 2007).
The Snowy Plover population in Florida is particularly vulnerable since it is
restricted to barrier islands and a few coastal mainland beaches along the Gulf Coast,
and it presumably functions as a demographically closed population (Funk et al. 2007).
Threats to the Snowy Plover population in Florida include development of beachfront
property, disturbance by people and pets, high predation rates, and habitat loss or
degradation due to coastal engineering activities (Chase and Gore 1989; Gore 1996;
Lamonte et al. 2006; Himes et al. 2007). Furthermore, the Snowy Plover breeding
season begins in mid-February and lasts until the end of August, which overlaps with
the tourism season (Chase and Gore 1989; Lamonte et al. 2006; Himes et al. 2007).
Due to these threats, the Snowy Plover is listed as Threatened by the FWC (Florida

17
Administrative Code 68A-27.004) and as Endangered by the Florida Committee on
Rare and Endangered Plants and Animals (Gore 1996). Additionally, Charadrius a.
tenuirostris is currently considered a Candidate Species by the USFWS under the
Endangered Species Act. Yet because of the lack of historic data on the Florida
population, the demographic response to either habitat loss or alteration has not been
documented.
The main predators observed during previous Snowy Plover surveys in Florida,
included coyotes (Canis latrans), raccoons (Procyon lotor), and ghost crabs (Ocypode
quadrata) (Himes et al. 2007). Ghost crabs have also been observed directly predating
upon Snowy Plover chicks (B. Eells, pers. comm.). In addition, fish crows (Corvus
ossifragus) and laughing gulls (Leucophaeus atricilla) were observed taking Snowy
Plover eggs (pers. Obs.) and chicks (B. Eells pers. comm.).
Project Objectives
Although many studies have demonstrated population declines due to predation
(Page et al. 1983), others have demonstrated changes in habitat use and breeding
success as a result of human disturbance (Burger and Gochfeld 1991; Ruhlen et al.
2003; Yasue and Dearden 2006a). However, most studies have examined disturbance
in isolation from other ecological factors (Yasue and Dearden 2006a). Thus, there is a
need to incorporate variables related to habitat use and selection including human
disturbance, alteration of habitats, environmental factors, and potential predation (Gill et
al. 2001; Stillman and Goss-Custard 2002; Yasue 2005). This allows for more accurate
assessment of human disturbance and ecological factors that may affect breeding
success (Frid and Dill 2002; Yasue 2005). In addition, the precocial life history of plover
offspring necessitates not only understanding nest-site selection and success, but also
18
the requirements of Snowy Plover broods. Given the high energy demands and high
mortality of most shorebird chicks to either starvation or exposure (Pearce-Higgens and
Yalden 2004), it is likely that habitat selection and diet are critical for their survival.
This study specifically focuses on identifying potential impacts to the Snowy Plover
population with the goal of guiding management for the conservation of this species.
Additionally, knowledge of the effects of anthropogenic alteration and the reproductive
consequences lags far behind the growing global problem, yet such knowledge is
essential for mitigating possible long-term effects.
19
CHAPTER 2 THE INFLUENCE OF HUMAN AND PREDATOR ACTIVITY, PREY AVAILABILITY AND PHYSICAL FEATURES OF THE HABITAT ON NEST-SITE SELECTION AND
REPRODUCTIVE OUPUT, USING A SUBTROPICAL SHOREBIRD
Introduction
Habitat selection is fundamentally important to numerous issues in ecology and
conservation (Martin 1998; Groom et al. 2006). Habitat selection refers to behavioral
responses that result in the disproportionate use of habitats and/or resources that
presumably improve survival and fitness of individuals (Thomas and Taylor 1990; Block
and Brennan 1993). For example, in avian species the choice of nest site may
determine the probability that predators will discover the offspring (Martin 1998). In
selecting habitat, animals respond to environmental cues, which are environmental
features that animals can observe at the time of choice (Williams and Nichols 1984).
Potential influential cues include foraging sites, nesting sites, favorable microclimates,
and places to avoid predators or competitors (Steele 1993). Understanding habitat
selection behavior augments the potential for proper management by informing
practitioners of the cues animals likely use when deciding whether or not to occupy a
habitat.
While investigations on habitat selection have long focused on food, predators,
and habitat features, the effects of anthropogenic disturbance are of increasing interest
due to rapid growth of the human population. An increase in human-wildlife contact can
alter use-patterns within the landscape by excluding individuals from locations that
provide potential foraging (Gill et al. 2001; Stillman 2003) or breeding (Yasue and
Dearden 2006a). Consequently, recreational activities are a central cause of population
declines in many species listed as federally threatened or endangered (Czech et al.

20
2000). Anthropogenic disturbance can influence the habitat selection process in a
number of ways, including altering the availability of habitat for individuals to choose
from, influencing behavioral decision-rules animals’ use during habitat selection, or by
altering the fitness consequences of habitat selection (e.g., Robertson and Hutto 2006).
Nonetheless, anthropogenic disturbance can sometimes be a poor predictor of a
given species presence and/or density (Gill et al. 2001; Yasue 2006; Finn et al. 2007).
For example, some species settle in areas of high human disturbance, which is thought
to be driven by prey abundance being high enough to compensate for negative impacts
of human disturbance (Gill et al. 2001; Smith and Faillace 2006; Finn et al. 2007).
Other factors thought to alter habitat selection include food, habitat physiognomy,
and predators. Food availability is an important determinant for patterns of selection and
species occurrences in natural communities (Frederick et al. 1996; Granadeiro et al.
2004) due to energy requirements associated with both reproduction and survival
(Schekkerman and Visser 2001). Not only does food availability have the potential to
influence the spacing of individuals across the landscape (Goss-Custard 1984) , but
variation in prey availability may influence the abundance of individuals at a more
localized level (Evans and Dugan 1984).
Habitat physiognomy or the purely physical features of the nest-site (e.g., canopy
cover, tree height, etc.) are an additional potential determinate of breeding success for
most bird species (Dunning et al. 1992; Block and Brennan 1993). In particular,
physical features at the nest-site may have direct consequences by affecting the
probability of nest predation (Steele 1993; Budnik et al. 2002) or through providing an
advantageous microclimate. Because different predators use different search tactics,
21
physical features of the nest-site and the benefits provided likely depend upon the local
predator community (Martin 1987; Soderstrom et al. 1998).
For avian species, predation is typically considered as a primary cause of failure
(Ricklefs 1969; Chalfoun et al. 2002). High predation rates have been linked to the local
abundance of predator species (Potts 1980; Angelstam 1986) and to high conspecific
nest density (Page et al. 1983). Additionally, the influence of predator communities and
abundance has the ability to influence prey use within a given habitat (Martin 1987).
However, in efforts to understand the role of predation, many researchers focus on only
physical habitat features associated with successful reproduction (e.g. Martin 1998;
Powell and Collier 2000; Hood 2006) without knowledge of specific causes for failure.
To predict patterns of predation and assess their effects on communities, it is crucial to
link observed patterns of nest predation with identification of the most important nest
predator species (Soderstrom et al. 1998; Chalfoun and Martin 2009). Knowledge of
which predators our causing nest predation and their related foraging strategies within
the environment is limited (Ricklefs 1989), largely because predation is typically
impossible to measure in most systems in a meaningful way. Through the use of
cameras at nests, researchers are making strides in understanding the role of predators
(e.g., Bolton et al. 2007). However, the use of cameras is not always feasible, usage
may impact nest survival indirectly, and sample size is often limited.
There is a need to incorporate multiple predictors related to habitat use and
selection, such as the impacts of human disturbance, prey availability, and potential
predation in addition to the physical features associated with the habitat (Gill et al. 2001;
Stillman and Goss-Custard 2002; Yasue 2005). Such integration would allow for a
22
more robust and accurate assessment of human disturbance and other ecological
factors that may impact species-habitat relationships (Frid and Dill 2002; Yasue 2005).
Shorebirds breeding on coastal habitats provide an excellent system to address
multiple hypotheses of nest-site selection. Coastal beach habitats, such as the Florida
gulf coast, are rapidly declining due to habitat alteration, recreational use, and
development (Chase and Gore 1989; Burger 2000; Lafferty 2001a; Lafferty 2001b).
With direct pressures related to human disturbance these beaches provides a unique
setting for testing the relative role of human disturbance. Moreover, with the presence
of a sand dominated environment, the Florida gulf beaches provide a rare opportunity
for testing multiple hypotheses through the use of tracking human and predator activity
in the sand that surround shorebird nests.
I investigated alternative hypotheses for nest-site selection and subsequent
reproductive success in the Snowy Plover (Charadrius alexandrines), a small shorebird
that in Florida, nests primarily on non-developed barrier island beaches located along
the Gulf Coast. The Florida plover population is listed as state threatened, as
Endangered by the Florida Committee on Rare and Endangered Plants and Animals
(Gore 1996), and recent surveys have documented low state-wide population estimates
(n=222; Himes et al. 2007). For Snowy Plover nest-site selection and the consequent
nest survival I contrasted four a priori hypotheses: 1) nest-site selection and survival are
determined by predator activity, 2) nest-site selection and survival are determined by
human activity, 3) nest-site selection and survival are determined by prey availability,
and 4) nest-site selection and survival are determined by physical features of the
habitat. Because habitat selection is thought to be adaptive (Clark and Shutler 1999), I
23
predicted for both nest-site selection and nest survival in order of expected influence
that (1) predator activity would have a negative influence, (2) human activity would have
a negative influence, (3) prey availability would have a positive influence, and (4)
physical features would have mixed and minor influences (e.g., features that provided
camouflage would have a positive influence and those that conceal visibility of potential
predators would have a negative influence).
Methods
Study Area
I collected data at seven sites located contiguously in Franklin, Gulf and Bay
Counties, in the panhandle of Florida, comprising 67.0 km of beach habitat (Fig 2-1.).
Sites included were Shell Island (5.2 km; St. Andrews State Park, 7.3 km; Tyndall Air
Force Base [TAFB]), Crooked Island East, West, & Buck Beach (23.7 km; TAFB),
Windmark Beach (5.2 km; St. Joe Company), St. Joseph’s State Park (13 km), and St.
Vincent National Wildlife Refuge (12.6 km). All sites are barrier Islands located along
the Gulf Coast, except Windmark Beach and Buck Beach, which are mainland beaches.
Most of my sites were on public land, with the exception of Windmark Beach and
portions of Crooked Island East. Collectively these seven sites represent the largest
intact portion of coastal beach habitat in Florida and the Florida Snowy Plover
population (41%; Himes et al. 2007).
Nest Monitoring
I conducted nesting surveys every 5-7 days between February and August of 2008
and 2009, and I searched for nests systematically in all suitable breeding habitats at
each site. With an assistant, I conducted all nest searching using a leapfrog method,
with one person walking the nesting habitat and a second person using an all terrain

24
vehicle (ATV) on the shoreline (Himes et al. 2007; Lauten et al. 2007)). Once Snowy
Plovers were located, I determined if they were exhibiting breeding behavior. For
nesting pairs (birds actively defending scrapes with eggs), I watched from a distance for
them to return to their nest or I located the nest by following Snowy Plover tracks back
to nests. For territorial pairs, (birds defending an area, but without nests containing
eggs), I searched for nest scrapes and documented them for future investigations.
After nests were located, I recorded their position with a global positioning unit. If
nests were located with a full clutch, I used egg floatation to detect embryo mortality and
to estimate hatch dates (see Hood 2006 for age estimates). For this study, I assumed
an estimated egg-laying length of 4 days and incubation length of 26 days, which is
normal for Snowy Plovers nesting in Florida (Chase and Gore 1989). Snowy Plovers do
not begin incubating until the third egg in the clutch is laid (Page et al. 2009). Therefore,
estimating hatch-date via floatation was only possible with full clutches. For incomplete
clutches I estimated hatch-day by adding potential lay-days. I monitored nests every 5-
7 days until cessation (i.e., eggs hatch or fail). I also visited all nests on the estimated
hatch day and confirmed nests to have hatched if young were located in or near the
nest site. If eggs disappeared too early to have hatched and no physical evidence (i.e.,
trampling, inundation, etc.) was present, I considered the nest to be depredated and
looked for predator tracks at the nest site and/or egg shell evidence (Table 2-1; see
Mabee 1997).
I incorporated all nests located during either breeding season in analyses,
including re-nesting efforts. Snowy Plovers follow a serial polygamous mating system
(Page et al. 2009). Typically, after a successful hatch, females abandon the brood and
25
locate a new mate (Warriner et al. 1986; Paton 1995; Fraga and Amat 1996). Males
after successfully fledging or losing a brood will locate a new mate (Page et al. 2009).
As a result, between nesting events within a breeding season, nests are rarely between
the same two individuals.
Available Habitat
To sample habitat availability I used a stratified random sampling method
throughout each site. I generated random points with ArcGIS 9.2 by creating polygons
of potential nesting habitat based on aerial photographs and personal knowledge of the
area. I identified potential nesting habitat as the sandy beach habitat located between
the shoreline and tree-line or dense vegetation, incorporating much of the sand dunes
(see Himes et al. 2007). Within potential nesting habitat, I overlaid a grid system (100
m x 100 m) and ran a random point generator (Hawth’s tools extension for ArcGIS) to
select points within each grid. I collected habitat data at one random point for each nest
located.
Explanatory Variables
I analyzed four groups of explanatory variables that might influence selection and
survival during the nesting stage: physical features, human activity, prey availability, and
predator activity. To do so, I collected measurements at both nest and random point
locations using three spatial scales: nest-site (1 m radius), nest-territory (100 m radius),
and landscape scale (500 m radius).
In previous studies on Snowy Plovers, various habitat physical features have been
found to influence both selection and survival at local scales (e.g., surrounding nest
sites). In particular, plover nest survival is thought to depend upon the ability to detect
approaching predators (Powell 2001; Hood 2006). Consequently, I predicted a negative

26
effect of increased vegetative cover and with proximity to dunes. I also predicted shell
and organic debris in and around the nest to positively influence nest survival by
providing camouflage (while still allowing visibility of approaching predators). To test
these predictions, I visually quantified the percent ground cover of vegetation, bare
sand, and debris at the nest-site scale within a 1 m radius. At the nest-territory scale I
used a distance to object design (Williams et al. 2002), measuring the distance to
vegetation, primary dune, dune height, and the distance to nearest conspicuous debris.
To test for the influence of human activity I collected data at both the nest-territory
and landscape scales. Because studies have shown reproductive performance to
increase with protection of habitat from human disturbance (Lafferty et al. 2006), I
predicted a positive influence to nest selection and nest survival with the use of
symbolic fencing and with increased distance from beach access points. Symbolic
fencing is composed of signs and ropes and is often used by managers to protect
nesting areas from human disturbance (see Lafferty 2001a). Although not legally
enforced in many areas in Florida (Himes et al. 2007) it is considered symbolic through
encouraging people to stay out of nesting areas. Within the nest-territory I documented
the presence/absence of beach access points, distance to nearest human foot print,
and presence/absence of symbolic fencing within a 100 m radius. At the landscape
scale, I systematically sampled human activity, predicting nest-site selection and
survival to decrease as human density increased. To investigate the spatial variation in
human disturbance potentially affecting nest-site selection and nest success, I
quantified human density with beach foot traffic. I set up strip transects by raking 50 m
long x 2 m wide sand transects running perpendicular from the shoreline to the primary
27
dune line. Transects were set-up over the weekend to capture maximum beach activity
levels. To investigate temporal variation, I conducted sampling twice during both
breeding seasons. The first sampling occasion took place during the months of March
and April and the second sampling took place during June and July.
To test for the influence of prey availability, I collected data at both the nest-
territory and landscape scales. I categorized foraging habitat into three foraging types
(ephemeral pools, bay flats, and gulf front; Table 2-2). Broods with easy access to
foraging locations tend to have higher survival rates (Loegering and Fraser 1995);
therefore, I predicted plovers would select nest sites in close proximity to high prey
foraging locations. Adults nesting closer to foraging habitat likely benefit through nest
attentiveness (Yasue and Dearden 2006b); therefore, I predicted prey availability to
positively influence nest survival. To test these predictions, within the nest-territory I
measured the distance from the nest to the nearest foraging habitat and identified the
type of the nearest foraging habitat within a 100 m radius. At the landscape scale, I
used a 500 m x 500 m grid and categorized each grid by the presence of foraging
habitat types. I classified grids as ephemeral or bay flats if one of these habitat types
were present. If neither of these two foraging habitats were present, I classified the grid
as shoreline foraging habitat.
To test the influence of predator activity, I collected data at both the nest-territory
and landscape scales. Avian predators, such as fish crows (Corvus ossifragus) are
often associated with forest patches. The forest patches located at these sites are
composed primarily of slash pine (Pinus elliottii). Therefore, I recorded the
presence/absence of the sand pine forest edge within a 100 m radius. Previous studies
28
have suggested that ghost crabs depredate plover nests (Watts and Bradshaw 1995;
Himes et al. 2007). Thus, I measured to the nearest ghost crab burrow from the nest.
Beyond the perceived predator threat, I was interested in how the change in predator
activity levels impacted selection and survival based on predictions that selection and
survival would decrease in response to increased predator densities. Therefore, at the
landscape scale I systematically sampled predator activity through tracking. Tracking
animals by following footprints in substrates such as sand is probably the oldest known
and most efficient method of identifying mammal presence in an area (Bider 1968;
Silveira et al. 2003). I set up strip transects by raking 50 m long x 2 m wide sand
transects running perpendicular from the shoreline to the primary dune line. I sampled
transects once after a two-day period. Per transect, I counted the number of ghost crab
burrows present, the number of observed predator tracks to account for other predator
species (e.g., coyotes, raccoons, etc.), and the number of avian predators observed in
the area (e.g., fish crows). To investigate potential temporal variation, I sampled
transects twice during both breeding seasons. The first sampling occasion took place
during the months of March and April and the second sampling took place during June
and July.
Statistical Analysis
Nest-Site Selection
To model nest-site selection, I used logistic regression to model the probability of
nest-site selection as a function of the variables collected at all spatial scales that
represented the a priori hypotheses. The response variable was whether habitat was
used (i.e. with the presence of a nest) or available. I used the Generalized Linear
29
Model (GLM) procedure within R (2008) to estimate regression coefficients with the
logistic models.
Nest Survival
To estimate nest survival, I used the logistic-exposure method which accounts for
variation in exposure days among nest visits (Shaffer 2004). I used the GLM procedure
within R (2008) to estimate regression coefficients in the logistic-exposure models.
Using this method, I estimated daily nest survival rates from the resulting logistic
function (Shaffer 2004). I used the effective sample size (n; Rotella et al. 2004) when
analyzing model fit (i.e., n = total number of days that nests were known to survive + the
total number of intervals in which a failure occurred). The response variable was
whether or not the nest survived the interval between visits.
Model Selection
Because I had many predictor variables (Table 2-3), I used a Spearman’s non-
parametric correlation matrix to check for potential multi-collinearity (Appendices A & B).
After confirming that no variables were strongly correlated (r > |0.6|), I selected the best
approximating model(s) using Akaike’s Information Criterion for small sample sizes
(AICc) (Burnham and Anderson 2002; Anderson 2008).
I first developed the most parsimonious model for explaining variation in nest-site
selection or nest survival for each a priori hypothesis (prey availability, predator activity,
human activity, and physical features) by using a manual forward model selection
approach using AICc. The most parsimonious model for each hypothesis was then
contrasted using AICc alongside a null (intercept-only) model. Because these
hypotheses are not mutually exclusive, I also explored the potential for these

30
hypotheses to be operating in concert by considering additive effects of these
hypotheses.
Results
Nest-Site Selection
During the 2008-9 breeding seasons, I located 473 nests (2008: 190; 2009: 283).
Overall, there was some evidence for each hypothesis in the predicted direction; with
models representing each hypothesis fitting the data better than an-intercept only model
(Table 2-4). However, the only strongly supported model contained at least one
explanatory variable from each of the a priori hypotheses. During both years, plovers
selected habitat based on physical features, human activity, predator activity, and prey
availability. Specifically, plovers selected locations near conspicuous beach debris,
near ephemeral pools, away from ghost crab burrows, away from forest patches, and
with the presence of symbolic fencing (Table 2-4 and Fig. 2-2a-e).
Nest Survival
I monitored the fate of 473 nests during the 2008-9 breeding seasons, resulting in
an effective sample size of 6728 (see Statistical Analysis). The mean interval length
between nest visits for both years was 6 days. Pooled across both seasons, I observed
an apparent nest survival rate of 0.437.
Approximately 88% of all unsuccessful nests during both seasons failed due to
known depredation. In 2008 and 2009, I identified ghost crabs as the most common
predator of eggs (Table 2-5.), accounting for 64% of identified depredation events
based on tracks at the nest site. Coyote were the second most identified predator,
whereas fish crows only represented 2% of depredation events. Based on predator
sampling pooled across both seasons, I identified 6266 individual tracks. Of the total

31
count, 92% represented ghost crab burrows (n=5783). In comparison, only 5.2% of
tracks were from coyotes (n=324).
There was some evidence for each hypothesis; with models representing each a
priori hypothesis fitting the data better than an-intercept only model (Table 2-6).
However, there were two competing models with similar AICc values. Explanatory
variables from three of the a priori hypotheses combined produced the most
parsimonious model and the second best model contained predictors from each of the
four hypotheses. Based on these two additive models, plovers were more likely to
hatch a nest in areas further from ghost crab burrows, with the presence of symbolic
fencing, in locations further from foraging habitats, and when located further from
conspicuous beach debris (Fig. 2-3a-d). Human and predator activity were in the
predicted direction, however prey availability and physical features were the opposite of
what I predicted and what was selected for in nest-site selection.
Discussion
Few habitat studies have been able to confront multiple ecological hypotheses for
habitat selection, nor the fitness consequences of such decisions (Jones 2001). My
results provide a unique demonstration of how multiple selective forces influence nest-
site selection and reproductive output. Additionally, through the use of tracking I was
able to link predator counts with observed patterns of nest predation and with the
identification of the most important nest predator species in this region. Nest-site
selection and nest survival patterns revealed in this study indicate an influence by a
combination of environmental influences working in concert. Nest-site selection and the
consequent survival were influenced by human and predator activity, prey availability in
addition to physical features surrounding the nest-site.

32
Human Activity
Along the gulf coast of Florida, the presence of human activity on beaches has the
ability to reduce habitat quality (i.e., in terms of survival). Plovers were four times more
likely to nest in areas protected from human activity. Previous studies have also shown
benefits from restricting human disturbance (Lafferty et al. 2006; Lauten et al. 2007).
Additionally, species from various taxonomic groups shift habitat use in response to
human disturbance including dolphin (Allen and Read 2000), geese (Gill et al. 1996),
and bear (Mace et al. 1996). There are many potential benefits associated with
protection from human disturbance. However, on coastal beaches without protection,
human activity can lead to direct trampling of nests (Yasue and Dearden 2006a; Page
et al. 2009). Human activity may also indirectly impact success through the flushing of
individuals from nests (Frid and Dill 2002; Yasue and Dearden 2006a), leaving eggs
exposed to predators in the process (Page et al. 2009) or exposed to the sun resulting
in embryo mortality (Webb 1987).
Although plover nests were twice as likely to hatch with the presence of symbolic
fencing, there were very few nests impacted by direct pressures from human
disturbance (n = 15 (3%), abandoned; n = 0, trampled). In fact, the primary cause for
failure in areas not protected against disturbance was depredation and the main source
documented was from ghost crabs. The occurrence of crab depredation in locations not
protected from disturbance suggests potential indirect mechanisms by which ghost
crabs respond to cues related to disturbance activity at the nest itself. Frid and Dill
(2002) have hypothesized that increases in indirect predation rates in association with
human disturbance are related to predation risks as a result of disturbance stimuli.
33
However, the resulting predation rates may be linked to the particular behavior of
existing predators and how they search for prey (Sodersrom et al. 1998).
Predator Activity
The ghost crab is a unique predator within the Snowy Plover’s geographic range
and appears to be isolated to the Florida population. In addition to Snowy Plovers, I
documented Least Tern (Sternula antillarum) and Wilson’s Plover (Charadrius wilsonia)
nests depredated by ghost crabs. This is the first study that I know of to quantify the
relationship between ghost crabs and plovers in Florida, although crabs are frequently
documented as predating upon lizards and sea turtle hatchlings on the same beach
habitats (Wolcott 1978; Strachan et al. 1999). The influence of ghost crabs on nest-site
selection is likely due to a perceived predation risk to both adult and nest survival. In
addition to ghost crabs depredating eggs and chicks, adult plovers are often observed
with leg or body wounds from ghost crabs (pers. Obs.). The impacts from crabs on
adult survival and population dynamics are currently unknown.
Nests that were closer to burrows were less likely to survive. Comparably,
previous studies have documented higher hatch rates in areas of low crab burrow
densities (Yasue and Dearden 2006a). Interestingly however, no abandoned nests (n =
15) in my study were depredated by crabs, therefore, predation likely occurs because
ghost crab’s respond to visual stimuli associated with the nest. In addition, ghost crab
predation might occur indirectly. When plovers are approached by people they flush
from the nest and conduct distractive displays (Yasue and Dearden 2006a; Baudains
and Lloyd 2007; Weston and Elgar 2007). This behavior may impact nest survival in
two ways. First, the plover leaves eggs exposed to predators upon leaving the nest.
Second and possibly more important in this system, conspicuous activity associated
34
with anti-predator displays by plovers may increase predation risk. The visual stimuli
associated with such displays may encourage predation from ghost crabs. Unlike many
crab species, ghost crabs are not scavengers, but active predators (Wolcott 2009) and
are among the fastest terrestrial invertebrates (Full and Weinstein 1992). During a
study on ghost crab diet, Wolcott (1978) found ghost crabs to rely on live beach
macrofauna for 90% of its diet. Ghost crabs are largely nocturnal, but flexible in their
behavior and can forage by day (Wolcott 2009). During the day crabs remain closer to
their burrows, cleaning and foraging around it (Wolcott 1978). However, the ability for
diurnal ghost crab activity is dependent upon crab size. Large crabs are able to tolerate
higher temperatures and can stray further from the water and their burrows (Wolcott
2009). Additionally, Wolcott and Wolcott (1999) suggest that the relationship between
plovers and crabs may be dependent on climate and latitude. Ghost crabs increase in
size and abundance from their northern to southern limits along the Atlantic Coast (U.S.
Fish and Wildlife Service 1996). Thus, because of ghost crab behavior and size in
Florida, plover anti-predator displays may be maladaptive at this location.
Interestingly, nest survival was lowest for nests located in close proximity to
foraging habitats. The additive influence of distance to the nearest water body may
exacerbate the influence of human disturbance stimuli and the consequent indirect
predation. I collected information on foraging habitats to test for the influence of prey
availability with specific predictions related to increased nest attentiveness. However,
the relationship between the distances from nest to water is likely an influence of beach
width. Beach-goers typically walk the water’s edge, resulting in greater frequency and
intensity of disturbance with closer proximity to foraging habitat from the nest. The
35
resulting disturbance is likely too great to provide an observable benefit to nest survival
through adult attentiveness. Increased predation likely results from the human
disturbance stimuli related to distance to foraging habitat.
The decline in the probability of nest-site selection in relationship to the presence
of forest patches is likely related to a perceived predation risk to both adult and nest
survival. The presence of forest patches did not result in an impediment to hatching a
nest. However, the probability of nest placement in the presence of forest patch was
less than 10 %, therefore, the potential to observe a fitness consequence in response to
the presence of a forest patch in study was limited. Yasue and Dearden (2006a)
observed Malaysian plover (Charadrius peronii) nest settlement patterns to be
influenced by the percent cover of tall trees backing the beach. Foraging shorebirds
wintering in British Columbia also preferentially select areas further from forest cover
(Yasue 2006). The selection pattern in response to forest patches is thought to occur
because trees provide cover from which avian predators launch attacks (Lazarus and
Symonds 1992). In this study both predictors in relation to predator activity that
influence nest selection probability were related to perceived predator risk rather than
with the change in predator densities across the landscape. However, the type of
predators observed and abundance of each type through tracking matched the recorded
nest predation events trough tracking evidence at individual nests.
Physical Features
Researchers have long hypothesized the placement of nests adjacent to debris to
provide an advantage in nest survival (Graul 1975). Yet the debris in question is usually
too small to provide any protective advantage from weather (Purdue 1976). Therefore,
the presence of debris is thought to provide visual obstruction from potential predators
36
(Powell 2001). Effects on nest survival, however, are equivocal. Many studies have
identified an increase in nest survival with the presence of debris (Hood 2006; Grover
and Knoff 1982), yet others have observed the opposite pattern (Cohen et al. 2008;
Powell 2001). Hood (2006) speculated this discrepancy was due to the amount of
debris present in the landscape, suggesting that in areas with less debris, predators
may actually be attracted to nests because they are located next to debris. Within my
study sites, however, the availability of debris was not limiting. Therefore, the
inconsistency in nest survival in relation to beach debris is likely a response from
localized predator communities. Because different predators use different search
tactics, predation rates and habitat influences likely differ among locations (Martin 1987;
Soderstrom et al. 1998). Powell (2001) suggested that corvids follow the debris line in
search of nests in coastal California, resulting in increased predation with the presence
of debris. Hood (2006), in contrast, reported coyotes to be the major cause for
depredation in Texas and observed an increase in survival with debris. In my study
ghost crabs were the major cause for depredation. Because ghost crabs respond to
movement, debris likely provides no nesting benefit to plovers nesting in Florida.
Additionally, ghost crabs are sensitive to high temperatures (Strachan et al. 1999;
Wolcott 2009) and consequently, often build burrows under or adjacent to beach debris,
which provides shade.
Nesting adjacent to beach debris appears to be maladaptive in relation to nest
survival throughout much of the Snowy Plovers geographic range. However, animals
seeking habitat may be attracted to cues for several different reasons. In addition to
responding to cues that directly impact fitness, cues may simply be correlated with more
37
relevant habitat features, such as potential nest sites (Stamps and Krishnan 2005;
Chalfoun and Martin 2009). The latter suggests that cues might be indirectly related to
habitat quality or such cues merely improve the ability for an individual to detect
potential habitat (Stamps and Krishnan 2005). Therefore the presence of debris may be
indirectly related to greater habitat quality. Additionally, with subsequent work with
brood survival I documented an increase in daily survival with a greater percentage of
debris around the immediate nest site (Chapter 3). Thus, birds might also be
responding to cues which provide benefits post-hatch.
Prey Availability
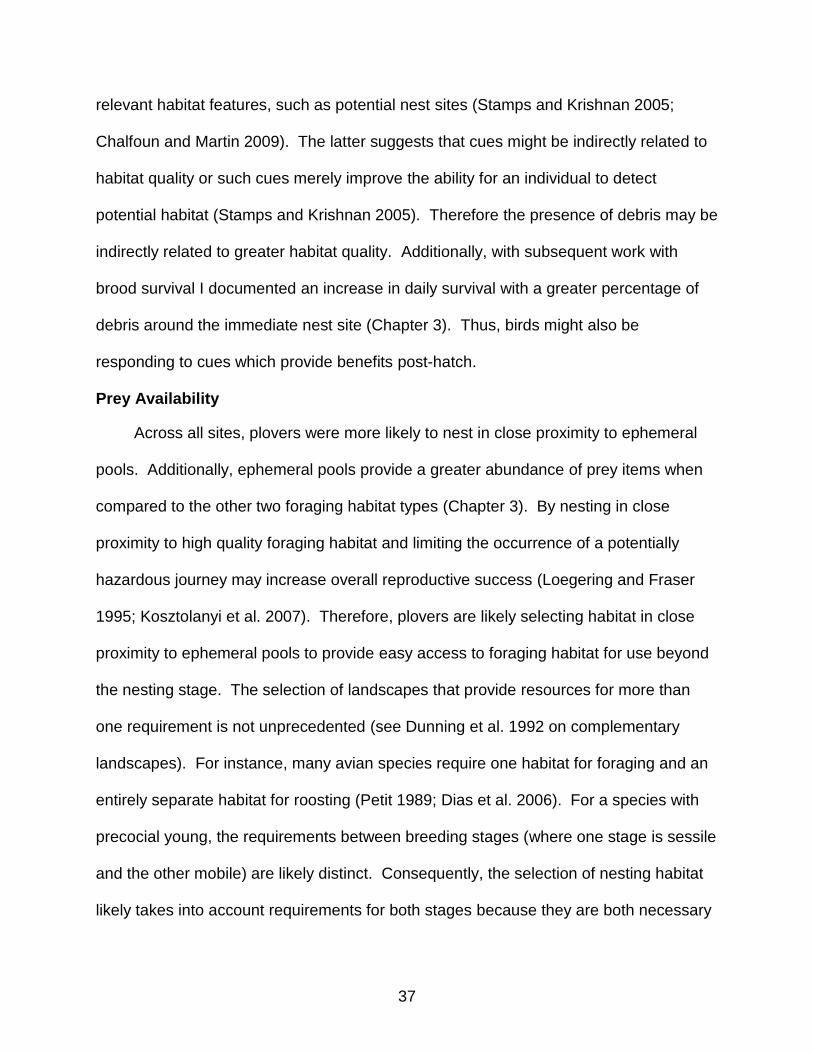
Across all sites, plovers were more likely to nest in close proximity to ephemeral
pools. Additionally, ephemeral pools provide a greater abundance of prey items when
compared to the other two foraging habitat types (Chapter 3). By nesting in close
proximity to high quality foraging habitat and limiting the occurrence of a potentially
hazardous journey may increase overall reproductive success (Loegering and Fraser
1995; Kosztolanyi et al. 2007). Therefore, plovers are likely selecting habitat in close
proximity to ephemeral pools to provide easy access to foraging habitat for use beyond
the nesting stage. The selection of landscapes that provide resources for more than
one requirement is not unprecedented (see Dunning et al. 1992 on complementary
landscapes). For instance, many avian species require one habitat for foraging and an
entirely separate habitat for roosting (Petit 1989; Dias et al. 2006). For a species with
precocial young, the requirements between breeding stages (where one stage is sessile
and the other mobile) are likely distinct. Consequently, the selection of nesting habitat
likely takes into account requirements for both stages because they are both necessary
38
for survival. However, nests closer to foraging habitat were less likely to survive to
hatching.
Conclusions
It is inevitable that human populations will increase and as populations increase,
the occurrence of habitat alteration and direct impacts will follow. The sites sampled
during this study represent the largest intact portion of the Snowy Plover nesting sites
remaining in Florida (Himes et al. 2007). However, even at these lower spectrums of
human disturbance levels, plovers benefited by the protection from human activity (i.e.,
use of symbolic fencing). These sites remain intact because they are primarily publicly
owned and protected from direct anthropogenic habitat alteration (i.e., development,
etc). Although they remain public lands, they are not immune to spillover from human
disturbance from neighboring sites which participate in development. As anthropogenic
pressures increase, so will the need to protect beach nesting species from the impacts
related to disturbance.
The primary source of nest depredation observed in this study is vastly different
from the predator pressure observed in other geographic regions. In many regions,
exclosures are used as a means of protecting nests from predation and are primarily
useful in preventing mammals and corvids from accessing shorebird eggs (Lauten et al.
2007). However, such management would likely have no influence in protecting nests
from predation in the Florida population. Management efforts geared toward the
conservation of plover populations may therefore need to be customized to the
predators primarily responsible for local nest mortality based on geographic location.
In addition to the influences of predator activity, I explored the influences of
physical features, human activity, and prey availability on nest-site selection and
39
addressed whether these influences were or were not adaptive (i.e., in terms of survival;
see Table 2-7). Using a species that is well studied throughout most of its range, for
which there is conflicting reported habitat requirements and variable pressures, this
study quantitatively demonstrated the importance of testing multiple ecological
hypotheses and the corresponding influence of multiple predictors. Collectively,
consideration of multiple predictors in habitat management, which is relevant to wildlife
in general, will benefit the conservation of rare and declining species.
40
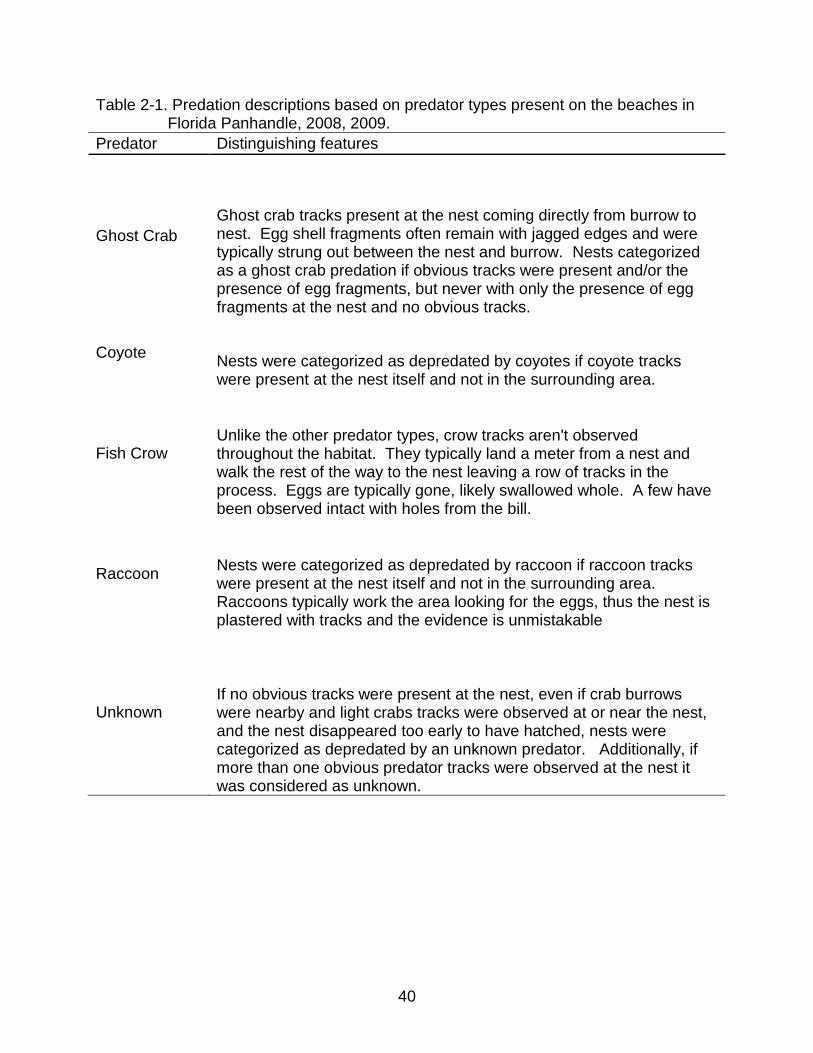
Table 2-1. Predation descriptions based on predator types present on the beaches in Florida Panhandle, 2008, 2009.
Predator Distinguishing features
Ghost Crab
Ghost crab tracks present at the nest coming directly from burrow to nest. Egg shell fragments often remain with jagged edges and were typically strung out between the nest and burrow. Nests categorized as a ghost crab predation if obvious tracks were present and/or the presence of egg fragments, but never with only the presence of egg fragments at the nest and no obvious tracks.
Coyote Nests were categorized as depredated by coyotes if coyote tracks were present at the nest itself and not in the surrounding area.
Fish Crow Unlike the other predator types, crow tracks aren't observed throughout the habitat. They typically land a meter from a nest and walk the rest of the way to the nest leaving a row of tracks in the process. Eggs are typically gone, likely swallowed whole. A few have been observed intact with holes from the bill.
Raccoon Nests were categorized as depredated by raccoon if raccoon tracks were present at the nest itself and not in the surrounding area. Raccoons typically work the area looking for the eggs, thus the nest is plastered with tracks and the evidence is unmistakable
Unknown If no obvious tracks were present at the nest, even if crab burrows were nearby and light crabs tracks were observed at or near the nest, and the nest disappeared too early to have hatched, nests were categorized as depredated by an unknown predator. Additionally, if more than one obvious predator tracks were observed at the nest it was considered as unknown.

41
Table 2-2. Foraging habitat types of the Gulf Coast of Florida.
Habitat Type* Distinguishing features
Ephemeral pool
Low energy, standing water pool with surrounding moist sand. Typically with sparse to medium vegetation, but backed by dunes with denser vegetation. Standing water derives from either high tide or storm activity due to the presence of low dips located between the shoreline and dune line.
Bay tidal flat Mud flats submerged only at high tide. Are generally only reached by waves of low amplitude, resulting in moist sand. Typically sparsely vegetation, flat, and exposed. Some salt-tolerant plants (mostly Salicornia and Spartina).
Shoreline
High to medium energy wave dominated. Moist sand limited to the swash zone, where waves are projected up the beach slope. Typically with standing wrack (largely composed of dead marsh grass) and sparse vegetation, but backed by dunes with dense vegetation. Can be located on either the gulf or bay sides. Foraging restricted to between the shoreline and the foredunes.
* Habitat type definitions modified from Davis and Fitzgerald (2004)

42
Table 2-3. Explanatory variables considered in the analysis of Snowy Plover Nest-site selection and survival, Gulf Coast of Florida, 2008–2009
Variable Description
Physical Features
Veg Percent vegetation cover at 1 m radius
Sand Percent sand cover at 1 m radius
Debris Percent debris cover at 1 m radius
DistVeg Distance to the nearest vegetation within 100 m radius
DistDune Distance to the nearest dune within 100 m radius
DuneHgt Height of the nearest dune
Distdebris Distance to the nearest conspicuous debris within 100 m radius
Prey Availability
DistWater
Distance to the nearest foraging habitat within 100 m radius
TypeForaging Type of the nearest foraging habitat
Foraging Presence of foraging habitat at 500 m
Predator Activity
Forest
Distance to the nearest forest patch within 100 m radius
GhostCrab Distance to the nearest ghost crab burrow within 100 m radius
Predator Total count of observed predator tracks at 500 m
Human Activity
Fencing*
Presence/absence of symbolic fencing within 100 m radius
Access Presence/absence of beach access points within 100 m radius
DistHuman Distance to the nearest human footprint within 100 m radius
Human Total count of observed human tracks at 500 m
*Fencing considered present for nest-site selection models if already present prior to nest settlement and considered present for nest survival models if fencing materials were present already or if they were erected after nest settlement.
43
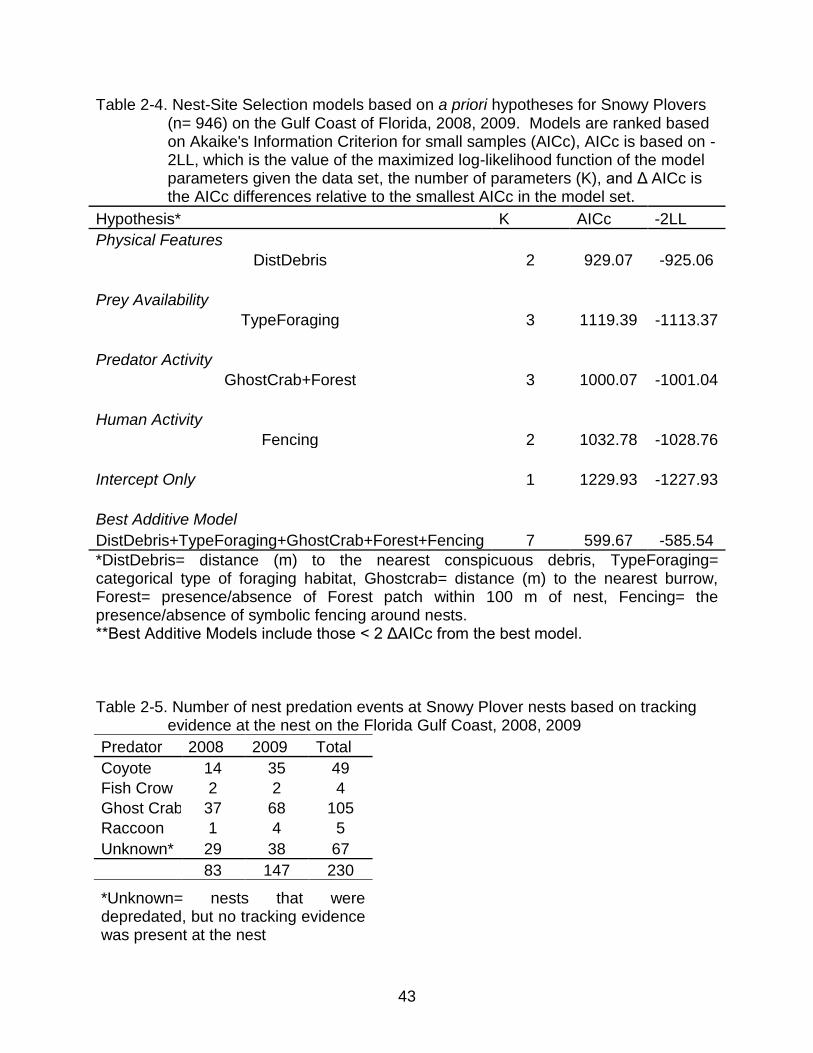
Table 2-4. Nest-Site Selection models based on a priori hypotheses for Snowy Plovers (n= 946) on the Gulf Coast of Florida, 2008, 2009. Models are ranked based on Akaike's Information Criterion for small samples (AICc), AICc is based on -2LL, which is the value of the maximized log-likelihood function of the model parameters given the data set, the number of parameters (K), and Δ AICc is the AICc differences relative to the smallest AICc in the model set.
Hypothesis* K AICc -2LL
Physical Features DistDebris 2 929.07 -925.06
Prey Availability TypeForaging 3 1119.39 -1113.37
Predator Activity GhostCrab+Forest 3 1000.07 -1001.04
Human Activity Fencing 2 1032.78 -1028.76
Intercept Only 1 1229.93 -1227.93
Best Additive Model DistDebris+TypeForaging+GhostCrab+Forest+Fencing 7 599.67 -585.54
*DistDebris= distance (m) to the nearest conspicuous debris, TypeForaging= categorical type of foraging habitat, Ghostcrab= distance (m) to the nearest burrow, Forest= presence/absence of Forest patch within 100 m of nest, Fencing= the presence/absence of symbolic fencing around nests. **Best Additive Models include those < 2 ΔAICc from the best model.
Table 2-5. Number of nest predation events at Snowy Plover nests based on tracking evidence at the nest on the Florida Gulf Coast, 2008, 2009
Predator 2008 2009 Total
Coyote 14 35 49
Fish Crow 2 2 4
Ghost Crab 37 68 105
Raccoon 1 4 5
Unknown* 29 38 67
83 147 230
*Unknown= nests that were depredated, but no tracking evidence was present at the nest
44
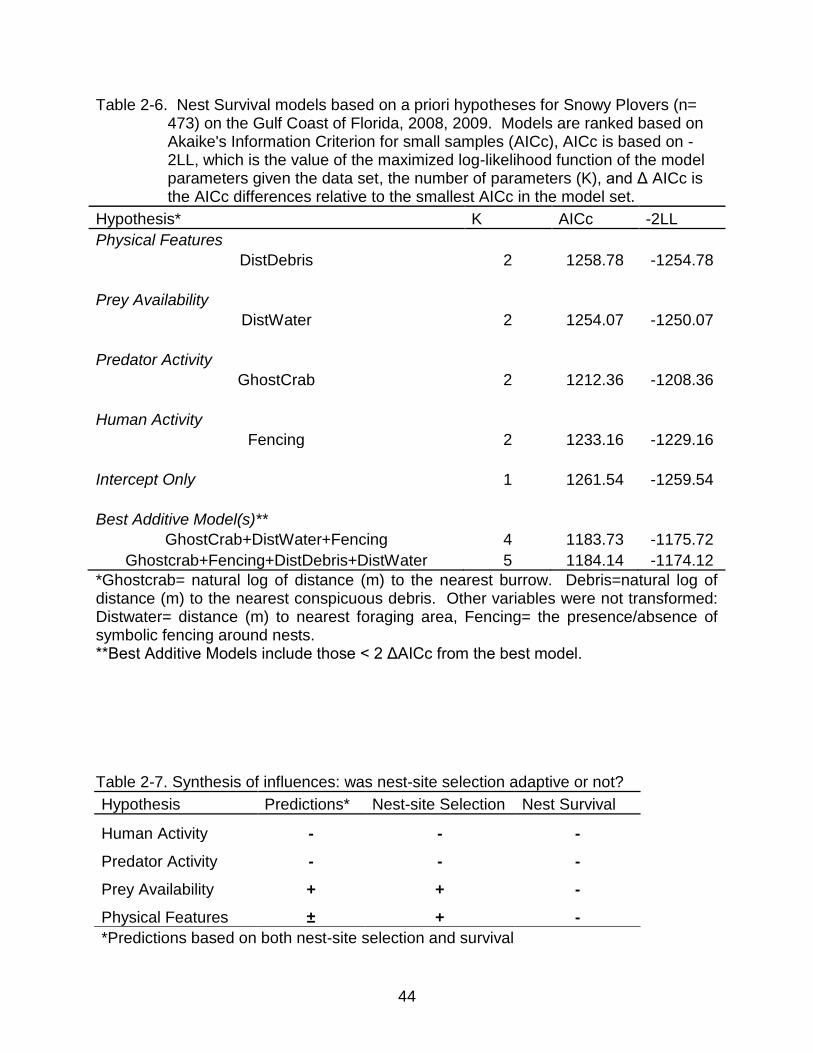
Table 2-6. Nest Survival models based on a priori hypotheses for Snowy Plovers (n= 473) on the Gulf Coast of Florida, 2008, 2009. Models are ranked based on Akaike's Information Criterion for small samples (AICc), AICc is based on -2LL, which is the value of the maximized log-likelihood function of the model parameters given the data set, the number of parameters (K), and Δ AICc is the AICc differences relative to the smallest AICc in the model set.
Hypothesis* K AICc -2LL
Physical Features DistDebris 2 1258.78 -1254.78
Prey Availability DistWater 2 1254.07 -1250.07
Predator Activity GhostCrab 2 1212.36 -1208.36
Human Activity Fencing 2 1233.16 -1229.16
Intercept Only 1 1261.54 -1259.54
Best Additive Model(s)** GhostCrab+DistWater+Fencing 4 1183.73 -1175.72
Ghostcrab+Fencing+DistDebris+DistWater 5 1184.14 -1174.12
*Ghostcrab= natural log of distance (m) to the nearest burrow. Debris=natural log of distance (m) to the nearest conspicuous debris. Other variables were not transformed: Distwater= distance (m) to nearest foraging area, Fencing= the presence/absence of symbolic fencing around nests. **Best Additive Models include those < 2 ΔAICc from the best model. Table 2-7. Synthesis of influences: was nest-site selection adaptive or not?
Hypothesis Predictions* Nest-site Selection Nest Survival
Human Activity - - -
Predator Activity - - -
Prey Availability + + -
Physical Features ± + -
*Predictions based on both nest-site selection and survival
45
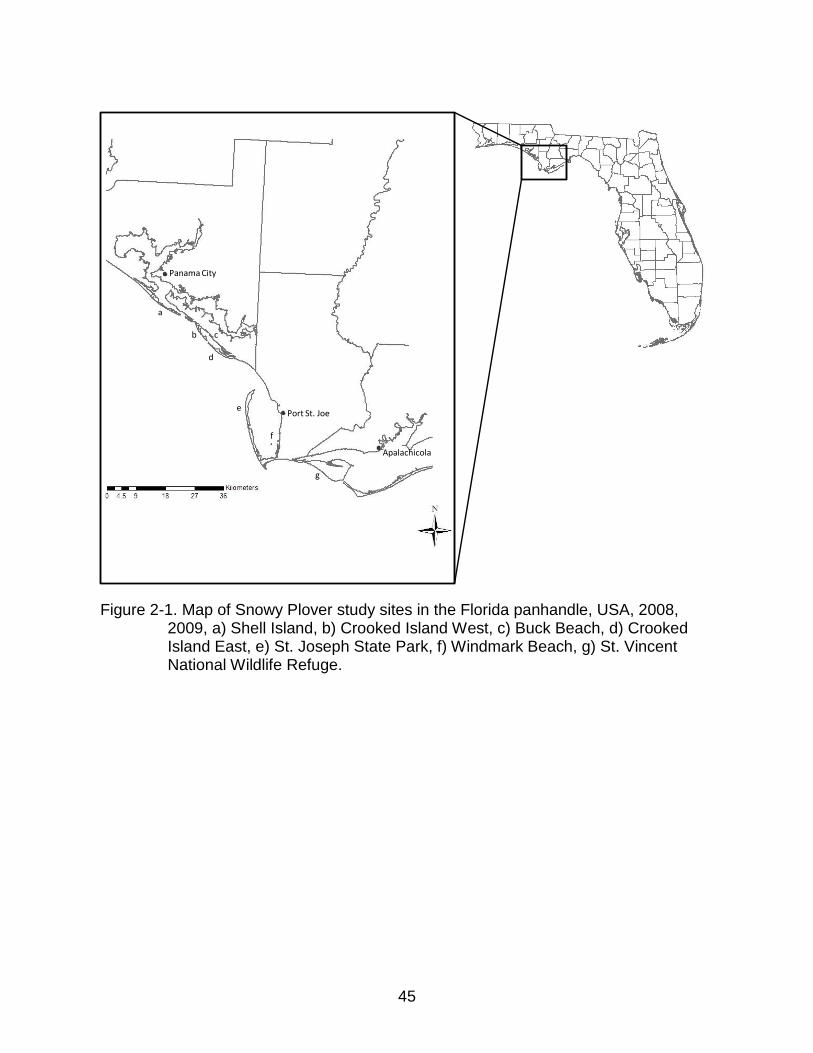
Figure 2-1. Map of Snowy Plover study sites in the Florida panhandle, USA, 2008, 2009, a) Shell Island, b) Crooked Island West, c) Buck Beach, d) Crooked Island East, e) St. Joseph State Park, f) Windmark Beach, g) St. Vincent National Wildlife Refuge.
Panama City
Port St. Joe
Apalachicola
a
b c
e
f
d
g

46
a) b) c)
d) e)
Figure 2-2. Depiction of predation events by different predator types present on the
beaches in the Florida Panhandle, 2008, 2009, a) coyote tracks and spilt yolk at nest, b) ghost crab burrow, tracks, and egg drug from nest to burrow, c) crow tracks outlined with red circles leading to nest, d) ghost crab at nest depredating eggs showing body imprint left at nest, e) close up of crow tracks left at nest.

47
Symbolic Fencing
Present Absent
Pro
bability o
f S
ele
ction
0.0
0.2
0.4
0.6
0.8
1.0
Distance (m) to ghost crab burrow
0 2 4 6 8 10 12 14
Pro
bability o
f S
ele
ction
0.0
0.2
0.4
0.6
0.8
1.0
Distance (m) to debris
0.0 0.5 1.0 1.5 2.0 2.5 3.0
Pro
bability o
f S
ele
ction
0.0
0.2
0.4
0.6
0.8
1.0
Foraging habitat
Bay Ephemeral Shore
Pro
bability o
f S
ele
ction
0.0
0.2
0.4
0.6
0.8
1.0
a) b)
c) d)
Forest Patch
Present Absent
Pro
bability o
f S
ele
ction
0.0
0.1
0.2
0.3
0.4
0.5
0.6
e)
Figure 2-3. The probability of Snowy Plover Nest-Site Selection as a function of predictors from the most parsimonious model with 95% confidence limits, a) the presence of symbolic fencing within a 100m radius, b) the distance to the nearest ghost crab burrow within 100m radius, c) the distance to the nearest conspicuous debris within 100m radius, d) the nearest foraging habitat type within 100m radius, and e) the presence of forest patches within 100m radius on the Gulf coast of Florida, 2008, 2009.
48
Distance (m) to ghost crab burrow
0 2 4 6 8 10 12 14
Pro
ba
bility o
f H
atc
hin
g
0.0
0.2
0.4
0.6
0.8
1.0
Distance (m) to debris
0.0 0.5 1.0 1.5 2.0
Pro
ba
bility o
f H
atc
hin
g
0.2
0.4
0.6
0.8
1.0
Distance (m) to waterbody
20 40 60 80 100
Pro
ba
bility o
f H
atc
hin
g
0.2
0.3
0.4
0.5
0.6
0.7
0.8
0.9
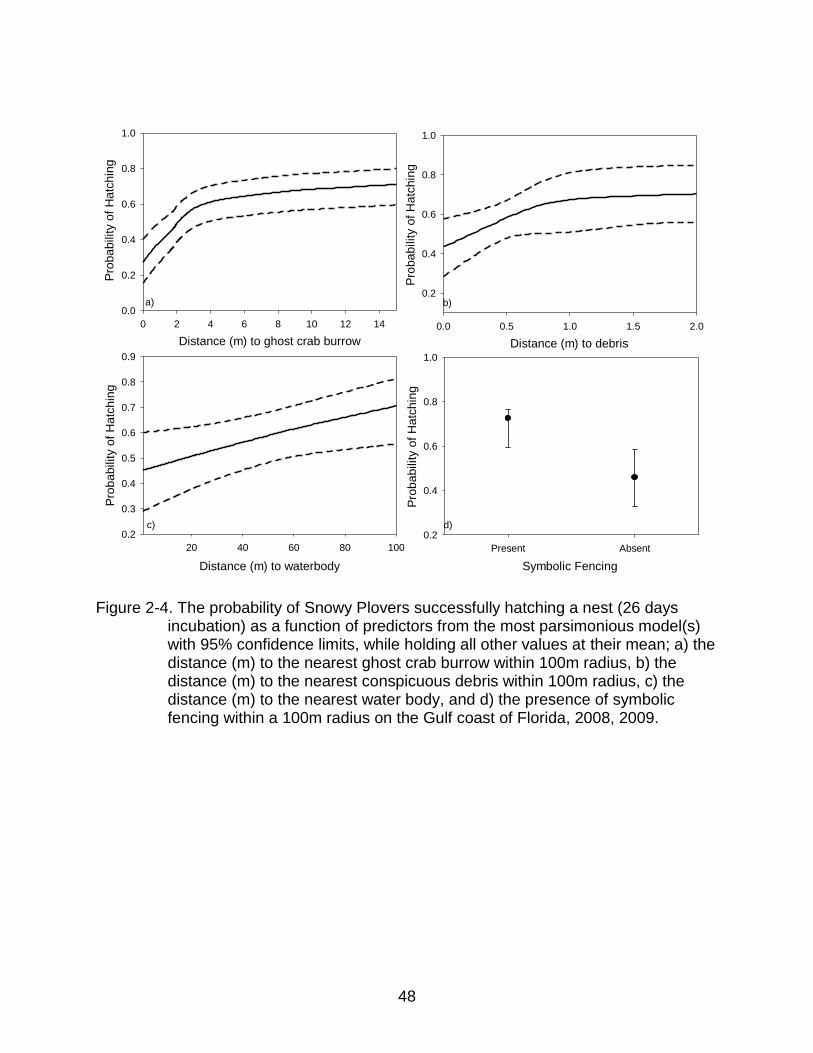
Symbolic Fencing
Present Absent
Pro
ba
bility o
f H
atc
hin
g
0.2
0.4
0.6
0.8
1.0
a) b)
c) d)
c)
Figure 2-4. The probability of Snowy Plovers successfully hatching a nest (26 days incubation) as a function of predictors from the most parsimonious model(s) with 95% confidence limits, while holding all other values at their mean; a) the distance (m) to the nearest ghost crab burrow within 100m radius, b) the distance (m) to the nearest conspicuous debris within 100m radius, c) the distance (m) to the nearest water body, and d) the presence of symbolic fencing within a 100m radius on the Gulf coast of Florida, 2008, 2009.

49
CHAPTER 3 PREY AVAILABILITY AND PREDATOR ACTIVITY AS PREDICTORS OF SNOWY
PLOVER BROOD-REARING SITE SELECTION AND SURVIVAL
Introduction
The selection of breeding habitat by birds may be influenced by a combination of
factors, including human recreational activities, predation of young, food availability, and
habitat substrate (Hoover and Brittingham 1998; Newton et al. 1998; Jones 2001;
Colwell et al. 2007a). Although knowledge of such selection factors is important for
species conservation, perhaps more important is an understanding of how selection
factors influence survival and reproductive performance (Martin 1992; Benson et al.
2010). The selection of habitat is assumed to be adaptive, such that habitat
preferences confer fitness benefits over other alternatives (Jones 2001). However,
fitness consequences may become decoupled from selection factors due to
anthropogenic change or alteration (Schlaepfer et al. 2002; Robertson and Hutto 2006).
Many species must find suitable habitat for multiple reproductive behaviors within
a single landscape. This phenomenon is often referred to as landscape
complementation (see Dunning et al. 1992). For a particular organisms resources are
non-substitutable; that is, both resources are required, but for different reasons. For
example, species with precocial young (e.g., waterfowl, shorebirds, etc.) must select
habitats that provide adequate nesting and brood-rearing opportunities (Haig et al.
1998; Conway et al. 2005). Because the habitats used for these two distinctive stages
of reproduction likely provide disparate resources, the factors influencing selection of
brood-rearing habitat may be vastly different than those that influence nest-site
selection. Consequently, factors effecting brood survival likely differ from those
impacting nests. Estimating survival to fledging is a valuable tool in population
50
management, but most reproductive studies with precocial species only deal with the
probability of hatching eggs. Therefore, although an important component of
productivity, the survival of precocial young is poorly understood.
For most species food availability is a major determinant for patterns of selection
and species occurrences in natural communities (Frederick et al. 1996; Granadeiro et
al. 2004) due to energy requirements associated with both reproduction and survival
(Schekkerman and Visser 2001). All animals require food and most must leave
offspring in order to actively search for prey in order to survive (Pyke et al.1977). Yet for
precocial species, the collection of necessary food is shifted to the chick (Schekkerman
and Visser 2001). Thus, precocial young must have an accessible and reliable food
supply. Nonetheless, for most precocial species foraging requirements and related
movement needs are largely unknown. This information gap is, in part, due to the
mobility of many of these species. For example, most shorebird chicks typically leave
nesting territories within hours after hatching (Page et al. 2009).
Across taxa, predation of the young is often the primary source of reproductive
failure (Page et al. 1983; Angelstam 1986; Warriner et al. 1986; Martin 1992). When
predation rates differ between locations, predation can influence habitat use and
selection (Martin 1995; Chalfoun et al. 2002). For avian species, predation risks also
vary with nest placement (e.g. ground or shrub nests, Martin 1993). Ultimately,
however, the observed variation in patterns of nest predation is determined by the
distribution, abundance or species composition of nest predators and their specific
foraging behaviors in different locations (Martin 1987; Ricklefs 1989; Andren 1995;
Chalfoun et al. 2002). Because predators likely use different search tactics (Soderstrom

51
et al. 1998), habitat physiognomy or the purely physical features of the nest-site may
have direct consequences by affecting the probability of nest predation (Steele 1993;
Budnik et al. 2002)
While physical features, predators and food can be influential in offspring survival,
there have been few rigorous attempts to understand the relative role of human
disturbance. Alteration and loss of habitat have intensified the spatial overlap between
wildlife and humans (Weston and Elgar 2007). Increases in human-wildlife contact can
alter use-patterns within the landscape by excluding individuals from potential habitat
(Gill et al. 2001; Stillman 2003). For example, tourism has resulted in increased
recreational pressures on coastal habitats and has contributed to global declines in
many coastal-dependent species, particularly shorebirds (Burger 2000; Gill et al. 2001;
Lord et al. 2001; Ruhlen et al. 2003; Yasue and Dearden 2006a).
I tested for the role of prey availability, predator activity, human activity, and
physical features on habitat use and survival of Snowy Plover (Charadrius alexandrines)
broods (i.e., chicks from the same nest, dependent on parents and not capable of flight)
in Florida. Snowy Plovers breed primarily on non-developed barrier islands in Florida.
Snowy Plovers in Florida are listed as Threatened and as Endangered by the Florida
Committee on Rare and Endangered Plants and Animals (Gore 1996), with the most
recent state-wide census estimating only 222 breeding pairs (Himes et al. 2007). The
plover breeding season overlaps with the coastal tourism season (Chase and Gore
1989; Lamonte et al. 2006; Himes et al. 2007), thereby exposing plovers to elevated
human disturbances. Indeed, as Florida’s economy is dominated by tourism centered
on coastal areas, these plovers are increasingly threatened by anthropogenic habitat
52
change and from direct and indirect human disturbance pressure. Despite the rapidly
changing habitat, no detailed or quantitative studies have been conducted on the brood
rearing requirements of shorebird species nesting on Florida’s beaches. Because of the
ease in observing human and predator tracks in the sand, the Florida coastal beach
habitat provides a unique opportunity for testing multiple hypotheses regarding brood
habitat use and survival within the same study. For Snowy Plover brood-site selection
and the consequent brood survival I confronted four a priori hypotheses: 1) nest-site
selection and survival are determined by predator activity, 2) nest-site selection and
survival are determined by human activity, 3) nest-site selection and survival are
determined by prey availability, and 4) nest-site selection and survival are determined
by physical features of the habitat. Because habitat selection is thought to be adaptive
(Clark and Shutler 1999), I predicted for both brood-site selection and brood survival in
order of expected influence that (1) prey availability would have a positive influence, (2)
predator activity would have a negative influence, (3) human activity would have a
negative influence, and (4) physical features would have a positive influences.
Methods
Study Area
I collected data at six sites located contiguously in Franklin, Gulf and Bay
Counties, in the panhandle of Florida, comprising 61.8 km of beach habitat. Sites
included were Shell Island (5.2 km; St. Andrews State Park, 7.3 km; Tyndall Air Force
Base [TAFB]), Crooked Island East, West, & Buck Beach (23.7 km; TAFB), St. Joseph’s
State Park (13 km), and St. Vincent National Wildlife Refuge (12.6 km). All sites except
Buck Beach are barrier Islands along the Gulf Coast. Many potential predators are
present on the study area. The main predators observed at these sites in previous

53
plover studies, include coyotes (Canis latrans), raccoons (Procyon lotor), and ghost
crabs (Ocypode quadrata) (Himes et al. 2007). Himes et al. (2007) also documented
fish crows (Corvus ossifragus), California gulls (Larus californicus), and gull-bill terns
(Gelochelidon nilotica) impacting either nests or chicks.
Brood Monitoring
After first conducting nesting surveys, for concurrent research with nest-site
selection and associated survival (Chapter 2), I conducted brood monitoring every 5-7
days between April and August of 2008 and 2009. The earliest hatch date during either
season occurred on April 5th. On hatch day, I attempted to capture and band both
adults and chicks. Adults were caught using a modified funnel trap and a chick coral
(placed around chicks) shortly after hatching (see Gratto-Trevor 2004). I marked chicks
with unique band combinations on hatch day or if they have already left the nesting
area, upon the first encounter. I monitored marked adults and chicks until fledging to
determine brood success. For marked individuals with recent hatches (i.e., had not
fledged yet), I watched for either presence of chicks or for family behavior (i.e., actively
defending territory, flying around, and/or vocalization). If marked adults were observed
initiating a new territory, nest, or feeding without chicks, broods were considered to
have failed. For calculating reproductive performance, I defined brood success as at
least one chick surviving to 28 days post-hatch (Warriner et al. 1986). I captured and
marked Snowy Plovers with the Florida Fish and Wildlife Conservation Commission
(FWC) banding permit # 21980, and with approval from the University of Florida Animal
Care and Use Committee (permit # 006-08WEC) .

54
Explanatory Variables
I analyzed four groups of explanatory variables that might influence selection and
survival during the brood-rearing stage: physical features, human activity, prey
availability, and predator activity. Each season I collected measurements at both nest
and random point locations using three spatial scales: nest-site (1 m radius), nest-
territory (100 m radius), and landscape scale (500 m radius).
Physical features of the habitat are thought to effect both selection and survival.
In particular, brood survival is thought to depend upon cover from potential predators
(Powell and Collier 2000); therefore I predicted a positive effect of increased vegetation,
dunes, shell and organic debris. To test these predictions, I quantified the percent
ground cover of vegetation, bare sand, shell debris, and organic debris at the nest-site.
At the nest-territory I use a distance to object design (Williams et al. 2002), measuring
the distance to vegetation, primary dune, dune height, and the distance to nearest
conspicuous debris.
To test for the influence of human activity, I collected data at both the nest-territory
and landscape scales. Because studies have documented greater brood survival in
relation to low human disturbance (Cowell et al. 2007; Ruhlen et al. 2003 ), I predicted
positive influences to selection and brood survival with the use of symbolic fencing and
with increased distance from beach access points. Symbolic fencing is composed of
signs and ropes and is often used by managers to protect nesting areas from human
disturbance (see Lafferty 2001a). Within the nest-territory, I measured the
presence/absence of beach access points, distance to nearest human foot print, and
presence/absence of symbolic fencing within a 100 m radius. At the landscape scale, I
systematically sampled human activity, predicting nest-site selection and survival to
55
decrease as human density increased. To investigate the spatial variation in human
disturbance potentially affecting nest-site selection and nest success, I quantified
human density with beach foot traffic. I set up strip transects by raking 50 m long x 2 m
wide sand transects running perpendicular from the shoreline to the primary dune line.
Transects were set-up over the weekend to capture maximum beach activity levels and
to investigate temporal variation, I conducted sampling twice during both breeding
seasons. Sampling took place during the months of March and April early in the season
and during June and July later in the breeding season.
To test for the influence of prey availability, I collected data at both the nest-
territory and landscape scales. Loegering and Fraser (1995) documented higher piping
plover survival rates for broods with access to high quality brood rearing-habitat;
therefore, I predicted Snowy Plover broods would select for, and brood survival rates
would be influenced by, foraging habitat type, with ephemeral pools positively
influencing both selection and survival compared to other available foraging habitat
types (Table 3-1). To test these predictions, within the nest-territory, I measured the
distance from the nest to the nearest foraging habitat and identified the type of foraging
habitat within a 100 m radius. Brood habitat selection for other plovers has been linked
to the distribution of invertebrate prey (Whittingham et al. 2001; Pearce-Higgens and
Yalden 2004). Therefore, at the landscape scale I systematically sampled prey
availability by selecting a random point every 500 m of linear beach habitat based on
grid system in ArcGIS. I categorized each habitat sampled into foraging habitat types
and sampled epifaunal (surface-dwelling) invertebrates with pitfall traps and paint
stirring sticks coated with Tanglefoot (The Tanglefoot Company; see Loegering and
56
Fraser 1995). I set up intertidal strip transects through random points running
perpendicular from the shoreline to the vegetation line (see Smith and Faillace 2006). I
arranged five sample arrays along a straight line between the low water mark and the
foredune perpendicular to the shoreline. The first array was centered on the most
recent wrack-line; the second array was at the highest wrack-line. The third array was
centered at mid-beach, the fourth array was at the vegetation line and the fifth array was
directly in front of the dune.
An array consisted of four pitfall traps made of clear plastic (diameter 11 cm, depth
8 cm) placed 2 m apart in a 2 m x 2 m plot and eight tangle foot sticks, two at each
corner (one vertical and one horizontal). I placed each pitfall trap flush with the sand
and filled each with 1 cm of H20. Because wrack and vegetation are often correlated
with invertebrate densities (Dugan et al. 2003), I recorded the percent vegetation and
wrack cover at each array. After one hour, trap contents were collected and
invertebrates were counted. To investigate annual variation in food availability, I
sampled for invertebrates during July and August 2008 and 2009. These methods of
prey sampling were appropriate because Snowy Plovers do not probe beneath the
surface. Snowy Plovers employ a ‘picking’ feeding method using a ‘run-and-pause’
style based upon visual cues (Page et al. 2009).
To test the influence of predator activity, I collected data at both the nest-territory
and landscape scales. Avian predators such as fish crows are often associated with
forest patches. The forest patches located at these sites are composed primarily of
slash pine (Pinus elliottii). Therefore, I recorded the presence/absence of the sand pine
forest edge within a 100 m radius. Previous studies have documented ghost crabs
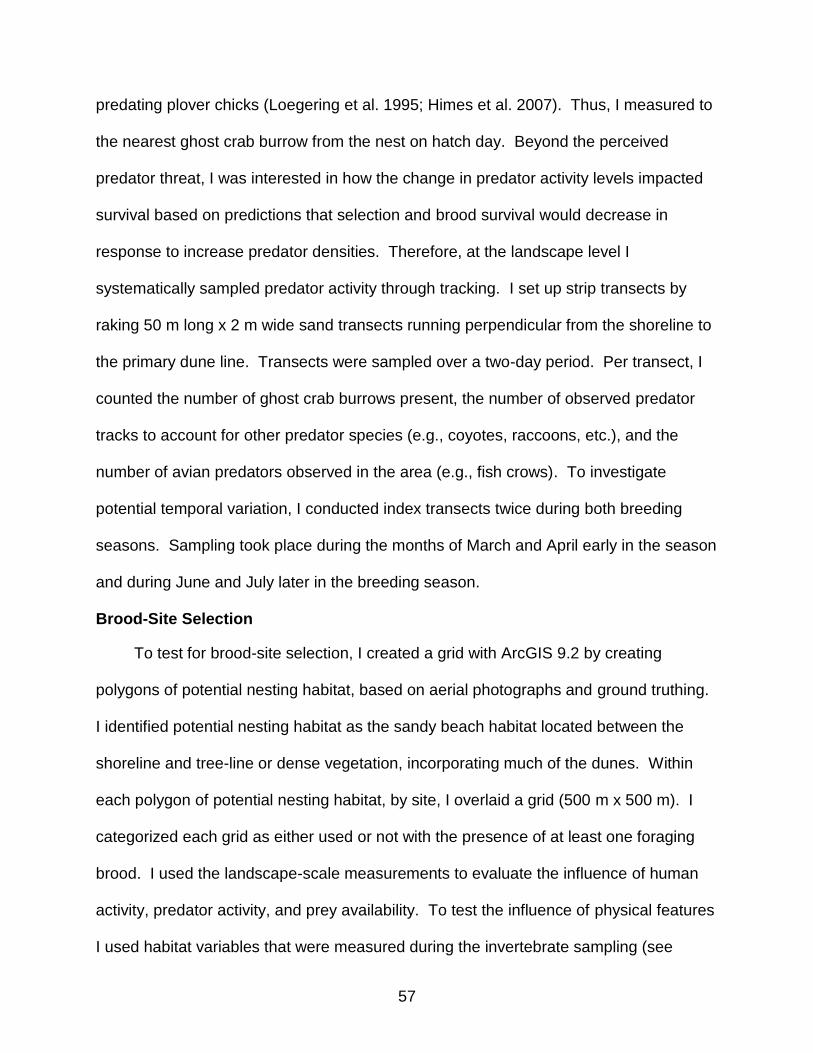
57
predating plover chicks (Loegering et al. 1995; Himes et al. 2007). Thus, I measured to
the nearest ghost crab burrow from the nest on hatch day. Beyond the perceived
predator threat, I was interested in how the change in predator activity levels impacted
survival based on predictions that selection and brood survival would decrease in
response to increase predator densities. Therefore, at the landscape level I
systematically sampled predator activity through tracking. I set up strip transects by
raking 50 m long x 2 m wide sand transects running perpendicular from the shoreline to
the primary dune line. Transects were sampled over a two-day period. Per transect, I
counted the number of ghost crab burrows present, the number of observed predator
tracks to account for other predator species (e.g., coyotes, raccoons, etc.), and the
number of avian predators observed in the area (e.g., fish crows). To investigate
potential temporal variation, I conducted index transects twice during both breeding
seasons. Sampling took place during the months of March and April early in the season
and during June and July later in the breeding season.
Brood-Site Selection
To test for brood-site selection, I created a grid with ArcGIS 9.2 by creating
polygons of potential nesting habitat, based on aerial photographs and ground truthing.
I identified potential nesting habitat as the sandy beach habitat located between the
shoreline and tree-line or dense vegetation, incorporating much of the dunes. Within
each polygon of potential nesting habitat, by site, I overlaid a grid (500 m x 500 m). I
categorized each grid as either used or not with the presence of at least one foraging
brood. I used the landscape-scale measurements to evaluate the influence of human
activity, predator activity, and prey availability. To test the influence of physical features
I used habitat variables that were measured during the invertebrate sampling (see
58
above) such as the % wrack at the shoreline, % vegetation at the beach midline, and %
vegetation at the foredune. I also categorized each grid by the presence of foraging
habitat types. I classified grids as ephemeral or bay flats if one of these habitat types
were present. If neither of these two foraging habitats were present, I classified the grid
as shoreline foraging habitat.
Brood-Rearing Habitat Use
I quantified actual brood-rearing habitat use through an instantaneous sampling
design by scanning for and recording all broods as they were encountered. To test
whether foraging habitat type effected brood survival, I recorded each observed brood
location with a Global Positioning System and recorded the type of brood-rearing habitat
used. In addition, I calculated the distance traveled by broods from nesting area to
brood-rearing area to test whether the proximity of foraging locations effected brood
survival. For broods with multiple observations, I used the average distance traveled (Σ
meters traveled / # of brood observations). Because predator, human, and invertebrate
densities may differ at actual used areas, I calculated the landscape scale
measurements (human, predator, and invertebrate counts) for the locations in which
broods were observed foraging in addition to nest sites.
Statistical Analysis
Prey Availability
When collecting available prey items, I sampled foraging areas only at the end of
the breeding season (i.e., July and August). In contrast, I recorded foraging habitat
types as they were used by broods regardless of seasonal timing (April- August).
Moreover, invertebrate densities often differ between foraging habitat types (Pearce-
Higgens and Yalden 2004). Therefore, I was interested in whether invertebrate counts
59
were in fact a product of foraging habitat type to eliminate issues of foraging habitats
that were no longer available during the time of prey sampling (e.g., ephemeral pools
that became dry but were available while broods were active). Invertebrate abundance
represented count data and typically count data follow a Poisson distribution. However,
for this data set, the variance was greater than the mean indicating a negative-binomial
distribution was more appropriate. The data were modeled using Generalized Linear
models (GLMs) with a negative-binomial distribution and log link function (Bliss and
Fisher 1953). I included covariates collected during sampling such as site, date, wind,
tide, weather and temperature.
Brood-Site Selection
To estimate brood-site selection, I used logistic regression to model the probability
of selection as a function of the variables collected at the landscape scale (500 m grid)
to represent my four a priori hypotheses. The response variable was whether or not at
least one brood was observed foraging within each grid location. I used the binomial
GLM procedure within R (2008) to estimate regression coefficients in the logistic
models.
Brood Survival
On brood checks, I always located marked adult birds and determined whether
each brood was active (i.e., with either the presence of chicks). I initially considered a
Cormack-Jolly-Seber mark-recapture model (Williams et al. 2002) to estimate brood
survival, but this method estimated a detection probability of 0.98. Consequently, I used
the logistic-exposure method to model daily brood survival (Shaffer 2004). I used
binomial GLMs within R (2008) to estimate regression coefficients in the logistic-
exposure models. Using this method, I estimated brood daily survival rates from the

60
resulting logistic function (Shaffer 2004). I used the effective sample size (n; Rotella et
al. 2004) when analyzing model fit (i.e., n = total number of days that nests were known
to survive + the total number of intervals in which a failure occurred) to adjust log-
likelihoods in a model selection approach (see below). Between visits, the response
variable was whether or not at least one chick per brood survived the interval.
Model Selection
Because I had many predictor variables (Table 3-2), I used a Spearman’s non-
parametric correlation matrix to check for potential multi-collinearity (Appendices C &D).
After removing variables that were strongly correlated (r>|0.6|), I selected the best
approximating model(s) using Akaike’s Information Criterion for small sample sizes
(AICc) (Burnham and Anderson 2002; Anderson 2008). For the brood survival models,
total shell ground cover and sand ground cover were highly correlated (r = 0.65), so I
dropped sand ground cover from further analysis because it is essentially the reciprocal
of shell debris. Additionally, my predictions were based on benefits related to the
presence of debris rather than the lack of debris (Powell and Collier 2000). Between
scales, the distance to the nearest vegetation and the total vegetation ground cover at
the nest were also highly correlated (r = 0.78), so I dropped the distance to the nearest
vegetation because percent vegetation as an indicator of nest concealment has been
used as a measure for many avian studies and percent vegetation catered more to my
predictions.
After screening variables, I developed the most parsimonious model for explaining
variation in brood-site selection or brood survival for each a priori hypothesis (prey
availability, predator activity, human activity, and physical features) by using a manual
forward model selection approach using AICc. The most parsimonious model for each
61
hypothesis was then contrasted using AICc alongside a null (intercept-only) model. A
model selection approach was useful here because it allows for simultaneously
comparing different models that reflect biological hypotheses (Johnson and Omland
2004). Because these hypotheses are not mutually exclusive, I also explored the
potential for these hypotheses to be operating in concert by considering additive effects
of these hypotheses.
Results
Prey Availability
During both breeding seasons foraging habitat type, the level of wind, and weather
at the time of sampling were important determinates of prey availability (Fig. 3-1a-c).
Between the three available foraging habitats, ephemeral pools provided the highest
amount of prey items (Fig. 3-1a).
Brood-Site Selection
The average distance broods traveled was 729 m, with a maximum distance
traveled of 5.3 km. Therefore, the sampling of brood use within 500 m grids was an
appropriate scale. Based on the data, there was some evidence for three a priori
hypotheses with models representing prey availability, predator activity, and physical
features fitting the data better than an-intercept only model (Table 3-3). However, the
most parsimonious model contained only variables representing prey availability (Table
3-3). Specifically, broods selected habitat based on the type of foraging habitat present,
where ephemeral pools were selected for at a greater probability than other available
foraging habitats (Fig. 3-2).
62
Brood Survival
I monitored 202 broods comprising 367 chicks during the 2008-9 breeding
seasons, resulting in an effective sample size of 3689 (see Statistical Analysis). The
mean interval length between brood visits for both years was 6.4 days. I confirmed 147
total fledged chicks, resulting in an overall apparent fledge rate of 0.39 pooled across
both years. Across years, the number of fledged chicks per successful brood averaged
1.37 ± 0.57 SD. At the brood level, I determined 64 (0.63) and 50 (0.48) nests to have
fledged at least one chick during 2008 and 2009, respectively, resulting in a 0.55
apparent fledge rate pooled over both seasons.
The majority of chick mortality occurred during the first week post-hatch (Table 3-
4). However, I could not document the cause for mortality because most chicks
disappeared in between site visits. I was able to confirm five predation events observed
opportunistically at the nest shortly after hatching. In all five cases ghost crabs were
responsible for mortality. Additionally, one chick was predated by a ghost crab during
trapping efforts. Fish crows and gull-billed terns were observed pursuing chicks and
have been documented predating chicks in other plover studies (Himes et al. 2007;
Page et al. 2009). However, they were sampled sporadically during tracking surveys,
so I did not include them directly in any analyses. Based on predator sampling pooled
across both seasons, I identified 6266 individual tracks. Of the total count, 92%
represented ghost crab burrows (n = 5783). In comparison, only 5.2% of tracks were
from coyotes (n = 324).
The best approximating model contained explanatory variables from three of the
four a priori hypotheses, predator activity, prey availability, and physical features and
each of these three fit better than the intercept-only model (Table 3-5). Broods were

63
more likely to survive when foraging at ephemeral pools, in areas of low predator
densities, with dunes backing the beach, and with greater debris around the nest (Fig.
3-3).
Discussion
Identification of habitat cues managers can utilize in the conservation of rare or
declining species is critical for appropriate management. However, few avian habitat
studies have been able to confront multiple ecological hypotheses for habitat selection,
nor the fitness consequences of such decisions (Jones 2001) to aide in management
decisions. While habitat selection is often assumed to be adaptive, evidence for
adaptive habitat selection in birds has been mixed (Clark and Shutler 1999; Jones
2001).My results provide a unique illustration of how multiple selective forces influence
brood-site selection and reproductive performance. Moreover, these results provide a
clear example of adaptive offspring selection.
On the Florida Gulf Coast, differences in the distribution of prey availability
influence habitat use by plover broods. In particular, the quality of foraging areas
determined habitat selection. In addition to the distribution of prey availability, brood
survival was influenced by a combination of predictors related to predator activity and
physical features of the habitat. The influence in the spatial gradient of predator activity
suggests that the quality of brood-rearing habitats was influenced by both food
abundance and predation risk.
Prey Availability
Positive relationships between prey availability and brood survival rates have been
reported for many avian species (Loegering and Fraser 1995; Elias et al. 2000; Pearce-
Higgens and Yalden 2004). For precocial young, it is thought that low prey availability

64
may slow development and chicks that fail to attain certain mass thresholds may not
survive (Loegering and Fraser 1995; Le Fer et al. 2008). Well-fed chicks are more likely
to cope with extreme temperatures and evade attacking predators (Kosztolanyi et al.
2007).
Plovers preferentially selected foraging habitats with greater counts of prey items.
These preferences conferred a fitness advantage via greater probability of fledging at
least one chick. In fact, the probability of fledging while foraging at ephemeral pools
was more than twice that of broods foraging at other habitat types. Adaptive selection
of high quality foraging habitat has been demonstrated in multiple avian studies (Smith
and Dawkins 1971; Elias et al. 2000; Pearce-Higgens and Yalden 2004). Working with
Great Tits (Parus major), Smith and Dawkins (1971) observed patterns of foraging area
selection in relation to prey abundance. These birds allocated the greatest amount of
time to areas of highest prey food abundance and progressively less time to worse
areas. In addition to quality, the spatial heterogeneity of prey items has been
documented as a determinate of species use patterns for many species (Goss-Custard
1984; Colwell and Landrum 1993; Ribeiro et al. 2004).
Theoretically, selection of foraging habitat should be the outcome of decisions that
balance the trade-off between food abundance and predation risk (Frid and Dill 2002).
For instance, Martin (1992) argued that life history traits (including fecundity) for many
avian species are influenced by predation in combination with food limitation. Patterns
in trade-offs have been observed across taxonomic groups including fish (e.g., Gilliam
and Fraser 1987), ungulates (e.g., Berger 1991) small mammals (e.g., Morris and
Davidson 2000), and sandpipers (Pomeroy 2006). In all examples listed, individuals
65
spent less time in areas where high resource richness was associated with greater
predation risk. In my study, bay tidal flats also provide a high level of invertebrate prey,
but were rarely used for brood-rearing. In contrast to ephemeral pools, bay tidal flats
are highly flat and open, with greater exposure to potential predators suggesting the
existence of predator-sensitive foraging. To the contrary, I did observe a transition to
bay tidal flats as broods fledged and during the onset of the wintering season by adults
(pers. Obs.), demonstrating the influence of age-dependent predation pressures.
Further examination between foraging habitats and predator pressures are clearly
needed.
Physical Features And Predator Activity
The predation of young is often the primary source of reproductive failure cited
across many taxa (Page et al. 1983; Angelstam 1986; Warriner et al. 1986; Martin 1992;
Benson et al. 2010). Detailed analyses in this system suggested that brood survival
was negatively correlated with predator abundance. Yet, in addition to the local
abundance of predators, physical features of the habitat also influenced the probability
of fledging. Differences in predation rates in relation to physical features of the habitat
have been linked to varying foraging strategies of potential predators and the related
cues they respond to in search of prey (Martin 1987; Soderstrom et al. 1998). Many
studies have documented debris around nest sites to benefit survival by hindering the
search image of potential predators (Cohen et al. 2008; Collins et al. 2009; Page et al.
2009). However, this is the first study to my knowledge that has linked debris as a
positive influence on brood survival for species with mobile young (although it is often
assumed; Powell 2001). Comparably, young plovers often respond to predators by
seeking cover (Powell and Collier 2000; Colwell et al. 2007a) beneath vegetation,
66
debris, or in the backing dunes. Although plovers typically leave the nest shortly after
hatching, chick are more likely to die in the first hours after hatching than in subsequent
time periods (Wolcott and Wolcott 1999; Colwell et al. 2007a). Consequently, debris
and the backing dunes at the immediate nest site likely provide camouflage for chicks
from potential predators.
The probability of fledging was related to predator abundance and ghost crabs
were the most observed predator species. Because ghost crabs often respond to
movement, they must taste objects to find stationary prey (Wolcott and Wolcott 1999).
Therefore, a greater percentage of debris around the nest may confuse ghost crabs and
decrease the probability of chick mortality. In addition, debris and dune cover likely
provide protection from other potential terrestrial and avian predators.
Human Activity
In contrast with previous work in other regions (Ruhlen et al. 2003; Colwell et al.
2007a), human activity had little influence on brood-site selection or survival during this
study. In California, Rhulen et al. (2003) observed disproportionate chick mortality over
weekends, which presumably coincided with greater human activity. Colwell et al.
(2007) observed lower chick survival on beach habitats, which maintained higher
human activity levels, when compared to gravel bars. In both of these studies, human
activity was never directly measured but assumed. The sites present in this study may
have lower disturbance levels than those reported from California. I did observe
differences in the amount of time required to reach a fully fledged state. In areas with
the highest levels of human disturbance, broods were not observed as fully fledged until
35-42 days. Whereas in breeding locations around North America, the average age of
fledging is 28 days (Warriner et al. 1986; Page et al. 2009). Additionally, several
67
studies suggest that benefits during the nesting stage with protection from human
disturbance (Lafferty et al. 2006; Lauten et al. 2007). However, current management
efforts to lessen the impacts of human disturbance focus solely on nesting habitat.
Therefore, I was not able to assess the potential influence of symbolic fencing on brood
survival beyond the immediate nest site.
Conclusions
My results provide insight for management and conservation problems, because
they show that one of the consequences of spatial variation in prey availability is that
some beach areas are used by a greater number of Snowy Plovers than are other
areas. Maintaining and creating high-prey foraging habitat, such as ephemeral pools,
should thus be an important part of Snowy Plover management along the Florida gulf
coast and likely for shorebird populations in other geographic regions. However, it is
inevitable that the human population will continue to grow and the consequent
disturbance and habitat alteration projects will also increase. Anthropogenic alteration
projects, such as beach renourishment, are gaining popularity in most coastal habitats
to combat beach erosion (Brown and McLachlan 2002), but beach renourishment may
directly decrease prey availability for shorebirds (see Peterson and Bishop 2005;
Peterson et al. 2006). Thus, given the increase use of coastal habitats as recreational
sites, it will be important to continue to evaluate the influence of human impacts in
relation to the spatial heterogeneity in prey availability and shorebird habitat use.
Much of the coastal beach habitats world-wide have been lost to development
(Brown and McLachlan 2002; Dugan and Hubbard 2006). The loss of beach habitat
continues at an alarming rate and as a consequence shorebird populations’ continue to
decline (Burger 2000). Conservationists have responded by protecting shorebird
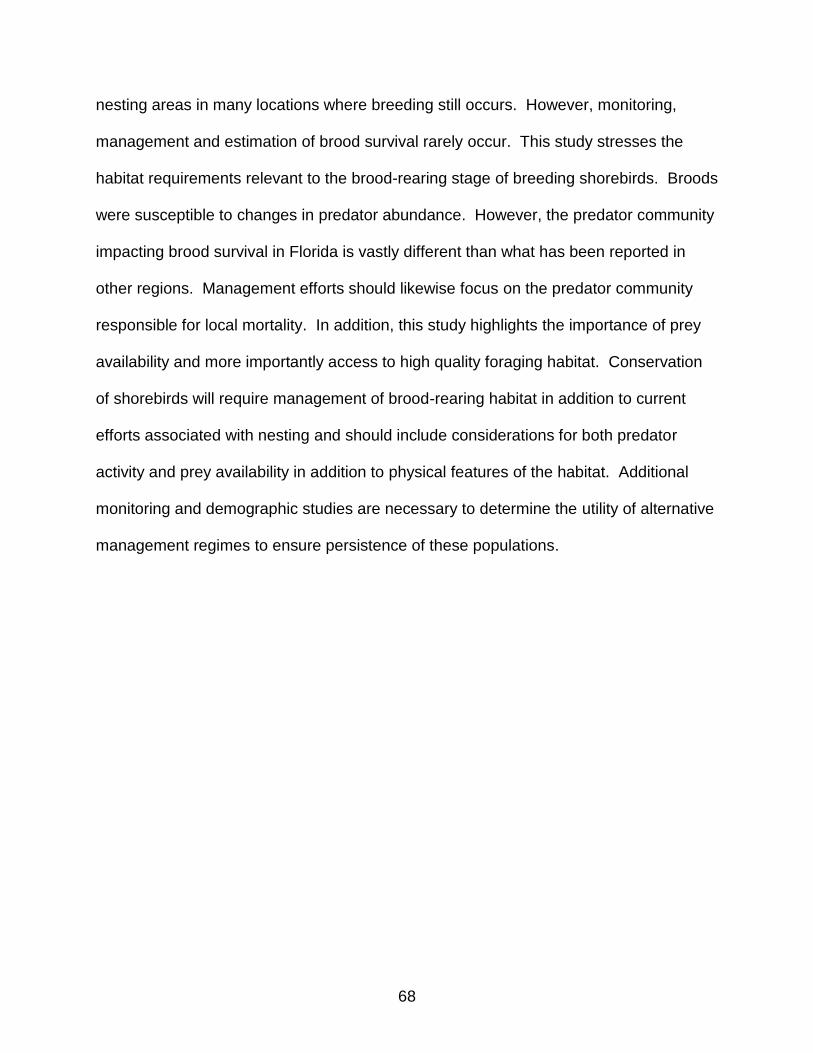
68
nesting areas in many locations where breeding still occurs. However, monitoring,
management and estimation of brood survival rarely occur. This study stresses the
habitat requirements relevant to the brood-rearing stage of breeding shorebirds. Broods
were susceptible to changes in predator abundance. However, the predator community
impacting brood survival in Florida is vastly different than what has been reported in
other regions. Management efforts should likewise focus on the predator community
responsible for local mortality. In addition, this study highlights the importance of prey
availability and more importantly access to high quality foraging habitat. Conservation
of shorebirds will require management of brood-rearing habitat in addition to current
efforts associated with nesting and should include considerations for both predator
activity and prey availability in addition to physical features of the habitat. Additional
monitoring and demographic studies are necessary to determine the utility of alternative
management regimes to ensure persistence of these populations.
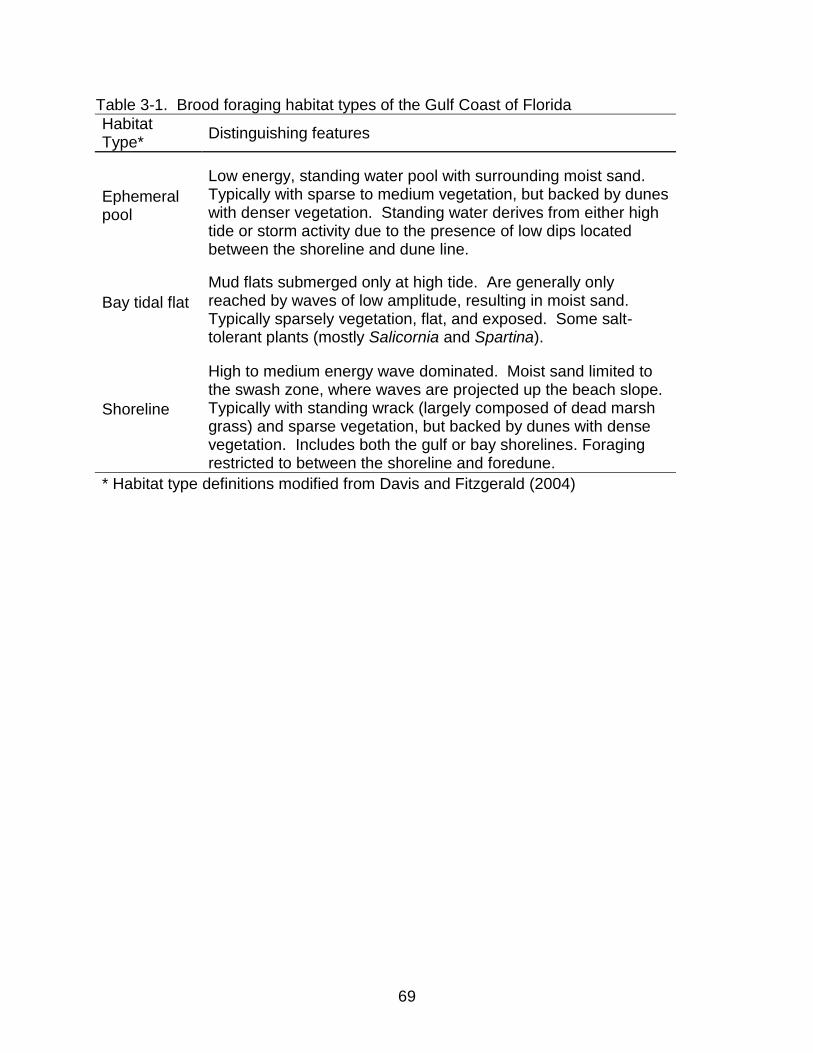
69
Table 3-1. Brood foraging habitat types of the Gulf Coast of Florida
Habitat Type*
Distinguishing features
Ephemeral pool
Low energy, standing water pool with surrounding moist sand. Typically with sparse to medium vegetation, but backed by dunes with denser vegetation. Standing water derives from either high tide or storm activity due to the presence of low dips located between the shoreline and dune line.
Bay tidal flat
Mud flats submerged only at high tide. Are generally only reached by waves of low amplitude, resulting in moist sand. Typically sparsely vegetation, flat, and exposed. Some salt-tolerant plants (mostly Salicornia and Spartina).
Shoreline
High to medium energy wave dominated. Moist sand limited to the swash zone, where waves are projected up the beach slope. Typically with standing wrack (largely composed of dead marsh grass) and sparse vegetation, but backed by dunes with dense vegetation. Includes both the gulf or bay shorelines. Foraging restricted to between the shoreline and foredune.
* Habitat type definitions modified from Davis and Fitzgerald (2004)
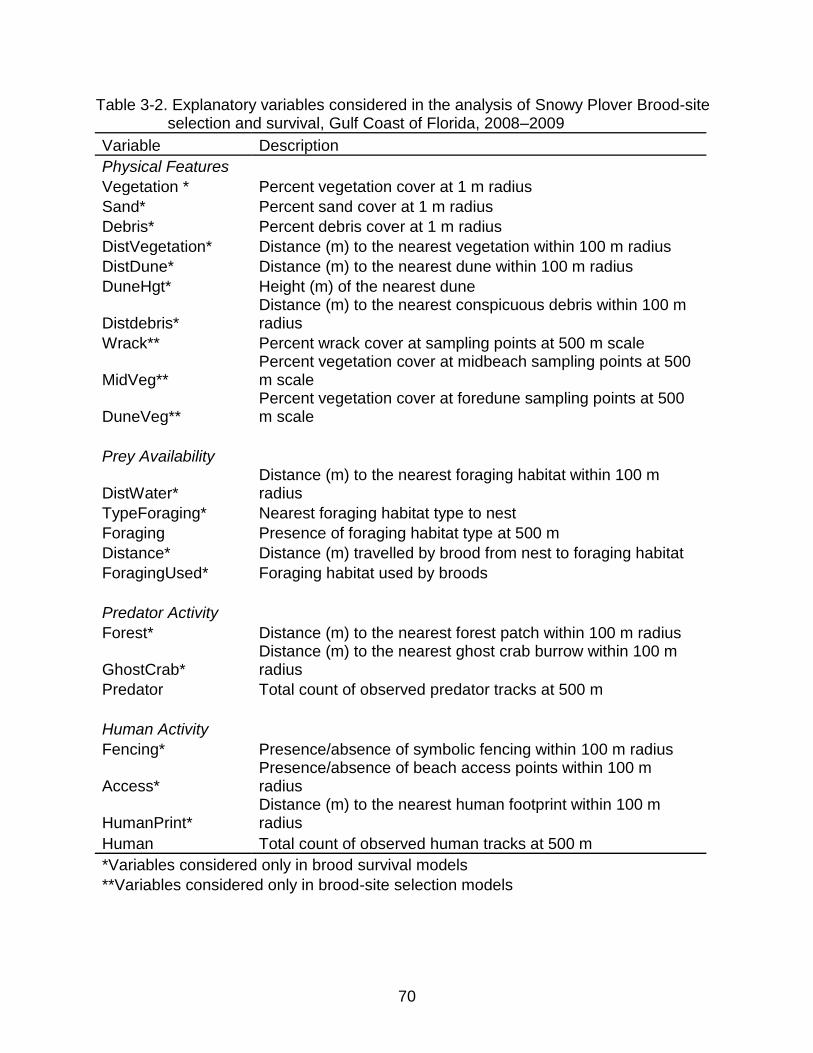
70
Table 3-2. Explanatory variables considered in the analysis of Snowy Plover Brood-site selection and survival, Gulf Coast of Florida, 2008–2009
Variable Description
Physical Features Vegetation * Percent vegetation cover at 1 m radius
Sand* Percent sand cover at 1 m radius
Debris* Percent debris cover at 1 m radius
DistVegetation* Distance (m) to the nearest vegetation within 100 m radius
DistDune* Distance (m) to the nearest dune within 100 m radius
DuneHgt* Height (m) of the nearest dune
Distdebris* Distance (m) to the nearest conspicuous debris within 100 m radius
Wrack** Percent wrack cover at sampling points at 500 m scale
MidVeg** Percent vegetation cover at midbeach sampling points at 500 m scale
DuneVeg** Percent vegetation cover at foredune sampling points at 500 m scale
Prey Availability
DistWater* Distance (m) to the nearest foraging habitat within 100 m radius
TypeForaging* Nearest foraging habitat type to nest
Foraging Presence of foraging habitat type at 500 m
Distance* Distance (m) travelled by brood from nest to foraging habitat
ForagingUsed* Foraging habitat used by broods
Predator Activity Forest* Distance (m) to the nearest forest patch within 100 m radius
GhostCrab* Distance (m) to the nearest ghost crab burrow within 100 m radius
Predator Total count of observed predator tracks at 500 m
Human Activity Fencing* Presence/absence of symbolic fencing within 100 m radius
Access* Presence/absence of beach access points within 100 m radius
HumanPrint* Distance (m) to the nearest human footprint within 100 m radius
Human Total count of observed human tracks at 500 m
*Variables considered only in brood survival models
**Variables considered only in brood-site selection models
71
Table 3-3. Brood-site selection models based on a priori hypotheses for Snowy Plovers (n=451) on the Gulf Coast of Florida, 2008, 2009. Models are ranked based on Akaike's Information Criterion for small samples (AICc), AICc is based on -2LL, which is the value of the maximized log-likelihood function of the model parameters given the data set, the number of parameters (K), and Δ AICc is the AICc differences relative to the smallest AICc in the model set.
Hypothesis* K AICc -2LL
Physical Features Wrack 2 555.71 -551.68
Prey Availability Foraging 3 485.41 -479.36
Predator Activity Predator 2 556.97 -552.94
Human Activity Human 2 559.11 -555.08
Intercept Only 1 559.14 -557.14
Best Additive Model** Foraging 3 485.41 -479.37
*Wrack= % standing wrack at sampling area, Foraging= type of foraging habitat present, Predator=predator density counts (500 m), Human= human density counts (500 m). **Best Additive Models include those < 2 ΔAICc from the best model.
Table 3-4. Number of chicks present from hatch to fledging by week, rows 1-4 represent
week in age of survival.
Week 2008 2009 Total Mortality*
0** 199 168 367 -
1 128 87 215 0.69
2 94 60 154 0.28
3 93 55 148 0.05
4 92 55 147 0.00
*Mortality = total lost from previous week to current week divided by the total number of chicks lost during the study **0 = day of hatching

72
Table 3-5. Brood survival models based on a priori hypotheses for Snowy Plovers (n=202) on the Gulf coast of Florida, 2008, 2009. Models are ranked based on Akaike's Information Criterion for small samples (AICc), AICc is based on -2LL, which is the value of the maximized log-likelihood function of the model parameters given the data set, the number of parameters (K), and Δ AICc is the AICc differences relative to the smallest AICc in the model set.
Hypothesis* K AICc -2LL
Physical Features DuneHgt+Debirs 3 494.06 -488.06
Prey Availability Foraging 3 476.77 -470.78
Predator Activity Predator 2 494.83 -490.82
Human Activity Human 2 500.02 -496.02
Intercept Only
1 498.85 -496.85
Best Additive Model DuneHgt+Shell+Foraging+Predator 6 465.17 -453.14
*DuneHgt= the height of the nearest primary dune (100 m), Debris= % shell and organic debris located around the immediate nest (1 m), Foraging= type of foraging habitat used by broods, Predator= density of predators (500 m) around the nest site, and Human= density of human beach traffic (500 m) around the nest site. **Best Additive Models include those < 2 ΔAICc from the best model.
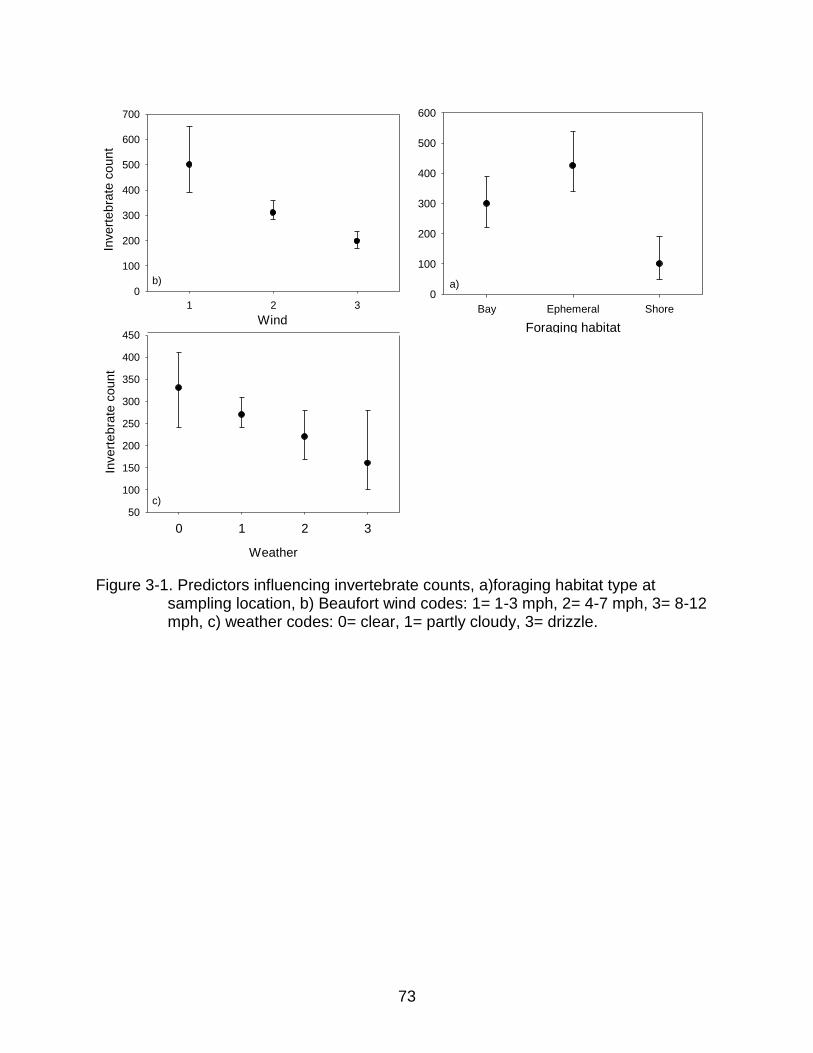
73
Figure 3-1. Predictors influencing invertebrate counts, a)foraging habitat type at sampling location, b) Beaufort wind codes: 1= 1-3 mph, 2= 4-7 mph, 3= 8-12 mph, c) weather codes: 0= clear, 1= partly cloudy, 3= drizzle.
Foraging habitat
Bay Ephemeral Shore
Invert
ebra
te c
ount
0
100
200
300
400
500
600
Wind
1 2 3
Invert
ebra
te c
ount
0
100
200
300
400
500
600
700
Weather
0 1 2 3
Invert
ebra
te c
ount
50
100
150
200
250
300
350
400
450
a)
b)
c)
Foraging habitat
Bay Ephemeral Shore
Inve
rte
bra
te c
ou
nt
0
100
200
300
400
500
600
Wind
1 2 3
Inve
rte
bra
te c
ou
nt
0
100
200
300
400
500
600
700
Weather
0 1 2 3
Inve
rte
bra
te c
ou
nt
50
100
150
200
250
300
350
400
450
a)
b)
c)
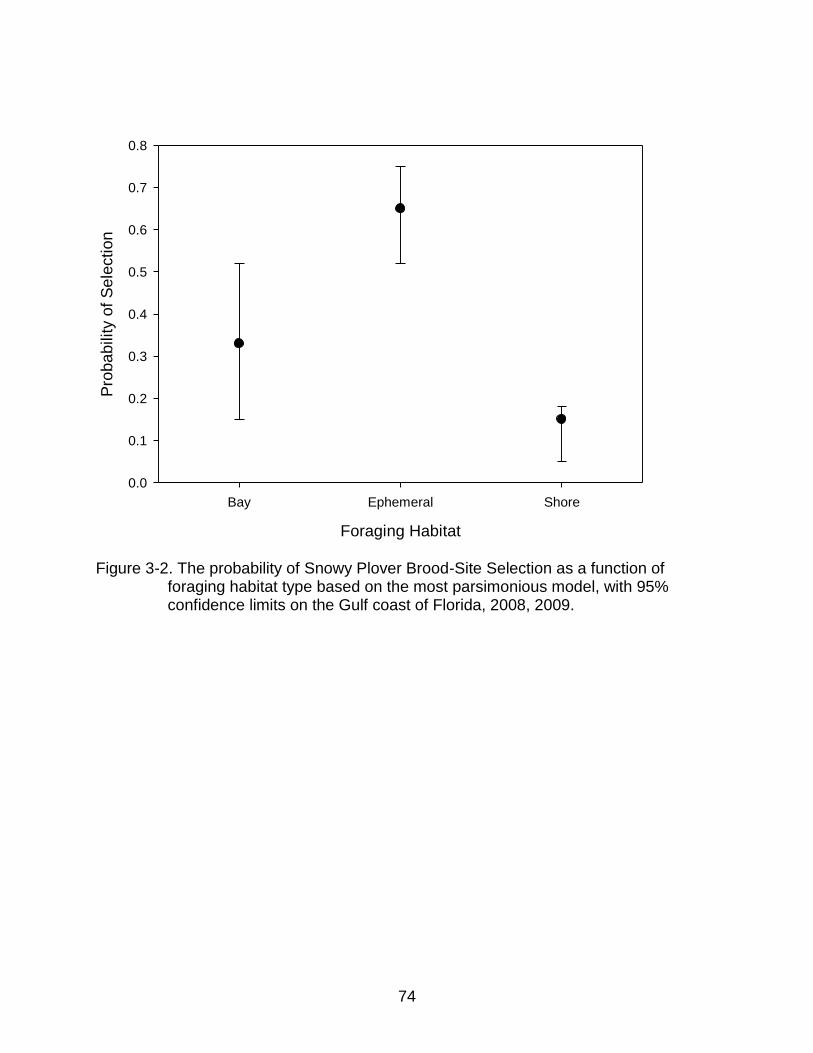
74
Foraging Habitat
Bay Ephemeral Shore
Pro
ba
bility o
f S
ele
ctio
n
0.0
0.1
0.2
0.3
0.4
0.5
0.6
0.7
0.8
Figure 3-2. The probability of Snowy Plover Brood-Site Selection as a function of foraging habitat type based on the most parsimonious model, with 95% confidence limits on the Gulf coast of Florida, 2008, 2009.
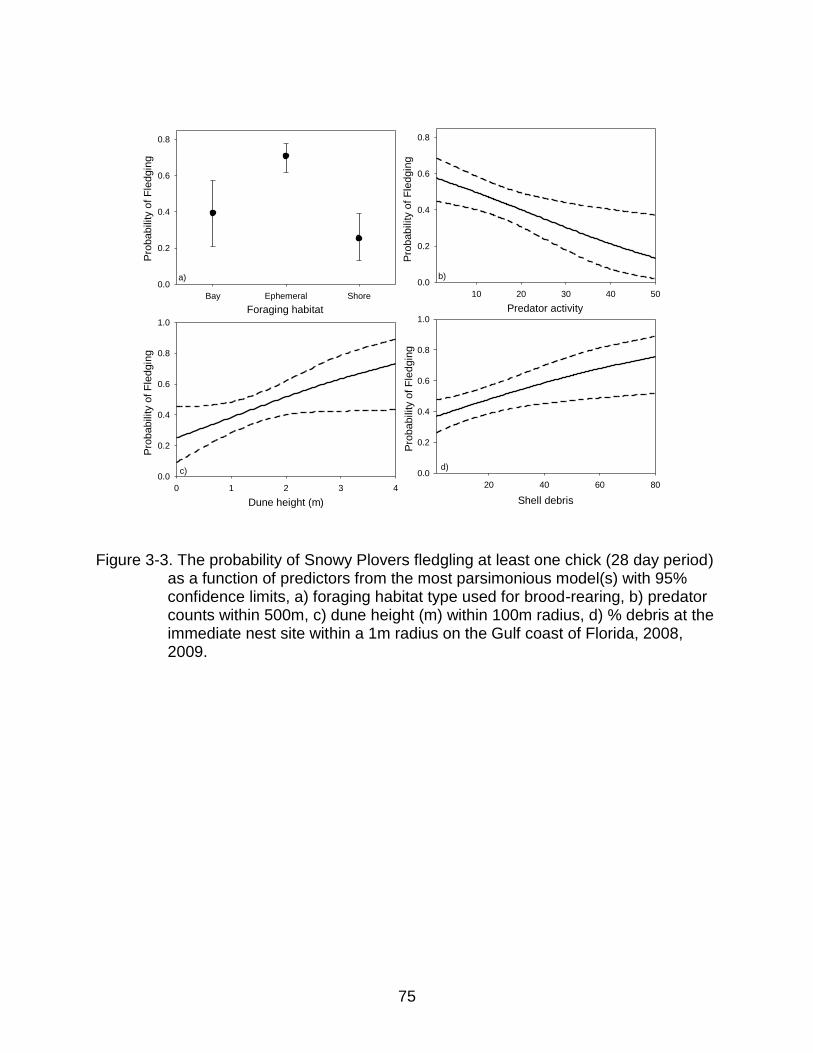
75
Predator activity
10 20 30 40 50
Pro
bab
ility o
f F
ledgin
g
0.0
0.2
0.4
0.6
0.8
Dune height (m)
0 1 2 3 4
Pro
bab
ility o
f F
ledgin
g
0.0
0.2
0.4
0.6
0.8
1.0
Shell debris
20 40 60 80
Pro
bab
ility o
f F
ledgin
g
0.0
0.2
0.4
0.6
0.8
1.0Foraging habitat
Bay Ephemeral Shore
Pro
bab
ility o
f F
ledgin
g
0.0
0.2
0.4
0.6
0.8
a) b)
c) d)
Figure 3-3. The probability of Snowy Plovers fledgling at least one chick (28 day period)
as a function of predictors from the most parsimonious model(s) with 95% confidence limits, a) foraging habitat type used for brood-rearing, b) predator counts within 500m, c) dune height (m) within 100m radius, d) % debris at the immediate nest site within a 1m radius on the Gulf coast of Florida, 2008, 2009.
76
CHAPTER 4 SYNTHESIS, MANAGEMENT AND RECOMMENDATIONS FOR FUTURE
RESEARCH
During both nesting and brood-rearing stages of breeding, Snowy Plover selection
of habitat and productivity are influenced by a combination of factors including human
disturbance, predator abundance, prey availability and the physical features of the
habitat. However, there were marked distinctions in the factors influencing the two
breeding stages (nesting and brood-rearing). Differences are not surprising, given the
differences in mobility between stages (i.e., sessile vs. mobile). The impacts of human
disturbance provided the greatest dichotomy between these two stages of breeding.
Human Disturbance
Symbolic fencing. This study documented increased probability of nest-site
selection and a resulting benefit in terms of nest survival with the presence of symbolic
fencing to prevent the impacts from human disturbance. However, I observed little
direct influence from the impacts of human activity. However, current efforts to
minimize the impacts of human disturbance through symbolic fencing are limited to nest
sites. It may be possible to improve brood survival rates with the placement of symbolic
fencing around high quality brood-rearing areas such as ephemeral pools and bay tidal
flats (where brood survival rates were lower but could be higher based on prey
availability). Posting of ephemeral pools will likely improve brood survival, but will
additionally contribute to nest survival. Nest-site selection was positively influenced by
the presence of ephemeral pools; however nests in close proximity to foraging habitat
were less likely to hatch. Therefore, the placing of fencing around this habitat type will
likely improve the nesting habitat as well and limit the distance travelled by individual
broods. However, predatory birds have been observed using fencing materials for
77
perching. Therefore, future research on the benefits of protecting brood-rearing habitats
should be conducted before the wide-scale use of symbolic fencing at all foraging
habitats. Additionally, further work with direct human disturbance is needed to
determine the spatial extent of disturbance under varying background disturbance
levels. Such research with disturbance will determine the spatial buffers needed for the
placement of symbolic fencing under different disturbance levels throughout Florida and
other regions of North America.
Pet disturbance. Pets, particularly dogs, are prohibited by law on most public
beaches in Florida. However, pets are extremely common on beaches. In fact, there
has been a growing trend towards the establishment of dog parks, as well as dog
owners that do not abide by existing dog restrictions, and a lack of adequate
enforcement of those restrictions. Birds are particularly sensitive to disturbance by dogs.
This sensitivity is illustrated by observations that Snowy Plovers react at twice the
approach distance by dogs than by pedestrians (Lafferty 2001a). Although pets do not
remove habitat or necessarily kill birds directly, disturbances cause birds to suspend
feeding and/or expend energy while in flight, moving on the ground, or maintaining
vigilance (Burger 1994; Lafferty 2001a), and may directly result in loss of eggs and
chicks due to exposure. Further research is needed to determine the spatial extent of
disturbance and to quantify whether such disturbances have effects on the reproductive
performance of Snowy Plovers.
Chick development. Although my study showed little influence of human activity
on brood survival, I observed differences in the amount of time required to reach a fully
fledged state. In areas with the highest levels of human disturbance, broods were not

78
observed as fully fledged until 35-42 days. Whereas in breeding locations around North
America, the average age of fledging is 28 days (Warriner et al. 1986; Page et al. 2009).
Although I collected mass and tarsus length at hatch day, these measurements had no
influence on the probability of fledging or with the level of human disturbance at each of
the nesting sites. Researchers documented a relationship between growth and prey
availability through capturing and measuring chicks on a weekly basis (Kosztolanyi et al.
2007). A similar approach with chick development in relationship to human disturbance
would aid in understanding the impacts of human activity in chick growth.
Beach renourishment. Currently, anthropogenic alteration projects (e.g. beach
renourishment) are popular in most coastal habitats to combat beach erosion (Brown
and McLauchlan 2002). However, based on the findings of this study, such practice is
likely detrimental to brood survival. During the process of renourishment, sand from the
sea floor is dumped on the beach surface. Post-renourished beaches are typically
composed of bare sand with very little organic or shell debris. The reduction in
availability of beach debris may negatively influence survival by reducing chick
concealment from potential predators. In addition, current renourishment practices
impact prey availability in two ways. Prey availability tends to decline temporarily
directly after renourishment (Dugan and Hubbard 2006; Peterson et al. 2006). More
importantly however, in this system, ephemeral pools were both selected for and
positively influenced survival. These pools are created from low dips located between
the shoreline and dune line (Davis and Fitzgerald 2004). Renourishment typically
results in level flat beaches decreasing the probability of ephemeral pool formation. At
altered beach sites, maintaining and creating high-prey foraging habitat, such as
79
ephemeral pools, should be an important part of Snowy Plover management along the
Florida gulf coast and likely for plover populations in other geographic regions. Thus,
monitoring the consequences of such engineering activities and the potential impacts to
foraging habitat availability is of general interest to the conservation of shorebirds in
coastal habitats. Secondarily, the development of techniques to create high quality
brood-rearing habitat in connection with current beach renourishment projects is
needed.
Sea turtle surveys. Management for one species does not always positively
benefit others species present in a given habitat. Snowy Plover nest survival was
negatively influenced by beach width (i.e. distance from shoreline to nest). Turtle
surveyors on ATVs use the shoreline for daily nest monitoring and ATV use in close
proximity to nests often leads to a greater frequency of flushing. On most Florida
beaches surveys take place daily from May to October (J. Mitchell pers Com.), during
large portions of the Snowy Plover breeding season. The impact to shorebirds and
seabirds of these intensive surveys is currently unknown. Turtle surveys typically take
place between sunset and 10 am (J. Mitchell pers Com.), overlapping the time for which
ghost crabs are primarily active (Wolcott and Wolcott 1999). It is possible that predation
occurs because of the timing of which plovers are flushed from the nest. Consequently,
they are most susceptible to ghost crab predation because crabs are more likely to be
active. Unfortunately, in this study we were unable to test the influence of turtle surveys
because surveying occurred at all sites equally. However, I did observe ATV tracks
from turtle surveys less than 1 m from unmarked active nests on more than one
occasion. In addition, Epstein (1999), while monitoring sea turtles, observed less direct
80
impacts to marked Wilson’s plover nests. However, this same study observed mortality
of chicks that were crushed via ATVs. Chicks are mobile and therefore cannot be
marked to inform turtle surveyors of their locations. Further research on the potential
impacts to other coastal species from current sea turtle surveys is needed. In addition,
education and coordination between managers, researchers, and surveyors of all
coastal species is essential for conservation of coastal-dependent species.
Predator Activity
This study highlighted a unique and important predator for Snowy Plovers,
apparently unique to the Florida population, the ghost crab. Ghost crabs influenced
nest-site selection and nest and brood survival. Although, it seems clear that ghost
crabs are impacting Snowy Plover habitat use and productivity, the mechanisms
underlying this interaction are unclear. Without knowledge of the mechanisms resulting
in predation, it is impossible to manage for the impacts related to ghost crabs. Further
work with ghost crab predation and human disturbance stimuli is needed.
The relationship between human disturbance and ghost crab densities has led to
many contradictory results. Some research says there is a negative relationship in crab
numbers in relation to human disturbance (Barros 2001; Neves and Bemvenuti 2006).
Other studies suggest an increase in crab numbers due to the garbage and food
remains left by beach-goers (Strachan et al. 1999). It is possible that there are many
thresholds in both human and ghost crab densities that when combined impact plover
productivity. For example, sites located in peninsular Florida (e.g., Sanibel Island)
exhibit high fledge rates at areas with very high human disturbance levels (Smith and
Faillace 2006). However, ghost crabs are essentially absent at these sites due to high
human disturbance (B. Smith pers Com.). At the other end of the spectrum, sites with

81
very little human disturbance (e.g., St. Vincent NWR) had low occurrence of ghost crab
depredation events although ghost crab densities were similar to surrounding sites. It
appears that plovers are impacted at locations where high ghost crab and human
densities overlap.
Predator removal programs may have unforeseen consequences for nesting
beaches by impacting the community structure (Stapp 1997). For example Barton and
Roth (2008) observed greater numbers of sea turtle nests depredated by ghost crabs
after raccoons were removed. At many coastal beach habitats extensive predator
control programs are in place in efforts to protect sea turtle nests. However, rarely are
the predator communities evaluated before or after control efforts. Therefore, the
benefits from predator control and the potential impacts to other coastal beach species
(e.g., shorebirds, beach mice) remain unclear. Because ghost crabs can reach high
densities in the absence of heavy predation (Burggren and McMahon 2009), predator
removal experiments should be conducted to determine if current predator removal
efforts are effective for shorebirds, seabirds, and sea turtle productivity on Florida’s Gulf
Coast beaches. Additionally, because ghost crabs are far too numerous to control and
there appears to be an interaction between human disturbance stimuli and ghost crab
depredation, the protection of habitat from human disturbance would likely have the
most influential impact in preventing ghost crab predation.
Beyond Productivity
Based on the results of this study, we now have broad-scale estimates for hatch
and fledge rates for Snowy Plovers nesting in Florida, but juvenile survival rates and
adult survival remain unknown. Such information is necessary for estimating population
growth rates and understanding the ability of these populations to persist into the future.
82
Based on past state-wide counts since 1989, the plover population has changed very
little (Himes et al. 2007). However, based on the current hatch and fledge rates, we
should expect an increase in the breeding population. Either birds are dispersing
outside of the state or survival during the juvenile stage is impacting the adult breeding
population. However, during the course of this study, juvenile return rates were
relatively high (45.6%) and were comparable to natal return rates observed for Snowy
Plovers in other geographic locations (see Colwell et al. 2007b; Lauten et al. 2007)
The hatch rates observed in this study were influenced by the protection of nests
from human disturbance. However, wide-scale management to protect nesting habitat
from human disturbance has only been conducted over the past five years. In addition,
periodic hurricanes may have an impact on both juvenile and adult survival. Despite the
impacts from hurricanes on Florida’s coastline, there has been little attention focused on
how these impacts influence shorebird survival. Continuation of banding and resighting
efforts is needed in Florida to determine juvenile and adult survival and to tease apart
these potential influences.
Winter dispersal And Habitat Requirements
Study of the migration and winter destinations of Snowy Plovers in Florida and the
rest of the southeast are required to clarify where interior and coastal populations spend
the non-breeding season (Himes et al. 2007). The monitoring of currently marked
individuals during the winter will allow for determination of non-breeding movements
and determination of whether the Florida population is a resident or migratory between
breeding seasons. Monitoring during the winter season will also provide a better
understanding of winter habitat requirements for plovers and other shorebirds. During
the breeding season I observed consistent use of ephemeral pool foraging habitats.
83
However, I also observed a shift in increasing use of bay tidal flats upon fledging. The
potential shift in habitat use post-breeding is currently unclear. Conservation of this
species and other coastal breeders will require understanding and management of both
breeding and wintering habitat requirements.
The Florida panhandle serves as an important breeding area for Snowy Plovers
and provides one of the last large contiguous tracts of breeding habitat available to
them in this region (Himes et al. 2007). With this study I illustrated the influence of
human activity, predator activity, prey availability and physical features of the habitat on
Snowy Plover site selection and survival during nesting and brood-rearing stages.
Continued efforts to advance our understanding of habitat requirements, long-term
survival and the influence of direct human disturbance are necessary in order to expand
effective methods for management and conservation of Snowy Plovers and other
shorebird species.

84
APPENDIX A SPEARMAN’S RANK NON-PARAMETRIC CORRELATION MATRIX FOR VARIABLES
INCLUDED IN NEST-SITE SELECTION MODELS

85
Fencing DistVeg Veg Sand Debris DistWater DistDune TypeForaging Forest
Fencing 1.00 -0.08 -0.02 -0.23 0.27 0.18 -0.01 -0.24 -0.11
Distveg -0.08 1.00 -0.87 0.42 0.29 -0.41 0.39 0.19 -0.03
Veg -0.02 -0.87 1.00 -0.39 -0.46 0.33 -0.30 -0.14 0.10
Sand -0.23 0.42 -0.39 1.00 -0.33 -0.27 0.12 0.19 0.02
Debris 0.27 0.29 -0.46 -0.33 1.00 -0.08 0.13 -0.11 -0.21
DistWater 0.18 -0.41 0.33 -0.27 -0.08 1.00 -0.29 0.06 0.00
DistDune -0.01 0.39 -0.30 0.12 0.13 -0.29 1.00 0.03 -0.04
TypeForaging -0.24 0.19 -0.14 0.19 -0.11 0.06 0.03 1.00 0.23
Forest -0.11 -0.03 0.10 0.02 -0.21 0.00 -0.04 0.23 1.00
DuneHgt -0.21 0.06 0.01 0.09 -0.18 -0.03 0.03 0.17 0.10
Distdebris -0.24 0.21 -0.07 0.39 -0.31 -0.26 0.13 0.22 0.24
Ghostcrab 0.21 0.00 -0.12 -0.13 0.28 0.24 0.03 -0.15 -0.13
Access 0.24 0.02 0.04 -0.08 0.02 -0.06 0.10 -0.33 -0.24
DistHuman 0.08 -0.27 0.21 -0.18 -0.08 0.46 -0.13 -0.13 0.10
Predtracks -0.04 0.05 -0.02 0.10 -0.10 -0.08 0.01 0.14 0.10
Human 0.16 -0.05 0.08 -0.03 -0.02 -0.03 0.01 -0.11 -0.12
Foraging 0.18 -0.13 0.07 -0.10 0.06 0.08 -0.03 -0.32 -0.22

86
DuneHgt DistDebris GhostCrab Access DistHuman Predator Human Foraging
Fencing -0.21 -0.24 0.21 0.24 0.08 -0.04 0.16 0.18
Distveg 0.06 0.21 0.00 0.02 -0.27 0.05 -0.05 -0.13
Veg 0.01 -0.07 -0.12 0.04 0.21 -0.02 0.08 0.07
Sand 0.09 0.39 -0.13 -0.08 -0.18 0.10 -0.03 -0.10
Debris -0.18 -0.31 0.28 0.02 -0.08 -0.10 -0.02 0.06
Distwater -0.03 -0.26 0.24 -0.06 0.46 -0.08 -0.03 0.08
DistDune 0.03 0.13 0.03 0.10 -0.13 0.01 0.01 -0.03
TypeForaging 0.17 0.22 -0.15 -0.33 -0.13 0.14 -0.11 -0.32
Forest 0.10 0.24 -0.13 -0.24 0.10 0.10 -0.12 -0.22
HgtDune 1.00 0.11 -0.11 -0.11 0.00 0.19 -0.07 -0.05
Distdebris 0.11 1.00 -0.27 0.01 -0.23 0.03 -0.01 -0.16
Ghostcrab -0.11 -0.27 1.00 0.07 0.10 -0.11 -0.02 0.14
Access -0.11 0.01 0.07 1.00 -0.20 -0.19 0.17 0.22
DistHuman 0.00 -0.23 0.10 -0.20 1.00 0.05 -0.22 0.11
Predator 0.19 0.03 -0.11 -0.19 0.05 1.00 0.15 -0.10
Human -0.07 -0.01 -0.02 0.17 -0.22 0.15 1.00 -0.09
Foraging -0.05 -0.16 0.14 0.22 0.11 -0.10 -0.09 1.00
87
APPENDIX B SPERMAN’S RANK NON-PARAMETRIC CORRELATION MATRIX FOR VARIABLES
INCLUDED IN NEST SURVIAL MODELS

88
Posted Veg Sand Debris DistWater TypeForaging DistDune DuneHgt
Posted 1.00 -0.07 -0.09 0.16 0.01 -0.15 0.17 -0.14
Veg -0.07 1.00 0.00 -0.52 -0.04 -0.13 -0.23 -0.02
Sand -0.09 0.00 1.00 -0.61 0.08 0.04 -0.08 0.15
Debris 0.16 -0.52 -0.61 1.00 -0.06 0.00 0.28 -0.14
DistWater 0.01 -0.04 0.08 -0.06 1.00 0.38 -0.03 -0.05
TypeForaging -0.15 -0.13 0.04 0.00 0.38 1.00 -0.03 0.13
DistDune 0.17 -0.23 -0.08 0.28 -0.03 -0.03 1.00 -0.10
DuneHgt -0.14 -0.02 0.15 -0.14 -0.05 0.13 -0.10 1.00
Forest 0.05 0.00 0.10 -0.11 0.20 0.17 -0.06 -0.01
DistVeg 0.11 -0.78 -0.03 0.45 -0.03 0.06 0.26 0.08
DistDebris 0.21 0.08 -0.01 -0.01 0.03 0.01 -0.03 -0.01
GhostCrab 0.04 -0.18 -0.01 0.12 0.14 -0.05 0.22 -0.09
Access 0.46 0.06 -0.14 0.07 0.01 -0.29 0.17 -0.11
DistHuman -0.12 0.03 0.11 -0.08 0.22 -0.06 -0.06 0.02
Predator 0.00 -0.05 0.13 -0.13 -0.18 0.11 -0.05 0.20
Human 0.18 0.03 0.06 -0.05 -0.10 -0.11 -0.03 0.00
Foraging 0.00 0.08 0.04 -0.06 -0.06 -0.27 0.08 -0.05

89
Forest DistVeg DistDebris GhostCrab Access DistHuman Predator Human Foraging
Posted 0.05 0.11 0.21 0.12 0.46 -0.12 0.00 0.18 0.00
Vegetation 0.00 -0.78 0.08 -0.18 0.06 0.03 -0.05 0.03 0.08
Sand 0.10 -0.03 -0.01 0.03 -0.14 0.11 0.13 0.06 0.04
Shell -0.11 0.45 -0.01 0.14 0.07 -0.08 -0.13 -0.05 -0.06
Distwater 0.20 -0.03 0.03 0.11 0.01 0.22 -0.18 -0.10 -0.06
Typewater 0.17 0.06 0.01 0.02 -0.29 -0.06 0.11 -0.11 -0.27
Distdune -0.06 0.26 -0.03 0.13 0.17 -0.06 -0.05 -0.03 0.08
Dunehgt -0.01 0.08 -0.01 -0.05 -0.11 0.02 0.20 0.00 -0.05
Forest 1.00 -0.01 0.19 0.02 -0.10 0.12 0.08 -0.03 -0.15
Distveg -0.01 1.00 -0.07 0.17 0.04 -0.03 0.09 -0.04 -0.05
Distdebris 0.19 -0.07 1.00 0.06 0.02 -0.03 -0.09 0.01 -0.08
crabfirst 0.07 0.20 0.03 0.17 0.16 0.07 -0.13 -0.03 0.08
Access -0.10 0.04 0.02 0.06 1.00 -0.16 -0.14 0.07 0.25
human 0.12 -0.03 -0.03 -0.07 -0.16 1.00 0.06 -0.18 0.07
Pred 0.08 0.09 -0.09 0.00 -0.14 0.06 1.00 0.26 -0.08
Tracks -0.03 -0.04 0.01 -0.03 0.07 -0.18 0.26 1.00 -0.17
Foraging -0.15 -0.05 -0.08 0.01 0.25 0.07 -0.08 -0.17 1.00

90
APPENDIX C SPEARMAN’S RANK NON-PARAMETRIC CORRELATION MATRIX FOR VARIABLES
INCLUDED IN BROOD-SITE SELECTION MODELS
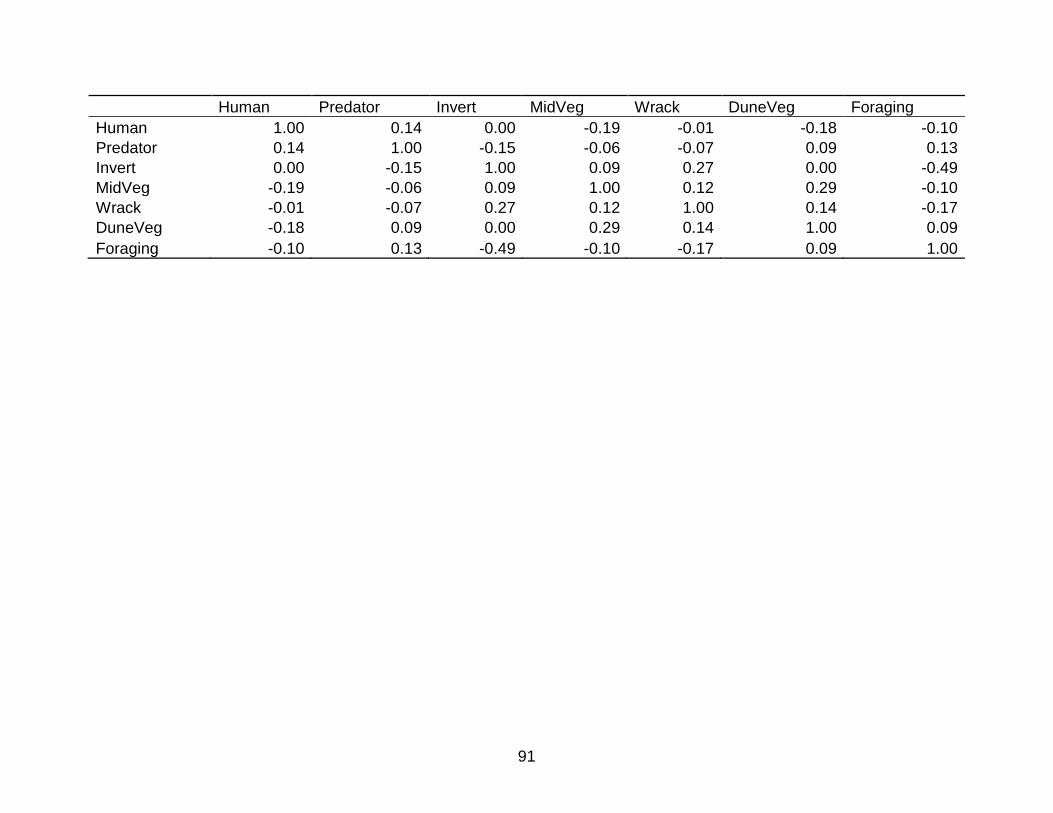
91
Human Predator Invert MidVeg Wrack DuneVeg Foraging
Human 1.00 0.14 0.00 -0.19 -0.01 -0.18 -0.10
Predator 0.14 1.00 -0.15 -0.06 -0.07 0.09 0.13
Invert 0.00 -0.15 1.00 0.09 0.27 0.00 -0.49
MidVeg -0.19 -0.06 0.09 1.00 0.12 0.29 -0.10
Wrack -0.01 -0.07 0.27 0.12 1.00 0.14 -0.17
DuneVeg -0.18 0.09 0.00 0.29 0.14 1.00 0.09
Foraging -0.10 0.13 -0.49 -0.10 -0.17 0.09 1.00

92
APPENDIX D SPEARMAN’S RANK NON-PARAMETRIC CORRELATION MATRIX FOR VARIABLES
INCLUDED IN BROOD SURVIVAL MODELS
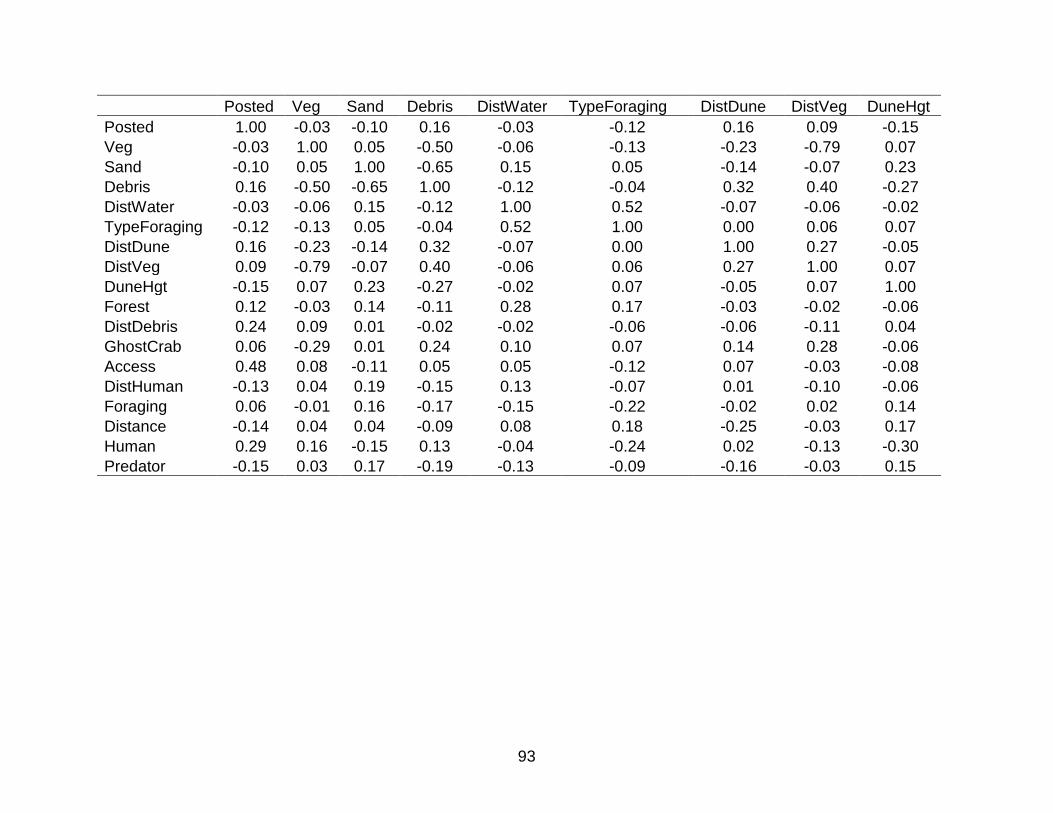
93
Posted Veg Sand Debris DistWater TypeForaging DistDune DistVeg DuneHgt
Posted 1.00 -0.03 -0.10 0.16 -0.03 -0.12 0.16 0.09 -0.15
Veg -0.03 1.00 0.05 -0.50 -0.06 -0.13 -0.23 -0.79 0.07
Sand -0.10 0.05 1.00 -0.65 0.15 0.05 -0.14 -0.07 0.23
Debris 0.16 -0.50 -0.65 1.00 -0.12 -0.04 0.32 0.40 -0.27
DistWater -0.03 -0.06 0.15 -0.12 1.00 0.52 -0.07 -0.06 -0.02
TypeForaging -0.12 -0.13 0.05 -0.04 0.52 1.00 0.00 0.06 0.07
DistDune 0.16 -0.23 -0.14 0.32 -0.07 0.00 1.00 0.27 -0.05
DistVeg 0.09 -0.79 -0.07 0.40 -0.06 0.06 0.27 1.00 0.07
DuneHgt -0.15 0.07 0.23 -0.27 -0.02 0.07 -0.05 0.07 1.00
Forest 0.12 -0.03 0.14 -0.11 0.28 0.17 -0.03 -0.02 -0.06
DistDebris 0.24 0.09 0.01 -0.02 -0.02 -0.06 -0.06 -0.11 0.04
GhostCrab 0.06 -0.29 0.01 0.24 0.10 0.07 0.14 0.28 -0.06
Access 0.48 0.08 -0.11 0.05 0.05 -0.12 0.07 -0.03 -0.08
DistHuman -0.13 0.04 0.19 -0.15 0.13 -0.07 0.01 -0.10 -0.06
Foraging 0.06 -0.01 0.16 -0.17 -0.15 -0.22 -0.02 0.02 0.14
Distance -0.14 0.04 0.04 -0.09 0.08 0.18 -0.25 -0.03 0.17
Human 0.29 0.16 -0.15 0.13 -0.04 -0.24 0.02 -0.13 -0.30
Predator -0.15 0.03 0.17 -0.19 -0.13 -0.09 -0.16 -0.03 0.15
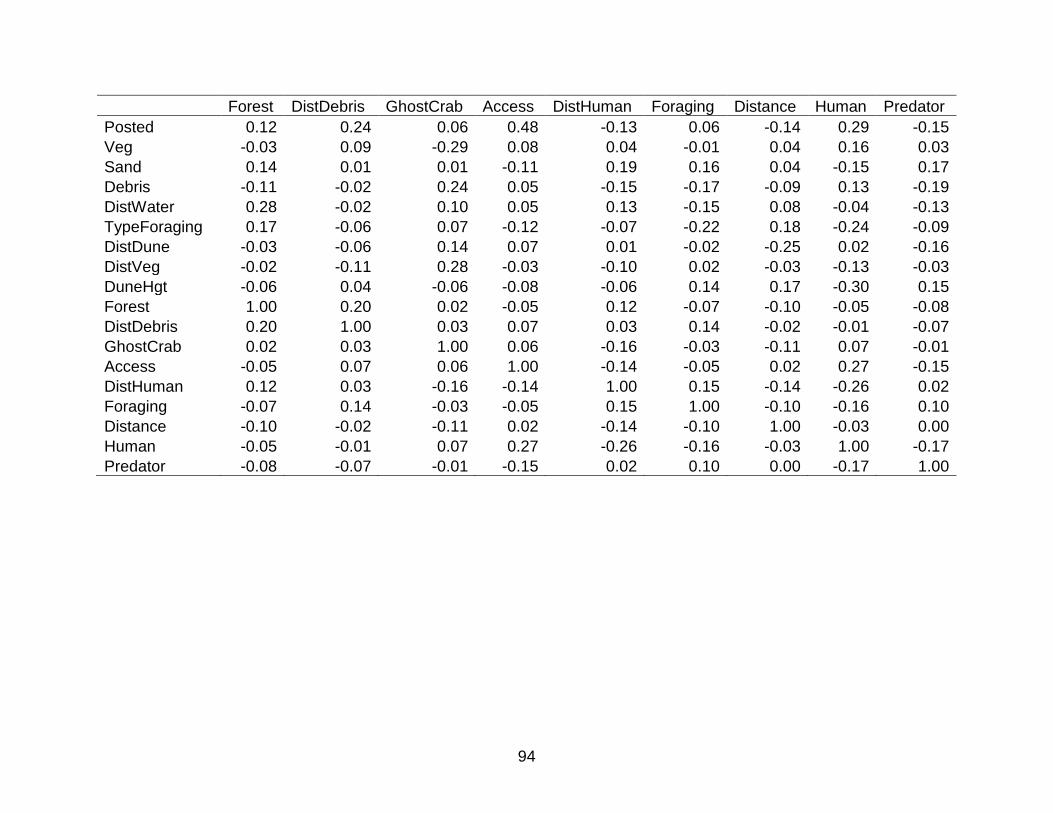
94
Forest DistDebris GhostCrab Access DistHuman Foraging Distance Human Predator
Posted 0.12 0.24 0.06 0.48 -0.13 0.06 -0.14 0.29 -0.15
Veg -0.03 0.09 -0.29 0.08 0.04 -0.01 0.04 0.16 0.03
Sand 0.14 0.01 0.01 -0.11 0.19 0.16 0.04 -0.15 0.17
Debris -0.11 -0.02 0.24 0.05 -0.15 -0.17 -0.09 0.13 -0.19
DistWater 0.28 -0.02 0.10 0.05 0.13 -0.15 0.08 -0.04 -0.13
TypeForaging 0.17 -0.06 0.07 -0.12 -0.07 -0.22 0.18 -0.24 -0.09
DistDune -0.03 -0.06 0.14 0.07 0.01 -0.02 -0.25 0.02 -0.16
DistVeg -0.02 -0.11 0.28 -0.03 -0.10 0.02 -0.03 -0.13 -0.03
DuneHgt -0.06 0.04 -0.06 -0.08 -0.06 0.14 0.17 -0.30 0.15
Forest 1.00 0.20 0.02 -0.05 0.12 -0.07 -0.10 -0.05 -0.08
DistDebris 0.20 1.00 0.03 0.07 0.03 0.14 -0.02 -0.01 -0.07
GhostCrab 0.02 0.03 1.00 0.06 -0.16 -0.03 -0.11 0.07 -0.01
Access -0.05 0.07 0.06 1.00 -0.14 -0.05 0.02 0.27 -0.15
DistHuman 0.12 0.03 -0.16 -0.14 1.00 0.15 -0.14 -0.26 0.02
Foraging -0.07 0.14 -0.03 -0.05 0.15 1.00 -0.10 -0.16 0.10
Distance -0.10 -0.02 -0.11 0.02 -0.14 -0.10 1.00 -0.03 0.00
Human -0.05 -0.01 0.07 0.27 -0.26 -0.16 -0.03 1.00 -0.17
Predator -0.08 -0.07 -0.01 -0.15 0.02 0.10 0.00 -0.17 1.00
95
LIST OF REFERENCES
Allen, M. C., and A. J. Read. 2000. Habitat selection of foraging bottlenose dolphins in relation to boat density near Clearwater, Florida. Marine Mammal Science 16:815-824.
Anderson, D.R. 2008. Model based inference in the Life Sciences. Springer-Science+ Business Media, LLC. New York.
Andren, H. 1995. Effects of landscape composition on pre- dation rates at habitat edges. Pages 225-255 in L. Hansson, L. Fahrig, and G. Merriam, editors. Mosaic landscapes and ecological processes. Chapman and Hall, London, UK.
Angelstam, P. 1986. Predation on ground-nesting birds’ nests in relation to predator densities and habitat edge. Oikos 47:365-373.
Barros, F. 2001. Ghost crabs as a tool for rapid assessment of human impacts on exposed sandy beaches. Biological Conservation 97:399-404.
Barton, B.T., and J.D. Roth. 2007. Raccoon removal on sea turtle nesting beaches. Journal of Wildlife Management 71:1234-1237.
Baudains, T.P., and P. Lloyd. 2007. Habituation and habitat changes can moderate the impacts of human disturbance on shorebird breeding performance. Animal Conservation 10: 400-407.
Bennett, J. and G. E. Wallace. 2001. An Annotated Bibliography for the Snowy Plover (Charadrius alexandrinus) in Florida. Florida Fish and Wildlife Conservation Commission, Tallahassee, Florida.
Benson, T.J., N.M. Anich, J.D. Brown, and J.C. Bednarz. 2010. Habitat and landscape effects on brood parasitism, nest survival, and fledgling production in Swainson’s warblers. Journal of Wildlife Management 74:81-93.
Berger, J. 1991. Pregnancy incentives, predation constraints and habitat shifts: experimental and field evidence for wild bighorn sheep. Animal Behavior 41:61-77.
Bider, J.R. 1968. Animal activity in uncontrolled terrestrial communities as determined by a sand transect technique. Ecological Monographs 38:269-308.
Bliss, C.I., and R.A. Fisher. 1953. Fitting the negative binomial distribution to biological data- note on the efficient fitting of the negative binomial. Biometrics 9:176-200.
Block, W.M., and L.A. Brennan. 1993. The habitat concept in ornithology: Theory and applications. Current Ornithology 11:35-91.
96
Bolten, M, N. Butcher, F. Sharpe, D. Stevens, and G. Fisher. 2007. Remote monitoring of nests using digital camera technology. Journal of Field Ornithology 78:213-220.
Brown, A.C., and A. McLachlan. 2002. Sandy shore ecosystems and the threats facing them: some predictions for the year 2025. Environmental Conservation 29:62-77.
Budnik, J.M., F.R. Thompson, and M.R. Ryan. 2002. Effects of habitat characteristics on the probability of paratisism and predation of Bell’s vireo nests. Journal of Wildlife Management 66:232-239.
Burger, J. 1994. The effect of human disturbance on foraging behavior and habitat use in piping plover (Charadrius melodus). Estuaries 17:695-70
Burger, J. 2000. Landscapes, tourism, and conservation. The Science of the Total Environment 249:39-49.
Burger, J, and M. Gochfeld. 1991. Human activity influence and diurnal and nocturnal foraging of sanderlings (Calidris alba). Condor 93:259-265.
Burggren, W.W., and B.R. McMahon. 2009. Biology of Land Crabs. Cambridge University Press, New York.
Burnham, K.P., and D.R. Anderson. 2002. Model selection and multimodel inferences: a practical information-theoretic approach. 2nd edition. Springer-Verlag, New York.
Chalfoun, A.D., and T.E. Martin. 2009. Habitat structure mediates predation risk for sedentary prey: experimental tests of alternative hypotheses. Journal of Animal Ecology 78:497-503.
Chalfoun, A.D., M.J. Ratnaswamy, and F.R. Thompson, III. 2002. Songbird nest predators in forest-pasture edge and forest interior in a fragmented landscape. Ecological Applications 12:858-867.
Chase, C.A., III, and J.A. Gore. 1989. Snowy Plover breeding distribution: Final Performance Report. Florida Game and Fresh Water Fish Commission, Tallahassee, Florida.
Clark, R.G., and D. Shutler. 1999. Avian habitat selection: Pattern from process in nest-site use by ducks? Ecology 80:272-287.
Cohen, J.B., E.H. Wunker, and J.D. Fraser. 2008. Substrate and vegetation selection by nesting piping plovers. The Wilson Journal of Ornithology 120:404-412.
Collins, B.M., C.K. Williams, and P.M Castelli. 2009. Reproduction and microhabitat selection in a sharply declining northern bobwhite population. The Wilson Journal of Ornithology 121:688-695.
97
Colwell, M.A., and S.L. Landrum. 1993. Nonrandom shorebird distribution and fine-scale variation in prey abundance. The Condor 95:94-103.
Colwell, M.A., C.B. Millett, J.J. Meyer, J.N. Hall, S.J. Hurley, S.E. McAllister, A.N. Transou, and R.R. LeValley. 2005. Snowy Plover reproductive success in beach and river habitats. Journal of Field Ornithology 76:373-382.
Colwell, M.A., S.J. Hurley, J.N. Hall, and S.J. Dinsmore. 2007a. Age-related survival and behavior of Snowy Plover chicks. The Condor 109:638-647.
Colwell, M.A., S.E. McAllister, C.B. Millett, A.N. Transou, S.M. Mullin, Z.J. Nelson, C.A. Wilson, and R.R. LeValley. 2007b. Philopatry and natal dispersal of the western Snowy Plover. The Wilson’s Journal of Ornithology 119:378-385.
Conway, W.C., L.M. Smith, and J.D. Ray. 2005. Shorebird habitat use and nest-site selection in the Playa Lakes region. Journal of Wildlife Management 69:174-184.
Crooks. S., 2004. The effect of sea-level rise on coastal geomorphology. IBIS 146:18–20.
Czech, B., P.R. Krausman, and P.K. Devers. 2000. Economic associations among causes of species endangerment in the United States. BioScience 50:593-601.
Davis, R.A., Jr., and D.M. Fitzgerald. 2004. Beaches and Coasts. Blackwell Science Ltd. Malden, Massachusetts.
Dias, M.P., J.P. Granadeiro, M. Lecoq, C.D. Santos, and J.M. Palmeirim. 2006. Distance to high-tide roosts constrains the use of foraging areas by dunlins: Implications for the management of estuarine wetlands. Biological Conservation 131:446-452.
Dugan, J.E., and D.M. Hubbard. 2006. Ecological responces to coastal armoring on exposed sandy beaches. Shore and Beach 74:10-16.
Dunning, J.B., B.J. Danielson, and H.R. Pulliam. 1992. Ecological processes that affect populations in complex landscapes. Oikos 65:169-175.
Elias, S.P., J.D. Fraser, P.A. Buckley. 2000. Piping plover brood foraging ecology on New York barrier islands. Journal of Wildlife Management 64:346-354.
Epstein, M. 1999. Incidental impact to nesting Wilson’s plovers during the sea turtle nest monitoring season. Florida Field Naturalist 27:173-176.
Evans, P.R., and P.J. Dugan. 1984. Coastal birds: numbers in relation to food resources, Pages 8-28. In P.R. Evans, J.D. Goss-Custard, and W.G. Hale, editors, Coastal waders and wildfowl in winter. Cambridge University Press, Cambridge, United Kingdom.

98
Finkl, C.W., 1996. What might happen to America’s shoreline if artificial beach replenishment is curtailed: a prognosis for southeastern Florida and other sandy regions along regressive coasts. Journal of Coastal Research 12:iii–ix.
Finn PG, Catterall CP, Driscoll PV. 2007. Determinants of preferred intertidal feeding habitat for Eastern curlew: A study at two spatial scales. Austral Ecology 32:131-144.
Fraga, R. M. and J. A. Amat. 1996. Breeding biology of a Kentish Plover (Charadrius alexandrinus) population in an inland saline lake. Ardeola 43:69-85.
Frederick, P.C., K.L. Bildstein, B. Fleury, and J. Ogden. 1996. Conservation of large, nomadic populations of white ibis (Eudocimus albus) in the United States. Conservation Biology 10:203-216.
Frid, A., and A. Dill. 2002. Human-caused Disturbance Stimuli as a Form of Predation Risk. Conservation Ecology 6:11.
Full, R.J., and R.B. Weinstein. 1992. Integrating the physiology, mechanics and behavior of rapid running ghost crabs: slow and steady doesn’t always win the race. Am. Zool. 32:382-395.
Funk, W.C., T.D. Mullins, and S.M. Haig. 2007. Conservation genetics of snowy plovers (Charadrius alexandrinus) in the Western Hemisphere: population genetic structure and delineation of subspecies. Conservation Genetics 8:1287-1309.
Garshelis, D.L. 2000. Delusions in habitat evaluation: measuring use, selection, and importance. Pages 111–164 in L. Boitani and T. K. Fuller, editors, Research techniques in animal ecology— controversies and consequences. Columbia University Press, New York.
Gill, J.A., W.J. Sutherland, and A.R. Watkinson. 1996. A method to quantify the effects of human disturbance on animal populations. Journal of Applied Ecology 33:786-792.
Gill, J.A., K. Norris, and W.J. Sutherland. 2001. The effects of disturbance on habitat use by black-tailed godwits Limosa limosa. Journal of Applied Ecology 38:846-856.
Gilliam, J.F., and D.F Fraser. 1987. Habitat selection under predation hazard: test of a model with foraging minnows. Ecology 68:1856-1862.
Gore, J.A. 1996. Cuban Snowy Plover. Pages 73-80 in J.A. Rodgers, H.W. Kale, II, and H.T. Smith, editors. Rare and Endangered Biota of Florida, Vol.5. Birds. University of Florida Press, Gainesville, Florida.
99
Gorman, L.R., and S.M. Haig. 2002. Distribution and abundance of Snowy Plovers in eastern North America, the Caribbean, and the Bahamas. Journal of Field Ornithology 73:38-52.
Granadeiro, J.P., J. Andrade, and J.M. Palmeirim. 2004. Modelling the distribution of shorebirds in estuarine areas using generalized additive models. Journal of Sea Research 52:227-240.
Gratto-Trevor, C.L. 2004. The North American bander’s manual for banding shorebirds (Charadriiformes, suborder Charadrii). North American Banding Council. Point Reyes, California.
Graul, W.D.. 1975. Breeding biology of the Mountain Plover. Wilson Bulletin 87:6-31.
Groom, M.J., G.K. Meffe, and C.R. Carroll. 2006. Principles of Conservation Biology. Sunderland (MA): Sinauer Associates, Inc. 793 p.
Goss-Custard, J.D. 1984. Intake rates and food supply in migrating and wintering shorebirds. Pages 233-270 in J. Burger and BL Olla, editors, Shorebirds: migration and foraging behavior. Plenum Press. NewYork.
Grover, P.B., and F.L. Knopf. 1982. Habitat requirements and breeding success of Chardriiform birds nesting at Salt Plains National Wildlife Refuge, Oklahoma. Journal of Field Ornithology 53:139-148.
Haig, S.M., D.W. Mehlman, and L.W. Oring. 1998. Avian movement and wetland connectivity in landscape conservation. Conservation Biology 12:749-758.
Himes, J.G., N.J. Douglass, R.A. Pruner, A.M. Croft, and E.M. Seckinger. 2007. Status and Distribution of the Snowy Plover in Florida. 2006 study final report. Florida Fish and Wildlife Conservation Commission, Tallahassee, Florida.
Hood, S.L. 2006. Nesting ecology of snowy and Wilson’s plovers in the lower Laguna Madre region of Texas [thesis]. Mississippi State University, Mississippi.
Hoover, J.P., Brittingham MC. 1998. Nest-site selection and nesting success of wood thrushes. The Wilson Bulletin 110:375-383.
Johnson, J.B., and K.S. Omland. 2004. Model selection in ecology and evolution. Trends in Ecology and Evolution 19:101-108.
Jones, J. 2001. Habitat selection studies in avian ecology: A critical review. The Auk 118:557-562.
Kosztolanyi, A., T. Szekely, and I.C. Cuthill. 2007. The function of habitat change during brood-rearing in the precocial Kentish plover Charadrius alexandrines. Acta Ethologica 10:73-79.
100
Lafferty, K.D. 2001a. Birds at a Southern California beach: seasonality, habitat use and disturbance by human activity. Biodiversity and Conservation 10:1949-1962.
Lafferty, K.D. 2001b. Disturbance to wintering western Snowy Plovers. Biological Conservation 101:315-325.
Lafferty, K.D., D. Goodman, and C.P. Sandoval. 2006. Restoration of breeding by Snowy Plovers following protection from disturbance. Biodiversity and Conservation 15:2217-2230.
Lamonte, K.M., N.J. Douglass, J.G. Himes, and G.E. Wallace. 2006. Status and Distribution of the Snowy Plover in Florida. 2002 final report . Florida Fish and Wildlife Conservation Commission, Tallahassee, Florida.
Lauten, D.J., K.A. Castelein, R. Pruner, and M. Friel. 2007. The Distribution and Reproductive Success of the Western Snowy Plover Along the Oregon Coast – 2007. Oregon Department of Fish and Wildlife – Nongame Program, Portland Oregon.
Lazarus, J., and M. Symonds. 1992. Contrasting effects of protective and obstructive cover on avian vigilance. Animal Behavior 43:519–521.
Le Fer, D., J.D. Fraser, and C.D. Kruse. 2007. Piping plover chick foraging, growth, and survival in the Great Plains. The Journal of Wildlife Management 72:682-687.
Loegering, J.P., and J.D. Fraser. 1995. Factors affecting piping plover chick survival in different brood-rearing habitats. The journal of Wildlife Management 59:646-655.
Loegering, J.P., J.D. Fraser, and L.L. Loegering. 1995. Ghost crab preys on piping plover chick. Wilson Bulletin 107:768-769.
Lord, A.J., J.R. Wass, J. Innes. 1997. Effects of human activity on the behavior of northern New Zealand dotterel Charadrius obsurus aquilonius chicks. Biological Conservation 82:15-20.
Lord, A.J., J.R. Waas, J. Innes, M.J. Whittingham. 2001. Effects of human approaches to nests of northern New Zealand dotterels. Biological Conservation 98:233-240.
Mabee, T. J. 1997. Using eggshell evidence to determine nest fate of shorebirds. Wilson Bulletin 109:307-313.
Mace, R.D., J.S. Waller, T.L. Manley, L.J. Lyon, and H. Zuuring. 1996. Relationship among grizzly bears, roads, and habitat in the Swan Mountains, Montana. Journal of Applied Ecology 33:1395-1404.
Martin, T.E. 1987. Artificial nest experiments: effects of nest appearance and type of predators. Condor 89:925-928.
101
Martin, T.E. 1992. Breeding productivity considerations: what are the appropriate habitat features for management? Pages 455–473 in J. M. Hagan, III, and D. W. Johnston, editors. Ecology and conservation of neotropical migrant landbirds. Smithsonian Institution Press, Washington, D.C.
Martin, T. E. 1993. Nest predation and nest sites. BioScience 43:523-532.
Martin, T. E. 1995. Avian life history evolution in relation to nest sites, nest predation, and food. Ecological Monographs 65:101–127.
Martin, T.E. 1998. Are microhabitat preferences of coexisting species under selection and adaptive? Ecology 79:656-670.
McCrary, M.D., and M.O. Pierson. 2006. Influence of human activity on shorebird beach use in Ventura County, California. In: Lafferty, K. D., D. Goodman, and C. P. Sandoval. Restoration of breeding by Snowy Plovers following protection from disturbance. Biodiversity and Conservation 15:2217-2230.
Morris, D.W., and D.L. Davidson. 2000. Optimally foraging mice match patch use with habitat differences in fitness. Ecology 81:2061-2066.
Nelson, Z. 2007. Conspecific attraction in the breeding distribution of the Western Snowy Plover (Charadrius alexandrinus nivosus) [thesis]. Humboldt State University, Arcata, California.
Newton, I. 1998. Population limitation in birds. Academic Press, New York.
Neves, F.M., and C.E. Bemvenuti. 2006. The ghost crab Ocypode quadrata (Fabricius 1787) as a potential indicator of anthropic impact along the Rio Grande do Sul coast, Brazil. Biological Conservation 133:431-435.
O’Brian, M., R. Crossley, and K. Karlson. 2006. The Shorebird Guide. Houghton Mifflin Company New York..
Page, G.W., L.E. Stenzel, D.W. Winkler, and C.W. Swarth. 1983. Spacing out at Mono Lake: breeding success, nest density, and predation in the Snowy Plover. The Auk 100:13-24.
Page, G.W., L. E. Stenzel, J. S. Warriner, J. C. Warriner and P. W. Paton. 2009. Snowy Plover (Charadrius alexandrinus). In A Poole, editors, The Birds of North America Online. Cornell Lab of Ornithology, Ithica, New York: http://bna.birds.cornell.edu/bna%2522%2520target%3D%2522_top%2522%2520rel%3D%2522nofollow/species/154
Patton, P.W.C. 1995. Breeding biology of snowy plovers at Great Salt Lake, Utah. Wilson’s Bulletin 107:275-288.
102
Pearce-Higgens, J.W., and D.W. Yalden. 2004. Habitat selection, diet, arthropod availability and growth of a moorland wader: the ecology of European golden plover Pluvialis apricaria chicks. Ibis 146:335-346.
Peterson, C.H., M.J. Bishop, G.A. Galen, L.M. D’Anna, and L.M. Manning. 2006. Exploiting beach filling as an unaffordable experiment: Benthic intertidal impacts propagating upwards to shorebirds. Journal of Experimental Marine Biology and Ecology 338:205-221.
Peterson, C.H., and M.J. Bishop. 2005. Assessing the Environmental Impacts of Beach Nourishment. BioScience 55:887-896.
Petit, D.R. 1989. Weather-dependent use of habitat patches by wintering woodland birds. Journal of Field Ornithology 60:241-247.
Pomeroy, A.C. 2006. Tradeoffs between food abundance and predation danger in spatial usage of a stopover site by western sandpipers, Calidris mauri. Oikos 112:629-637.
Potts, G.W. 1980. The predatory behavior of Caranx-Melampygus (Pisces) in the channel environment of Aldabra Atoll (Indian Ocean). Journal of Zoology 192:323-350.
Powell, A.N. 2001. Habitat Characteristics and Nest Success of Snowy Plovers associated with California Least Tern Colonies. Condor 103:785-792.
Powell, A.N., C.L. Collier. 2000. Habitat use and reproductive success of western Snowy Plovers at new nesting areas created for California least terns. Journal of Wildlife Management 64:24-33.
Purdue, J. R. 1976. Thermal environment of the nest and related parental behavior in Snowy Plovers, Charadrius alexandrinus. Condor 78:180-185.
Pyke, G.H., H.R. Pullium, and E.L. Charnov. 1977. Optimal foraging- Selective review of theory and tests. Quarterly Review of Biology 52:137-145.
R Development Core Team (2008). R: A language and environment for statistical computing. R Foundation for Statistical Computing, Vienna, Austria: http://www.R-project.org.
Ribiero, P.D., O.O. Iribarne, D. Navarro, and L. Jaureguy. 2004. Environmental heterogeneity, spatial segregation of prey, and the utilization of southwest Atlantic mudflats by migratory shorebirds. Ibis 146:672-682.
Ricklefs, R.E. 1969. An analysis of nesting mortality in birds. Smithsonian Contributions to Zoology. 9:1-48.
103
Ricklefs, R.E. 1989. Nest predation and the species-diversity of birds. Trends in Ecology and Evolution 4:184-196.
Roberts, C.M., J.P. Hawkins. 1999. Extinction risk in the sea. Trends in Ecology and Evolution 14: 241–246.
Robertson, B.A., and R.L. Hutto. 2006. A framework for understanding ecological traps and an evaluation of existing evidence. Ecology 87:1075-1085.
Rotella, J.J., S.J. Dinsmore, and T.L. Shaffer. 2004. Modeling nest-survival data: a comparison of recently developed methods that can be implemented in MARK and SAS. Animal Biodiversity and Conservation 27:187–205.
Rosenzweig, M.L. 1991. Habitat selection and population interactions: The search for mechanisms. American Naturalist 137 (supplement):5-28.
Ruhlen, T.D., S. Abbott, L.E. Stenzel, and G.W. Page. 2003. Evidence that human disturbance reduces Snowy Plover chick survival. Journal of Field Ornithology 74:300-304.
Schekkerman, H., and G.H. Visser. 2001. Preflegling energy requirements in shorebirds: energetic implications of self-feeding precocial development. The Auk 118:944-957.
Schlaepfer, M.A., M.C. Runge, and P.W. Sherman. 2002. Ecological and evolutionary traps. Trends in Ecology and Evolution 17:474-480.
Shmidt, K.A., and C.J. Whelan. 1999. Nest predation on woodland songbirds: when is nest predation density dependent? Oikos 87:65-74.
Shaffer, T.L. 2004. A unified approach to analysizing nest success. The Auk 121:526–540.
Silveira, L., A.T.A. Jacomo, and J.A.F. Diniz. 2003. Camera trap, line transect census and track surveys: a comparative evaluation. Biological Conservation 114:351-355.
Smith, J.N.M., and R. Dawkins. 1971. The hunting behavior of Great Tits in relation to spatial variation in their food density. Animal Behavior 19:695-706.
Smith, P.A., H.G. Gilchrist, and J.M.N. Smith. 2007. Effects of nest habitat, food, and parental behavior on shorebird nest success. The Condor 109:15-31.
Smith, B., and C. Faillace. 2006. 2006 Snowy Plover conservation and research report for Sanibel Island, Florida. Sanibel-Captiva Conservation Foundation, Sanibel, Florida.
104
Soderstrom, B., T. Part, and J. Ryden. 1998. Different nest predator faunas and nest predation risk on ground and shrub nests at forest ecotones: An experiment and review. Oecologia 117:108-118.
Stamps, K., and W. Krishnan. 2005. Nonintuitive cue use in habitat selection. Ecology 86:2860-2867.
Stapp, P. 1997. Community structure of shortgrass prarie rodents: competition or risk of interguild predation? Ecology 78:1519-1530.
Steele, B.B. 1993. Selection of foraging and nesting sites by Black-Throated Blue Warblers –Their relative influence on habitat choice. Condor 95:568-579.
Stillman, R.A., and J.D. Gross-Custard. 2002. Seasonal changes in the response of oystercatchers Haematopus ostralegus to human disturbance. Journal of Avian Biology 33:358-365.
Stillman, R. 2003. Predicting wader mortality and body condition from optimal foraging behavior. Wader Study Group Bulletin 100:192-196.
Statchhan, P.H., R.C. Smith, D.A.B. Hamilton, A.C. Taylor, and R.J.A. Atkinson. 1999. Studies on the ecology and behavior of the ghost crab, Ocypdode cursor (L.) in northern Cyprus. Scientia Marina 63:51-60.
Thomas, D.L., and E.J. Taylor. 1990. Study designs and tests for comparing resource use and availability. Journal of Wildlife management 54:322-330.
Warriner, J.S., J.C. Warriner, G.W. Page, and L.E. Stenzel. 1986. Mating system and reproductive success of a small population of polygamous Snowy Plovers. Wilson Bulletin 98:15-37.
Watts, B.D., and D.S. Bradshaw. 1995. Ghost crab preys on piping plover eggs. Wilson Bulletin 107:767-768.
Webb, D.R., 1987. Thermal tolerance of avian embryos: a review. Condor 89:874–898.
Weston, M.A., and M.A. Elgar. 2007. Responses of incubating hooded plovers (Thinornis rubricollis) to disturbance. Journal of Coastal Research 23:569-576.
Whittingham, M.J., S.M. Percival, and A.F. Brown. 2001. Habitat selection by golden plover Pluvialis apricaria chicks. Basic Applied Ecology 2:177-191.
Williams, B.K., and J.D. Nichols. 1984. Optimal timing in biological processes. American Naturalist 123:1-19.
Williams, K., J. Nichols, and M. Conroy. 2002. Analysis and Management of Animal Populations. Academic Press. San Diego, California.

105
Wolcott, T.G. 1978. Ecological role of ghost crabs, O. quadrata (Fabricius) on an ocean beach: scavengers or predators? Journal of Experimental Marine Biology and Ecology 31:67-82.
Wolcott, T.G. 2009. Ecology, Pages 55–95 in Burggren WW, McMahon BR, editors. Biology of the Land Crab. 2nd Edition. Cambridge University Press, Cambridge, United Kingdom.
Wolcott, D.L., and T.G. Wolcott. 1999. High mortality of piping plovers on beaches with abundant ghost crabs: correlation, not causation. Wilson Bulletin 111:321-329.
Yasue, M. 2005. The effects of human presence, flock size and prey density on shorebird foraging rates. Japan Ethological Society and Springer-Verlag Tokyo 23:199-204.
Yasue, M. 2006. Environmental factors and spatial scale influence shorebirds’ response to human disturbance. Biological Conservation 128:47-54.
Yasue, M, and P. Dearden. 2006a. The potential impact of tourism development on habiat availability and productivity of Malaysian plovers Charadrius peronii. Journal of Applied Ecology 43:978-989.
Yasue, M, and P. Dearden. 2006b. The effects of heat stress, predation risk and parental investment on Malaysian plover nest return times following a human disturbance. Biological Conservation 132:472-480.
106
BIOGRAPHICAL SKETCH
Raya Pruner grew up in a rural timber town, with a population little more than
3000, in SW Oregon. When she wasn’t in school, she spent most of her childhood
outdoors. She graduated in 2002 from the University of Montana with two degrees, one
in wildlife biology and one in archaeology. At that time she had become fascinated with
the Pleistocene megafauna extinctions. However, she was hired the following year by
the Bear River Migratory Bird Refuge in Utah where she realized her passion for birds
(particularly shorebirds) and traveling. This launched her career as a gypsy-biologist,
where research opportunities took her to various states and countries. After working
with Snowy Plovers in Florida with FWC, continued work with this species took her to
graduate school at the University of Florida, where she completed her master’s degree
in wildlife ecology and conservation. She is not sure where she will head next, but
would like to continue to work with shorebird conservation and associated coastal
habitats.