Connectivity of Medium Airports in Thailand - … · This paper aimed to evaluate airport ... There...
8
Proceedings of the International Conference on Industrial Engineering and Operations Management Bandung, Indonesia, March 6-8, 2018 © IEOM Society International Connectivity of Medium Airports in Thailand Charukit Chaiwan Graduate Program in Logistics Engineering and Supply Chain Management, Industrial Engineering Department, Faculty of Engineering, Chiang Mai University Chiang Mai, 50200, Thailand [email protected] Korrakot Yaibuathet Tippayawong* Excellence Center in Logistics and Supply Chain Management Industrial Engineering Department, Faculty of Engineering, Chiang Mai University Chiang Mai, 50200, Thailand [email protected] Abstract Airports are expanding their facilities in respond to increasing number of passengers. Airport connectivity is one of indicators to evaluate airport performance. Airport connectivity can be define as the airline network of airport, related to frequency of flight and number of flights from origin to destination. Airport with good connectivity is attractive for passengers. This paper aimed to evaluate airport connectivity of medium sized airports in Thailand, which are Sakon Nakhon airport (SNO), Nakhon Phanom airport (KOP), Nannakhon airport (NNT), Phitsanulok airport (PHS) and Trang airport (TST) by using NETSCAN model during October, 2017. It was found that Phitsanulok airport (PHS) has the highest connectivity unit, with more frequency of flights. Keywords Airport connectivity, Local Airport, NetScan Connectivity Index 1. Introduction Air transportation is one of the important factors of life quality improvement. It plays an important role in the economy and society of the world. It is a convenient, faster and safer transportation service than other mode of transportation. Nowadays, air transportation industry is growing rapidly, and customer are attractive to travel by air more than the past. Air transportation industry in Thailand also expands their capacity to fulfill the customer need. There are six airports that operated by Airports of Thailand Public Company Limited (AOT) and twenty-seven airports operated by the Department of Airports Thailand (DOA). According to Figure 1, the number of passengers that travelling by air in Thailand has increased 123% within this decade, there were 60 million passengers in 2010 and 139 million in 2016 (AOT and DOA, 2017). This phenomena emphasize the importance of air transportation in this decade with a bright future for business extension. The main players of the air transportation in supply chain encompasses aircraft manufacturers, airlines, airports, ground services and related industry. The airport serves the service for aircraft take-off, landing, passenger embarking and disembarking. To fulfil the customer satisfaction, the airports need to improve their performance of service quality, operational performance, airport connectivity and their facilities. 2641
Transcript of Connectivity of Medium Airports in Thailand - … · This paper aimed to evaluate airport ... There...
Proceedings of the International Conference on Industrial Engineering and Operations Management
Bandung, Indonesia, March 6-8, 2018
© IEOM Society International
Connectivity of Medium Airports in Thailand
Charukit Chaiwan
Graduate Program in Logistics Engineering and Supply Chain Management,
Industrial Engineering Department, Faculty of Engineering, Chiang Mai University
Chiang Mai, 50200, Thailand
Korrakot Yaibuathet Tippayawong*
Excellence Center in Logistics and Supply Chain Management
Industrial Engineering Department, Faculty of Engineering, Chiang Mai University
Chiang Mai, 50200, Thailand
Abstract
Airports are expanding their facilities in respond to increasing number of passengers.
Airport connectivity is one of indicators to evaluate airport performance. Airport connectivity can
be define as the airline network of airport, related to frequency of flight and number of flights from
origin to destination. Airport with good connectivity is attractive for passengers. This paper aimed
to evaluate airport connectivity of medium sized airports in Thailand, which are Sakon Nakhon
airport (SNO), Nakhon Phanom airport (KOP), Nannakhon airport (NNT), Phitsanulok airport
(PHS) and Trang airport (TST) by using NETSCAN model during October, 2017. It was found
that Phitsanulok airport (PHS) has the highest connectivity unit, with more frequency of flights.
Keywords Airport connectivity, Local Airport, NetScan Connectivity Index
1. IntroductionAir transportation is one of the important factors of life quality improvement. It plays an important role in
the economy and society of the world. It is a convenient, faster and safer transportation service than other mode of
transportation. Nowadays, air transportation industry is growing rapidly, and customer are attractive to travel by air
more than the past. Air transportation industry in Thailand also expands their capacity to fulfill the customer need.
There are six airports that operated by Airports of Thailand Public Company Limited (AOT) and twenty-seven airports
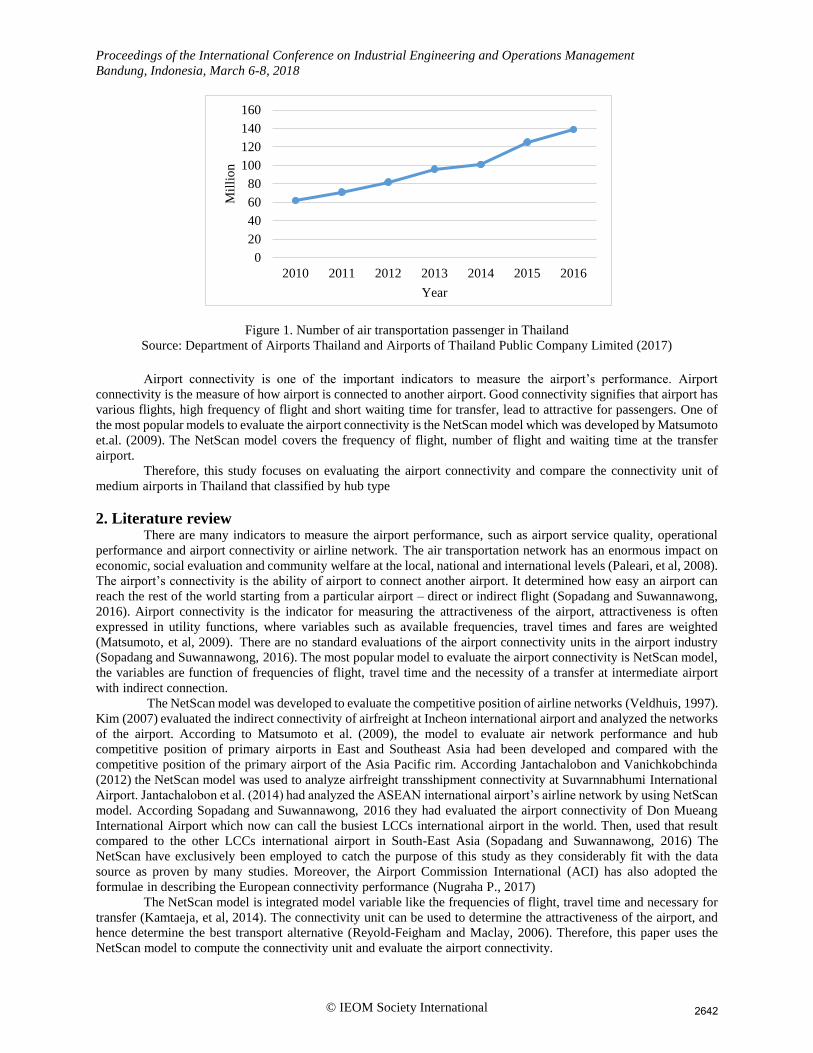
operated by the Department of Airports Thailand (DOA). According to Figure 1, the number of passengers that
travelling by air in Thailand has increased 123% within this decade, there were 60 million passengers in 2010 and 139
million in 2016 (AOT and DOA, 2017). This phenomena emphasize the importance of air transportation in this decade
with a bright future for business extension. The main players of the air transportation in supply chain encompasses
aircraft manufacturers, airlines, airports, ground services and related industry. The airport serves the service for aircraft
take-off, landing, passenger embarking and disembarking. To fulfil the customer satisfaction, the airports need to
improve their performance of service quality, operational performance, airport connectivity and their facilities.
2641
Proceedings of the International Conference on Industrial Engineering and Operations Management
Bandung, Indonesia, March 6-8, 2018
© IEOM Society International
Figure 1. Number of air transportation passenger in Thailand
Source: Department of Airports Thailand and Airports of Thailand Public Company Limited (2017)
Airport connectivity is one of the important indicators to measure the airport’s performance. Airport
connectivity is the measure of how airport is connected to another airport. Good connectivity signifies that airport has
various flights, high frequency of flight and short waiting time for transfer, lead to attractive for passengers. One of
the most popular models to evaluate the airport connectivity is the NetScan model which was developed by Matsumoto
et.al. (2009). The NetScan model covers the frequency of flight, number of flight and waiting time at the transfer
airport. Therefore, this study focuses on evaluating the airport connectivity and compare the connectivity unit of
medium airports in Thailand that classified by hub type
2. Literature review There are many indicators to measure the airport performance, such as airport service quality, operational
performance and airport connectivity or airline network. The air transportation network has an enormous impact on
economic, social evaluation and community welfare at the local, national and international levels (Paleari, et al, 2008). The airport’s connectivity is the ability of airport to connect another airport. It determined how easy an airport can
reach the rest of the world starting from a particular airport – direct or indirect flight (Sopadang and Suwannawong,
2016). Airport connectivity is the indicator for measuring the attractiveness of the airport, attractiveness is often
expressed in utility functions, where variables such as available frequencies, travel times and fares are weighted
(Matsumoto, et al, 2009). There are no standard evaluations of the airport connectivity units in the airport industry
(Sopadang and Suwannawong, 2016). The most popular model to evaluate the airport connectivity is NetScan model,
the variables are function of frequencies of flight, travel time and the necessity of a transfer at intermediate airport
with indirect connection. The NetScan model was developed to evaluate the competitive position of airline networks (Veldhuis, 1997).
Kim (2007) evaluated the indirect connectivity of airfreight at Incheon international airport and analyzed the networks
of the airport. According to Matsumoto et al. (2009), the model to evaluate air network performance and hub
competitive position of primary airports in East and Southeast Asia had been developed and compared with the
competitive position of the primary airport of the Asia Pacific rim. According Jantachalobon and Vanichkobchinda
(2012) the NetScan model was used to analyze airfreight transshipment connectivity at Suvarnnabhumi International
Airport. Jantachalobon et al. (2014) had analyzed the ASEAN international airport’s airline network by using NetScan
model. According Sopadang and Suwannawong, 2016 they had evaluated the airport connectivity of Don Mueang
International Airport which now can call the busiest LCCs international airport in the world. Then, used that result
compared to the other LCCs international airport in South-East Asia (Sopadang and Suwannawong, 2016) The
NetScan have exclusively been employed to catch the purpose of this study as they considerably fit with the data
source as proven by many studies. Moreover, the Airport Commission International (ACI) has also adopted the
formulae in describing the European connectivity performance (Nugraha P., 2017) The NetScan model is integrated model variable like the frequencies of flight, travel time and necessary for
transfer (Kamtaeja, et al, 2014). The connectivity unit can be used to determine the attractiveness of the airport, and
hence determine the best transport alternative (Reyold-Feigham and Maclay, 2006). Therefore, this paper uses the
NetScan model to compute the connectivity unit and evaluate the airport connectivity.
0
20
40
60
80
100
120
140
160
2010 2011 2012 2013 2014 2015 2016
Mil
lio
n
Year
2642
Proceedings of the International Conference on Industrial Engineering and Operations Management
Bandung, Indonesia, March 6-8, 2018
© IEOM Society International
3. Methodology 3.1 Connection type
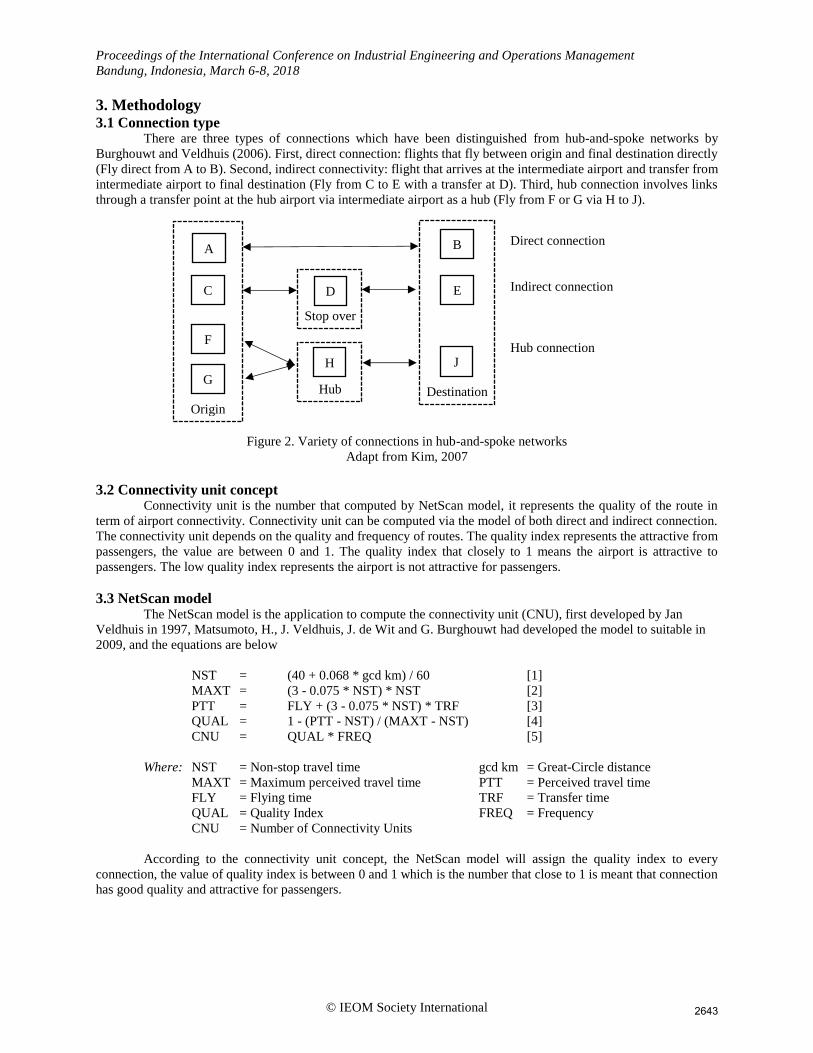
There are three types of connections which have been distinguished from hub-and-spoke networks by
Burghouwt and Veldhuis (2006). First, direct connection: flights that fly between origin and final destination directly
(Fly direct from A to B). Second, indirect connectivity: flight that arrives at the intermediate airport and transfer from
intermediate airport to final destination (Fly from C to E with a transfer at D). Third, hub connection involves links
through a transfer point at the hub airport via intermediate airport as a hub (Fly from F or G via H to J).
Figure 2. Variety of connections in hub-and-spoke networks
Adapt from Kim, 2007
3.2 Connectivity unit concept Connectivity unit is the number that computed by NetScan model, it represents the quality of the route in
term of airport connectivity. Connectivity unit can be computed via the model of both direct and indirect connection.
The connectivity unit depends on the quality and frequency of routes. The quality index represents the attractive from
passengers, the value are between 0 and 1. The quality index that closely to 1 means the airport is attractive to
passengers. The low quality index represents the airport is not attractive for passengers.
3.3 NetScan model The NetScan model is the application to compute the connectivity unit (CNU), first developed by Jan
Veldhuis in 1997, Matsumoto, H., J. Veldhuis, J. de Wit and G. Burghouwt had developed the model to suitable in
2009, and the equations are below
NST = (40 + 0.068 * gcd km) / 60 [1]
MAXT = (3 - 0.075 * NST) * NST [2]
PTT = FLY + (3 - 0.075 * NST) * TRF [3]
QUAL = 1 - (PTT - NST) / (MAXT - NST) [4]
CNU = QUAL * FREQ [5]
Where: NST = Non-stop travel time gcd km = Great-Circle distance
MAXT = Maximum perceived travel time PTT = Perceived travel time
FLY = Flying time TRF = Transfer time
QUAL = Quality Index FREQ = Frequency
CNU = Number of Connectivity Units
According to the connectivity unit concept, the NetScan model will assign the quality index to every
connection, the value of quality index is between 0 and 1 which is the number that close to 1 is meant that connection
has good quality and attractive for passengers.
Direct connection
Indirect connection
Hub connection
D
B A
C E
F
Origin
Destination
Stop over
G
H
Hub
J
2643
Proceedings of the International Conference on Industrial Engineering and Operations Management
Bandung, Indonesia, March 6-8, 2018
© IEOM Society International
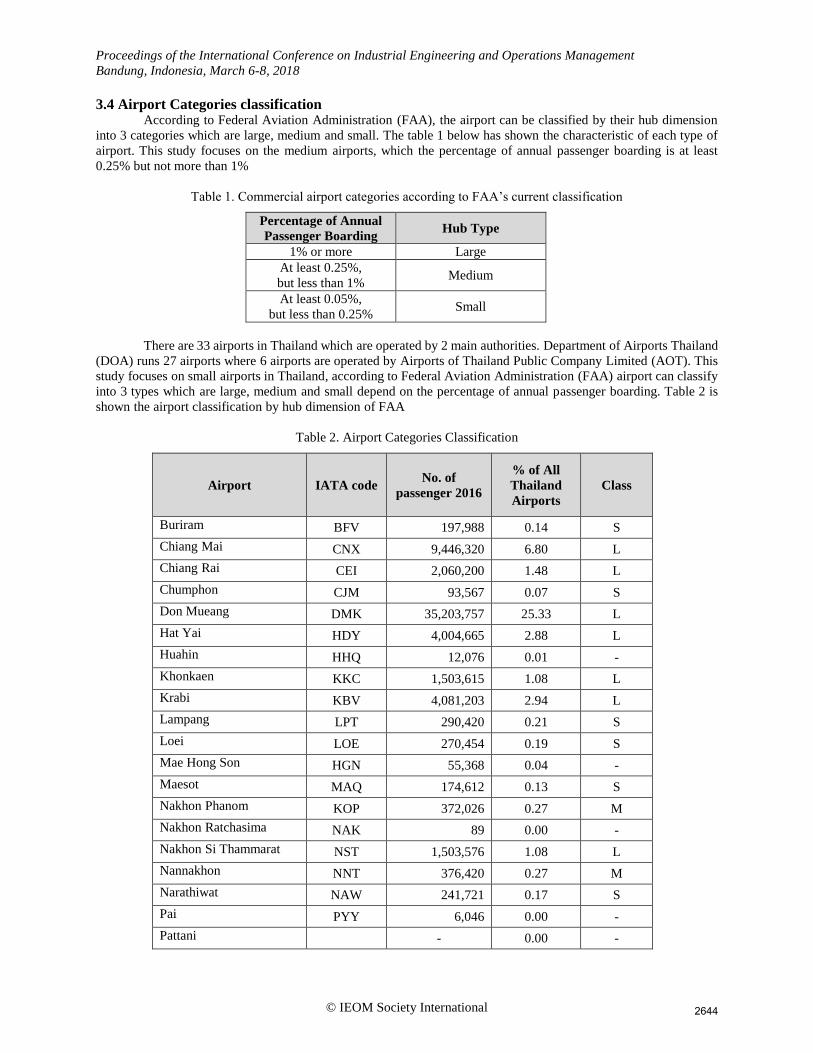
3.4 Airport Categories classification According to Federal Aviation Administration (FAA), the airport can be classified by their hub dimension
into 3 categories which are large, medium and small. The table 1 below has shown the characteristic of each type of
airport. This study focuses on the medium airports, which the percentage of annual passenger boarding is at least
0.25% but not more than 1%
Table 1. Commercial airport categories according to FAA’s current classification
Percentage of Annual
Passenger Boarding Hub Type
1% or more Large
At least 0.25%,
but less than 1% Medium
At least 0.05%,
but less than 0.25% Small
There are 33 airports in Thailand which are operated by 2 main authorities. Department of Airports Thailand
(DOA) runs 27 airports where 6 airports are operated by Airports of Thailand Public Company Limited (AOT). This
study focuses on small airports in Thailand, according to Federal Aviation Administration (FAA) airport can classify
into 3 types which are large, medium and small depend on the percentage of annual passenger boarding. Table 2 is
shown the airport classification by hub dimension of FAA
Table 2. Airport Categories Classification
Airport IATA code No. of
passenger 2016
% of All
Thailand
Airports
Class
Buriram BFV 197,988 0.14 S
Chiang Mai CNX 9,446,320 6.80 L
Chiang Rai CEI 2,060,200 1.48 L
Chumphon CJM 93,567 0.07 S
Don Mueang DMK 35,203,757 25.33 L
Hat Yai HDY 4,004,665 2.88 L
Huahin HHQ 12,076 0.01 -
Khonkaen KKC 1,503,615 1.08 L
Krabi KBV 4,081,203 2.94 L
Lampang LPT 290,420 0.21 S
Loei LOE 270,454 0.19 S
Mae Hong Son HGN 55,368 0.04 -
Maesot MAQ 174,612 0.13 S
Nakhon Phanom KOP 372,026 0.27 M
Nakhon Ratchasima NAK 89 0.00 -
Nakhon Si Thammarat NST 1,503,576 1.08 L
Nannakhon NNT 376,420 0.27 M
Narathiwat NAW 241,721 0.17 S
Pai PYY 6,046 0.00 -
Pattani - 0.00 -
2644
Proceedings of the International Conference on Industrial Engineering and Operations Management
Bandung, Indonesia, March 6-8, 2018
© IEOM Society International
Airport IATA code No. of
passenger 2016
% of All
Thailand
Airports
Class
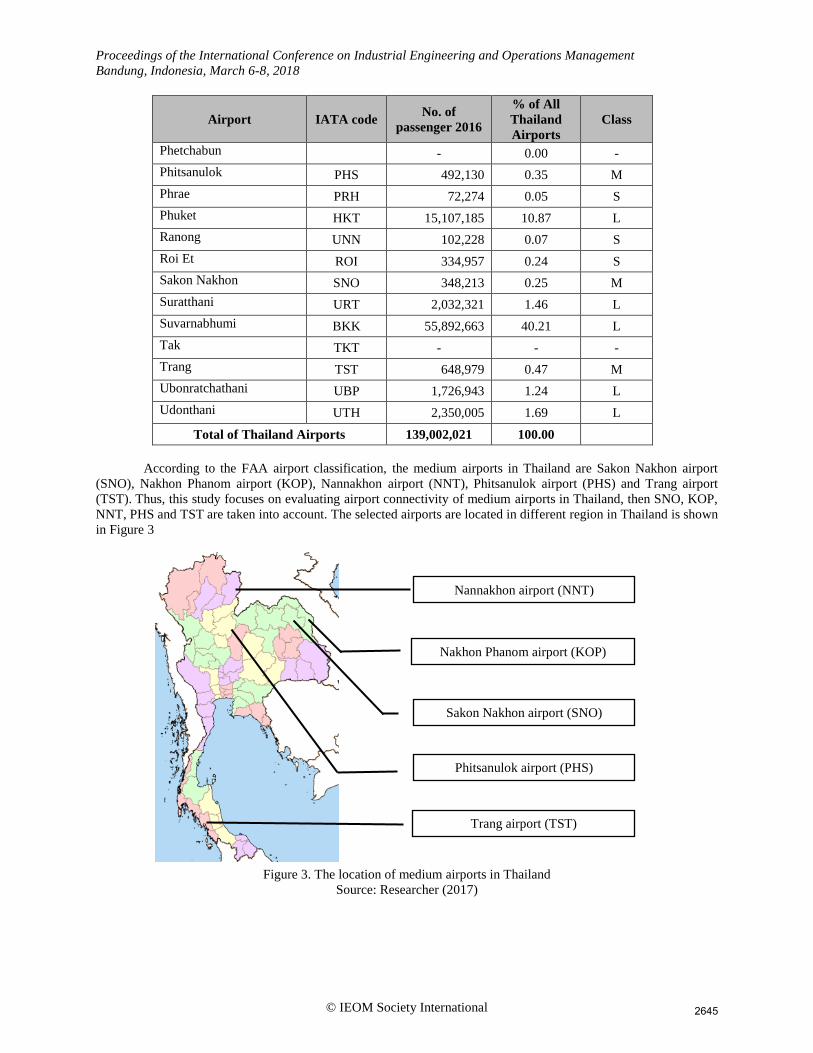
Phetchabun - 0.00 -
Phitsanulok PHS 492,130 0.35 M
Phrae PRH 72,274 0.05 S
Phuket HKT 15,107,185 10.87 L
Ranong UNN 102,228 0.07 S
Roi Et ROI 334,957 0.24 S
Sakon Nakhon SNO 348,213 0.25 M
Suratthani URT 2,032,321 1.46 L
Suvarnabhumi BKK 55,892,663 40.21 L
Tak TKT - - -
Trang TST 648,979 0.47 M
Ubonratchathani UBP 1,726,943 1.24 L
Udonthani UTH 2,350,005 1.69 L
Total of Thailand Airports 139,002,021 100.00
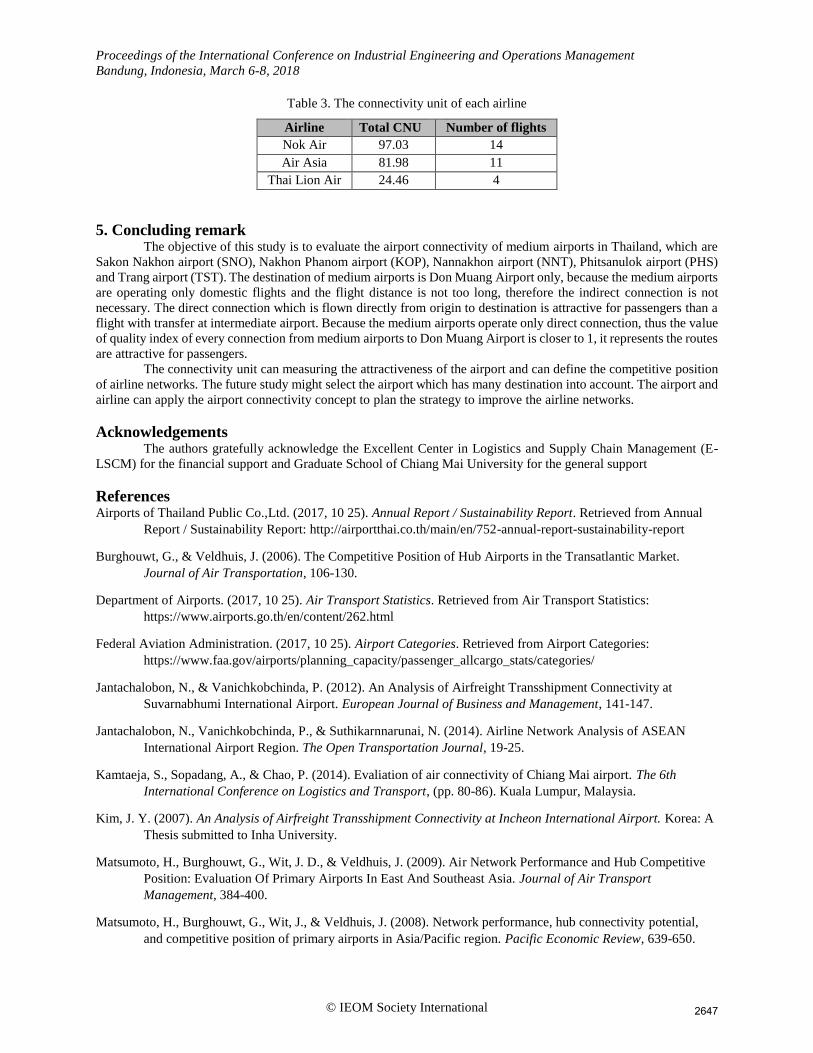
According to the FAA airport classification, the medium airports in Thailand are Sakon Nakhon airport
(SNO), Nakhon Phanom airport (KOP), Nannakhon airport (NNT), Phitsanulok airport (PHS) and Trang airport
(TST). Thus, this study focuses on evaluating airport connectivity of medium airports in Thailand, then SNO, KOP,
NNT, PHS and TST are taken into account. The selected airports are located in different region in Thailand is shown
in Figure 3
Figure 3. The location of medium airports in Thailand
Source: Researcher (2017)
Sakon Nakhon airport (SNO)
Nakhon Phanom airport (KOP)
Nannakhon airport (NNT)
Phitsanulok airport (PHS)
Trang airport (TST)
2645

Proceedings of the International Conference on Industrial Engineering and Operations Management
Bandung, Indonesia, March 6-8, 2018
© IEOM Society International
3.5 Scope of research Specification of minimum and maximum time of waiting for transfer at the intermediate airport between 1
and 24 hours.
The scheduled flights during October, 2017 were considered in this study.
4. Result and discussion 4.1 Airport connectivity The connectivity unit (CNU) that computes via NetScan model represents the connection efficiency of the
airport. According to Figure 4, the medium airport with the highest connectivity unit is Phitsanulok airport (PHS)
which is located in the northern region in Thailand, there are 3 airlines operate and at least 8 flights a day with 59.58
CNU per week. Phitsanulok airport has the highest number of CNU, mean passengers in PHS have many flights to
select, and many choices for passengers can increase customer satisfaction. The airport with the lowest connectivity
unit level is Nakhon Phanom airport (KOP) which is 29.74 CNU per week, there are 2 airlines operate in Nakhon
Phanom airport with 4 flights per day. The medium airports in Thailand, which are Sakon Nakhon airport (SNO),
Nakhon Phanom airport (KOP), Nannakhon airport (NNT), Phitsanulok airport (PHS) and Trang airport (TST) are
serving the service from their origin to Don Muang Airport (DMK) only. There is no indirect route from the medium
airports, because the flight distance is not long as the international flight and it’s not attractive for passengers to choose
an indirect connection to their destination.
Figure 4: The connectivity unit of medium airports of Thailand
Source: Researcher
The number of passenger in TST higher than PHS, but PHS has connectivity unit more than TRT. Because
the airport connectivity in direct connection dimension depends on the frequency of flights and number of flights.
Phitsanulok airport (PHS) has 9 flights per week, Trang airport has 7 flights per week, and both of PHS and TST
operated by low cost carrier in Thailand, which are Nok air, Air Asia and Thai lion air.
Although TST has lower connectivity unit than PHS, but overall capacity seat of TST is more than PHS. The
airlines operates the different types of aircraft, Trang airport has 7 flight per week, there were 3 flights that use Airbus
A320-216 aircraft type and 4 flights that use Boeing 737-800 to serve passengers. In the other hand, Phitsanulok
airport has 9 flights per week, it contain with 3 flights that use A320-216 aircraft type, 3 flights that use Boeing 737-
800 aircraft type and 3 flights that use Bombardier Dash 8 Q400 which is smaller aircraft than Airbus A320-216 and
Boeing 737-800.
Air connectivity is the ability to serve the passenger to connect to another airports, high number of
connectivity unit represent that airport has various flights to passengers. Passengers might have satisfaction for more
choices of the flight to fly. But the high number of connectivity unit cannot define that airport can accommodates
passenger more than another airport.
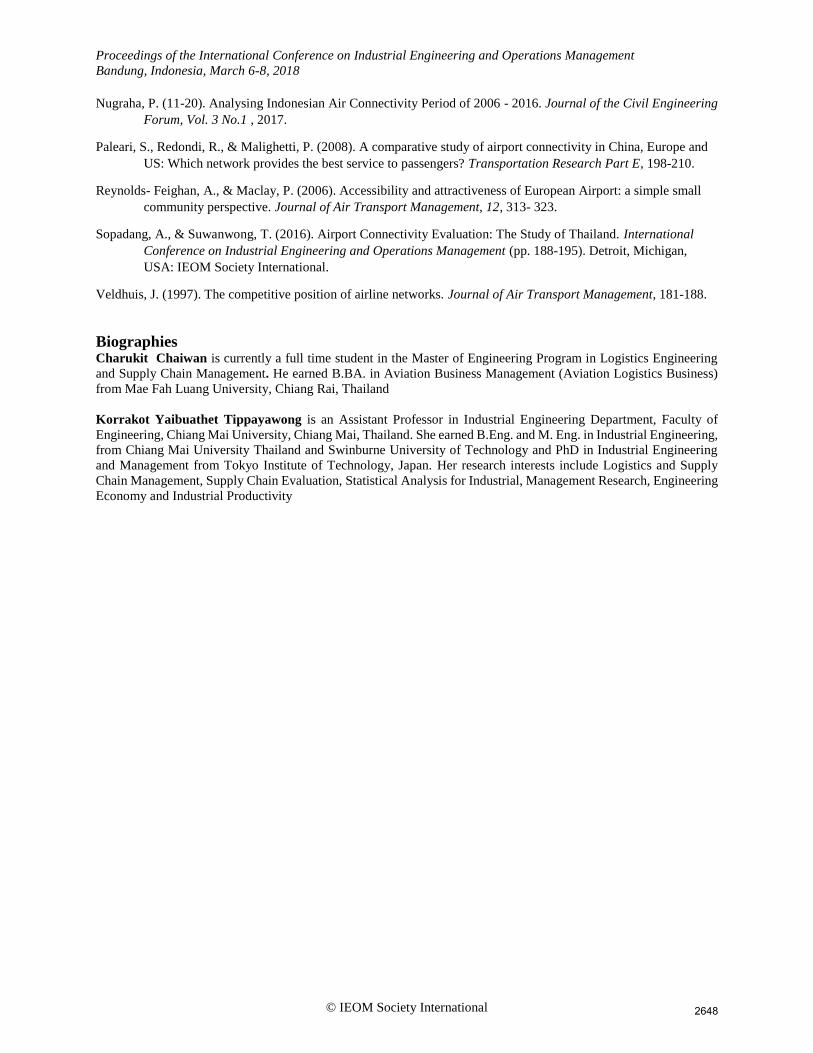
4.2 Airline networks The connectivity unit (CNU) can define the airline network at the airports. According to table 3, there are 3
low cost carriers in medium airports market, which are Nok air, Air Asia and Thai lion air. Nok air operates 14 flights
per week, which is the highest number of flight in 1 week. So Nok Air earns 94.07 CNU/week, which is the highest
CNU level in the medium sized market.
PHS TST NNT SNO KOP
CNU 59.58 50.30 33.79 30.07 29.74
0.00
10.00
20.00
30.00
40.00
50.00
60.00
70.00
2646
Proceedings of the International Conference on Industrial Engineering and Operations Management
Bandung, Indonesia, March 6-8, 2018
© IEOM Society International
Table 3. The connectivity unit of each airline
Airline Total CNU Number of flights
Nok Air 97.03 14
Air Asia 81.98 11
Thai Lion Air 24.46 4
5. Concluding remark The objective of this study is to evaluate the airport connectivity of medium airports in Thailand, which are
Sakon Nakhon airport (SNO), Nakhon Phanom airport (KOP), Nannakhon airport (NNT), Phitsanulok airport (PHS)
and Trang airport (TST). The destination of medium airports is Don Muang Airport only, because the medium airports
are operating only domestic flights and the flight distance is not too long, therefore the indirect connection is not
necessary. The direct connection which is flown directly from origin to destination is attractive for passengers than a
flight with transfer at intermediate airport. Because the medium airports operate only direct connection, thus the value
of quality index of every connection from medium airports to Don Muang Airport is closer to 1, it represents the routes
are attractive for passengers.
The connectivity unit can measuring the attractiveness of the airport and can define the competitive position
of airline networks. The future study might select the airport which has many destination into account. The airport and
airline can apply the airport connectivity concept to plan the strategy to improve the airline networks.
Acknowledgements The authors gratefully acknowledge the Excellent Center in Logistics and Supply Chain Management (E-
LSCM) for the financial support and Graduate School of Chiang Mai University for the general support
References Airports of Thailand Public Co.,Ltd. (2017, 10 25). Annual Report / Sustainability Report. Retrieved from Annual
Report / Sustainability Report: http://airportthai.co.th/main/en/752-annual-report-sustainability-report
Burghouwt, G., & Veldhuis, J. (2006). The Competitive Position of Hub Airports in the Transatlantic Market.
Journal of Air Transportation, 106-130.
Department of Airports. (2017, 10 25). Air Transport Statistics. Retrieved from Air Transport Statistics:
https://www.airports.go.th/en/content/262.html
Federal Aviation Administration. (2017, 10 25). Airport Categories. Retrieved from Airport Categories:
https://www.faa.gov/airports/planning_capacity/passenger_allcargo_stats/categories/
Jantachalobon, N., & Vanichkobchinda, P. (2012). An Analysis of Airfreight Transshipment Connectivity at
Suvarnabhumi International Airport. European Journal of Business and Management, 141-147.
Jantachalobon, N., Vanichkobchinda, P., & Suthikarnnarunai, N. (2014). Airline Network Analysis of ASEAN
International Airport Region. The Open Transportation Journal, 19-25.
Kamtaeja, S., Sopadang, A., & Chao, P. (2014). Evaliation of air connectivity of Chiang Mai airport. The 6th
International Conference on Logistics and Transport, (pp. 80-86). Kuala Lumpur, Malaysia.
Kim, J. Y. (2007). An Analysis of Airfreight Transshipment Connectivity at Incheon International Airport. Korea: A
Thesis submitted to Inha University.
Matsumoto, H., Burghouwt, G., Wit, J. D., & Veldhuis, J. (2009). Air Network Performance and Hub Competitive
Position: Evaluation Of Primary Airports In East And Southeast Asia. Journal of Air Transport
Management, 384-400.
Matsumoto, H., Burghouwt, G., Wit, J., & Veldhuis, J. (2008). Network performance, hub connectivity potential,
and competitive position of primary airports in Asia/Pacific region. Pacific Economic Review, 639-650.
2647
Proceedings of the International Conference on Industrial Engineering and Operations Management
Bandung, Indonesia, March 6-8, 2018
© IEOM Society International
Nugraha, P. (11-20). Analysing Indonesian Air Connectivity Period of 2006 - 2016. Journal of the Civil Engineering
Forum, Vol. 3 No.1 , 2017.
Paleari, S., Redondi, R., & Malighetti, P. (2008). A comparative study of airport connectivity in China, Europe and
US: Which network provides the best service to passengers? Transportation Research Part E, 198-210.
Reynolds- Feighan, A., & Maclay, P. (2006). Accessibility and attractiveness of European Airport: a simple small
community perspective. Journal of Air Transport Management, 12, 313- 323.
Sopadang, A., & Suwanwong, T. (2016). Airport Connectivity Evaluation: The Study of Thailand. International
Conference on Industrial Engineering and Operations Management (pp. 188-195). Detroit, Michigan,
USA: IEOM Society International.
Veldhuis, J. (1997). The competitive position of airline networks. Journal of Air Transport Management, 181-188.
Biographies
Charukit Chaiwan is currently a full time student in the Master of Engineering Program in Logistics Engineering
and Supply Chain Management. He earned B.BA. in Aviation Business Management (Aviation Logistics Business)
from Mae Fah Luang University, Chiang Rai, Thailand
Korrakot Yaibuathet Tippayawong is an Assistant Professor in Industrial Engineering Department, Faculty of
Engineering, Chiang Mai University, Chiang Mai, Thailand. She earned B.Eng. and M. Eng. in Industrial Engineering,
from Chiang Mai University Thailand and Swinburne University of Technology and PhD in Industrial Engineering
and Management from Tokyo Institute of Technology, Japan. Her research interests include Logistics and Supply
Chain Management, Supply Chain Evaluation, Statistical Analysis for Industrial, Management Research, Engineering
Economy and Industrial Productivity
2648