Connectivity Benchmark Report: The Enterprise’s Connected Future - APIs on the Rise
16
All contents Copyright MuleSoft Inc. Digital Transformation: It’s Happening Faster Than You Think Download the complete MuleSoft 2015 Connectivity Benchmark Report to understand top technology priorities in the next year and learn how APIs and connectivity are enabling business strategies. https://www.mulesoft.com/lp/kit/connectivity- benchmark
-
Upload
mulesoft -
Category
Technology
-
view
450 -
download
1
Transcript of Connectivity Benchmark Report: The Enterprise’s Connected Future - APIs on the Rise

All contents Copyright MuleSoft Inc.
Digital Transformation: It’s Happening Faster Than You Think
Download the complete MuleSoft 2015 Connectivity Benchmark Report to understand top technology priorities in the next year and learn how APIs and connectivity are enabling
business strategies.
https://www.mulesoft.com/lp/kit/connectivity-benchmark
The Enterprise’s Connected Future: APIs on the Rise
July 2015
Connectivity Benchmark Report Preview

All contents Copyright MuleSoft Inc.
Outline
2
(1) IT Priorities
(2) Integration Index
(3) IoT on the Horizon
(4) APIs Have Arrived
(5) Conclusion
All contents Copyright MuleSoft Inc.
Between May 1 and May 6, 2015, MuleSoft surveyed 300 IT decision makers (ITDMs) to assess how organizations of all sizes are implementing and planning for APIs, the Internet of Things (IoT), microservices and other connected technologies.
The survey’s overall margin of error is +/-4.17 percentage points at a 90 percent confidence interval.
About the survey
3

All contents Copyright MuleSoft Inc.
Executive summary
4
• The digital era has created new opportunities for enterprises to connect the unconnected. The survey results point to a world that is rapidly embracing digital transformation.
• Traditional businesses are quickly evolving into “composable enterprises” built out of hundreds of connected software services, applications and devices.
• Most are adopting the Internet of Things (IoT) and microservices technologies like Docker. A large number of organizations are integrating wearables, like smart watches.
• APIs are at the center of this business transformation, which is driven by cloud, mobile and IoT. The data reveals that the majority are generating revenue or plan to generate revenue with APIs within the next year.
IT Priorities

All contents Copyright MuleSoft Inc.
8.7%
41.3%36.7%
11.0%
2.3%
Extreme pressure
A lot of pressure
Moderate pressure
Small amount of pressure
No pressure
Most ITDMs are under high pressure to deliver faster
6
How much pressure are you under currently to deliver IT services faster than last year?
86 percent of IT respondents say they’re under “moderate” to “extreme” pressure to deliver services faster than last year.

All contents Copyright MuleSoft Inc.
SaaS, data and APIs are at the center of business plans
7
Microservices (e.g. Docker)
NoSQL databases
BYOD
Legacy apps/infrastructure
Predictive analytics
Custom mobile app development
IaaS/PaaS
Internet of Things
API development for self-serve IT
Business intelligence/data analytics
SaaS
0% 5% 10% 15% 20% 25% 30% 35%
2.3%
2.3%
2.7%
3.7%
6.7%
6.7%
7.3%
8.3%
11.3%
18.3%
30.3%
Which will be the most important to your organization's business plans in the next 12 months?

All contents Copyright MuleSoft Inc.
30.7%
34.7%
22.7%
9.7%
2.3%
Very important
Important
Somewhat important
Not important
N/A
Microservices are more than a buzzword
8
How important are microservices (e.g. Docker) to your organization’s business plans in the next 12 months?
Microservices aren’t just hype. Approximately 66% of respondents consider them “important” or “very important” to their business strategy.

All contents Copyright MuleSoft Inc. 10
65.0%
29.1%
4.9% 1.0%
Mobile is driving new investment
More ITDMs are increasing their investment in mobile. Approximately two-thirds of large enterprises (10,000 employees or more) will be investing more in mobile.
How do you characterize your organization’s investment in mobile platforms and applications?
Large enterprises (10,000 employees or more)
60.3%
34.3%
4.0% 1.3%
Investing more
Investing about the same
Divesting
N/A
All ITDM respondents
Integration Index

All contents Copyright MuleSoft Inc.
SaaS is the top integration priority
11
NoSQL databases
BYOD
Microservices (e.g. Docker)
Legacy apps/infrastructure
Custom mobile app development
IaaS/PaaS
Predictive analytics
Internet of Things
Business intelligence/data analytics
API development for self-serve IT
SaaS
0% 5% 10% 15% 20% 25% 30%
2.3%
3.0%
4.7%
6.3%
7.3%
8.0%
8.3%
8.3%
12.3%
14.3%
25.0%
Which will be your top integration priority in the next 12 months?
Top 3 IT initiatives of organization's business plans (from slide 12) are also top 3 integration priorities in the next 12 months.

All contents Copyright MuleSoft Inc.
73% of organizations integrate more than 20 apps
12
5 or fewer 6 - 20 21-50 51-100 100 or more Don’t know0%
5%
10%
15%
20%
25%
30%
35%
1.7%
25.0%
30.7%
24.3%
16.3%
2.0%
Approximately how many applications does your organization currently integrate?

All contents Copyright MuleSoft Inc.
The largest organizations integrate 100+ apps
13
Less than $10M
$10M to $99M
$100M to $499M
$500M to $999M
$1B to $2.4B
$2.5B to $4.9B
$5B to $9.9B
$10B or more
0%
20%
40%
60%
80%
100%
50.0%55.8%
26.7% 22.2%18.8%
11.1%14.3%
6.9%
16.7%
30.2%
37.8% 42.9% 35.4%
25.9% 14.3%
10.3%
16.7%
9.3%
22.2% 19.0% 33.3%
51.9%
32.1%
24.1%
16.7%
2.3%13.3% 12.7%
4.2%11.1%
35.7%
58.6%
2.3%2.1%
3.2% 6.3% 3.6%
100 or more
51-100
21-50
6 - 20
5 or fewer
Don’t know
Approximately how many applications does your organization currently integrate?
Almost 60% of organizations with $10 billion or more in revenue are integrating 100 or more apps.
All contents Copyright MuleSoft Inc.
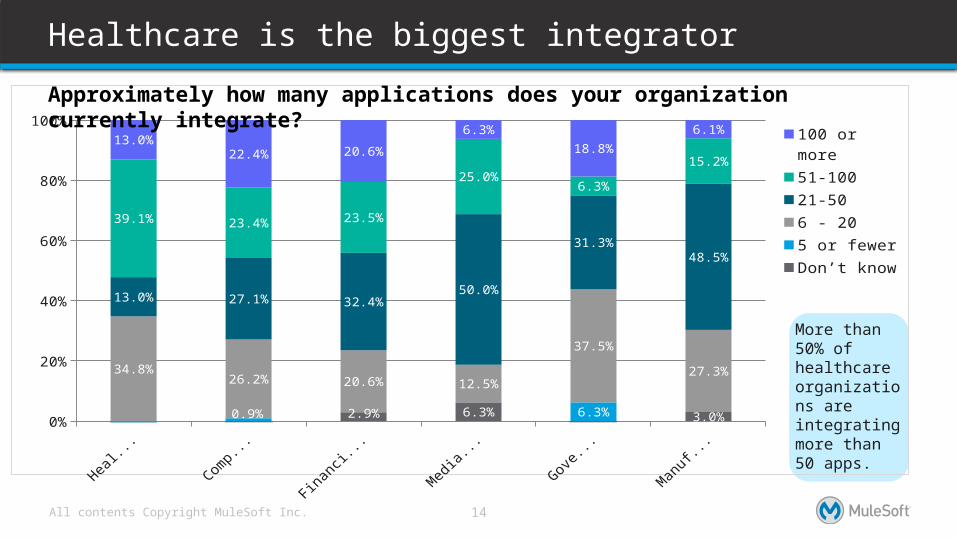
Healthcare is the biggest integrator
14
More than 50% of healthcare organizations are integrating more than 50 apps.
0%
20%
40%
60%
80%
100%
34.8%26.2% 20.6% 12.5%
37.5%
27.3%
13.0% 27.1% 32.4%50.0%
31.3%48.5%
39.1% 23.4% 23.5%
25.0%6.3%
15.2%
13.0%22.4% 20.6%
6.3%
18.8%
6.1%
0.9% 6.3%2.9% 6.3% 3.0%
100 or more
51-100
21-50
6 - 20
5 or fewer
Don’t know
Approximately how many applications does your organization currently integrate?
View the complete MuleSoft 2015 Benchmark Report to learn more about top technology priorities, how APIs are enabling business strategies and key CIO takeaways :
https://www.mulesoft.com/lp/kit/connectivity-benchmark
16