Connecting the Un-connected - ITU · Connecting the Un-connected ... Sri Lanka India Bangladesh...
17
ITU / Dec 2011/ Cape Town 1 © Nokia Siemens Networks Connecting the Un-connected -Taking benefits of mobile connectivity to bottom of pyramid- Ajay Ranjan Mishra Global Head of Industry Environment - India & Emerging Markets- Nokia Siemens Networks Let there be work, bread, water and salt for all - Nelson Mandela-
Transcript of Connecting the Un-connected - ITU · Connecting the Un-connected ... Sri Lanka India Bangladesh...

ITU / Dec 2011/ Cape Town1 © Nokia Siemens Networks
Connecting the Un -connected-Taking benefits of mobile connectivity to bottom of pyramid-
Ajay Ranjan MishraGlobal Head of Industry Environment
- India & Emerging Markets-Nokia Siemens Networks
Let there be work, bread, water and salt for all
- Nelson Mandela-
ITU / Dec 2011/ Cape Town2 © Nokia Siemens Networks
• Bridging the digital divide• Connectivity Scorecard• E-Governance• Role of Key Stakeholders• Summary
ITU / Dec 2011/ Cape Town3 © Nokia Siemens Networks
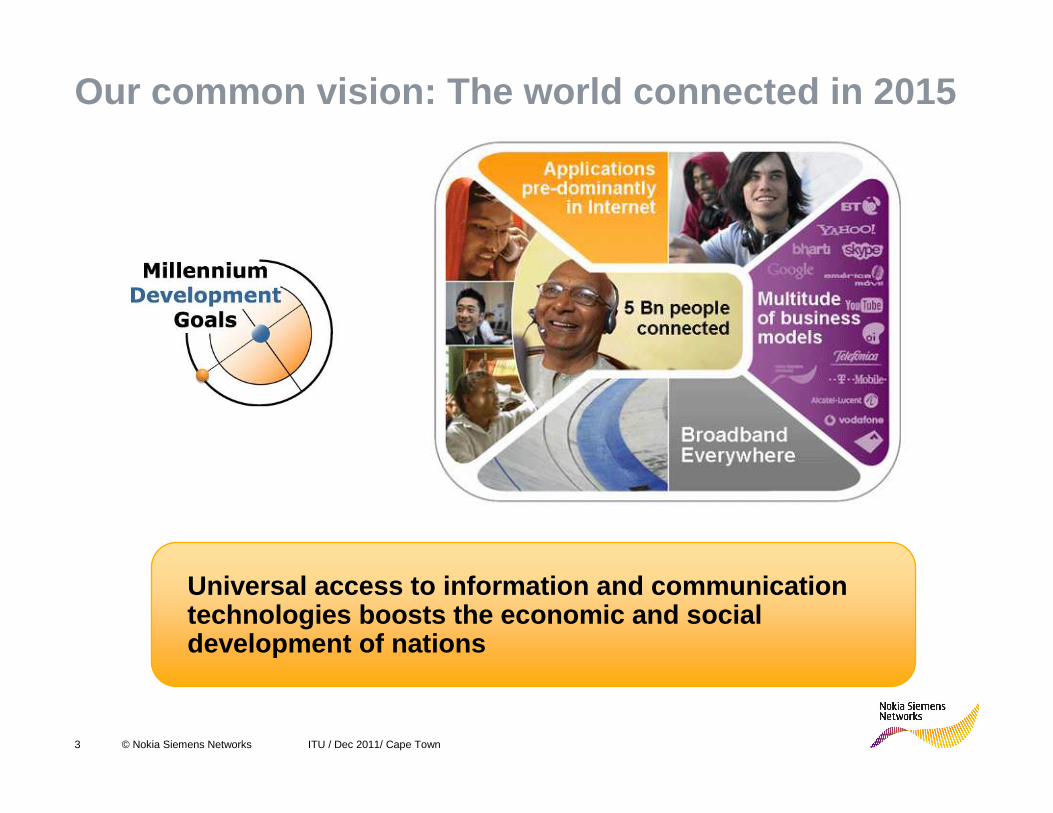
Our common vision: The world connected in 2015
Universal access to information and communication technologies boosts the economic and social development of nations

ITU / Dec 2011/ Cape Town4 © Nokia Siemens Networks
Instant SMS alerts directing users to best market prices
Shared access to mobile phones bringing mobility to millions
Microfinance & mobile entrepreneurs creating new business opportunities
Socio -economic benefits of mobility

ITU / Dec 2011/ Cape Town5 © Nokia Siemens Networks
The challenge of Universal Access
5 © Nokia Siemens Networks
Global Income Pyramid
Voice & Internet/IP
Voice & No Internet/IP
No voice & No Internet/IP
1.3b 1$/day
1.4b 2$/day
1.3b 4$/day
1.5b 4-40$/day
0,8b >40$/day
IP connectivityaffordability barrierat 1.2bn(2007)
Voice affordabilitybarrier at 3bn(2007)

ITU / Dec 2011/ Cape Town6 © Nokia Siemens Networks
New growth will come primarily from lower income segments
High Upper mid Mid Low Very lowIncome classes
Sha
re o
f pop
ulat
ion
Example income distribution
Expected penetration in 2009
Penetration now
Population without mobile
1.5 million new subscribers every day
ITU / Dec 2011/ Cape Town7 © Nokia Siemens Networks
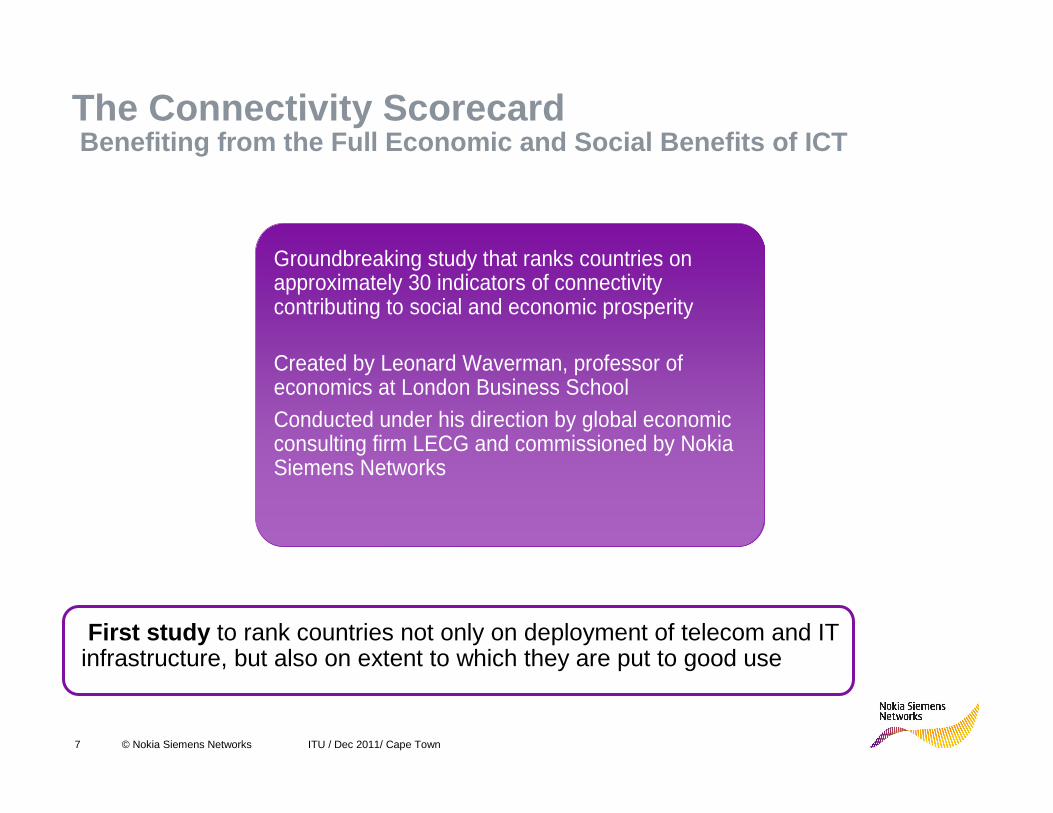
The Connectivity ScorecardBenefiting from the Full Economic and Social Benefi ts of ICT
Groundbreaking study that ranks countries on approximately 30 indicators of connectivity contributing to social and economic prosperity
Created by Leonard Waverman, professor of economics at London Business School Conducted under his direction by global economic consulting firm LECG and commissioned by Nokia Siemens Networks
First study to rank countries not only on deployment of telecom and IT infrastructure, but also on extent to which they are put to good use

ITU / Dec 2011/ Cape Town8 © Nokia Siemens Networks
Observations from the Connectivity Scorecard –For Resource driven economies
2010 2011

ITU / Dec 2011/ Cape Town9 © Nokia Siemens Networks
South Africa – Major inequalities in ICT access and usage affect score
Tumbles seven spots to rank 9 th among the resource and efficiency-driven economies• Significant ICT spends by businesses • Highest scorer in its group on public sector
related metrics• Fairly high adult literacy rates
Areas for improvement• Home penetration of Internet, broadband• Consumer skills and usage• Business internet bandwidth, ICT exports• E-governance

ITU / Dec 2011/ Cape Town10 © Nokia Siemens Networks
CS2011 - Africa

ITU / Dec 2011/ Cape Town11 © Nokia Siemens Networks
Clear link between importance of e-Services and respondent’s origin (urban) and education levels -> rural connectivity solutions should include service mediation to support & transfer the competence required to service take up
Services most expected via e-channel: job opportunities
Importance of receiving services via mobile phone a nd internet
N for Ghana = 315 to 317; India = 324; South Africa = 313
1,691,491,69Sending and receiving money
1,521,141,7Selling your crops and services
1,81,711,76Travel schedules and bookings
1,561,311,77Watching videos
1,731,551,78Paying bills
1,681,441,8Listening to or downloading music
1,731,561,83Getting and submitting government forms
1,811,441,89Health treatment and medicines
1,491,531,92Getting certificates
1,711,721,94Banking transactions services
2,11,722,1Seeking and offering job opportunities
1,871,342,23Applying to school
South Africa(mean)
India (mean)
Ghana (mean)
Scale: 1 = unimportant; 2 = important; 3 = very important
(ranked by Ghana. Top scores bolded) Priority service across markets

ITU / Dec 2011/ Cape Town12 © Nokia Siemens Networks
Affordablecommunications
UniversalAccess
Total cost of ownership
Cash barrierfor entry
Framework in bringing digital inclusion via mobile communications
Regulatory Environment
ITU / Dec 2011/ Cape Town13 © Nokia Siemens Networks
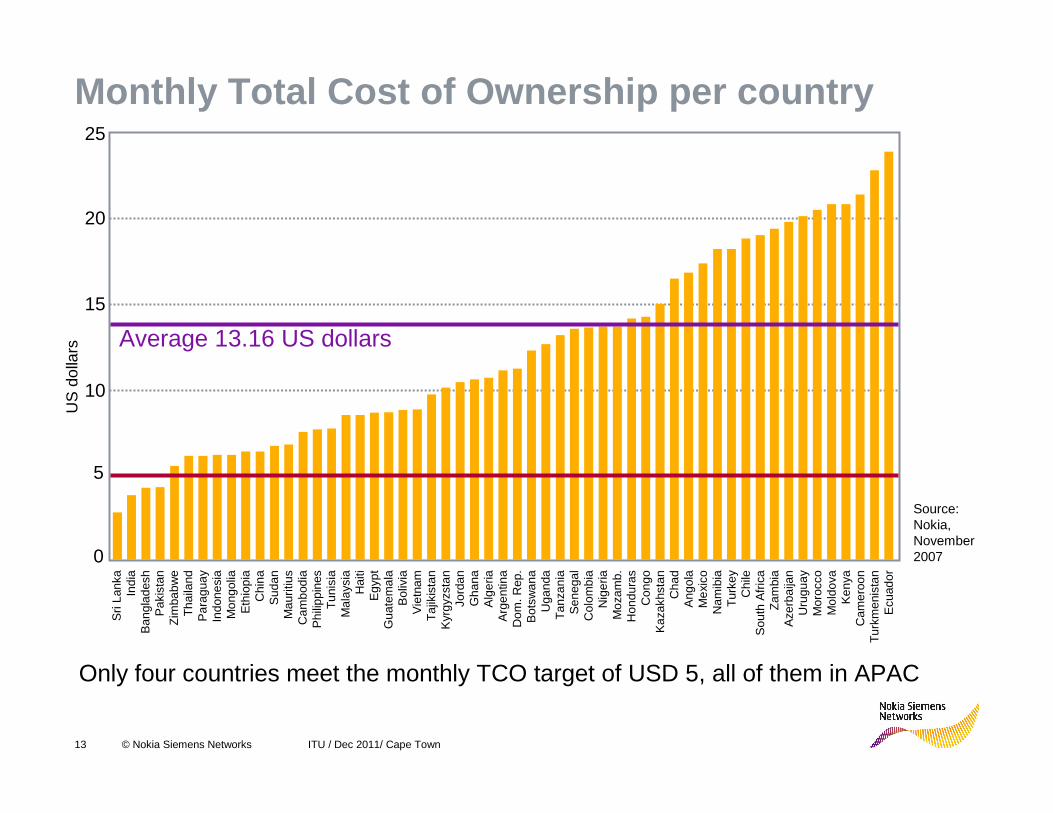
Monthly Total Cost of Ownership per country
Only four countries meet the monthly TCO target of USD 5, all of them in APAC
Source: Nokia, November 2007
Sri
Lank
aIn
dia
Ban
glad
esh
Pak
ista
nZ
imba
bwe
Tha
iland
Par
agua
yIn
done
sia
Mon
golia
Eth
iopi
aC
hina
Sud
anM
aurit
ius
Cam
bodi
aP
hilip
pine
sT
unis
iaM
alay
sia
Hai
tiE
gypt
Gua
tem
ala
Bol
ivia
Vie
tnam
Taj
ikis
tan
Kyr
gyzs
tan
Jord
anG
hana
Alg
eria
Arg
entin
aD
om. R
ep.
Bot
swan
aU
gand
aT
anza
nia
Sen
egal
Col
ombi
aN
iger
iaM
ozam
b.H
ondu
ras
Con
goK
azak
hsta
nC
had
Ang
ola
Mex
ico
Nam
ibia
Tur
key
Chi
leS
outh
Afr
ica
Zam
bia
Aze
rbai
jan
Uru
guay
Mor
occo
Mol
dova
Ken
yaC
amer
oon
Tur
kmen
ista
nE
cuad
or
US
dol
lars
0
5
10
15
20
25
Average 13.16 US dollars

ITU / Dec 2011/ Cape Town14 © Nokia Siemens Networks
Less structured cash flow of the low –income consumer
Mid incomeLow income
Time
Cash at hand

ITU / Dec 2011/ Cape Town15 © Nokia Siemens Networks
Politically & sociallydesirable
Accessgap
Government intervention toextend service into this area
PO
VE
RT
Y
GEOGRAPHIC AND AFFORDABILITY ISOLATION
Regulatory environment
Commerciallyfeasible
Marketefficiencygap
Regulatory obstacles needed to beremoved and/or new business modelswith lower cost structure needed toextend service into this area or segments
Currentexpansionplans
Existing access and penetration today
ITU / Dec 2011/ Cape Town16 © Nokia Siemens Networks
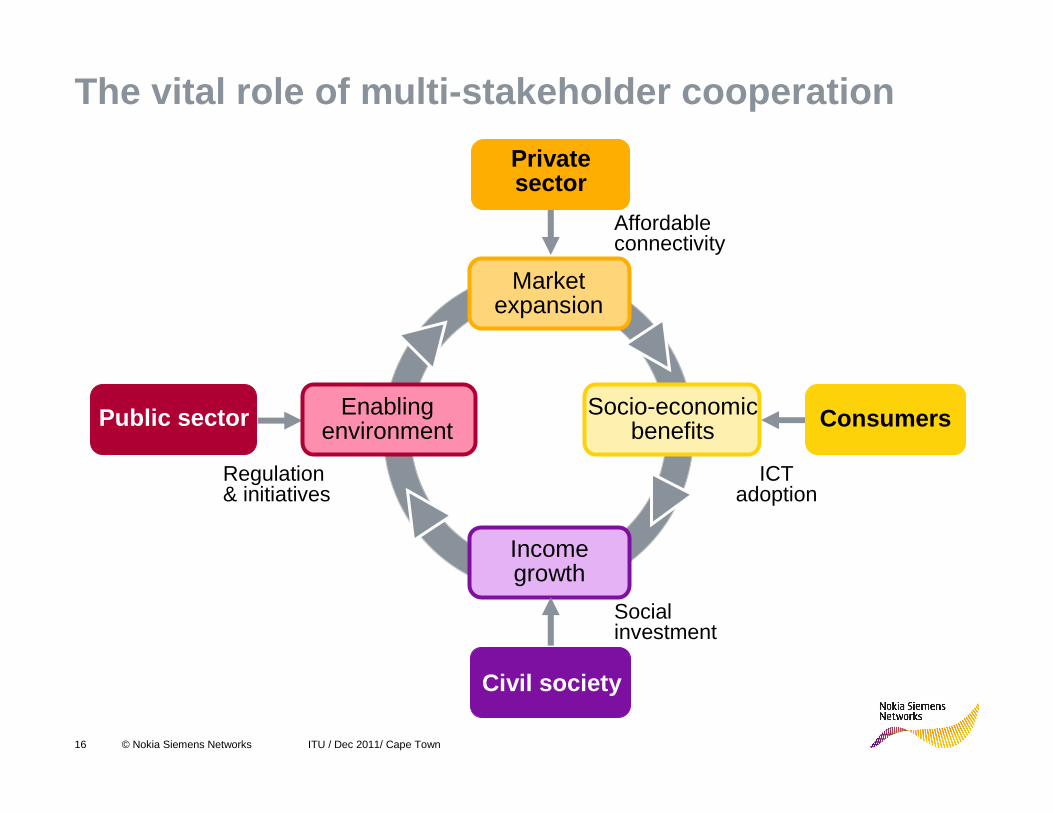
The vital role of multi-stakeholder cooperation
Private sector
Market expansion
Affordableconnectivity
Income growth
Social investment
Public sector Enabling environment
Regulation & initiatives
Socio-economic benefits Consumers
ICT adoption
Civil society

ITU / Dec 2011/ Cape Town17 © Nokia Siemens Networks
Affordability is the key factor - we need to work on
TCO
Connectivity increasing but utilisation not
New growth to come from lower income segment
Countries missing out on opportunity to add
hundreds of billions to their national revenues
Summary
Key stakeholders need to come together to make this happen.
Let there be work, bread, water, salt & Internet for all…