Connecting Risk, Severity, and Quality in Healthcare ... · PDF fileConnecting Risk, Severity,...
41
Connecting Risk, Severity, and Quality in Healthcare Measurement and Management 1 American College of Medical Quality October 29, 2009 1
-
Upload
trinhhuong -
Category
Documents
-
view
213 -
download
0
Transcript of Connecting Risk, Severity, and Quality in Healthcare ... · PDF fileConnecting Risk, Severity,...

Connecting Risk, Severity, and
Quality in Healthcare Measurement
and Management
1
American College of Medical Quality
October 29, 2009
1

Your presenters
Greger Vigen, FSA MBA. Consulting Actuary, Los Angeles CA.
Ian Duncan, FSA FIA FCIA MAAA. President, Solucia Consulting A SCIOinspire
Company. Farmington, CT.
2

The Society of Actuaries
• The Society of Actuaries (SOA) is the Education and Research body
for Life, Health, Pension and Investment actuaries in the US and
Canada.
• The SOA has approximately 20,000 members, about 4,500 of whom
indicate that “Health” is their primary area of practice.
• The SOA supports research in areas served by the profession, by:
3
• Publishing the premier actuarial peer-reviewed journal, the North American
Actuarial Journal.
• Providing funds to sponsor research by both academics and practitioners.
• Providing scholarships to a number of (PhD) graduate students.
• Sponsoring an annual Health Actuarial Meeting (1000+ attendees) as well as
specific seminars, e.g. the Predictive Modeling Symposium (jointly with
DMAA).
Found at:
http://soa.org/research/health/research-quality-
The Study:
“Measurement of Healthcare Quality and
Efficiency: Resources for Healthcare
Professionals”
http://soa.org/research/health/research-quality-
report.aspx
Authors:
Ian Duncan FSA FIA FCIA MAAA
Sheryl Coughlin PhD
Greger Vigen MBA FSA
4

What you should get from today’s presentation
• Hear an overview of the new Society of Actuaries report.
• Understand various approaches to measurement of quality
and efficiency for hospitals and physicians.
• See examples of key organizations and programs (including
pay-for-performance, networks, and payment reform).
5
pay-for-performance, networks, and payment reform).
• Discuss how risk and severity adjustments are used.
• Understand how risk and severity is integrated into
measurement.
• Hear how these techniques impact Healthcare Reform.

Implications for Predictive Modeling / Disease Management
• Overlapping illnesses, but often different business purposes• Goal is population review and program management
• Instead of real time identification of potential illnesses
• Another approach to patient identification (denominator)• Disease management approach
• HEDIS approach
• Episode approach• Episode approach
• The costs for particular episodes (numerator) are explicitly
measured; often bucketed differently
• Responsibility for action can be with vendor, physician, individual,
or a combination
6

Outline of presentation
• Summary of report
– Goals
– Report structure and measurement challenges
– Importance of measuring quality and effectiveness
– Overview of major types of organization
• A wide variety of examples
7
• A wide variety of examples
• Recent events
• Senate Finance Report and Markup
• Questions

Discussion format
A wide variety of topics are covered. We will stop at various times during the session for
comments and questions.

Summary of report

Executive summary - why this report
• Healthcare quality and efficiency are massively important – To the economy (particularly at this time)
– To you (as health professionals
– To you (as patients)
• Major innovations are occurring – time for an inventory– From technology to systems to measurement
10
– From technology to systems to measurement
• The new health reform proposals have many elements
which connect to measurement.
Importance to the economy - massive energy
• http://content.healthaffairs.org/cgi/content/abstract/hlthaff.
28.2.w346
• During the projection period (2008–2018), average annual growth
in national health spending is projected to be 6.2 percent—2.1
percentage points faster than average annual growth in gross
domestic product (GDP). The health share of GDP is anticipated to
11
domestic product (GDP). The health share of GDP is anticipated to
rise rapidly from 16.2 percent in 2007 to 17.6 percent in 2009,
largely as a result of the recession, and then climb to 20.3 percent
by 2018. Public payers are expected to become the largest source
of funding for health care in 2016 and are projected to pay for more
than half of all national health spending in 2018.

Major national article on resource variation
The Cost Conundrum:
• “What a Texas town can teach us about healthcare” by Atul
Gawande, MD, June 1, 2009.
• Annals of Medicine.
• A powerful discussion of cost and quality for the general • A powerful discussion of cost and quality for the general
population
– Based on Medicare information
• Summary at: http://www.newyorker.com/reporting/2009/06/01/090601fa_fact_gawande
?currentPage=all
12
Many new innovations in measurement
• Increased collaboration and coordination across key players.
• Extensions of historic metrics – more measures in more depth
from more locations.
• New physician quality metrics such as gaps in evidence based
care.
• Improved episodes of care, metrics and risk-profiling.
13
• Improved episodes of care, metrics and risk-profiling.
• Easier movement from “micro” to “macro.”
• Many pay-for-performance pilots and initiatives.
• Alternative networks based on quality and/or efficiency.

Report Structure
Two major components to the report
• Report on measurement approaches
• Forty-five page overview
• Inventory of Programs and Organizations (IPO)
• 83 organizations
• Over 150 products or programs
• 260 pages of summaries from organizations’ web sites
15
• 260 pages of summaries from organizations’ web sites
• More than 400 web references
• Sponsored by the Society of Actuaries Health Section.
• The final report has just been released (on-line).
http://soa.org/research/health/research-quality-report.aspx

Report Methodology
• A basic inventory of organizations and programs– Hospital quality
– Hospital efficiency
– Physician quality
– Physician efficiency
– From websites (authors have not verified statements)
16
– From websites (authors have not verified statements)
– Not an exhaustive list but representative
• Conducted between November 2008 and March 2009

Types of organizations and programs
• Organizations with a broad role
• Measure developers and approvers
• CMS
• Carriers
• State programs
• International
17
• International
• Organizations with special focus within a topic
• Hospital quality
• Hospital efficiency
• Physician quality
• Physician efficiency

Limitations and Analytic Challenges
• Medicare or commercially insured patients – not uninsured.
• Size and complexity of the United States health system.
• Definition of measurable “quality”
• Different fundamental approaches.
• Many stakeholders, goals, and therefore perspectives.
18
• Excludes items like surveys or re-engineering.
• Fast pace of evolution - essential to include both formal studies and
current practices.

Report focus is performance measures
• Three key elements for discussing performance – we
focused on the middle element
– Clinical Guidelines (substantial, literature- based requirements)
– Performance Measures (selective and measurable)
–
19
– Appropriate Use (reasonable rather than required)
• An example of an integrated approach to all three is
available at NCDR (National Cardiac Data Repository).

Fundamental concepts for efficiency measurement
• Evaluate and reduce variation – measurement of variation leads to
improvement (starting with Wennberg thirty years ago).
• Group and measure similar illnesses – such as DRGs or episodes of
care.
• Evaluate resource use – normalize for price.
• Reward clinically-sound care and avoid complications.
20
• Reward clinically-sound care and avoid complications.
Major studies often review both efficiency and measurable
quality.
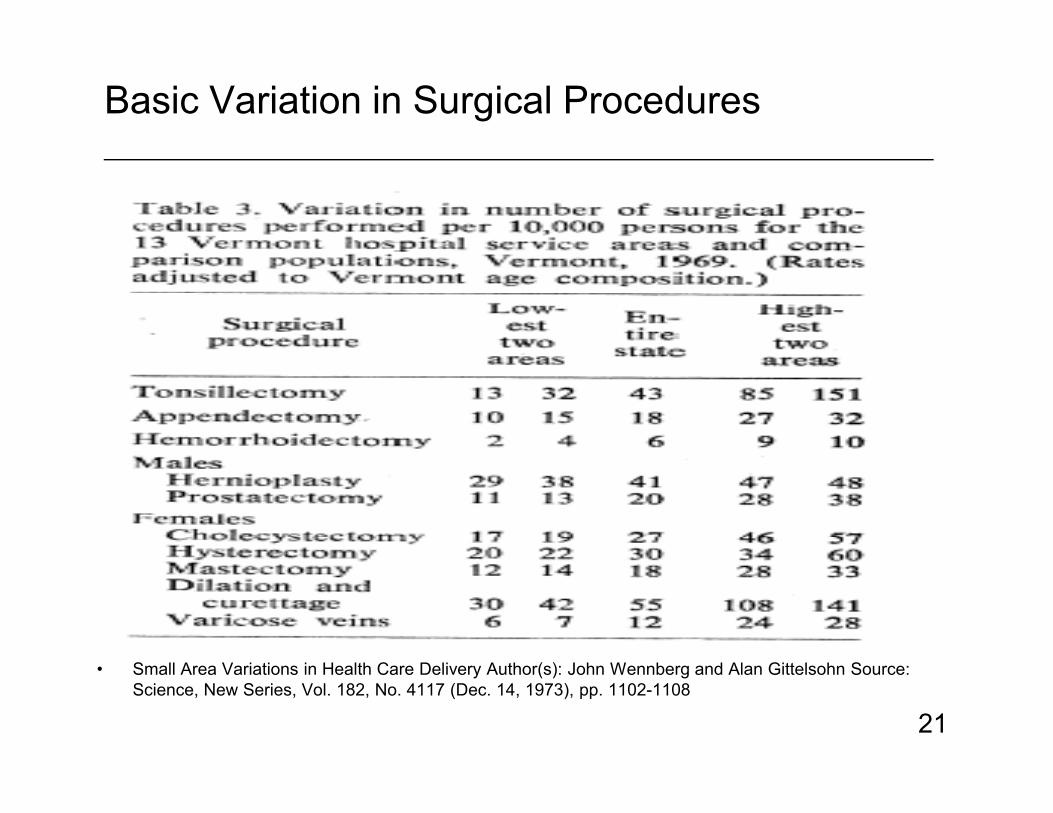
Basic Variation in Surgical Procedures
21
• Small Area Variations in Health Care Delivery Author(s): John Wennberg and Alan Gittelsohn Source:
Science, New Series, Vol. 182, No. 4117 (Dec. 14, 1973), pp. 1102-1108

Key examples

Hospital Quality
• Much wider and deeper reporting
• Including wide access to basic state-wide discharge data
• Focus on measures like Hospital Acquired Infections, and “Never
events.”
• Approaches range from key statistics (like CMS) to operational
audits by Joint Commission (JHACO).audits by Joint Commission (JHACO).
• Mostly inpatient care, with some outpatient.
• Another common approach starts with basic reporting and then
moves to more sophisticated measurement over time (for
example, the evolution of Leapfrog).
23

Hospital efficiency
• Many organizations measure hospital efficiency internally.
• Some organizations have developed measurement techniques that
are used externally.
• For example, 3M continues to expand development of DRG-based
products for payment and analytic systems to group and measure
similar illnesses.similar illnesses.
• The Dartmouth Atlas continues to work on evaluating and reducing
variation through a number of formal studies.
24

Centers for Medicare and Medicaid Services (CMS)
• Variety of public reports, Quality Improvement Organization (QIO)
program.
• Hospital Compare.
• Incentive demonstrations projects.
– Premier Hospital Quality Incentive Demonstration.
– Physician Group Practice Demonstration.– Physician Group Practice Demonstration.
• HCAHPS survey (not the focus of this report).
• Significant Medicare initiatives summarized by MedPac.
• Many other items under discussion including payment reform and
expansion of technology.
25

State programs
• Inventory of Programs and Organizations summarizes
long-standing programs in California, Massachusetts,
Minnesota, and New York plus a handful of others.
• Topics from Cardiac Care to quality and/or pay-for-performance.
• Most HMOs had pay-for-performance programs covering
more than 80% of membership.more than 80% of membership.• N Engl J Med 355;18 www.nejm.org November 2, 2006
• N Engl J Med 2006;355:1895-902.
• Many pilots and experiments underway.
• Check your local state for their unique programs.
26

Variation in Quality of Care - Physician
27
The First National Report Card on Quality of Health Care in America. This Highlight summarizes RAND
Health research reported in the various publications from 2003 to 2006
Physician quality and efficiency
• Enhanced episode of care metrics
• With severity adjustments within episodes.
• New measurement of gaps in care and evidence based
medicine.
• Early discussion around payment reform for fee-for-service
28
• Early discussion around payment reform for fee-for-service
medicine
• Hospitals
• Physicians
• Networks based on quality and efficiency metrics.
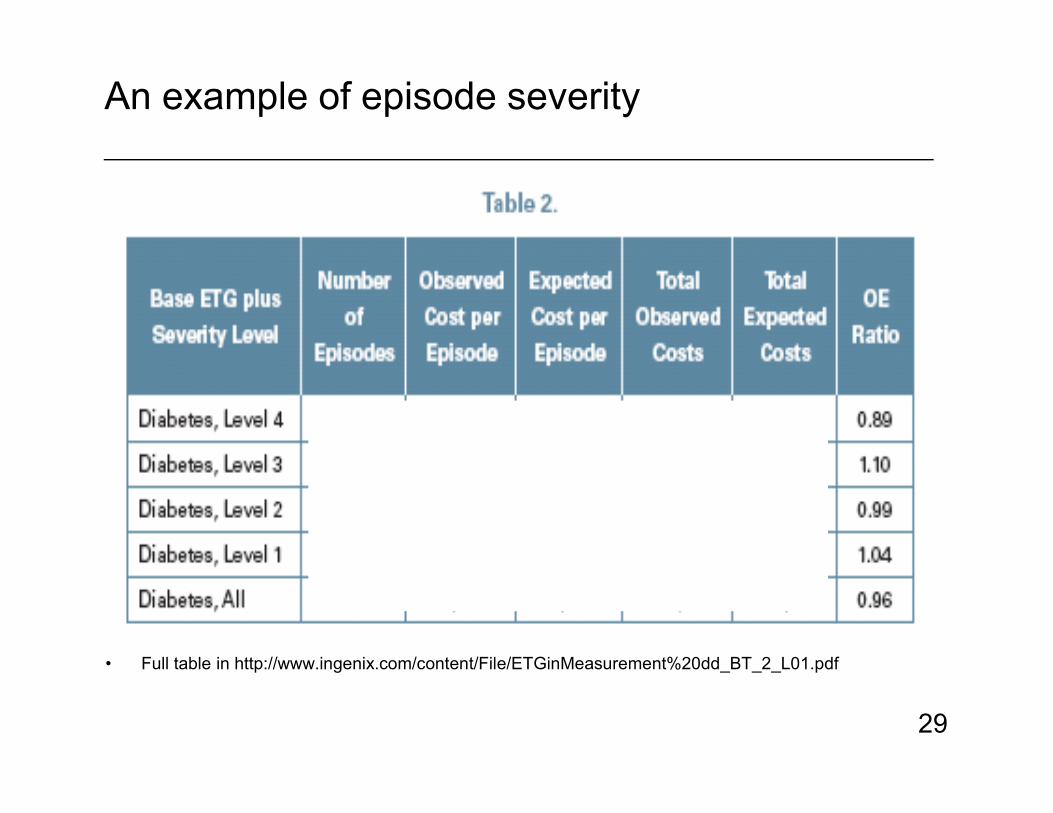
An example of episode severity
29
• Full table in http://www.ingenix.com/content/File/ETGinMeasurement%20dd_BT_2_L01.pdf

Severity within Episodes
• Severity scores and severity level is based on observed
complications and comorbidities at the episode level.
• Backup detail on the actual complications.
• Deeper episodes structure for some conditions (for example for
major skin inflammation.
• Lessen impact of the presence or absence of treatment.
30
• Lessen impact of the presence or absence of treatment.
• Shows the treatments / procedures for the episode.
• New approaches to surgical procedures and total case costs.

Cost and Quality
31
Congressional Budget Office based on data from Department of Health and Human Services, Agency for Healthcare
Research and Quality, National Healthcare Quality Report, 2005 (December 2005), Data Tables Appendix, available at
www.ahrq.gov/qual/nhqr05/index.html, and data from the Centers for Medicare and Medicaid Services’ Continuous
Medicare History Sample
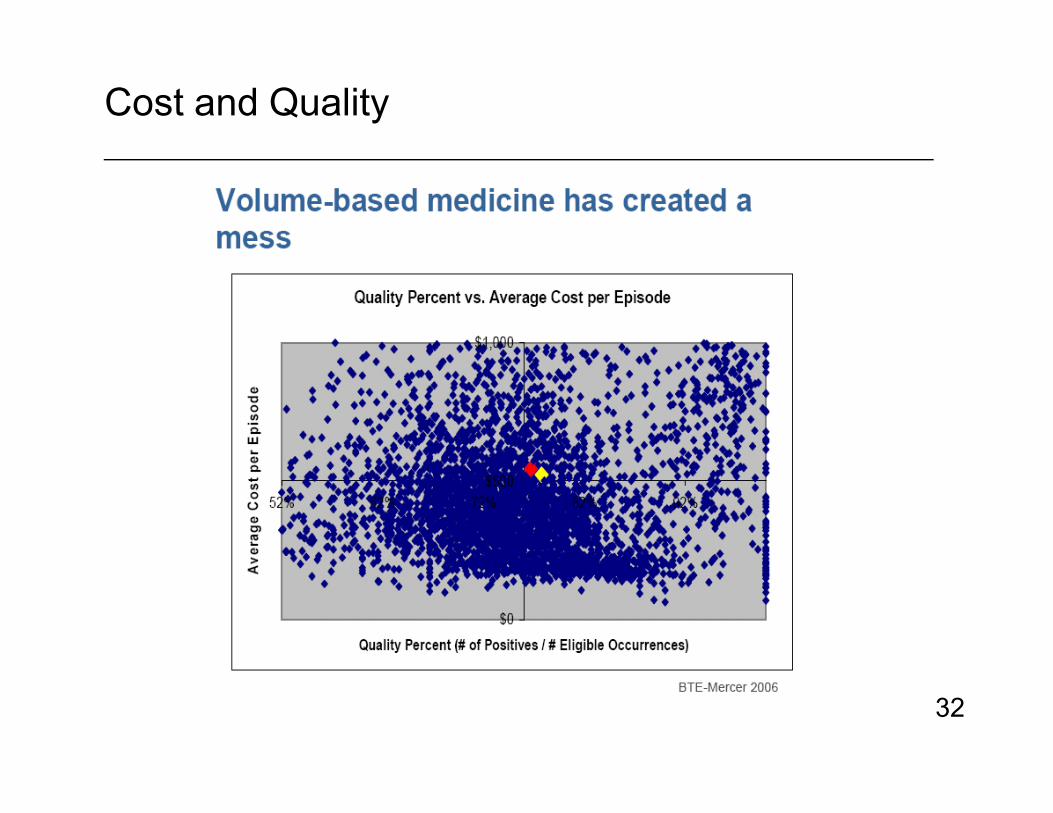
Cost and Quality
32
Applications - A Few Examples
33

Pay For Performance
34
• Integrated Health Association: StateofP4PAddress_FINAL.pdf

Alternative networks - CalPERS (Family Non-Medicare Rates)
• HMO
• Blue Shield Access Plus $16,133
• Blue Shield $13,971
• Kaiser $15,443
• PPO
• Choice $15,202• Choice $15,202
• Select $14,191
• Care $25,942
• June 2009 Board meeting Item-4a.pdf and Item-4b.pdt from
http://www.calpers.ca.gov/index.jsp?bc=/about/board-cal-agenda/agendas/home.xml
35

Healthcare Reform
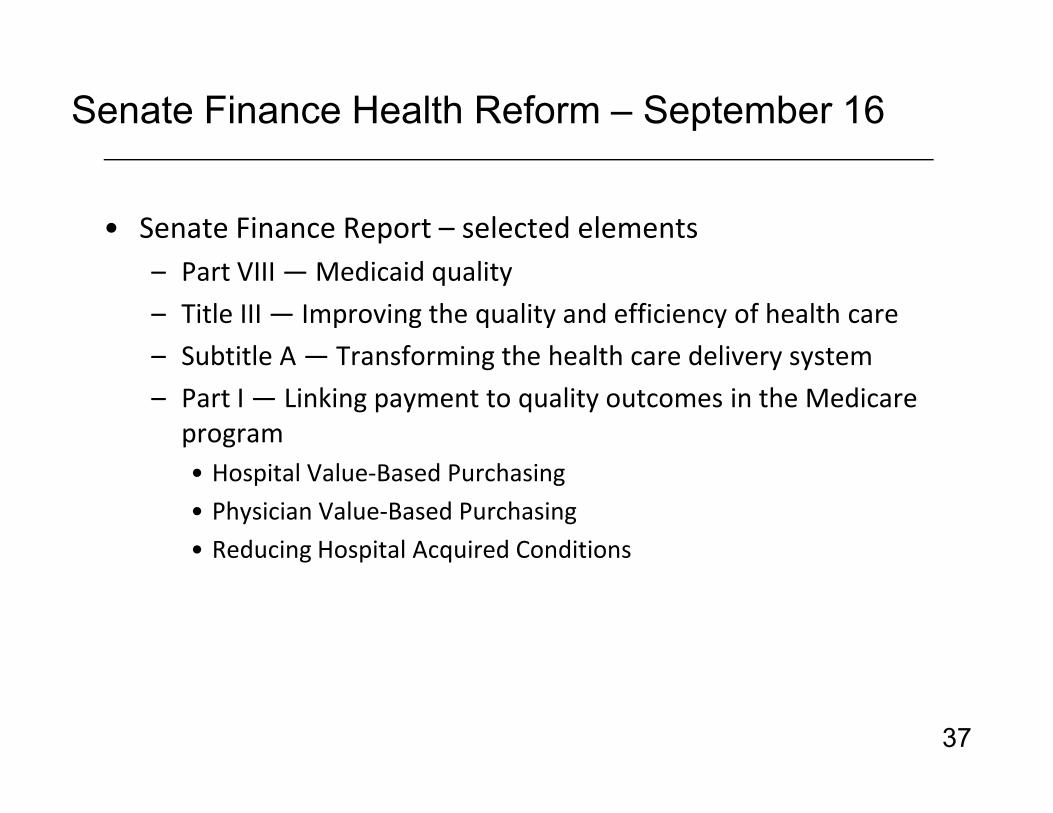
Senate Finance Health Reform – September 16
• Senate Finance Report – selected elements
– Part VIII — Medicaid quality
– Title III — Improving the quality and efficiency of health care
– Subtitle A — Transforming the health care delivery system
– Part I — Linking payment to quality outcomes in the Medicare – Part I — Linking payment to quality outcomes in the Medicare
program
• Hospital Value-Based Purchasing
• Physician Value-Based Purchasing
• Reducing Hospital Acquired Conditions
37

Senate Finance Health Reform – September 16
– Part II — Strengthening the quality infrastructure
• Alternative payment methodologies - coordinate and to be jointly
accountable
– Part III—encouraging development of the new patient care
models
• National Pilot Program on Payment Bundling
38
• National Pilot Program on Payment Bundling
• Reducing Avoidable Hospital Readmissions
– Gainsharing.

Payment Reform
• Reporting
• Pay for Coordination
• Pay for Performance
• Episode Based Payments
• Shared savings
39
• Shared savings
• Partial or full capitation

Questions
4040

Thank you!
4141 41
American College of Medical Quality
October 29, 2009