Solutions That Fit - Sage Accpac, SageCRM, Human Resource, BI, CRM

Connecting Microsoft Power BI with Sage Intelligence Reporting
Kayshree Govender
12 07 2016

Connecting Microsoft Power BI with Sage Intelligence Reporting Page 2 of 25
1.0 Introduction 3
2.0 Starting out with Power BI 4
2.1 The fundamentals 4
2.2 Licensing 4
2.3 Power BI Desktop System Requirements 5
2.4 Power BI Service Requirements 5
3.0 Process 6
3.1 Defining your container 6
3.2 Adding your report in the Report Manager 6
3.3 Formatting your report template 8
3.4 Task Scheduler 12
3.5 Power BI Desktop 16
3.6 Publishing to the Power BI Service 20
3.7 Adding dashboards 22
3.8 Sharing dashboards 23
3.9 Power BI Mobility 24
Table of Contents

Connecting Microsoft Power BI with Sage Intelligence Reporting Page 3 of 25
In the last several years, there has been a growing demand for self service Business
Intelligence with a focus on savvy data visualisation. Microsoft, initially, have responded
to this by adding new data analysis and visualisation features like Power Query, Power
View and Power Map to Excel. But all this has culminated in the release of a single
application for this which is Power BI.
Like Excel is the ubiquitous solution for spreadsheet based work, Power BI is poised to
become the same for powerful data transformation and presentation. As such, it makes
sense that it be used in addition to Excel, as the front end for Sage Intelligence, giving you
a further means to effectively represent your financial and operation data.
This document explains the process of connecting Power BI with Sage Intelligence to be
able to create attractive and interactive reports and dashboards from your Sage
accounting package or business solution data. The high level steps involved include:
Adding a report in the Report Manager for the data you want to report on.
Formatting the template for the report in a way that can be consumed by Power BI.
Scheduling the running of it using the Windows Task Scheduler.
Connecting Power BI Desktop to the output workbook.
Adding your visualisations and then publishing them to the Power BI Service.
Creating your dashboards, sharing them and viewing them through mobile
devices.
Before working through the process using an example, an introduction to Power BI is
given and the requirements for it will be discussed. It is assumed that you are already
using Sage Intelligence and have a basic understanding of working with reports in the
Report Manager.
Setup report
• Choose container
• Add report
• Format template
• Set output file
Schedule report
• Get scheduler command
• Set up task
Power BI Desktop
• Get data
• Create report
• Publish
Power BI Service
• Create dashboards
• Share
• View
1.0 Introduction

Connecting Microsoft Power BI with Sage Intelligence Reporting Page 4 of 25
2.1 The fundamentals
Power BI is made up of two main components, Power BI Desktop and the Power BI
Service. Power BI Desktop is an application that you download and install on your local
machine. The Power BI Service is a cloud based application that you access through
your web browser.
Both provide the ability to connect to different types of data sources and design reports.
However, the Desktop’s strength lies in its data transformation capabilities whereas the
Service is intended for the creation and sharing of dashboards.
Working together, the desktop is typically used to connect to data, massage it and then
define reports from it. They are then published to the Service where dashboards can be
created and shared as well as view on mobile devices.
2.2 Licensing
Two license models are provided by Microsoft, one free (Power BI) and the other paid for
(Power BI Pro). A comparison of the two can be found here. The paid for version can
also be purchased through this link.
The example in this document makes use of the free version and the Desktop program
can be downloaded here. To make use of the Power BI Service you need to sign up for it
and this can also be done through the same link. Take note that a work email address
needs to be used for this. Microsoft doesn’t support registration using public email service
addresses like Gmail, Yahoo or Outlook.
Once signed up, you can access the Service by going to app.powerbi.com and signing in
with the same credentials. Also, in order to publish your content from the Desktop to the
Service you need to be signed in on the Desktop using the same account. If you’re
already using or intend using Power BI Pro, the process of connecting to Sage
Intelligence is still the same.
2.0 Starting out with Power BI

Connecting Microsoft Power BI with Sage Intelligence Reporting Page 5 of 25
2.3 Power BI Desktop System Requirements
Windows 7 / Windows Server 2008 R2 or later
Microsoft .NET 4.5 installed
Internet Explorer 9 or later installed
Processor: 1 GH or faster x86 or x64 bit processor
Memory: At least 1 GB of RAM, 1.5 or more is recommended
Display: At least 1440x900 or 1600x900 (16:9) resolution. Lower resolutions such
as 1024x768 or 1280x800 are not recommended, as certain controls (such as
closing the startup screen) cannot be seen.
2.4 Power BI Service Requirements
Supported browsers include:
Microsoft Edge and Internet Explorer 11
Latest versions of Chrome, Firefox and Safari
Connecting Microsoft Power BI with Sage Intelligence Reporting Page 6 of 25
3.1 Defining your container
The starting point for your Power BI report begins with a container in the Connector linking
to the data you would like to report on. As you’re most probably aware, if you have a
Connector license, you are able to define your own containers. Otherwise you can make
use of the standard ones provided for your accounting package / business solution
through the Report Manager.
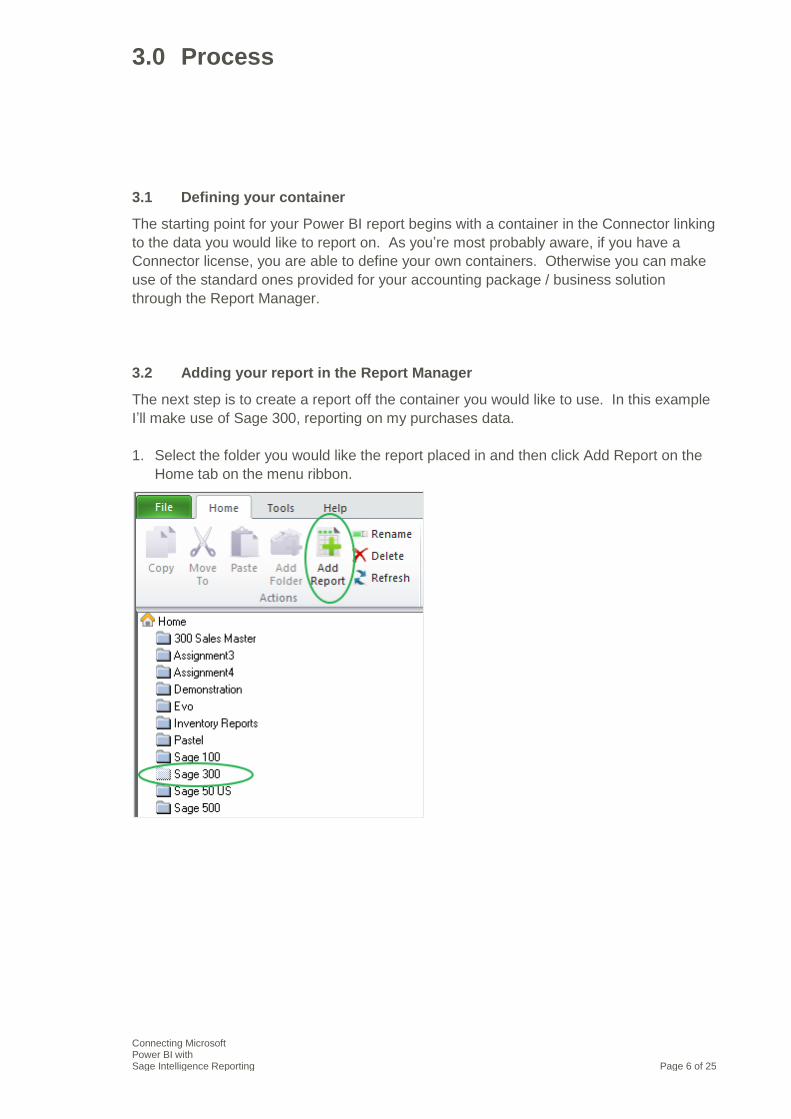
3.2 Adding your report in the Report Manager
The next step is to create a report off the container you would like to use. In this example
I’ll make use of Sage 300, reporting on my purchases data.
1. Select the folder you would like the report placed in and then click Add Report on the
Home tab on the menu ribbon.
3.0 Process

Connecting Microsoft Power BI with Sage Intelligence Reporting Page 7 of 25
2. The following screen will be displayed. Select Standard Report and click OK.
3. Next, give your report a suitable name and click OK.
4. You must then select the container you want to use and click OK.

Connecting Microsoft Power BI with Sage Intelligence Reporting Page 8 of 25
5. You’ll then be asked to pick the columns/fields you want to include. In this example, all
have been chosen. You can then click OK.
6. You report will be created and added to your folder. You may want to modify it further
using the options in the Report Manager like filters or parameters, etc.
3.3 Formatting your report template
Before running out your report and editing the template in Excel, a few properties should
be considered. Some of these are advanced options so make sure that Show Advanced
is checked at the bottom of the Properties tab.
1. Although you can include parameters on the second sheet if you would like to make
use of them in your Power BI reports, I’m going exclude mine from my report.

Connecting Microsoft Power BI with Sage Intelligence Reporting Page 9 of 25
2. It’s important to uncheck Automatically Format First Sheet. This is so that any
formatting Intelligence Reporting would otherwise apply when a report is run out,
doesn’t interfere with the formatting that needs to be added to the template shortly.
3. Once complete you need to run out your report, entering any values for parameters
you may have added. These don’t need to be values for an actual set of data you
want to work with but must be such that the report returns data.
Your data will be run out into Excel and placed in Sheet 1.

Connecting Microsoft Power BI with Sage Intelligence Reporting Page 10 of 25
4. You then need to create a table from the source data. You can do this by first clicking
anywhere in it and then either pressing CTRL + T on your keyboard, or by going to the
Insert tab and selecting Table.
5. When the data selection dialogue appears, click OK to accept the full range.
6. The table will be given a default name of Table 1 and you can change this to
something more personal if you like.
7. Once finished, link the workbook/template back to your report in the Report Manager
using Save Excel Template. If you have multiple workbooks open, make sure that you
select the right one to save.
8. Once complete, open up your template again by selecting Design on the ribbon in the
Report Manager. You’ll see that the table, although empty, still takes up the same
amount of space as when it was created. This can cause a problem because if your
report is run out with less data, the table area will be bigger than the amount of data
and will result in blank rows being brought into Power BI. The trick is to reduce the
size of it to the smallest possible. Do this by selecting rows three until the end and
deleting them. If you’re unsure how to do this, select the row label for row three to the

Connecting Microsoft Power BI with Sage Intelligence Reporting Page 11 of 25
left of the sheet, press CTRL + Shift + Down Arrow on your keyboard, then right click
on the label of one of the selected rows and select delete.
9. Your table will now be 1 row in size (excluding the header row). You can then save it
using the normal Excel save function and close the file. So that you understand, now
when your report is run out with more data, the table will expand to accommodate it.
You now need to create an output file for the report. This file will work as the source data
for your Power BI report.
10. To do this, in the report’s properties, scroll down to the Generate Output File field, click
on the ellipsis button and specify the location where you want it to be saved. This
could be a shared network location or even a OneDrive folder. By default, you may
only be able to select xls as the file format. It is necessary that it be in xlsx format and
you can change this by typing in the additional x at the end of the file name in the
Generate Output File field.

Connecting Microsoft Power BI with Sage Intelligence Reporting Page 12 of 25
3.4 Task Scheduler
In order to avoid running out your report every time you want to update the data in it, you
can schedule it to run automatically using the Windows Task Scheduler.
1. While still in the Report Manager, the first step to this is to generate a scheduler
command. You can do this by right clicking on your report and selecting Generate
Scheduler Command.
2. If your report has parameters, you’ll be asked to enter the values you would like to
use. If the values will be the same for each report run then you can enter them
otherwise if they are going to vary, for example, a current period value, then you can
make use of the Sage Intelligence system variables for this.
3. Once entered, click OK. The command will be shown and copied to the click board for
easy reference later. You can click OK again.
4. Next, open the Task Scheduler. You can find it under Administrative Tools in the
Windows Control Panel or by opening your Start menu and searching for Task
Scheduler.

Connecting Microsoft Power BI with Sage Intelligence Reporting Page 13 of 25
5. Once open you will see the below screen and you can start setting up your schedule
by selecting Create Task.
6. You can then enter a name and description, and set the security and configuration
options for it.

Connecting Microsoft Power BI with Sage Intelligence Reporting Page 14 of 25
7. Next, show the Triggers tab and add a new one.
8. The following window will appear and you can set up the frequency that you would like
your report to be run. Once finished click OK.

Connecting Microsoft Power BI with Sage Intelligence Reporting Page 15 of 25
9. You then need to show the Actions tab and add a new one.
10. Under the Edit Action dialogue, make sure that Start a program is selected for Action
and then enter your scheduler command in the Program/script field. You can do this
by selecting the field and pressing CTRL + V on your keyboard or by right clicking on
the field and selecting Paste. You can then click OK.

Connecting Microsoft Power BI with Sage Intelligence Reporting Page 16 of 25
11. Your scheduled task is now complete and you can keep track of its occurrence using
the History tab for it.
If you would like more information on scheduling reports in Sage Intelligence, check out a
video on it here.
3.5 Power BI Desktop
Power BI Desktop provides advanced query, modelling and report creation features that
enable you to build data models, create reports, and share your work by publishing it to
the Power BI Service.

Connecting Microsoft Power BI with Sage Intelligence Reporting Page 17 of 25
1. Once you have downloaded and installed the Power BI Desktop program and have
opened it, the following screen will be displayed. To access your source data, you
must click on the Get Data link. This option is also available on the menu ribbon in
program.
2. Then with File selected on the left, choose Excel as the data source and click Connect.

Connecting Microsoft Power BI with Sage Intelligence Reporting Page 18 of 25
3. Browse to the location where your output file is being saved and select it. Note that it
would have needed to be run out once in order for the file to exist.
4. The following screen will appear prompting you to choose the data range you want to
include in your dataset. The Excel table you created earlier will be listed. Select it and
click the Load button.

Connecting Microsoft Power BI with Sage Intelligence Reporting Page 19 of 25
5. Like with Pivot Tables in Excel, there will be a field list that appears.
6. To create a visualization, start by selecting the fields you want to include and then
choose the type of visualization you want from the Visualizations pane.
In my example, by choosing the Purchases Total, Fiscal Year and Fiscal Month fields, and
using a Clustered Column Chart visualization, the following is displayed.

Connecting Microsoft Power BI with Sage Intelligence Reporting Page 20 of 25
This is just the start. You can keep adding more gauges to make a powerful, interactive
dashboard like the one shown below. To get more information on using Power BI
Desktop and creating reports in it, take a look here.
3.6 Publishing to the Power BI Service
Once you have completed your reports, you can publish them to the Power BI Service.
Both the data in the data model as well as your reports are uploaded.
1. To do this, in Power BI Desktop, go to File > Publish > Publish to Power BI or click
Publish on the menu ribbon.
2. After you click publish you’ll first be asked to save your work. This will be like saving a
normal file, to a folder on your local machine or shared location, and is as a pbix file
which is the native file type for Power BI files. The upload will then take place.

Connecting Microsoft Power BI with Sage Intelligence Reporting Page 21 of 25
Note that to be able to publish you need to be signed into your Power BI account in the
Desktop program. You can do this by clicking on Sign in near the top right of the window.
3. Once finished you’ll receive a success message and you can use the link to open your
report in the Power BI Service.
4. If you are not already signed in to the Service online, you’ll first be asked to do so.
Once done, and your workspace loads, you will see the data set and report added to
the menu on the left.

Connecting Microsoft Power BI with Sage Intelligence Reporting Page 22 of 25
5. By selecting the item under Reports, your report, as it appeared in Power BI Desktop
will be shown. And by clicking on the item under data sets, the same field list and
visualisation type functionality that appeared in the Desktop will be shown, allowing
you to create new reports.
3.7 Adding dashboards
Once a report exists in the Power BI Service, dashboards can be made from it.
1. To create one, you can either add an entire report or each individual chart by using the
pin icon in the menu above your report or the one above each visualisation
respectively.
2. When you do so you’ll be asked whether you want to add to an existing dashboard or
create a new. If it’s a new dashboard, you’ll need to enter a name for it.
3. Once a dashboard has been created it will be listed under the Dashboards heading in
the menu on the left of your screen. You can then select it to view it.

Connecting Microsoft Power BI with Sage Intelligence Reporting Page 23 of 25
3.8 Sharing dashboards
Dashboards are what you’re able to share in Power BI.
1. Once one is selected, you can use the Share function on the menu near the top right
of your window to do so.
2. The following dialogue will then appear where you can enter the email addresses of
the people you would like to share it with, include a message, and decide whether you
would like recipients to be able to forward it or have an email notification sent to them
as well.
One thing to note is that you can only share dashboards with people in your business, i.e.
who have the same email domain as you. If you try enter an email address outside of
your organisation, the Share button will be disabled.

Connecting Microsoft Power BI with Sage Intelligence Reporting Page 24 of 25
Once a dashboard is shared it will appear under Dashboards in the Power BI Service of
the people you’ve shared it with. The below image gives an example of a dashboard that
has been shared with me.
If you would like more information on using the Power BI Service then take a look here.
3.9 Power BI Mobility
A third component that makes up Power BI is the Power BI app. It can be downloaded for
Apple, Android and Microsoft devices for their respective stores.

Connecting Microsoft Power BI with Sage Intelligence Reporting Page 25 of 25
Once open, it allows you to view any reports or dashboards that you have added in the
Power BI Service.
It’s important to note that because of the smaller screen size of mobile devices, some
visualisations are better suited to them than others. If you would like more information on
the Power BI app, take a look here.