CONNECTICUT RIVER BASIN - United States Fish and ... Fishway Passage Design Guidelines for Atlantic...
36
CONNECTICUT RIVER BASIN ANADROMOUS FISH RESTORATION: Coordination and Technical Assistance F-100-R-33 Annual Progress Report October 1, 2015 - September 30, 2016 U.S. Fish and Wildlife Service Connecticut River Fish and Wildlife Conservation Office Kenneth Sprankle, Project Leader 103 East Plumtree Road Sunderland, MA 01375-9138
Transcript of CONNECTICUT RIVER BASIN - United States Fish and ... Fishway Passage Design Guidelines for Atlantic...

CONNECTICUT RIVER BASIN
ANADROMOUS FISH RESTORATION: Coordination and Technical Assistance
F-100-R-33
Annual Progress Report October 1, 2015 - September 30, 2016
U.S. Fish and Wildlife Service Connecticut River Fish and Wildlife Conservation Office
Kenneth Sprankle, Project Leader 103 East Plumtree Road Sunderland, MA 01375-9138
Page 2 of 36
Executive Summary
Federal Aid Project # F-100-R-33
States: Connecticut, Massachusetts, New Hampshire and Vermont
Project Title: Connecticut River Basin Anadromous Fish Restoration: Coordination and
Technical Assistance
Period Covered: October 1, 2015 - September 30, 2016
This annual report provides an opportunity to organize and document, to varying degrees,
all work activities conducted by the Connecticut River Fish and Wildlife Conservation
Office (CTRFWCO), formerly the Connecticut River Coordinator’s Office, which includes
work outside of the Connecticut River basin and activities not funded by this grant.
Objectives:
Coordinate the Connecticut River Anadromous Fish Restoration Program as a unified effort
of State and Federal fishery agencies
Provide technical assistance to the fishery agencies and other program cooperators
Identify fishery program priorities, design and implement projects to address issues and
opportunities, and develop plans
Administer several different federal grant programs to address fish habitat, passage,
management, and research projects
Accomplishments:
Program Coordination
Organized two Connecticut River Atlantic Salmon Commission (CRASC) and two CRASC
Technical Committee meetings
Organized CRASC Shad Studies and River Herring subcommittee meetings
Served as USFWS project officer for U. S. Geological Survey Conte Anadromous Fish
Research Laboratory (CAFRC) – Effects of temperature and energy use on fish passage and
spawning success of American Shad (2015-2017), USFWS Science Support Program
Provided annual upstream and downstream fishway operations letters to hydropower owners
and the Federal Energy Regulatory Commission (FERC)
Coordinated river herring population assessment and restoration activities in the Connecticut
River basin
Coordinated meetings and activities of the CRASC Connecticut River Basin American Shad
Management Plan update team

Page 3 of 36
Coordinated multi-agency American Shad population model meetings with NOAA Fisheries
technical staff and partners
Technical Assistance
Completed downloading and servicing of all remote water temperature loggers
Participated in ongoing hydropower federal relicensing meetings, study report reviews, and
comment/response letter development, for both FirstLight Power and TransCanada
Installed the new 990 gallon, insulated fish transport tank and refitted on truck
Completed the Annual Sport Fish Restoration Grant Report for FY15
Completed additional analyses of 2011 and 2012 American shad migration study. An oral
presentation “Passage performance and migratory delay of American Shad at the Holyoke
Fishlifts,” co-author with Ted Castro-Santos (presenter) was given at the 6th
International
Fish Passage Conference at UMass/Amherst, June 2016
Data summarization and analyses (ongoing) were completed on the river herring assessment
program data
Conducted river herring population assessment
surveys on 25 dates from March 30, through June
2, 2016, at seven standard sample location
Processed in the field a total of 1,586 Blueback
Herring (BBH) and 586 Alewife (ALW) captured
for biological data, during spring 2016 river
herring population surveys
Processed in the laboratory a total of 730 BBH
and 461 ALW, subsampled and retained from
field (e.g., otolith extractions and scales) in 2016
Cleaned and slide mounted scale samples from all 2016 lab processed river herring (N =
1,191)
Obtained tissue samples from 60 Alewife (Mattabesset R) tested for fish health
(viral/bacterial), by USFWS Lamar Fish Health Unit, no tested pathogens detected
Obtained tissue samples from 60 American Shad from Holyoke Fish Lift for fish health
testing (USFWS Lamar), no detected pathogens
Served as a USFWS member to Northeast Regional Agency River Herring Team, provided
updates on population assessment activities
Served as USFWS member to the Atlantic States Marine Fisheries Commission’s Shad and
River Herring Technical Committee, participated in on-line meetings/activities, installed as
Vice Chair
Participated in ASMFC River Herring Monitoring Workshop and contributed to Workshop
Report, available ASMFC web site: http://www.asmfc.org/uploads/file/56fc3c6dRH_DataCollectionStandardizaitionWorkshopSummary_March2016.pdf
Captured American Eel by back-pack electrofishing to support USGS Conte Lab research on
swimming performance studies
Served as member on the USFWS Connecticut River Pilot for the Landscape Conservation
Cooperative and its aquatic team
Participated in World Fish Migration Day at Holyoke Fish Lift in May
Provided program information and requested data to cooperators, researchers, and the public
a Alewife (top) and blueback herring

Page 4 of 36
Provided field support to UMASS/Conte Lab, PhD student conducting research on egg and
larval development of Blueback Herring
Provided presentation to UCONN/Storrs Department of Natural Restoration on career
opportunities/panel discussion
Served as a reviewer for NOAA Fisheries SK Grant proposals and the Federal Interagency
Nature-like Fishway Passage Design Guidelines for Atlantic Coast Diadromous Fishes
(released in May)
Revised Office web site, provided oversight of design and materials posted
Revised the CT River Basin Fishway Counts report and distributed 2-3 times a week in-
season electronically and posted updates on the Office web site (Appendix A)
Supervised a University of New Hampshire student intern, and four Student Conservation
Interns
Recruited and hired a Biological Trainee (Pathways-term) Biologist from UMass/Amherst
Captured by boat electrofishing 1,010 blueback herring that were transferred to the Oxbow,
Easthampton, MA
Transferred 976 American Shad, from the Holyoke Fish Lift, to the Farmington River (CT),
upstream of the Rainbow Dam
Conducted sea lamprey nest surveys in Massachusetts in the lower Green River, Fall River
(above and below removed dam), lower Sawmill River, target reaches of the Manhan River,
lower Dry Brook (below 1st dam), lower Four Mile Brook, lower Whetstone Brook; in New
Hampshire in the lower Ashuelot River, and in Vermont on a reach of the lower West River
(VT), downstream of Townshend Dam
Maintained adult Atlantic salmon return and stocking
databases, and fish transfers databases
Completed the cleaning, mounting and reading of
nearly all (90%) back-logged scale samples of river
herring
Maintained fish passage (counts) databases, provided
data as requested
Conducted stream electrofishing surveys below first
barriers in select tributaries (Massachusetts) to assess
American Eel relative abundance and size structure
Staff assisted in a regionally coordinated culvert assessment program in Massachusetts and
New Hampshire
Assessed juvenile production (fall) of Blueback Herring transferred to the Oxbow and
sampled Wethersfield Cover (CT) for comparison of data
Provided assistance for S. O. Conte National Wildlife Refuge Comprehensive Conservation
Plan (aquatic section narratives)
Participated in the Connecticut River Watershed Council Source to Sea clean-up with boat.
Backpack electrofishing

Page 5 of 36
Acknowledgements
There are many people that have contributed to the work accomplished by this office in the
report period. Darren Desmarais served as the sole permanent staff (biologist) for the
CTRFWCO and contributed greatly to the Office’s accomplishments. In May, Rebecca Gleason
(new Administrative Assistant, covering three offices) was hired and is stationed at the
CTRFWCO. In addition Drew Fournier (Biological Trainee) began work in May while
completed his degree at UMASS/Amherst. The Student Conservation Interns in 2016 were
shared under Conte Refuge administration; Will Shell, Kathleen Johnson, Forest DeCoste, and
especially Madeline Freiburger (lead on fisheries), made significant contributions spring through
the fall. Shelby Scarfo, a University of New Hampshire intern, volunteered for a second field
season this year. Other volunteers provided valuable assistance for both field and lab activities
over the year. Don Pugh has continued to support the resource agencies’ efforts on hydropower
relicensings and fish passage activities with his ongoing involvement in FERC related activities
fish passage activities at Holyoke Dam. Katie Kennedy, The Nature Conservancy, has continued
to make important contributions on FERC activities and other aquatic conservation initiatives.
Other thanks for assisting in the accomplishments over this report period go to:
State fishery agencies -
Connecticut: Steve Gephard, Dave Ellis, Tim Wildman, Jacque Benway, and staff
Massachusetts: Caleb Slater, Ben Gahagan, and Scott Elzey and lab staff
New Hampshire: Matt Carpenter and Gabe Gries
Vermont: Lael Will and Ken Cox
Federal agencies –
USFWS: Melissa Grader, John Warner, Phil Herzig, Brett Towler, Andy French, David
Perkins, Artie McCollum
NOAA Fisheries: Bill McDavitt
USGS Conte Lab: Ted Castro-Santos, Alex Haro, Steve McCormick, Micah Kieffer
The Anadromous Fish Program and
The Connecticut River Atlantic Salmon Commission
The administration of the interjurisdictional cooperative effort to restore diadromous fish species
to the Connecticut River basin is accomplished through the Connecticut River Atlantic Salmon
Commission (the Commission). During the period from 1967-1983 (prior to the Commission),
restoration of anadromous fish, primarily Atlantic Salmon and American Shad, on the
Connecticut River was guided by the Policy Committee and the Technical Committee for
Fisheries Management of the Connecticut River Basin. The importance of this formally-
structured, coordinating and regulatory body to the restoration program was recognized in 1983
when Congressional consent was given to the Connecticut River Basin Atlantic Salmon

Page 6 of 36
Compact, Public Law 98-138. The enabling legislation was re-authorized for another 20 years in
2002. This law, originally passed by the legislative bodies in each of the four basin states,
created the Commission and conveys Congressional support to an interstate compact for the
restoration of anadromous fish to the Connecticut River Basin. The Commission is comprised of
ten Commissioners (Table 1) including a high-level government employee and a public sector
representative appointed by the governor of the appropriate state, and the Northeast Regional
Directors of both the U.S. Fish and Wildlife Service (USFWS) and the National Oceanic and
Atmospheric Administration (NOAA) National Marine Fisheries Service (NMFS) also referred
to as NOAA Fisheries.
The Commissioners act on policy matters and are advised on scientific and technical matters by a
Technical Committee. The Technical Committee is comprised of senior staff biologists from
each Commission member agency, the U.S. Forest Service (USFS), and the Massachusetts
Division of Marine Fisheries (Table 2). The Technical Committee has nine subcommittees, with
specific areas of responsibility (American Shad, River Herring, Atlantic Salmon, American Eel,
Sturgeon, Sea Lamprey, Fish Passage, Habitat, and Fish Culture). Other experts and cooperators
from the member agencies including the U.S. Geological Survey, Conte Anadromous Fish
Research Center (CAFRC), Trout Unlimited, The Nature Conservancy, Connecticut River
Watershed Council, and private industry, and others participate with the subcommittees and
Technical Committee as needed. The Connecticut River Coordinator (Coordinator), now
identified also as the Connecticut River Fish and Wildlife Conservation Office Project Leader, is
an employee of the USFWS, acts as the Executive Assistant to the Commission and the Secretary
for the Technical Committee and is the USFWS Technical Committee representative.
The Coordinator, as titled, is responsible for coordination of state and federal activities,
providing technical expertise, project development and implementation of fish population
assessments, restoration and management programs at the population and habitat level, program
evaluation, regulatory input through Federal Power Act with FERC, and advocacy and outreach
of the multi-agency cooperative diadromous fish restoration program in the Connecticut River
watershed (Figure 1). The Coordinator also organizes meetings, identifies priorities, develops
initiatives and plans, implements them, and maintains and develops partnerships to accomplish
objectives.
Fish species under restoration and enhancement in the Connecticut River basin include American
Shad, Blueback Herring, Sea Lamprey, American Eel, and Alewife, primarily addressed by
efforts to provide upstream and downstream passage to historic habitats. Shortnose Sturgeon,
the only federally endangered species and population, is under recovery and continues to be
monitored, studied, and protected in a variety of ways, some of which will be covered in later
text. Atlantic Sturgeon was considered extirpated from this river basin, with only transient
individuals present from other populations, but new data from the State of Connecticut supports
proof of successful reproduction that show genetic differentiation from the nearest “known”
extant populations. This species was listed as Endangered under the Federal Endangered Species
Act by NOAA Fisheries (NMFS) in 2012.
In 2016, adult Atlantic Salmon entering fishways with trap facilities were examined and given a
visible streamer tag and passed upstream. Holyoke Fish Lift adult returns were taken to USGS
CAFRC for swimming performance studies before being released after < 2 day retention period.

Page 7 of 36
Assessments of returning adults will continue, providing data for CRASC and the U. S. Atlantic
Salmon Assessment Committee work. Atlantic Salmon are expected to be a management topic
requiring coordination through CRASC for a few more years, based on the last (final) large scale
stocking that occurred in 2013, concluding the restoration effort. The CRASC continues to serve
as an important mechanism to maintain communication and coordination on migratory fish
restoration and management activities in the Connecticut River basin. Given the current status of
main stem hydro facilities in FERC relicensing process and recent Holyoke Dam downstream
passage (Settlement Agreement) measures, the need and value of a basin-wide management
approach is important.
The CRASC meets at least twice each year and the Technical Committee meets as frequently as
needed. This report period, the Commission met on November 13, 2015 and on June 28, 2016.
The Technical Committee met on November 3, 2015 and June 27, 2016. Dr. Andrew Fisk
(Massachusetts Public Member) was installed as the new Vice-Chair, to serve with Chair Mr.
William Hyatt. CRASC scheduled meetings are open to the public, contact Ken Sprankle at
[email protected] or at 413-548-9138 ext. 8121, to receive notices for scheduled meetings.
Interested citizens are given the opportunity to provide input and area news publishers are
notified of scheduled Commission meetings via email. Minutes of both Commission and
Technical Committee meetings, once approved are available and posted on the Connecticut
River FWCO website, https://www.fws.gov/r5crc/.

Page 8 of 36
Table 1. Connecticut River Atlantic Salmon Commission Membership (as of November 2015).
Connecticut River Atlantic Salmon Commission
Federal
U.S. Fish and Wildlife Service
Wendi Weber
Regional Director, Region 5
Sherry White, alternate
National Marine Fisheries Service John Bullard
Northeast Administrator
Daniel Morris, alternate
Connecticut
Connecticut Dept. of Energy and Environmental Protection
William Hyatt (Chair)
Chief, Bureau of Natural Resources
Stephen Gephard, alternate
Public Sector Representative Robert A. Jones
Massachusetts
Massachusetts Division of Fisheries and Wildlife
Jack Buckley
Director
Mark Tisa, alternate
Public Sector Representative Andrew Fisk (Vice Chair)
New Hampshire
New Hampshire Fish and Game Department
Glenn Normandeau
Executive Director
Scott Decker, alternate
Public Sector Representative Duncan McInnes
Vermont
Vermont Department of Fish and Wildlife
Louis Porter
Commissioner
Eric Palmer, alternate
Public Sector Representative Peter H. Basta

Page 9 of 36
Table 2. Connecticut River Atlantic Salmon Commission Technical Committee Membership.
Connecticut River Atlantic Salmon Commission Technical Committee
Federal
U.S. Fish and Wildlife Service Kenneth Sprankle
National Marine Fisheries Service
William McDavitt
U.S. Forest Service Dan McKinley
Connecticut
Connecticut Dept. of Energy and Environmental
Protection Stephen R. Gephard
Massachusetts
Massachusetts Division of Fisheries and Wildlife
Caleb Slater
(Chair)
Massachusetts Division of Marine Fisheries Ben Gahagan
New Hampshire
New Hampshire Fish and Game Department
Matthew Carpenter
Vermont
Vermont Department of Fish and Wildlife
Lael Will

Page 10 of 36
Figure 1. Connecticut River basin with major tributaries and main stem dams.
KJJ

Page 11 of 36
Coordination and Technical Assistance Funding
The Connecticut River Fish and Wildlife Conservation Office, under the USFWS’ Wildlife and
Sport Fish Restoration Program’s F-100-R-33, for this report period, received $20,000 from the
four state fishery agencies through the their annual Sport Fish Restoration Program
apportionment (F-100-R). The grant project was assessed an USFWS administrative overhead
fee (18%) leaving $16,393 available. The Office utilized the Sport Fish Restoration funds and
USFWS Fisheries Program base funding for an operational budget totaling $305,579.44 for fiscal
year 2016. The Sport Fish Restoration funds were fully drawn down to pay solely for the
CTRFWCO building, office/equipment/operations, storage facility and vehicle maintenance
expenses, allowing USFWS base funds to be applied in other operational areas.
Station total: $305,579.44 States (F-100-R): $16,393.44 FWS Federal: $289,186.00
Project Accomplishments
The Connecticut River Fish and Wildlife Conservation Office enhanced the Commission's and
States’ ability to manage, evaluate, and implement restoration programs through a variety of
activities and accomplishments, some of which are described in greater detail in the following
sections. Please note that data presented in this report has been reviewed to the extent possible,
but is subject to change and should be considered provisional. Use of any presented data
should be discussed with the Coordinator to avoid potential issues with use, analyses,
and/or interpretation.
Coordination activities, select details:
The Coordinator provided administrative support to the CRASC Commission and Technical
Committee as the Executive Assistant and Secretary respectively, making meeting arrangements,
establishing agendas, developing reports, distributing information, drafting correspondences,
tracking finances, and recording and distributing minutes of Commission and Technical
Committee meetings (four in the report period). The Coordinator participated on the CRASC
Fish Passage, Shad and River Herring, Sea Lamprey subcommittees during this report period.
The Coordinator served as the Chair for Shad and River Herring subcommittees and issued the
Annual Fish Passage Notification letters on behalf of CRASC to main stem hydropower
operators.
The Coordinator served as the lead on the Plan Development Team that is updating the CRASC
Management Plan for American Shad in the Connecticut River Basin. Substantial progress was
made over time on this plan update. A final plan is expected in 2017.
The Coordinator worked with Connecticut Department of Energy and Environmental Protection
(CTDEEP), New Hampshire Fish and Game (NHFG), Rhode Island Division of Fish and
Wildlife (RIDFW), U.S. Geological Survey, Conte Lab (USGS), and Holyoke Gas and Electric
fishway staff to develop a shad trap and transfer schedule for the Holyoke Fish Lift. A summary
of transfers are provided later in this report.

Page 12 of 36
Fisheries Management, Restoration, Assessment, and Technical Assistance, additional
select information:
For the fourth consecutive year, a large scale population assessment program for river herring
was initiated in late March, utilizing boat electrofishing as the primary sampling gear. Study
objectives include: 1) obtain a minimum whole fish sample of 50 blueback and alewife for age
structures, per target sample location/event; 2) obtain baseline demographic data on all sampled
river herring (species, length, weight, sex); 3) derive relative abundance/catch measures; 4)
conduct surveys across a broad geographic range of spawning aggregations and over the duration
of the runs (April-June), representing spatial and temporal variations for both species; 5)
determine fish ages from otoliths and spawning history from scale examinations; and 6) utilize
standard stock assessment procedures and statistics to describe status and trends. This work was
conducted to address identified priority data needs, specific to the Connecticut River and coast-
wide, as described in the Atlantic States Marine Fisheries Commission’s River Herring
Benchmark Stock Assessment Report released in May 2012
(http://www.asmfc.org/uploads/file/riverHerringBenchmarkStockAssessmentVolumeIR_May2012.pdf). This assessment
work is a long-term commitment by the CTRFWCO and will continue in future years. The
assessment is intended to provide the varied data requirements and subsequent analyses required
for responsible science-based restoration and management of these species.
The ASMFC Shad and River Herring Technical Committee met in November 2015 to share river
herring data collection designs, methods, and analytical approaches that were detailed in a
published meeting report, available at:
http://www.asmfc.org/uploads/file/56fc3c6dRH_DataCollectionStandardizaitionWorkshopSummary_March2016.pdf .
The CTRFWCO program targets five sample areas; lower Mattabesset River (Middletown, CT),
Wethersfield Cove (Wethersfield, CT), lower Farmington River (Windsor, CT), lower Westfield
River (Agawam, MA), and lower Chicopee River (Chicopee, MA) for this monitoring program.
Otoliths and scale samples were removed from fish returned to the laboratory from each
sampling event, on the following day. Samples were uniquely labeled, cleaned and stored. Some
information on effort and obtained samples sizes for the past four assessment years are shown in
Table 3 and further described in the following narrative.
Table 3. Select sampling effort and field sample statistics for the river herring population assessment
program 2013 - 2016.
2013 2014 2015 2016
Number of sampling dates 18 21 20 25
Total sample runs 81 124 114 145
Total electrofishing seconds 41,177 55,736 56,025 71,845
Total bluebacks captured 714 2,593 1,448 1,586
Total alewives captured 107 220 258 586
Blueback herring otolith/scale - lab 501 655 622 730
Alewife otolith/scale - lab 103 188 165 461

Page 13 of 36
In 2016, sampling was initiated earlier (March 30) than in past years and Alewife were sampled
on that first outing. An increase in total effort occurred in 2016 compared to previous years with
a total of 145 timed sampling runs completed over 25 sample dates. Sampling concluded on
June 2, 2016.
Catch rates (fish/minute) for Alewife and Blueback Herring in 2016, for all sites combined, are
presented in Table 4 with prior year rates also reported for comparison. The 2016 sample season
provided generally sufficient sample sizes for study objectives, with the increased effort that
occurred at most sites. However, catch rates were lower than in previous years for Blueback
Herring, most notably in upstream sample sites in Massachusetts tributaries. Although the
“aggregate” 2016 mean catch rates for Alewife was higher than in past years, it is still considered
a very low value. The designation “positive” run in Table 4 was used to subset the field data,
using only catch rates when the target species were sampled in a run. The “all runs” catch rates
include all runs data for that year, with no censoring of data. The Alewife run begins and ends
earlier than the Blueback Herring run, resulting in the need to consider timing of samples within
and among years that is not addressed in this broadly based summary table. Variability for the
summarized rates (reported standard deviation) is extremely high and other approaches to
appropriately use these catch/effort data will be explored. A comprehensive interim report that
will examine differences within site, among sites, and among years by site is planned for 2017.
Table 4. Summary statistics for Alewife (ALW) and Blueback Herring (BBH), by year, for electrofish
sample runs that successfully captured the target species (positive) and alternatively for “all run data”
(including “0” or no target fish capture). Relative abundance, in terms of fish/minute, by species and year
are shown, for “positive capture runs” and for “all runs” by year.
A summary of mean total lengths (mm) with standard deviations are shown in Table 5, by sex,
for each species, by year. A one-way ANOVA detected significant differences (P < 0.001)
among annual mean total lengths for both male and female Blueback Herring and Alewife. Post-
hoc pairwise comparisons (Holm-Sidak) detected significant differences at P < 0.05 as indicated
in Table 5, between years (within same species/sex).
ALW BBH ALW BBH ALW BBH ALW BBH
Total Runs with (Positive)
Target species 23 (28%) 44 (54%) 37 (30%) 69 (56%) 33 (29%) 65 (57%) 58 (40%) 71 (49%)
Total runs "0" target
species 58 (72%) 37 (46%) 87 (70%) 55 (44%) 82 (71%) 49 (43%) 87 (60%) 74 (51%)
Positive Runs, mean
fish/min (± SD) 0.57 (±0.44) 2.82 (±6.14) 0.76 (±0.77) 9.91 (±13.44) 0.94 (±1.08) 3.42 (±3.84) 1.24 (±1.62) 2.74 (±2.60)
All Runs (includes 0s),
mean fish/min (± SD) 0.16 (±0.34) 1.52 (±4.7) 0.23 (±0.54) 5.52 (±11.15) 0.27 (±0.72) 1.95 (±3.35) 0.50 (±1.20) 1.34 (±2.27)
20162013 2014 2015

Page 14 of 36
Table 5. A summary of annual mean total length (mm) with standard deviations (SD), for all processed
Blueback and Alewife, by sex, for the survey years of 2013 – 2016. ANOVA tests were followed by
pairwise comparisons by species and sex. Significantly different pairwise comparisons (P < 0.05) are
indicated by year letter assignment.
Blueback Alewife Male Female Male Female
Year Mean TL mm
(± SD) Signf. Diff.
Mean TL mm (± SD)
Signf. Diff.
Mean TL mm (± SD)
Signf. Diff.
Mean TL mm (± SD)
Signf. Diff.
2013A 253.8 (12.1) C, D 264.9 (12.6) C, D 261.6 (15.8) C, D 287.7 (16.2) B
2014B 253.8 (11.4) C, D 264.9 (13.2) C, D 266.2 (10.8) C, D 276.1 (15.5) A, C, D
2015C 263.0 (10.4) A, B, D 277.8 (11.7) A, B, D 273.1 (11.7) A, B 287.9 (12.4) B
2016D 265.2 (13.3) A, B, C 281.3 (13.0) A, B, C 270.7 (18.0) A, B 286.4 (19.0) B
All 2015 otolith samples for both Blueback and Alewife were read for age determination by late
winter 2016, a total of 787 paired samples. Previous year scale samples for both Alewife and
Blueback Herring were cleaned from stored sample envelopes, mounted on slides and read for
spawning marks/ spawning history determinations. This significant effort was completed by the
interns and staff during the summer and fall. Scale reading was also completed for past year
samples for both species (~10% remaining) and completed for 2016, for both species. Otolith
reading was also completed earlier than in past years for the 2016 samples, with all 1,191 otolith
sets read for age assignments in this report period. Work to re-examine the accuracy of the first
and second year age assignments has been initiated along with a training set for readers.
Consultation with Massachusetts Division of Marine Fisheries for otoliths and the State of
Connecticut for scale readings has been ongoing.
Length frequency plots describing size distributions by sex, over time, have been developed in
aggregate and at the site specific level. An example of observed shifts in size structure is shown
in Figure 2, for Blueback Herring sampled from the Farmington River. A positive shift in the
size distribution is apparent over time, but additional information is required for considering the
extent of influence by year class strength. Having preliminary age data for all lab processed
Blueback Herring from the reading of otoliths, the contributions of age classes (from the random
subsample) is shown by year in Figure 3. The proportional age assignment for each year (2013-
2016) is shown for combined sexes and by sex, ranging from as young as age-3 to the very
limited occurrence of age-9 fish. The presence of the 2010 cohort, that appear disproportionate
Cleaning and mounting fish scales
Lab processing of fish

Page 15 of 36
(over 60% within year contribution) to other ages beginning in 2014 as age-4 fish, is shown for
both males and females and continues its presence in 2015 and 2016 with an expected decline.
2013
0
10
20
30
40
Male
Female
Unknown
2014
0
50
100
150
200
Fre
quency
(#
of
fish
)
0
20
40
60
80
100
120
2016
Total Length (mm)
200 220 240 260 280 300 320
0
20
40
60
80
100
120
140
160
2015
Farmington River Blueback Herring
Figure 2. Length frequency distributions (total length, mm), by sex, for all Blueback Herring
sampled in each identified study season (2013 – 2016).

Page 16 of 36
The CTDEEP juvenile index for BBH in 2010 was a substantially greater value than observed in
the preceding 14 years and in subsequent years (Appendix B). The Farmington River data
indicate, in a relative context, low abundances of age-3 and age-4 fish in 2015 and 2016, which
is of concern. The CTDEEP reported at the Fall 2016 CRASC meeting that provisional survey
results indicate a very high JI value for American Shad and the lowest observed value for
Blueback Herring since the inception of the survey.
Preliminary results from the reading of Blueback Herring scales for spawning marks, for samples
obtained from the Farmington River in 2016, indicate the greatest percentage of females (50%)
were spawning for a second time, at the time of their capture in 2016 (Table 6). This compares
to an equal proportion of first time (virgin) and second time spawners for males that comprised
84% of that subsample. Sample sizes are very low for older age fish for both sexes (age-9; one
male and two females) and require caution in interpretation.
Table 6. Spawning history assignments (%), by sex and age, for Blueback Herring sampled from
the Farmington River in 2016.
Female (%) Male (%) First 2nd 3rd 4th 5th First 2nd 3rd 4th
Age-3 100.0 94.1 5.9 Age-4 100.0 85.7 14.3 Age-5 52.7 41.6 5.5 48.4 43.5 8.1 Age-6 17.9 64.1 12.8 5.1 31.3 51.0 15.6 2.1 Age-7 20.0 80.0 14.3 28.6 42.9 14.3 Age-8 25.0 25.0 25.0 25.0 66.7 33.3 Age-9 50.0 50.0 100.0
Total N 34 46 9 2 1 84 84 27 5
Total % 36.9 50.0 9.8 2.2 1.1 42.0 42.0 13.5 2.5

Page 17 of 36
Males
Pro
po
rtio
n o
f to
tal
0.0
0.1
0.2
0.3
0.4
0.5
0.6
0.7
Females
age 2 age 3 age 4 age 5 age 6 age 7 age 8 age 9
0.0
0.1
0.2
0.3
0.4
0.5
0.6
0.7
0.8
Farmington River Blueback Herring
0.0
0.1
0.2
0.3
0.4
0.5
0.6
0.7
2013
2014
2015
2016
Both Sexes
Figure 3. Proportional age assignments for all Blueback Herring aged from otolith samples in
each year (2013-2016), both sexes combined and sex specific, from the Farmington River.

Page 18 of 36
Active river herring restoration measures were initiated in 2016 as Blueback Herring
catch rates in population assessment work increased. In the month of May, on three
dates, the Office conducted capture/transfers of pre-spawn herring from Wethersfield
Cove, concurrent with population assessments. Similar to the past years, boat
electrofishing was used on three dates to capture a total of 1,004 herring that were
transferred to accessible but unutilized habitats upstream of Holyoke Dam (Table 6). This
was the second consecutive year of a decrease in the number that were captured and
transferred. Fish were transported in two USFWS tank trucks with salt, diffused oxygen,
and recirculating water pumps. Sampling for juvenile production was conducted in the
early fall and produced catch rates similar to past year evaluations at the expected larger
size than juveniles sampled from Wethersfield Cove, CT.
A summary of American Shad transfers from Holyoke Fish Lift to support restoration
efforts in and out-of-basin, with stocking locations, and for research are provided in
Table 7. This Office was able to load and re-locate a total of 976 American Shad
upstream of the Rainbow Dam over a period of nine dates in June, in support of CTDEEP
efforts to increase juvenile production upstream of that dam. In addition USGS Conte
Lab used American Shad for research on fishway entrance weir configurations, with the
subsequent release of these study fish immediately upstream of Turners Falls Dam. The
Conte Lab also continued research on spawning and reproduction performance under
varied temperatures (those study fish not identified as released).
Sampling of juveniles river herring
New fish tank on transport truck, releasing American Shad

Page 19 of 36
Species Destination
Destination
Waterbody
Destination
State
Number
Transported
Transported
By Date
Number
Released
Transport
Mortalities
Release
Sum by
grouping
Bluebacks EASTHAMPTON/OXBOW CT RIVER MA 225 USFWS 10-May-16 225 0
Bluebacks EASTHAMPTON/OXBOW CT RIVER MA 315 USFWS 11-May-16 315 0
Bluebacks EASTHAMPTON/OXBOW CT RIVER MA 470 USFWS 25-May-16 464 6 1,004
Shad WINCHESTER ASHUELOT RIVER NH 42 RIDFW 10-May-16 42 0
Shad WINCHESTER ASHUELOT RIVER NH 76 RIDFW 17-May-16 76 0
Shad WINCHESTER ASHUELOT RIVER NH 75 RIDFW 24-May-16 75 0
Shad WINCHESTER ASHUELOT RIVER NH 82 RIDFW 25-May-16 82 0
Shad WINCHESTER ASHUELOT RIVER NH 76 RIDFW 26-May-16 76 0 351
Shad CONTE LAB CONTE LAB MA 12 CONTE LAB 27-Apr-16 12 0
Shad CONTE LAB CONTE LAB MA 100 CONTE LAB 13-May-16 100 0
Shad CONTE LAB CONTE LAB MA 80 CONTE LAB 02-Jun-16 80 0
Shad CONTE LAB CONTE LAB MA 42 CONTE LAB 24-Jun-16 42 0
Shad Post Flume trials GILL CT RIVER MA 97 CONTE LAB 02-May-16 97 0
Shad Post Flume trials GILL CT RIVER MA 47 CONTE LAB 03-May-16 47 0
Shad Post Flume trials GILL CT RIVER MA 66 CONTE LAB 09-May-16 66 0
Shad Post Flume trials GILL CT RIVER MA 113 CONTE LAB 10-May-16 113 0
Shad Post Flume trials GILL CT RIVER MA 132 CONTE LAB 11-May-16 131 1
Shad Post Flume trials GILL CT RIVER MA 122 CONTE LAB 12-May-16 120 2
Shad Post Flume trials GILL CT RIVER MA 82 CONTE LAB 15-May-16 80 2
Shad Post Flume trials GILL CT RIVER MA 30 CONTE LAB 16-May-16 30 0
Shad Post Flume trials GILL CT RIVER MA 113 CONTE LAB 17-May-16 113 0
Shad Post Flume trials GILL CT RIVER MA 111 CONTE LAB 18-May-16 111 0
Shad Post Flume trials GILL CT RIVER MA 64 CONTE LAB 19-May-16 62 2
Shad Post Flume trials GILL CT RIVER MA 122 CONTE LAB 23-May-16 122 0
Shad Post Flume trials GILL CT RIVER MA 109 CONTE LAB 24-May-16 109 1
Shad Post Flume trials GILL CT RIVER MA 115 CONTE LAB 25-May-16 115 0
Shad Post Flume trials GILL CT RIVER MA 63 CONTE LAB 26-May-16 63 0
Shad Post Flume trials GILL CT RIVER MA 63 CONTE LAB 30-May-16 63 0
Shad Post Flume trials GILL CT RIVER MA 117 CONTE LAB 31-May-16 113 4
Shad Post Flume trials GILL CT RIVER MA 119 CONTE LAB 01-Jun-16 116 3
Shad Post Flume trials GILL CT RIVER MA 32 CONTE LAB 02-Jun-16 30 2
Shad Post Flume trials GILL CT RIVER MA 32 CONTE LAB 03-Jun-16 19 13
Shad Post Flume trials GILL CT RIVER MA 34 CONTE LAB 04-Jun-16 26 8
Shad Post Flume trials GILL CT RIVER MA 106 CONTE LAB 06-Jun-16 103 3
Shad Post Flume trials GILL CT RIVER MA 114 CONTE LAB 07-Jun-16 114 2
Shad Post Flume trials GILL CT RIVER MA 67 CONTE LAB 08-Jun-16 66 1
Shad Post Flume trials GILL CT RIVER MA 65 CONTE LAB 09-Jun-16 62 3
Shad Post Flume trials GILL CT RIVER MA 64 CONTE LAB 13-Jun-16 64 0
Shad Post Flume trials GILL CT RIVER MA 68 CONTE LAB 15-Jun-16 68 0
Shad Post Flume trials GILL CT RIVER MA 65 CONTE LAB 16-Jun-16 61 4 2,518
Shad WINDSOR FARMINGTON RIVER CT 87 CTDEEP 27-May-16 87 0
Shad WINDSOR FARMINGTON RIVER CT 82 CTDEEP 01-Jun-16 81 1
Shad WINDSOR FARMINGTON RIVER CT 152 USFWS 01-Jun-16 149 3
Shad WINDSOR FARMINGTON RIVER CT 120 USFWS 02-Jun-16 120 0
Shad WINDSOR FARMINGTON RIVER CT 120 USFWS 03-Jun-16 120 0
Shad WINDSOR FARMINGTON RIVER CT 126 USFWS 07-Jun-16 126 0
Shad WINDSOR FARMINGTON RIVER CT 131 USFWS 08-Jun-16 130 1
Shad WINDSOR FARMINGTON RIVER CT 75 USFWS 09-Jun-16 74 1
Shad WINDSOR FARMINGTON RIVER CT 121 USFWS 10-Jun-16 119 2
Shad WINDSOR FARMINGTON RIVER CT 70 USFWS 14-Jun-16 70 0
Shad WINDSOR FARMINGTON RIVER CT 68 USFWS 17-Jun-16 68 0 1,144
Shad BERLIN MATTABESSET RIVER CT 93 CTDEEP 15-Jun-16 93 0 93
Shad NORTH ATTLEBORO NANFH MA 75 RIDFW 11-May-16 75 0
Shad NORTH ATTLEBORO NANFH MA 75 RIDFW 12-May-16 75 0
Shad NORTH ATTLEBORO NANFH MA 76 RIDFW 18-May-16 76 0
Shad NORTH ATTLEBORO NANFH MA 80 RIDFW 19-May-16 80 0
Shad NORTH ATTLEBORO NANFH MA 80 RIDFW 31-May-16 79 1 385
Shad BEACON FALLS NAUGATUCK RIVER CT 77 CTDEEP 02-Jun-16 72 5 72
Table 7. Fish transfers for Blueback Herring and American Shad in spring of 2016. All Blueback Herring captured in
Wethersfield Cove, Wethersfield, Connecticut. All American Shad were taken from the Holyoke Fish Lift.
American Shad from Holyoke Fish Lifts were taken to the North Attleboro National Fish
Hatchery were natural spawning was used to produce larval shad to support restoration stocking
efforts in Rhode Island targeted river habitats. As part of the agreement for use of these fish the
Rhode Island DEM transferred 351 American Shad upstream of the third dam on the Ashuelot

Page 20 of 36
River. In 2017 monitoring efforts need to be directed at Fiske Mill Dam (Hinsdale, NH) to
determine whether there are American Shad present downstream of that first dam on the
Ashuelot River, which has an operating fish lift, but has never reported passing any shad or Sea
Lamprey. In 2016 both USFWS and NHFG reviewed the project and provided
recommendations, given issues with the location of the entrance to the fishway, a follow-up is
planned in 2017.
Sea Lamprey nest counts were conducted in late June and early July in a number of tributaries,
some of which have previous survey data (Table 8). Surveys were conducted in identified river
segments, often downstream of the first barrier an up-running lamprey would encounter.
Table8. Time series of Sea Lamprey nest surveys in select tributaries, in defined reaches.
A significant portion of time was spent on the FERC relicensing process for the Turners Falls
Dam and Northfield Mountain Pumped Storage (NMPS) Project operated by FirstLight Power
and TransCanada’s Vernon Dam, Bellows Falls Dam, and Wilder Dam. The FERC licensing
process (all licenses expire in 2018) was initiated in fall of 2012 and activities occurred
throughout the report period. The office web site (http://www.fws.gov/r5crc) provides links to
both FirstLight Power and TransCanada’s web sites where documents for this process are posted.
In this report period, meetings to further define study plans by the power companies and
consultants continued and meetings and conference calls occurred including those only among
the resource agency/members group. Study reports, study report revisions and addendums, have
been released over this time period by the companies, which have been reviewed, and
comment/response letters developed and submitted to FERC by the Service. This work is
ongoing.
Year
Green R.
(Greenfield,
MA)
Manhan R.
(below
Easthampton
Dam, MA)
Manhan R.
(upstream
of ladder)
Sawmill R.
(Montague,
MA)
Fall R.
(Greenfield,
MA)
Dry Brook
(Gill, MA)
Ashuelot R.
(Hinsdale,
NH)
West R.
(Townshend,
VT)
2009 55
2010 184 20
2011 84 35 142 133
2012
2013
2014 29 28 72 30
2015 71 13 5 34 44A
2016 87 4 18 112 15 7 320 42B
A - additional 14 nests in the area 90 lamprey were transferred, upstream of removed dam
B - additional 27 nests in short 100 meter section of habitat downstream several km
River Location details
Green R. From Wiley Russell Dam (1st dam) to downstream end of habitat (0.9 km)
Manhan R. Below dam at Easthampton, limited habitat, ~ 100 meters
Manhan R.
(Upstream of
ladder) N. Branch from Torrey Rd, downstream to main stem confluence and main stem to Glendale Street (3.3 km)
Sawmill R. Bookmill ledge to Meadow Rd Bridge crossing (1.6 km)
Fall R. From natural ledge to mouth (0.5 km)
Dry Brook From 1st Dam to mouth (0.4 km)
Ashuelot R. From 1st Dam to end of habitat (1.7 km)
West R. From ACOE Flood Control Dam downstream (1.2 km)
Page 21 of 36
Long-term temperature loggers (n=16) from Rocky Hill, Connecticut, upriver to Wilder Dam,
(Vermont/New Hampshire) were maintained in late summer and early fall 2016. Loggers record
temperature year-round at 20 minute intervals. Data from these loggers were used in later
figures as an additional plotted variable with fish passage figures for Holyoke Fish Lifts as well
as for partner researcher use (NOAA/NMFS and USGS Conte) and others requestors (Holyoke
Gas and Electric).
The Coordinator spent one week in September assisting in the collection of water velocity profile
data as part of a Dwarf Wedge Mussel research study in the upper main stem river. The research
will examine habitat and population/occurrence in areas surveyed for this federally endangered
species in the main stem river (upstream of Wilder Dam, Wilder, Vermont, to the Town of
Stratford, New Hampshire). This project is being led by Melissa Grader (USFWS) and Katie
Kennedy (The Nature Conservancy).
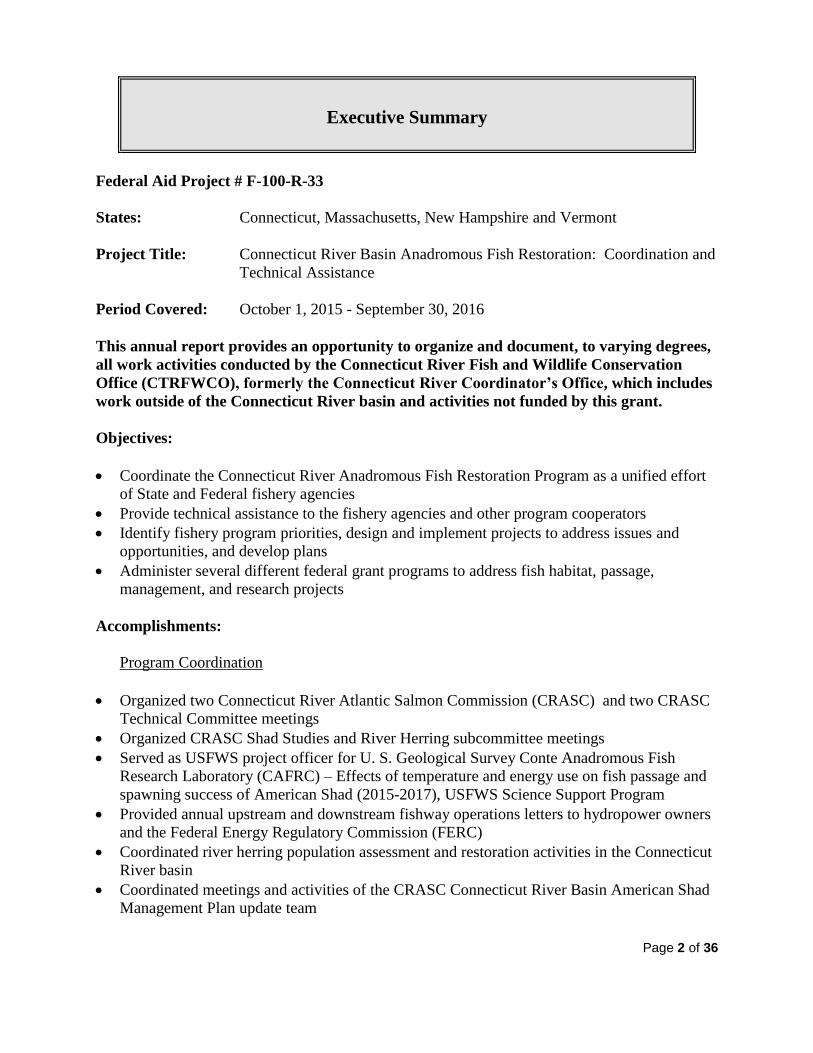
Phil Herzig (USFWS Fish Biologist), working from this office, used his seasonal staff and
CTRFWCO staff, to complete road/stream crossing assessments in the Nulhegan National
Wildlife Refuge in Vermont. Phil also administered a USFWS grant that will support the
removal of the Norton Dam (Colchester, CT) in the Salmon River basin (occurred after report
period).
USFWS interns assessing a culvert
Lori Benoit (USFWS Fish and Wildlife Biologist), from the Southern New England Coastal
Program Office (Rhode Island), completed required permitting to support CTDEEP with the
removal of the Springborn Dam on the Scantic River (Enfield, CT).
The Coordinator updated the station website on the Internet (http://www.fws.gov/r5crc) with
current information and activities. Replied to ongoing data requests on fishway counts, river
herring assessments, and temperature loggers.
The Office continued to maintain databases on migratory fish restoration activities. Daily fish
counts at different dams were entered into databases. Fish counts were updated in-season at
frequent interval (every few days) during the spring, with email notifications to individuals and
postings to the office’s web site (Appendix A).

Page 22 of 36
Program Results
The Connecticut River Fish and Wildlife Conservation Office collected and reported information
relating to the activities and accomplishments occurring in the Connecticut River basin
diadromous fisheries restoration program. Note some of the data presented here are preliminary,
not all counts were final at the time of this report (Appendix A).
Migratory Fish Returns American Shad - A total of 392,057 adult American Shad were counted in 2016 at all first barrier
passage facilities in the basin. A total of 385,930 American Shad were passed upstream of the
Holyoke Dam, Massachusetts, in 2016 through its two fish lifts (Figure 4). The mean passage
count at Holyoke for the period 1976-2015 is 309,041 (±SD 131,363). The 25th
and 75th
percentile values for passage counts are 193,224 and 374,917 respectively. The American Shad
passage count at Holyoke Fish Lift, as a population metric with a number of caveats, has for the
fourth year in a row exceeded the 75th
percentile (Figure 4). Water temperatures declined in
early April and American Shad passage activity at Holyoke Dam ceased after a few initial fish
were passed on April 1, and then passage counts picked back up in the middle of the month at a
slow, increasing rate. A record single passage day for American Shad occurred on 5/12/2016 at
Holyoke Fish Lift, with 54,004 shad counted, surpassing the previous daily record of 53,011 in
1983 (Figure 5). There are sixteen daily counts that have ranged from 40,000 to 50,000 over the
Holyoke Fish Lifts’ data time series for American Shad.
Holyoke Fish Lift staff counting fish
Page 23 of 36
American shad
Nu
mb
er
Pa
sse
d
Ho
lyo
ke
Fis
h L
ift
0
200x103
400x103
600x103
800x103
Atlantic salmonN
um
be
r C
ou
nte
d(B
as
in T
ota
l)
0
100
200
300
400
500
600
Blueback herring
Nu
mb
er
Pa
sse
dH
oly
oke
Fis
h L
ift
0
200x103
400x103
600x103
800x103
Connecticut River Fish Counts 1967-2016
Year
1970 1980 1990 2000 2010
0
20x103
40x103
60x103
80x103
100x103
120x103
Nu
mb
er
Pa
sse
dH
oly
oke
Fis
h L
ift Sea lamprey
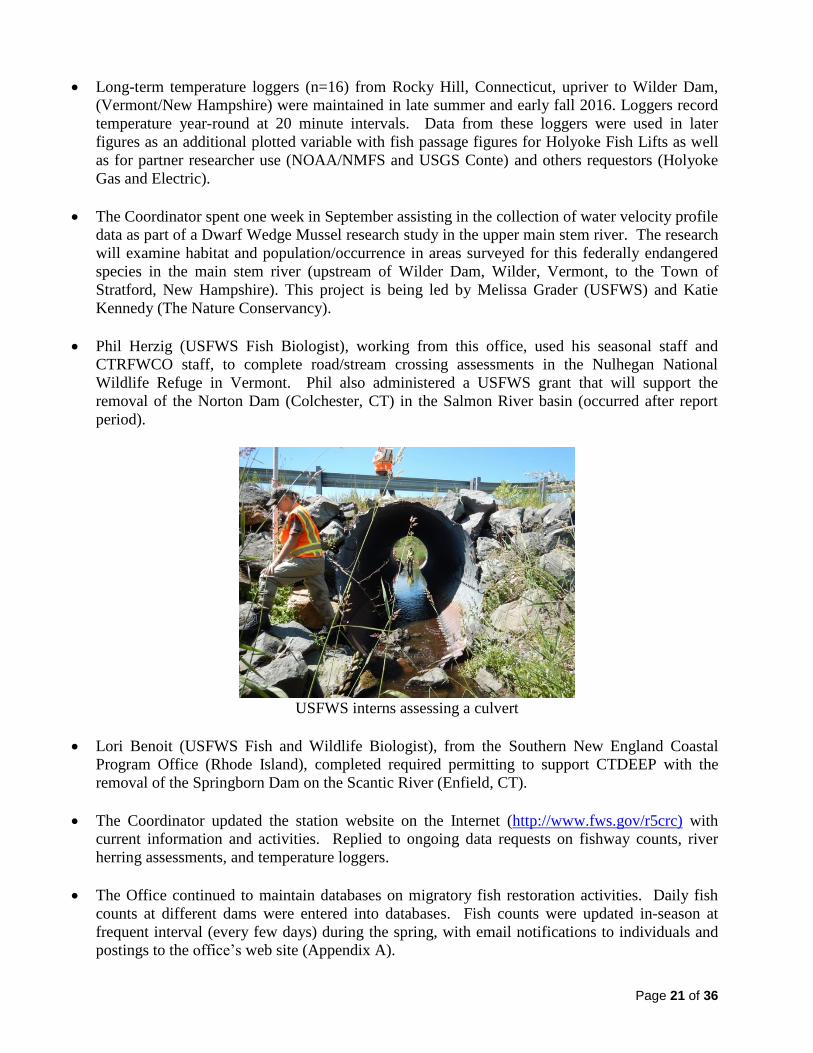
Figure 4. Select count summary of Atlantic Salmon returns to Connecticut River basin (all facilities), and
Holyoke Fish Lift passage counts for American Shad, Blueback Herring and Sea Lamprey (1967-2016).
Fish counts are affected by structural and operational changes at both dams and fishways, and by
environmental conditions (temperature and flow/spill) within year and among years.

Page 24 of 36
Holyoke Fish LiftsAmerican Shad Daily Passage Counts
2016
4/1
/16
4/8
/16
4/1
5/1
6
4/2
2/1
6
4/2
9/1
6
5/6
/16
5/1
3/1
6
5/2
0/1
6
5/2
7/1
6
6/3
/16
6/1
0/1
6
6/1
7/1
6
6/2
4/1
6
7/1
/16
7/8
/16
7/1
5/1
6
# o
f A
merican S
had
0
10000
20000
30000
40000
50000
60000
Wate
r T
em
p (
0C
) and C
FS
( x
1,0
00)
0
5
10
15
20
25
30
35
Shad Water Temp C
CFS
Figure 5. Daily American Shad counts from Holyoke Fish Lifts with water temperature (USFWS) and
river discharge (USGS) data included for the period April 1 to July 15, 2016.
A total of 5,940 American Shad were passed upstream of the West Springfield Project in 2016
on the Westfield River, which is an increase from 2014 (3,383 passed) and greater than the long-
term mean of 3,300. The record high American Shad passage count at that facility was 10,300 in
2012. A total of 141 American Shad were passed upstream of the Rainbow Dam Fishway on the
Farmington River in Connecticut, a fishway with known upstream passage issues for this
species.
Of the American Shad passed upstream of the Holyoke Dam, 54,069 shad were counted passing
the Gatehouse Ladder at Turners Falls Dam in 2016 (Table 9). The Turners Falls Dam and
power canal is a three fishway complex. Fish must first pass either the Cabot Station Ladder
(into the power canal) or the Spillway Ladder, at the base of the dam and upstream end of the
bypassed reach. Fish passing the Cabot Ladder exit into the lower power canal that requires
finding one of two entrances to the Gatehouse Ladder at the upstream end of the canal. Spillway
Ladder passed fish may go directly to the entrance of the Gatehouse Ladder, but as in the case of
all ladders, have opportunities to drop back, including into the canal.
Overall, the 2016 passage number at Gatehouse Ladder as a percentage of American Shad passed
at Holyoke is 14.0%, nearly identical to the 14.1% value observed in 2015, the two highest
values in the time-series (Table 9). The CRASC Shad Management Plan has an objective of 40-
60% upstream passage at each successive barrier on the main stem. As a result, the minimum
2016 upstream passage count objective for Turners Falls Gatehouse would have been 156,822
American shad. At the next upstream barrier, Vernon Dam (Vernon, Vermont), the single fish
ladder passed a total of 35,513 American Shad, down only slightly from the record set in 2015
(37,771 passed). Vernon Dam Ladder passed 65.7% of the American Shad counted passing from

Page 25 of 36
the Turners Falls Gatehouse Ladder (Table 8).
Table 9. American Shad fishway passage counts for the period of 1980 – 2016, for Holyoke
Dam, Turners Falls Dam (Gatehouse Ladder), and Vernon Dam.
Year HFL
Passed Gatehouse
Passed
% Gate vs. HFL
#
Vernon Passed
%Vern vs.
Gate #
1980 380,000 298 0.1
1981 380,000 200 0.1 97 48.5
1982 290,000 11 0.0 9 81.8
1983 530,000 12,705 2.4 2,597 20.4
1984 500,000 4,333 0.9 335 7.7
1985 480,000 3,855 0.8 833 21.6
1986 350,000 17,858 5.1 982 5.5
1987 270,000 18,959 7.0 3,459 18.2
1988 290,000 15,787 5.4 1,370 8.7
1989 350,000 9,511 2.7 2,953 31.0
1990 360,000 27,908 7.8 10,894 39.0
1991 520,000 54,656 10.5 37,197 68.1
1992 720,000 60,089 8.3 31,155 51.8
1993 340,000 10,221 3.0 3,652 35.7
1994 170,000 3,729 2.2 2,681 71.9
1995 190,000 18,369 9.7 15,771 85.9
1996 280,000 16,192 5.8 18,844 116.4
1997 300,000 9,216 3.1 7,384 80.1
1998 320,000 10,527 3.3 7,289 69.2
1999 190,000 6,751 3.6 5,097 75.5
2000 225,000 2,590 1.2 1,548 59.8
2001 270,000 1,540 0.6 1,744 113.2
2002 370,000 2,870 0.8 356 12.4
2003 280,000 Not available 268 2004 192,000 2,192 1.1 653 29.8
2005 116,511 1,581 1.4 167 10.6
2006 155,000 1,810 1.2 133 7.3
2007 158,807 2,248 1.4 65 2.9
2008 156,492 4,000 2.6 271 6.8
2009 160,649 3,813 2.4 16 0.4
2010 164,439 16,422 10.0 290 1.8
2011 244,177 16,798 6.9 46 0.3
2012 490,431 26,727 5.4 10,386* 38.9
2013 392,494 35,293 9.0 18,220 51.6
2014 370,506 39,914 10.8 27,706 69.4
2015 412,656 58,079 14.1 39,771 68.5
2016 385,930 54,069 14.0 35,513 65.7 *an example of a fishway issue that was identified (telemetry study), resolved (USFWS Engineers and
TransC) that resulted in the observed increase in passage counts, effective in 2012.
A new American Shad passage record was set in 2016 at Bellows Falls Dam, with 1,973 fish
counted passing that project’s fish ladder. This count surpasses the previous high record of 147
American Shad at Bellows Falls Ladder observed passing in 1995. However, this project’s
ladder was, by agreement, operationally triggered on Atlantic Salmon upstream passage needs,

Page 26 of 36
so its period of operation was often limited/restricted in the past. Bellows Falls has been
reported to be the historic upstream extent of the species range. In many years no shad were
observed passing at this facility, but the restricted operational period is a confounding factor over
time. Beginning in 2013, TransCanada agreed to open this ladder based on a trigger of 100 Sea
Lamprey passed at Vernon Dam following a request from CRASC, providing an opportunity for
upstream habitat access to these species and others (e.g., American Eel).
The performance of a fishway (both up and downstream) cannot only be measured in the
numbers of fish they pass but must consider the time taken to pass (rates), addressing the
important issue of delay. Delay may be caused by ineffective attraction to the entrance areas of
fishways, issues at the entrances and with entry, and internal ladder/fishway efficiency or other
project operational situations. The concern with delay is based on the fact that American Shad
are migrating on stored energy reserves, so the additive amount of delay (for both upstream and
downstream migrations) increases the likelihood of mortality. Through this mechanism, under a
variety of upstream and downstream passage situations, the possibility for a future opportunity to
return as a repeat spawner may be reduced or eliminated. The Connecticut River American Shad
population is iteroparous (can spawn repeatedly, over years) that may serve to increase
population resilience in the case of poor reproduction (buffer), increase reproductive capacity
(larger older fish have exponential increases in fecundity) and increase overall annual run
population abundance. In addition to the importance of timely passage, passage must also be
safe, on upstream and for downstream migrating post spawn adults and juveniles. Here again,
the fact that a portion of the fish passed upstream face “additive” effects from hydroelectric
projects encountered in sequence, must be carefully considered and can be addressed. Study
reports and results submitted to FERC for relicensing requirements on American Shad
movement, passage, and survival at dams, facilities, and fishways (both up and downstream
passage), are being revised, following review letters from the USFWS and partner agencies.
Shortnose Sturgeon - A total of 94 Shortnose Sturgeon were captured in the Holyoke Fish Lifts
in 2016, a new record, surpassing the previous high value of 16 in 1996 (Figure 6). The new
spillway entrance work completed in 2015 and operational for 2016, had included among other
objectives, improving the ability to pass Shortnose Sturgeon. Those modifications have been
credited with the observed increase in sturgeon entering that fishway entrance. However, over
the course of the spring of 2016, NOAA Fisheries was unable to approve/come to agreement on
an acceptable study plan to evaluate, through a radio tagging study design, if passing sturgeon
upstream was not subsequently harmful to passed fish (e.g., fallback behavior). As a result, all
Shortnose Sturgeon that entered the Fish Lift in 2016 were trapped, processed for biological data,
the presence of a tag, tagged if untagged (small PIT tag only), and then released back
downstream in the tailrace. The previously noted tags used at the lift this season are passive
integrated transponder PIT not the “radio” or “acoustic” tags that will be part of the required
evaluation(s) that can be detected at distance as opposed to the PIT tags limited ~1 meter read
range. The Holyoke Fish Lift crew reported in 2016 that over 80% of the trapped sturgeon came
from the spillway side entrance. As all sturgeon were tagged before release, it was determined
that 15 fish returned and were trapped again, and out of that subgroup a number returned more
than once. Taking the repeat entry fish into account, there were a total of 79 unique fish that
were trapped. In mid-summer, it was decided that the Fish Lift should cease operations due to
fish health concerns in higher water temperatures, eliminating the handling and processing of
fish destined to be released back below the project. Upon re-opening the lift on September 1,
only one Shortnose Sturgeon was subsequently trapped several days later for the remainder of
the fall.

Page 27 of 36
Holyoke Fish LiftsShortnose Sturgeon Captures
2016
4/1
/16
4/8
/16
4/1
5/1
6
4/2
2/1
6
4/2
9/1
6
5/6
/16
5/1
3/1
6
5/2
0/1
6
5/2
7/1
6
6/3
/16
6/1
0/1
6
6/1
7/1
6
6/2
4/1
6
7/1
/16
7/8
/16
7/1
5/1
6
7/2
2/1
6
7/2
9/1
6
8/5
/16
8/1
2/1
6
8/1
9/1
6
8/2
6/1
6
9/2
/16
# S
NS
Captu
red in
Lift
0
2
4
6
8
10
12
Wate
r T
em
p (
0C
) and C
FS
( x
1,0
00)
0
5
10
15
20
25
30
35
SNS
Water Temp C
CFS
Fish Lift Not Operated
Figure 6. Daily Shortnose Sturgeon captures at the Holyoke Fish Lifts in 2016, in relation to water
temperature and river discharge. Note that the Holyoke Fish Lift operations were suspended at the end of
July as the observed water temperatures were a concern for stress with the handling and processing of
fish.
Blueback Herring - A total of 137 Blueback Herring were counted at the Holyoke Fish Lift in
2016 (Figure 4). River herring counts are not believed to reliably serve as a population metric
for the lower main stem river/basin, and larger lower basin tributaries (downstream of first
barrier/fishways), where substantial spawning habitat occurs (refer to earlier report sections).
The CRASC River Herring Management Plan identifies a passage goal of 500,000 at the
Holyoke Fish Lift. That goal had been attained and exceeded prior to population declines
observed along much of the East Coast in the past two decades.
Sea Lamprey - A total of 36,245 Sea Lamprey were observed from first barrier fishways or
estimated by nest counts (CTDEEP nest counts) returning to the Connecticut River basin in
2016. This is a substantial increase (~44%) from the total 2015 counts, driven primarily by the
Holyoke Fish Lift. Holyoke passed a total of 35,249 Sea Lamprey in 2016 compared to 22,245
passed in 2015 (Figure 4). The 2016 count at Holyoke is close to the long-term mean annual
count of 34,000 at that facility. A total of 15,128 Sea Lamprey subsequently passed upstream of
Turners Falls Dam (through Gatehouse Ladder), or 43% of the number passed at Holyoke. In
2015 a total of 8,423 Sea Lamprey passed the Gatehouse Ladder at Turners Falls. A total of
5,521 passed upstream of Vernon Dam (or 36% of Gatehouse Ladder total). A total of 1,619
passed upstream of Bellows Falls Dam compared to 971 (2015). In the lower river basin, only
494 Sea Lamprey passed at Rainbow Dam, Farmington River, a decrease from the 1,591 passed
Page 28 of 36
in 2015 and the 4,276 passed in 2014. A total of 449 Sea Lamprey passed upstream of the West
Springfield fishway, compared to 216 in 2015 and 1,127 in 2014.
Striped Bass - A total of 638 Striped Bass were counted at the Holyoke Fish Lift in 2016 and
were noted to be of a smaller size range than typically observed in previous spring passage
seasons. The 2016 count is a substantial increase from the 21 passed in 2015 and the 69 passed
in 2014. The USFWS River Herring Assessment also noted anecdotally an increase in the
abundance of smaller striped bass observed, in the size range of 300 mm (12 inches), which
corresponds to a high level of juvenile recruitment (2014 cohort year class) reported by the
ASMFC Striped Bass Technical Committee.
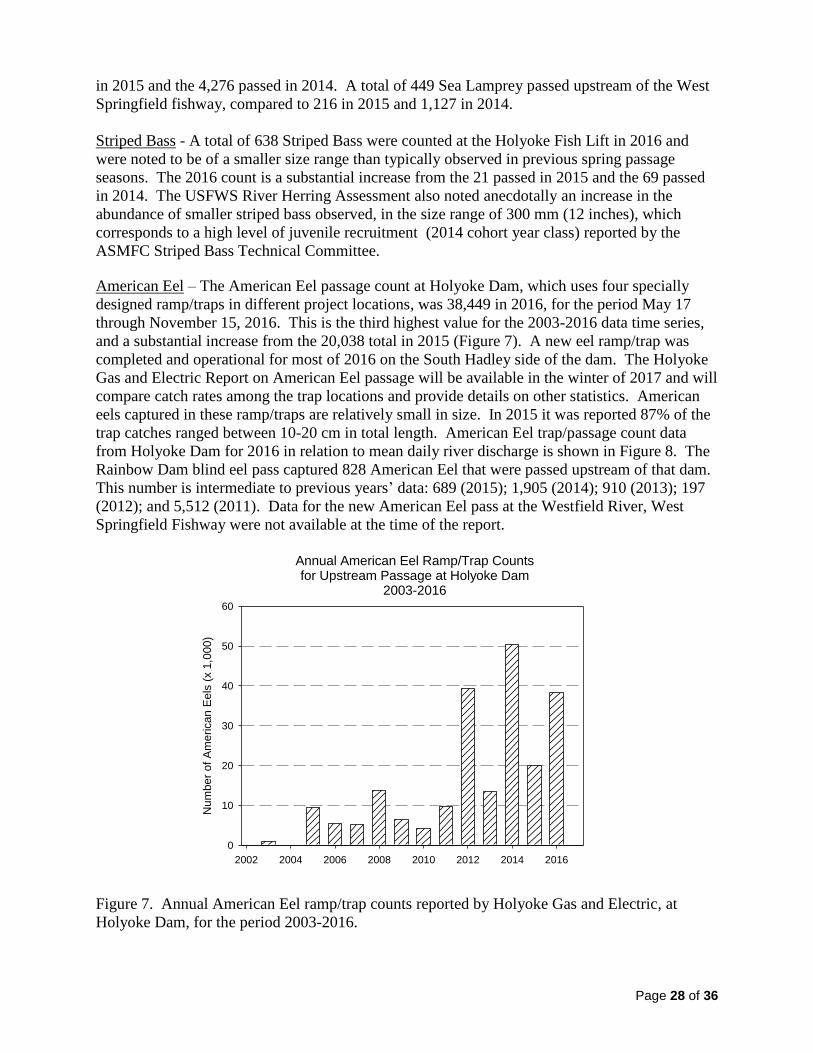
American Eel – The American Eel passage count at Holyoke Dam, which uses four specially
designed ramp/traps in different project locations, was 38,449 in 2016, for the period May 17
through November 15, 2016. This is the third highest value for the 2003-2016 data time series,
and a substantial increase from the 20,038 total in 2015 (Figure 7). A new eel ramp/trap was
completed and operational for most of 2016 on the South Hadley side of the dam. The Holyoke
Gas and Electric Report on American Eel passage will be available in the winter of 2017 and will
compare catch rates among the trap locations and provide details on other statistics. American
eels captured in these ramp/traps are relatively small in size. In 2015 it was reported 87% of the
trap catches ranged between 10-20 cm in total length. American Eel trap/passage count data
from Holyoke Dam for 2016 in relation to mean daily river discharge is shown in Figure 8. The
Rainbow Dam blind eel pass captured 828 American Eel that were passed upstream of that dam.
This number is intermediate to previous years’ data: 689 (2015); 1,905 (2014); 910 (2013); 197
(2012); and 5,512 (2011). Data for the new American Eel pass at the Westfield River, West
Springfield Fishway were not available at the time of the report.
Annual American Eel Ramp/Trap Countsfor Upstream Passage at Holyoke Dam
2003-2016
2002 2004 2006 2008 2010 2012 2014 2016
Num
ber
of
Am
erican E
els
(x 1
,000)
0
10
20
30
40
50
60
Figure 7. Annual American Eel ramp/trap counts reported by Holyoke Gas and Electric, at
Holyoke Dam, for the period 2003-2016.

Page 29 of 36
Holyoke Dam American Eel Ramp/Trap Counts and Passage Upstream
2016
5/2
0/1
6
5/2
7/1
6
6/3
/16
6/1
0/1
6
6/1
7/1
6
6/2
4/1
6
7/1
/16
7/8
/16
7/1
5/1
6
7/2
2/1
6
7/2
9/1
6
8/5
/16
8/1
2/1
6
8/1
9/1
6
8/2
6/1
6
9/2
/16
9/9
/16
9/1
6/1
6
9/2
3/1
6
9/3
0/1
6
10/7
/16
10/1
4/1
6
10/2
1/1
6
10/2
8/1
6
11/4
/16
11/1
1/1
6
# o
f A
me
rica
n E
el
0
500
1000
1500
2000
2500
3000
3500
4000
4500
5000
5500
Wa
ter
Te
mp
(0C
) a
nd C
FS
( x
1,0
00
)
0
5
10
15
20
25
30
35
American Eel
Water Temp C
CFS x 1,000
Figure 8. American Eel daily counts from eel passes/traps at Holyoke Dam plotted with daily mean river
discharge from USGS Holyoke gage and USFWS temperature data.
Atlantic Salmon - A total of five sea-run adult Atlantic Salmon were documented as returned to
the Connecticut River basin during 2016. This is a decrease from the 22 known adults that
returned in 2015 (Figure 4). Starting in the lower basin, one adult was captured downstream of
the Leesville Dam, on the Salmon River (CT) and was released into upstream habitat. One adult
salmon was captured at the West Springfield Ladder on the Westfield River (MA) and was
trucked upstream of existing dams without passage into suitable spawning habitat. The
remaining three adult salmon were captured at Holyoke Fish Lift and all were retained for
swimming performance research at the USGS CAFRC for a period of less than 48 hours, after
which they were released immediately downstream of the CAFRC.
Juvenile Atlantic Salmon Releases - Connecticut
A total of 66,009 Atlantic Salmon fry were stocked in the Salmon River basin (22,702) and
Farmington River basin (41,307) in 2016. This is a substantial decrease from the 390,667 fry
stocked solely in the State of Connecticut in 2015.
Gizzard Shad - A total of 598 Gizzard Shad were counted at the Holyoke Fish Lift in 2016, an
increase from the 84 passed in 2015 and the 410 passed in 2014.

Page 30 of 36
Fish Passage There has been a diversity of activities related to fish passage, some of which are highlighted in
this section. John Warner continued in his role as the USFWS Hydropower Coordinator in this
basin. In this report period, the CRASC continued to not have FirstLight Power install their
smolt barrier net at Northfield Mountain Pump Storage facility. Fishway inspections prior to the
start of the 2016 season, or early in the season, were completed by USFWS Fish Passage
Engineers Brett Towler and Brian Waz (Vernon, Turners Falls, Holyoke, and on Westfield River
-West Springfield Dam). These annual inspections have identified issues that were brought to
the attention of the operators and have been resolved in a timely manner.
At Holyoke Dam, Holyoke Gas and Electric completed the new downstream fish passage
measures that were operational for the first time in April 2016. These measures included
reduced full depth, bar rack spacing in front of the station intakes, deep/submerged downstream
fishway entrances (two entrances built in the new rack), and a new hydraulic jump for bascule
gate discharge, over the spillway fishway entrance into an excavated plunge pool, all of which
were designed to improve downstream passage protections for Shortnose Sturgeon, American
Eel, and American Shad. This significant project also included alteration to the spillway fishway
entrance to make it better suited for entry by Shortnose Sturgeon, as well as improving the
entrance attraction jet (water flow), under the bascule gates discharge that is directed into the air
at the dam apron and into a designed/excavated plunge pool ~10 meters away. A small retaining
wall that had previously interfered with the bascule gate’s discharge off the spillway fishway
entrance was also removed.
Study plans to evaluate upstream American Shad passage with the new spillway entrance
configuration were designed and executed in 2016. Study results have not yet been received by
the agencies for that work. Studies to evaluate downstream passage of adult out-migrating silver
American Eels and also for juvenile American Shad were also conducted in the fall of 2016, with
no reports available at this time. As mentioned earlier, studies to evaluate fish passage, both up
and downstream for Shortnose Sturgeon were not designed and conducted in 2016 as was hoped.
However, the study design necessary for this species are expected to be developed and
implemented in 2017.
The Turners Falls Dam and Northfield Mountain Pump Storage, with their ongoing FERC
relicensing studies, had many study reports submitted to FERC in 2016. The agencies benefitted
from a large inter-agency effort to review these reports and develop response/comment letters.
Study response letters identified any areas of concern with design, sample sizes, analyses, results
and interpretation that were also discussed at meetings and in other venues. The agencies
currently have yet to receive reports that include instream flow/habitat, NMPS entrainment
(repeated in 2016), and downstream juvenile American Shad.
Vernon, Bellows Falls, and Wilder Dam projects, as part of their relicensings also had many
study reports submitted to FERC in 2016. These reports required a large inter-agency effort to
review and comment on relative to study goals and objectives. Study response letters identified
any areas of concern with design, sample sizes, analyses, results and interpretation that were also
discussed at meetings.

Page 31 of 36
Appendix A. Fishway count report produced by CTRFWCO for distribution and posted on
office web site.
This report is compiled by the U.S. Fish and Wildlife Service, using fishway count data provided by several agencies as well
power companies and is dependent in many cases on the review of video counts, that have an associated time lag for
updates. Please visit http://www.fws.gov/r5crc for other count data summaries, and related information.
Fishway, RiverData as
of:
American
shadAlewife
Blueback
Herring
Atlantic
Salmon
American
Eel
Sea
Lamprey
Striped
bass
Gizzard
Shad
Shortnose
SturgeonOther
Mary Steube,
Mill final 406
Moulson Pond,
Eightmile final 10 83 3,421 40
Leesville,
Salmon final 1A 669B
StanChem,
Mattabesset final 36 303 13 87
Rainbow,
Farmington final 141 828C 494
W. Springfield,
Westfield final 5,940 1 449
Holyoke,
Connecticut-MA 385,930 137 3 38,449C 35,249 638 598 94D
Easthampton,
Manhan final 59
Turners Falls,
Connecticut-MA in review 54,069 15,128
Vernon,
Connecticut-VT final 35,513 -907 5,521
Bellows Falls,
Connecticut-VT final 1,973 -163 1,619
Wilder,
Connecticut-VT not run
Total to basin,
only first barrier
counts 392,057 792 3,558 5 36,245 638 685 79
Last year totals 416,355 237 11,822 22 24,573 21 84 1
C special ramp/traps
All returning adult sea-run salmon will be streamer tagged below its dorsal fin and released and if angled released without harm,
preferably without removing from the water. Please contact USFWS at 413-548-9138 x8121 to report any capture/releases.
2016 Connecticut River Basin Fishway Passage CountsReport Date: 12/30/2016
B Count is based on nest surveys
A adult Atlantic Salmon captured downstream of Leesville moved/released upstream
D Shortnose Sturgeon captured at lift were returned back downstream, 15 recaptured twice, 4 recaptured 3 times

Page 32 of 36
Appendix B. The Connecticut Marine Fisheries Division’s Juvenile Alosine Seine Survey data
of annual catch rate values, provided to the Atlantic States Marine Fisheries Commission. Values
are geometric mean catch rates from seine surveys conducted at seven sites from July through
November annually.
Year Juv Shad Juv BBH
1978 5.89 1979 7.84 24.8 1980 9.21 26.75 1981 6.05 11.49 1982 1.81 6.09 1983 4.99 16.47 1984 3.37 11.57 1985 7.14 18.23 1986 6.29 13.61 1987 9.89 21.58 1988 5.68 17.04 1989 4.85 7.52 1990 10.39 14.41 1991 3.92 11.36 1992 7.21 9.87 1993 9.49 14.43 1994 12.22 13.92 1995 1.34 5.03 1996 6.5 5.91 1997 6.75 9.66 1998 3.65 4.39 1999 5.47 5.57 2000 4.42 4.17 2001 2.73 3.83 2002 5.55 3.95 2003 6.88 5.88 2004 5.62 2.36 2005 10.08 4.10 2006 1.82 3.50 2007 8.15 6.61 2008 5.06 2.20 2009 3.4 1.77 2010 10.23 12.82 2011 3.08 2.93 2012 3.03 2.22 2013 3.16 6.89 2014 8.03 3.69
2015 8.53 8.63

Page 33 of 36
Appendix C. History of the Anadromous Fish Program
Native diadromous fishes (diadromy includes anadromous and catadromous fishes, with
American Eel being the only catadromous species in this basin) were once abundant in the
Connecticut River basin excluded from habitat only by natural barriers and their physiological
limitations. Atlantic Salmon ascended the main stem Connecticut River to Beechers Falls, VT,
nearly 400 miles upriver from its outlet at Long Island Sound. American Eel have been
documented even farther upstream in the basin by early New Hampshire Fish Game studies. No
fishery management or scientific information exists that provides a technical description of the
pre-colonial diadromous fish populations. However, historical accounts of the region are filled
with references to large American Shad, river herring and Atlantic Salmon runs which were
known to have been an important food source in the spring for the native people and early
European settlers. As colonization by Europeans and the development of water power sites
expanded throughout the basin, anadromous fish populations notably declined. A major cause of
the declines or loss of runs was largely the construction of dams that blocked fish migrations
from reaching their spawning habitat (Figure 1). Tributaries were more easily dammed and so
elimination of these species progressed rapidly in these areas first, with settlement and use of
early water power for mills. The first dam across the main stem Connecticut River was
constructed as early as 1798, for barge/boat movement, near the present site of Turners Falls,
MA. This dam blocked returning American Shad, river herring, Atlantic salmon and Sea
Lamprey from access to spawning habitat in the northern and central portion of the river basin.
As a result, those species simply disappeared from both New Hampshire and Vermont.
An interagency state/federal program to restore salmon to the Connecticut River based on the
stocking of fry hatched from eggs taken from Penobscot River Atlantic Salmon was initiated in
the 1860s, decades after the construction of the Holyoke Dam, MA. Although the effort resulted
in the return of hundreds of adult salmon for several years in the 1870s and 1880s, the program
eventually failed due to both uncontrolled harvest of fish in Connecticut waters and the failure to
construct effective fish passage at dams in Massachusetts. Concurrent with the salmon
restoration effort were the state’s American Shad culture and stocking efforts to enhance reduced
runs of this valued species. Work to restore and enhance these two species was conducted
through developing fish culture techniques that were gaining popularity as an approach to
achieve fishery management goals.
Although interest continued in restoring Atlantic Salmon to the basin, no action was taken for
many decades due to the lack of funds and the lack of effective fish passage technology (an early
design fish ladder had been installed at Holyoke Dam). The condition of the river environment
continued to deteriorate in response to widespread pollution and dam construction through the
early to mid-1900s. By the 1960s, some tributary dams were breached and pollution abatement
programs were initiated. Long term cooperative restoration programs became feasible with the
passage of the federal Anadromous Fish Conservation Act of 1965 (P.L. 89-304) which made
funds available for interstate fish restoration programs. The combined effects of these events set
the stage for anadromous species restoration. In 1967 the four basin states, USFWS, and NMFS
signed a statement of intent to restore anadromous fishes including American Shad, Atlantic
Salmon, and river herring to the Connecticut River. Atlantic Salmon were a focus due to its
appeal for recreational angling opportunities by the resource agencies. Early salmon stockings
were initially comprised of two-year old smolts of Canadian origin reared in federal trout
hatcheries that had recently been converted to salmon production. The term smolt defines a
salmon life-stage when the transitional migration from freshwater to the marine environment

Page 34 of 36
occurs, typically in the months of April and May. The first adult salmon return from these smolt
releases was documented in 1974.
Early in the Atlantic Salmon Program the management emphasis was placed on stocking smolts
with the USFWS building a salmon hatchery in Bethel, VT, and CTDEEP and MADFW
converting trout hatcheries for salmon production. Production of stream-reared smolts, from
juvenile stockings, was combined with smolts produced in hatcheries to increase smolt
emigration from the river. A major effort was begun in 1987 to stock fry into appropriate habitat
in the basin, based upon in-river research results.
Beginning in 1994, the Program utilized only “Connecticut River” fish, with no introductions of
genetic material from outside the basin. Genetic monitoring had demonstrated the development
of some unique genetic characteristics (alleles) that distinguish the Connecticut River population
from other populations at that scale. The use of conservation genetics enabled the Program to
maintain a genetically healthy population to maximize genetic diversity and reduce risks from
genetic issues.
Adult Salmon returns per 10,000 stocked fry declined dramatically from what had been
documented from 1979 through 1994, when this rate averaged 0.71 (high of 1.6). For the period
1995 through 2008, the mean adult/10,000 fry stocked was 0.11 (refer to U.S. Atlantic Salmon
Assessment Committee Report 27 – 2014 Activities (http://www.nefsc.noaa.gov/USASAC/Reports/). This
latter period is when the program shifted to fry stocking as the primary restoration strategy,
coinciding with this unexpected decline in fry return rates (due to marine survival rate
decreases). This situation translated to a sustained reduction on the order of 1/6 of what had
been observed for this rate (< 1994) even as issues of safe downstream passage of smolts at
hydropower facilities and ocean fishery closures were completed. Studies over time have shown
shifts in salmon marine prey species abundance and distributions, shifts in predator assemblages,
and shifts in marine habitat area use are likely contributing factors that can be related to climate
change.
The severe damage to the White River National Fish Hatchery (WRNFH) in fall of 2011, from a
flood event, severely impacted the Salmon Program as it maintained a high proportion of the
domestic broodstock and subsequently annual egg and fry production for all the states. WRNFH
had been producing approximately 65% of the fry for the Program in the preceding 10 years. The
loss of this facility, in conjunction with ongoing reviews of the best science and information
related to restoration efforts, and emerging USFWS Northeast Region fisheries issues and
priorities, led the USFWS to announce its decision to conclude fish culture activities for the
Connecticut River Atlantic Salmon Program. That announcement was made in public at the July
2012 Connecticut River Atlantic Salmon Commission meeting. Subsequently, in the fall of
2012, the Commonwealth of Massachusetts decided it would no longer culture salmon at its
Roger Reed State Hatchery. The last spawning of domestic salmon broodstock occurred at that
facility in 2012, with all fry and remaining Connecticut River salmon of various ages stocked out
in 2013. The State of New Hampshire had concluded the restoration effort with a last stocking
in 2012 while the final stocking in Vermont was in 2013.
The State of Connecticut currently operates a “Salmon Legacy Program,” which is not a
restoration program but serves other defined purposes. The goal of Connecticut’s program is to
maintain Atlantic salmon in select watersheds, maintain existing genetics of the Connecticut
River salmon, provide fish for their state broodstock fishery program (outside of the Connecticut

Page 35 of 36
River basin), and support educational programs such as the school egg/fry rearing program.
Action to provide upstream fish passage on the Connecticut River main stem in the mid-1900s
occurred in 1955, when a rudimentary fish lift was constructed at Holyoke Dam to pass
American Shad and river herring, that relied on humans pushing them in wheeled buckets. At
that time, and for approximately three decades after, the Enfield Dam remained a partial barrier,
even though laddered, eventually disintegrating completely in the 1980s. The Holyoke Dam
facility was expanded in 1976 when substantial upstream passage modifications occurred, with a
new second lift installed in the spillway (or at the base of the dam, as opposed to the existing
“tailrace” lift entrance). Although not studied, upstream passage efficiency appeared to improve
greatly with corresponding increases in annual fish counts for species like American Shad and
Blueback Herring (Figure 7). Other fishways built at dams on the main stem river and tributaries
allowed returning Atlantic Salmon, American Shad, river herring, and Sea Lamprey access into
select portions of the basin (with varying degrees of fishway effectiveness) targeted for
restoration. Major issues with several different fishways have been apparent relative to
ineffectiveness at passing American Shad and river herring. These issues have been dealt with
on a case by case basis, with varied degrees, of success. However, with the Federal Energy
Regulatory Commission’s five main stem project relicensing underway (through 2018 and
beyond), opportunities for improvements for fish passage are anticipated along with plans to
address other problem sites in the near future (e.g., Rainbow Fishway on the Farmington River).
Upstream passage at Turners Falls Dam (Massachusetts) fishways (first operational in 1980)
have been studied and modified for decades and is one of the projects in the FERC relicensing
process at this time. Passage issues relative to American Shad are best explained by the fact that
no ladders of the size required on the main stem had been designed for that species as the
cooperative restoration effort took this management need on in the 1970s. The USFWS relied on
the best information (no specific studies available) at the time that suggested West Coast fish
ladders on the Columbia River were effective at passing American Shad. This led to the adoption
of these designs, downsized considerably from the Columbia River, for use on the main stem
dams. The USFWS worked with the power companies in the design and construction, to develop
operating parameters for flow, velocities, and turbulence measures. However, the down scaling
created some unforeseen challenges in hydraulics for these species that the agencies, researchers
(USGS CAFRC), and power company consultants have worked on resolving over the years.
Following on the Turners Falls ladders completions, the Vernon Dam (Vermont) fish ladder
became operational in 1981 with Bellows Falls and Wilder dam fish ladders in the subsequent
years. As the number of salmon fry stocked in the basin increased during the late 1980s, concern
grew for the potential negative effects of hydroelectric turbines or other passage routes on
outmigrating smolts, as well as juvenile and post spawn adult American Shad. Efforts to provide
safe and effective downstream fish passage on both main stem and tributary projects were
initiated in the 1980s. In 1990, a memorandum of agreement (MOA) were signed with two
major utility companies that operated hydroelectric facilities at six main stem projects that
established time frames for downstream fish passage construction.
Efforts to provide necessary fish (all diadromous species) passage conditions at these projects
and throughout the basin are ongoing. A recent example is Holyoke Dam and its new
downstream passage facilities, designed specifically to address adult American Eel and
Shortnose Sturgeon that became operational in 2016.

Page 36 of 36
The state and federal agencies continue to work in close cooperation with many partners to
address fish management, protection, enhancement, and restoration topics for both populations
and habitats. This work is important for the ecological, recreational, and commercial benefits,
derived from healthy native fish populations and the aquatic habitats they require. Currently,
ongoing fisheries work includes continuing efforts to increase both abundance levels and
distributions (particularly upper basin and in tributaries) as well as stock structure characteristics
(multiple age classes and repeat spawners) to support population resilience and health. The
current FERC relicensing process for the five main stem facilities is important in this regard
relative to the 30 or more year length of these federal licenses. The final license conditions for
these commercial operators may serve to protect, mitigate and enhance the public’s fishery
resources. The CRASC and its predecessor, the Connecticut River Policy Committee, have
provided and continue to provide, a critical coordinated fishery leadership role from policy
setting to project implementation, resulting in many positive outcomes not observed in other
large East Coast river basins.