CONGESTION IN THE ATLANTA REGION
16
CONGESTION IN THE ATLANTA REGION State Transportation Board Committee of the Whole February 14, 2007 Kofi Wakhisi Principal Transportation Planner Atlanta Regional Commission
Transcript of CONGESTION IN THE ATLANTA REGION

CONGESTION IN THEATLANTA REGION
State Transportation BoardCommittee of the Whole
February 14, 2007
Kofi WakhisiPrincipal Transportation Planner
Atlanta Regional Commission

Metropolitan Planning Organization (MPO)Boundaries
Former 10 County MPO
2000 Urbanized Area
18 County MPO

Federal Planning Requirements for a MPO
• Develop long range plan (RTP)
• Develop short-range implementation program (TIP)
• RTP and TIP must be:
• Multimodal and balanced
• Collaboratively developed
• Financially constrained
• RTP and TIP must conform to air quality standards in areas of nonattainment
• Congestion Management Process (CMP) must be developed and implemented by larger MPOs

CMP Facility-Based Elements
• Measure system performance
• Identify causes of congestion
• Assess alternatives
• Implement cost-effective actions
• Evaluate effectiveness of actions
Emphasizes demand reduction programs and operational improvements prior to consideration of SOV capacity

INTENSITY (TTI)How bad is the congestion?
How the Atlanta CMP Defines Congestion
EXTENTHow many people are affected?
DURATION How long does it last?
Incorporated into the 70% weighting of congestion relief for project prioritization

Incorporation of Congestion Mitigation Task Force Recommendations
• Regional TTI Target of 1.35
• 70% Congestion Relief Weighting
• Apply consistent benefit-cost methodology
TTI: Congested Travel Time 35% longer than Free Flow Travel Time
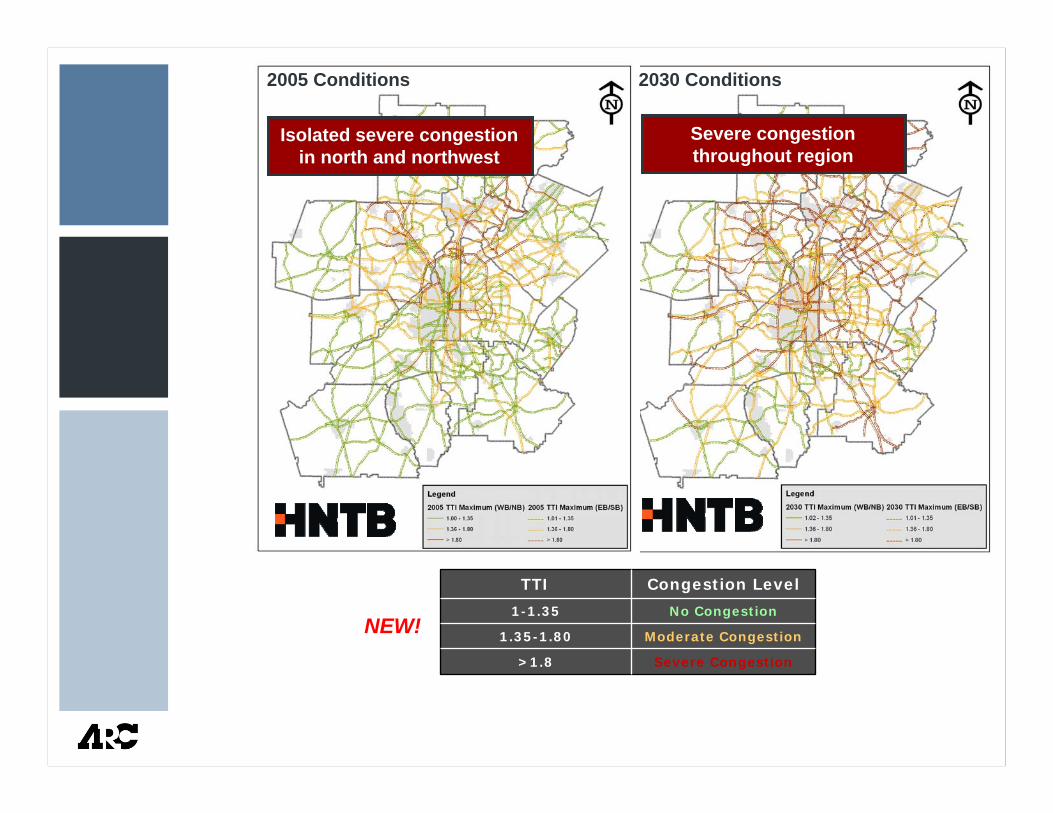
Severe Congestion>1.8
Moderate Congestion1.35-1.80
No Congestion1-1.35
Congestion LevelTTI
2005 Conditions 2030 Conditions
Isolated severe congestion in north and northwest
Severe congestion throughout region
NEW!

Free Flow Conditions PM Peak Period
Congestion Restricts Commuters
45 minutes
Reduced accessibility from Downtown/Midtown (2005)

Regional Travel Time Index
0.000.200.400.600.801.001.201.401.601.80
2006 Mobility 2030 No-Build
1.341.52
1.79
Congested Travel Time vs. Free Flow Travel Time

0.0
5.0
10.0
15.0
20.0
25.0
30.0
35.0
2006 Mobility 2030 No-Build
Percent of VMT in Congestion
13.6%
21.8%
30.3%
VMT = Vehicle Miles of Travel

Annual Per Capita Cost of Congestion
$0
$500$1,000
$1,500$2,000
$2,500$3,000
$3,500
$4,000
2006 Mobility 2030 No-Build
$1526
$2493
$3540
Wasted Fuel and Time

There is no Silver Bullet
• Rapid growth will always create congestion
• Infrastructure “chases”growth
• Metro areas have a wide range of travel patterns and needs
• Traditional capacity expansions don’t meet all needs or conditions
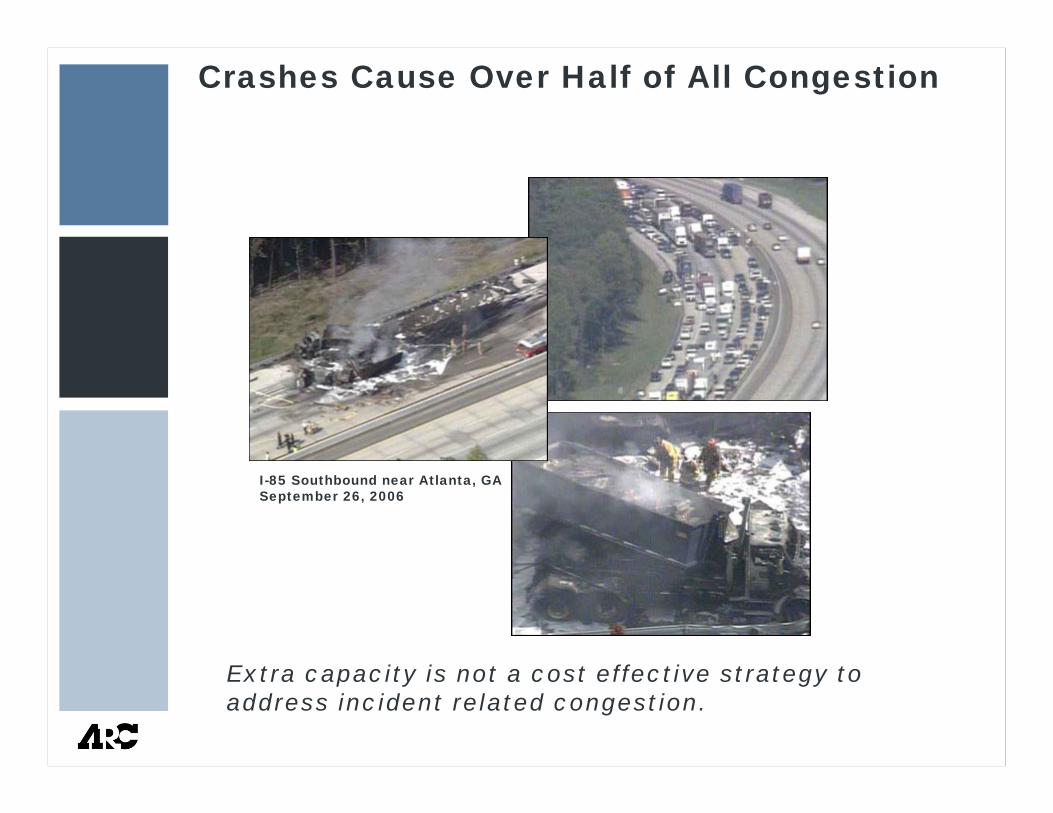
Extra capacity is not a cost effective strategy to address incident related congestion.
I-85 Southbound near Atlanta, GASeptember 26, 2006
Crashes Cause Over Half of All Congestion
I-85 Southbound near Atlanta, GASeptember 26, 2006

Special Events Create Unique Demands
Good planning, proper traffic control and travel options are all essential to manage unique demands. Remember how well traffic flowed during the Olympics?

Comprehensive Strategy is Needed
• More travel options for residents and visitors
• “Four T” approach• Tolling
• Transit
• Telecommuting
• Technology
• Cost effective solutions
• Better implementation rate
• Integration of land use and transportation planning
• Additional funding to meet needs and priorities
• Georgia spends 50% less per capita on transportation than the national average

I-85 Southbound near Atlanta, GASeptember 26, 2006
Next Steps
• Continued advances in CMP development
• Continued Incorporation into Project Identification and Prioritization Process
• Intensify Field and Real-Time Data Collection Efforts
• Jurisdictional Bottleneck Submittals
• Travel Time GPS Data
• Intersection Turning Movement Count Data
• Activity Center Based Congestion Monitoring