Congestion Control for Switched...
8
Congestion Control for Switched Ethernet Gary McAlpine - Intel Corporation [email protected] Abstract Interconnects for clusters and bladed systems must deliver efficient throughput, low latency, low delay variations and minimal frame drops. The primary technical issues hindering Ethernet adoption for cluster and blade system interconnects are the current methods Ethernet switches use for dealing with congestion, which can happen frequently under cluster and blade system workloads. The common response to congestion is to drop frames and the common method of avoiding the need to drop frames is to utilize very large switch buffers. In this paper, we propose the insertion of a simple self-managing congestion control protocol into existing communication stacks at the edges of layer 2 switched interconnects. We assert that control of the traffic flow into the layer 2 subnet is key to controlling the characteristics of cluster and blade system interconnects. We show simulation results demonstrating how the proposed protocol, coupled with a layer 2 ingress rate control function, can dynamically control traffic flow so as to maximize the throughput efficiency while minimizing the loss, delay, and delay variations. 1. Introduction Although Ethernet is typically used as a local area network (LAN) technology, there is substantial interest in utilizing Ethernet in cluster and blade system interconnects. Ethernet is well-known, widely available, and broadly compatible. Unfortunately, the IETF and IEEE standards do not currently support the congestion management (CM) mechanisms necessary to enable Ethernet based interconnects to provide the appropriate characteristics for clusters and bladed systems. In our previous paper [1], we explored a 3 level architectural approach to CM that was designed to leverage existing transport and network layer mechanisms at level 3, add layer 2 subnet mechanisms at level 2, and leverage existing and/or new link layer mechanisms at level 1. We took this 3 level approach because the layer 2 technology of interest was full-duplex Ethernet and our primary goal was to get an appropriate set of methods and mechanisms supported by the standards. To achieve this goal, Ethernet CM would have to operate in harmony with existing and future mechanisms utilized in the standard networking stacks. It would also have to be designed so that it could be seamlessly integrated into the existing stacks and, if supported by at least some of the layer 2 components, show an improvement in the performance characteristics (or no difference at a minimum). The IEEE 802.1 bridging [2] and 802.3 link layer protocols [3] and the IETF network and transport protocols (IP, TCP, & UDP) are at the heart of the most widely deployed and interoperable communication stacks today. Recent studies have sought to reduce TCP/IP processing overheads in datacenter environments [4][5]. Unfortunately, the streamlining and acceleration of the upper layer stacks potentially creates even more severe and more frequent congestion events in the lower layer interconnects (such as short-range 1 & 10 Gbps Ethernet subnets). New upper layer protocols like iSCSI [6] and RDMA [7] (for storage and cluster communications over TCP/IP) rely on low frame loss rates to achieve low processing overheads, high throughput, and low latencies. Unfortunately, TCP uses the rate of packet loss to gauge the level of congestion along each connection and to control transmission rates accordingly. The only standard method for Ethernet switches to signal congestion is to drop packets. High loss rates can cause a large percentage of traffic to be handled by exception processing, which negatively affects processing overheads and delays. However, the most significant impact to TCP performance is long periods of inactivity due to timeouts resulting from packet drops. And long timeouts can easily bring a cluster or blade system's performance to its knees. Since many target applications of switched Ethernet need to support switching of TCP connections where one end or both are terminated outside the local vicinity, we can't just shorten the timeout times to minimize the impact of drops. In this paper, we narrow the focus of the research outlined in [1] to the subnet level (level 2) of the architecture. We propose a basic protocol for signaling layer 2 congestion information (L2CI) to the subnet ingresses and to support self-management of ingress rate control state. We outline a basic set of functions that can be added to the interface between the upper and lower layers of the stacks to support the L2CI protocol and the use of the congestion information to dynamically control the traffic flow into the layer 2 subnet. We use simulation results to demonstrate how effectively these functions can be utilized to maximize throughput efficiency and minimize loss, delay, and delay variations. And, we demonstrate how the subnet level mechanisms can operate in harmony with existing upper layer mechanisms. 2. Related Prior Work Prior congestion management research for long-range networks is reflected in such standards as TCP/IP [8][9], ISDN [11], ATM [12], and others. Prior research for short-
Transcript of Congestion Control for Switched...
Congestion Control for Switched Ethernet Gary McAlpine - Intel Corporation
Abstract Interconnects for clusters and bladed systems must deliver efficient throughput, low latency, low delay variations and minimal frame drops. The primary technical issues hindering Ethernet adoption for cluster and blade system interconnects are the current methods Ethernet switches use for dealing with congestion, which can happen frequently under cluster and blade system workloads. The common response to congestion is to drop frames and the common method of avoiding the need to drop frames is to utilize very large switch buffers. In this paper, we propose the insertion of a simple self-managing congestion control protocol into existing communication stacks at the edges of layer 2 switched interconnects. We assert that control of the traffic flow into the layer 2 subnet is key to controlling the characteristics of cluster and blade system interconnects. We show simulation results demonstrating how the proposed protocol, coupled with a layer 2 ingress rate control function, can dynamically control traffic flow so as to maximize the throughput efficiency while minimizing the loss, delay, and delay variations.
1. Introduction Although Ethernet is typically used as a local area network (LAN) technology, there is substantial interest in utilizing Ethernet in cluster and blade system interconnects. Ethernet is well-known, widely available, and broadly compatible. Unfortunately, the IETF and IEEE standards do not currently support the congestion management (CM) mechanisms necessary to enable Ethernet based interconnects to provide the appropriate characteristics for clusters and bladed systems. In our previous paper [1], we explored a 3 level architectural approach to CM that was designed to leverage existing transport and network layer mechanisms at level 3, add layer 2 subnet mechanisms at level 2, and leverage existing and/or new link layer mechanisms at level 1. We took this 3 level approach because the layer 2 technology of interest was full-duplex Ethernet and our primary goal was to get an appropriate set of methods and mechanisms supported by the standards. To achieve this goal, Ethernet CM would have to operate in harmony with existing and future mechanisms utilized in the standard networking stacks. It would also have to be designed so that it could be seamlessly integrated into the existing stacks and, if supported by at least some of the layer 2 components, show an improvement in the performance characteristics (or no difference at a minimum).
The IEEE 802.1 bridging [2] and 802.3 link layer protocols [3] and the IETF network and transport protocols (IP, TCP, & UDP) are at the heart of the most widely deployed and interoperable communication stacks today. Recent studies have sought to reduce TCP/IP processing overheads in datacenter environments [4][5]. Unfortunately, the streamlining and acceleration of the upper layer stacks potentially creates even more severe and more frequent congestion events in the lower layer interconnects (such as short-range 1 & 10 Gbps Ethernet subnets). New upper layer protocols like iSCSI [6] and RDMA [7] (for storage and cluster communications over TCP/IP) rely on low frame loss rates to achieve low processing overheads, high throughput, and low latencies. Unfortunately, TCP uses the rate of packet loss to gauge the level of congestion along each connection and to control transmission rates accordingly. The only standard method for Ethernet switches to signal congestion is to drop packets. High loss rates can cause a large percentage of traffic to be handled by exception processing, which negatively affects processing overheads and delays. However, the most significant impact to TCP performance is long periods of inactivity due to timeouts resulting from packet drops. And long timeouts can easily bring a cluster or blade system's performance to its knees. Since many target applications of switched Ethernet need to support switching of TCP connections where one end or both are terminated outside the local vicinity, we can't just shorten the timeout times to minimize the impact of drops. In this paper, we narrow the focus of the research
outlined in [1] to the subnet level (level 2) of the architecture. We propose a basic protocol for signaling layer 2 congestion information (L2CI) to the subnet ingresses and to support self-management of ingress rate control state. We outline a basic set of functions that can be added to the interface between the upper and lower layers of the stacks to support the L2CI protocol and the use of the congestion information to dynamically control the traffic flow into the layer 2 subnet. We use simulation results to demonstrate how effectively these functions can be utilized to maximize throughput efficiency and minimize loss, delay, and delay variations. And, we demonstrate how the subnet level mechanisms can operate in harmony with existing upper layer mechanisms.
2. Related Prior Work Prior congestion management research for long-range
networks is reflected in such standards as TCP/IP [8][9], ISDN [11], ATM [12], and others. Prior research for short-

range networks is reflected in such standards as Fibre Channel [13], Infiniband™ [14], and Advanced Switching [15]. Recent research on CM for unreliable datagram services are reflected in the IETF draft on DCCP [10]. An example of recent research on CM for TCP is reflected in FAST TCP [19]. Because the list of references to congestion management research over the past 30 years is so long, we do not attempt to provide a comprehensive list for this paper. Our research is uniquely focused on enhancing short range 1 and 10 Gbps IEEE802.1/802.3 subnets with only a few hops. As such, the methods and mechanisms we can consider must be able to seamlessly integrate into the standard networking stacks.
3. Review of Our 3 Level Approach We broadly classified congestion control mechanisms as
link level mechanisms, subnet level mechanisms, and end-to-end mechanisms. Link level mechanisms try to regulate the flow of traffic over each link to avoid frame discards due to transient congestion. Subnet level mechanisms try to optimize traffic flow through a subnet to avoid oversubscription of local subnet resources. End-to-end mechanisms attempt to take action at the “flow” sources or on higher layer “flow-bundles” to avoid oversubscription of network resources end-to-end.
Level 3(UpperLayerStacks)
Level 2(I/F &Switch)
Level 1(MACs & Links)
802.3 link 802.3 link
802.1 Bridge(MAC Client)
802.3 MAC
OS
NIC & Driver (MAC Client)
802.3 MAC
Apps
End Station
OS
NIC & Driver (MAC Client)
802.3 MAC
Apps
End Station
Switch
Fig. 1ULP CC,
RED,ECN,etc.
PRC,L2CI
Pause
The strategy for our research was to analyze the issues at
all 3 levels, and simulate various mechanisms for dealing with congestion at each level. We developed simulation models with various independent mechanisms at each level so that we could test each by itself, as well as in various combinations with mechanisms at other levels. Figure 1 shows the coarse structure of typical end-
stations and switches and their relationship to the 3 levels of congestion control. They include 1) link level: the IEEE802.3 MAC and link layers, plus the MAC Client interface; 2) subnet level: the interface between the upper layers and lower layers, plus the IEEE802.1 switching layer, and 3) end-to-end: the upper layer stacks such as those in the operating systems of servers, workstations, and routers. The primary methods we've tested to-date are
some of those currently supported by the IEEE and IETF standards (Pause, RED, ECN, & TCP congestion control [2][16][17]). We tested various new link level mechanisms, but
ultimately found they were ineffective when used stand-alone in multi-stage subnets. We did, however, show that the link level mechanisms (including the existing Pause method supported by IEEE802.3) could be used effectively as a fail-safe against packet drops when utilized with the higher level mechanisms1. We ultimately decided the new level 1 mechanisms provided too little additional value to justify expending the efforts to standardize them. We determined the key set of mechanisms needed for
effectively controlling the Ethernet subnet characteristics were those at level 2. Support for such mechanisms is also conspicuously missing from the IETF and IEEE standards. In [1] we showed promising results utilizing an initial implementation of a Path Rate Control (PRC) method combined with reverse messaging of layer 2 congestion information (L2-CI) directly from switches. With our initial PRC and L2-CI implementation we were able to achieve ~85% throughput efficiency, but had to utilize ECN at level 3 and link level rate control at level 1 to prevent the overflowing of NIC and switch queues. Since our goal was to support layer 2 congestion management with both TCP and UDP, as well as with other transports and upper layer protocols, we couldn't very well require the use of ECN with PRC. So, the research that followed the previous paper focused on refining the PRC and L2-CI messaging to improve their combined performance and enable them to operate independent of, but harmoniously with, existing and future level 1 and 3 mechanisms.
4. Path Rate Control (PRC) Interface Path Rate Control adds 3 basic functions to the interface
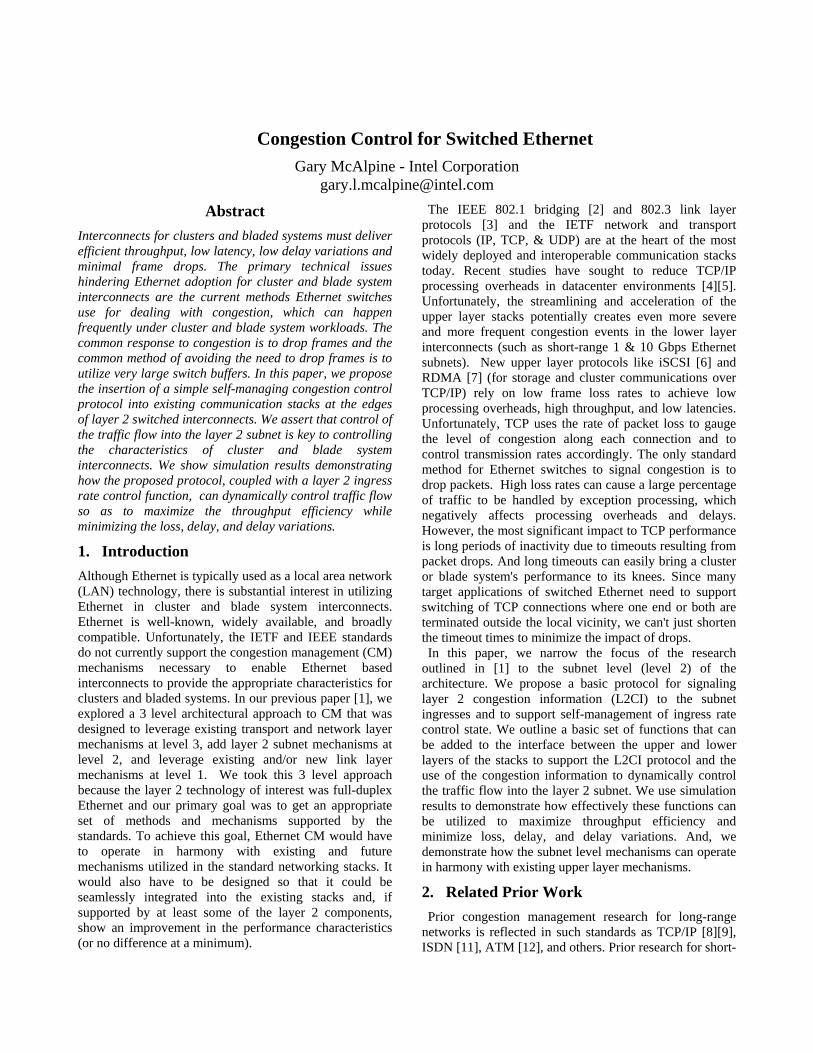
between the higher layers and lower layers (figure 2): 1) A L2CI Protocol Function for generating and receiving path discovery and congestion feedback messages and for maintaining path congestion and state tables; 2) Path Congestion and State Tables for interfacing path specific information to a PRC function; and 3) A PRC function that supports dynamic scheduling of higher layer flows or flow bundles into the lower layer transmit queue(s), based on path specific congestion levels. The PRC interface is structured to support implementations where the layer 2 side may be implemented primarily in hardware and the higher layer side may be implemented in hardware, firmware, or driver level software. It assumes the higher layer side can utilize existing address translation tables to associate flows with paths. (In our simulations, a path is
1 Note that RED and Pause are not very compatible in that RED drops packets to signal congestion and Pause tries to prevent packet drops.
defined by a destination MAC address from a given source MAC perspective.) In this concept, the L2CI Protocol Function supplies
congestion and rate control information to the higher layer PRC function through a set of state tables (e.g. Path & Congestion State Tables). This information enables the PRC function to dynamically rate control higher layer flows or flow bundles into the Transmit Queues in order to avoid oversubscription of lower layer resources. It enables the Higher Layer Interface to discriminate between congested and non-congested paths and invoke higher layer end-to-end congestion control (using ECN, RED, stack flow control, etc.).
Fig. 2
TransmitQueue(s)
FlowQueues
FlowQueues
HigherLayer
Queues
L2CIMessaging
Tx Link
Rx Link
Layer 2 Endpoint
Path &Congestion
StateTables
Flow toPath
Association
TransmitInterface
Higher Layer to L2 I/F L2 to Higher Layer I/F
L2CIProtocolFunction
ReceiveQueue(s)
TransmitScheduling
PathRate
Control
ReceiveInterface
HigherLayer
I/F
Ingress rate control and flow optimization (e.g. PRC) local to layer 2 enables utilizing the buffers above layer 2 (which are generally much larger) to absorb large burst collisions, insulating the layer 2 components from much of that burden. In cases where the higher layer stack at a layer 2 endpoint is a router function, any backlog caused by PRC enables the higher layers to perform dropping or marking of packets above layer 2. In cases where the upper layer stack sources the traffic, any backlog caused by PRC enables backpressure up the stack to the flow sources. Thus, the PRC function was designed to operate harmoniously with the operation of the upper layer stacks while dynamically optimizing the traffic flow through the layer 2 subnet.
5. Layer 2 Congestion Information Protocol The L2CI Protocol provides the functionality for
collecting congestion information from the layer 2 subnet and conveying it to the edges of the subnet. It provides the information necessary to support the PRC functionality. At the time we wrote the previous paper [1], we had
implemented 2 methods of conveying layer 2 congestion information and anticipated various others. Unfortunately, the research that followed exposed significant issues with each of those methods, causing us to develop a method we hadn't previously anticipated. In the following paragraphs,
we summarize each of the methods tested and some of the insights we gained from them. Method 1: The first method selectively marked Ethernet
frames passing through congestion in switches (using a random early detection algorithm). At the layer 2 egresses, the frame marks were transferred to the congestion experienced (CE) bit in the IP headers and forwarded on to the TCP egress to trigger ECN feedback. This method had several issues: 1) ECN doesn't work for all ULPs; 2) There are no unused bits available in the Ethernet frame header for layer 2 marking (requiring a change to the frame format); 3) To support PRC, we needed the congestion information at the layer 2 ingresses. Since not all protocols guarantee there will be reverse traffic to carry this information, it required the addition of a messaging protocol to get the congestion information back to the layer 2 ingress (requiring a new messaging protocol); 4) Severe congestion can cause almost all frames to be marked, which made it very difficult to control the BW consumed by the resulting reverse messaging; 5) One bit of congestion information proved insufficient to enable effective layer 2 ingress rate control. Method 2: The second method selectively generated
reverse messages (minimum sized Ethernet frames) directly from points of congestion in switches and egress endpoints. This eliminated the issue of frame format changes. It also enabled sending all the information needed by PRC for performing effective ingress rate control. In this method, we used a rate-limited random early detection algorithm to select the frames to which we responded. We used the source address of each selected frame to identify the ingress to which a congestion message would be sent. The congestion message indicated the destination address (or Path) of the selected frame and the level of congestion encountered at that point in the path. The congestion level was specified as a percent of the per-port buffer space consumed by traffic utilizing the congested port (this number could be > 100% due to buffer sharing). This is the method that was used to generate the data for the Path Rate Control scenarios in the previous paper [1]. This method enabled fairly effective ingress rate control but suffered from a basic issue: In a multi-stage interconnect, conflicting messages could be received from multiple points of congestion along a path. This issue confounded our efforts to deterministically control the traffic flow through the subnet. It also led to the basic insight that we needed an aggregated view of the congestion along each path in order to effectively rate control the traffic into the subnet at the ingresses. Method 3: In the previous methods we utilized explicit
congestion information directly from the points of congestion. For the third method, we considered a couple different ways of implicitly deriving congestion levels from delay incurred by traffic passing through the layer 2 subnet: 1) delay dispersion between pairs of frames caused
by the frames passing through congestion [18]; and 2) the round-trip time (RTT) of probe messages injected into the traffic streams. We abandoned the dispersion method rather quickly because it would require both a frame format change and a new messaging protocol. We implemented the RTT method because it would only require the addition of a simple messaging protocol. In addition, the same protocol could include a simple discovery phase for learning the number of hops, the speed of the slowest link, and the minimum RTT along each path utilized. For the RTT method, we inject a discover message in
front of the first packet to use a given path. The discover message is sent at the highest priority to minimize its round-trip delay. It collects the hop count and the speed of the slowest link in the path in the forward direction, and gets immediately echoed by the layer 2 egress endpoint. The RTT of the discover packet is measured to derive a minimum RTT value. The minimum RTT, hop count, and path speed provide the initial state for that path and are used by the PRC algorithm to control the traffic flow into the ingress of the path. After discovery, probe messages are periodically injected into the path at a fraction of the rate of normal traffic utilizing the path (similar to resource management cells in ATM). Probe messages are simply forwarded by switches and echoed by layer 2 egress endpoints. Each probe is sent at the lowest priority of traffic sent on that path since the previous probe to ensure it follows all the previous traffic. A probe is echoed by the L2 egress at the highest priority. This ensures the probe's delay in the forward direction will account for most of its RTT. The main concern with this method was in keeping the probe rate frequent enough to provide effective feedback while ensuring the bandwidth consumed by the probe traffic was negligible. With a single priority workload we were able to achieve
extremely good results with this method while consuming as low as 1.5% of the total bandwidth on probe messaging. Unfortunately, testing with multiple priorities of traffic exposed a significant issue with this method. The problem is similar to the conflicting feedback problem encountered with Method 2. In this case, the conflicting feedback occurs between probes sent at different priorities (thus following different queuing paths with different delays). We also found that low priority probes could be almost completely stalled by higher priority traffic, even when congestion was fairly light. The basic insight derived from this exercise was that we could not deterministically imply, from delay information, the congestion level for an aggregate of flows of more than one priority. Again, we needed an aggregated view of the congestion along each path. (We could have increased the path granularity by a factor of N for N priorities, but that would have introduced other negative ramifications). Since only the switches have
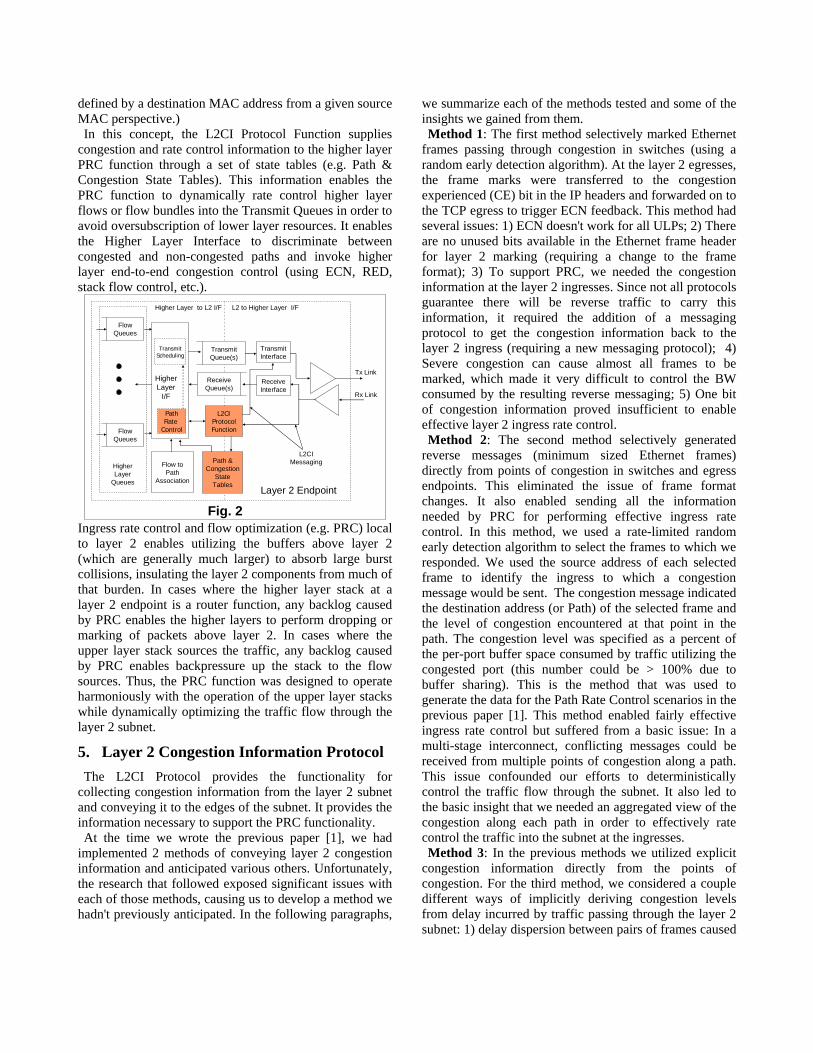
an aggregated view of their local congestion, we needed to get that information explicitly from the switches. Method 4: The L2CI method we used for the PRC
simulations discussed below is illustrated in figure 3. This method also includes the same discover phase as Method 3 to initialize the PRC state for each path utilized. Once a path is initialized, layer 2 egresses periodically send feedback messages that traverse the subnet along the same path as the forward traffic, but in the opposite direction.
HigherLayerFlows
Switch
NIC
Congestion
PRC
AggregatedCongestionFeedback
PRC
PRC
NIC
L2CI
NIC
HigherLayerFlows
FIG. 3
PeriodicFeedbackMessages
L2CI NIC
L2CI
L2CINIC
Each message starts out containing the congestion level
at the L2 egress (specified as a percent of receive buffer currently used). As a feedback message passes through each switch, if the local congestion level for the specified path is greater than the level contained in the message, the switch replaces the congestion level in the message with the local congestion level. Thus, each feedback message received by an ingress L2CI Protocol Function contains the congestion level at the most severely congested point along the path it represents. Each feedback message is then used to update the state to reflect the current congestion level. We were able to achieve extremely good result on all workloads with this method, while consuming ~1% of the total bandwidth on feedback messaging. An alternative version of this method could periodically
insert probe messages into the forward traffic to collect the peak congestion levels along paths in the forward direction (similar to Method 3 but with explicit congestion information). Both probes and probe echoes would be sent at the highest priority to minimize collection time. This method might be used in an interconnect where the forward and reverse traffic follows different paths.
6. Review of Modeling Environment We used the Opnet Modeler discrete event simulation
package for our modeling environment. Our Ethernet switch models are based on a typical shared memory switch with a virtual output queue (VOQ) architecture. Switching is performed according to the IEEE802.1 standards. The switches were modeled to have wire-speed switching capacity (for up to 16 ports with up to 10 Gbs
per port, yielding a maximum of 160 Gbps throughput per switch). A standard IEEE802.3 MAC is used for each switch port. We added support for Pause based link level flow control. We expanded the functionality of the switch and MAC models to support the new mechanisms described above. We also added a new NIC model to end stations to implement the special interfacing functions. The upper layer stacks for the end stations used to model
the client and server nodes include application and TCP/IP layer models. We set the stack parameters to simulate the packet processing rates of an accelerated stack running on a 3.5 GHz Intel processor. We specified 64KB socket buffers between the applications and the transport layer. TCP Reno with Selective Acknowledgements (SACK) was enabled. Although our current test configuration only includes short range connections, we used a TCP window size of 64KB to ensure TCP would generate large bursts. We let the TCP timers run at the default granularity of 500 ms to simulate the typical configuration. Since we are only simulating a 1/10th second congestion event, timed-out connections will not recover during the simulation. For the base workload, the client application simulates
database entry and query transactions. Clients either send (entry) data to the servers or request (query) data from the servers. There are a total of 48 DB Access connections (6 clients and 2 connections per client to each of 4 servers). Each client attempts to consume the full bandwidth of its link in both directions (grossly oversubscribing the interconnect). To test congestion management with mixed priorities of
traffic, we support 2 additional workloads that can be ran simultaneously with the base workload2: 1) we can simulate inter-processor communication (IPC) traffic between all the servers (a total of 12 TCP connections) and 2) we can simulate a video conferencing session between each client/server pair (a total of 24 full-duplex UDP sessions). Since we didn't have a model for a typical IPC transport, we utilized "FTP Puts" to generate the IPC traffic. The DiffServ code points we used mapped the DB access traffic to priority 2, the IPC traffic to priority 3, and the video conferencing traffic to priority 5.
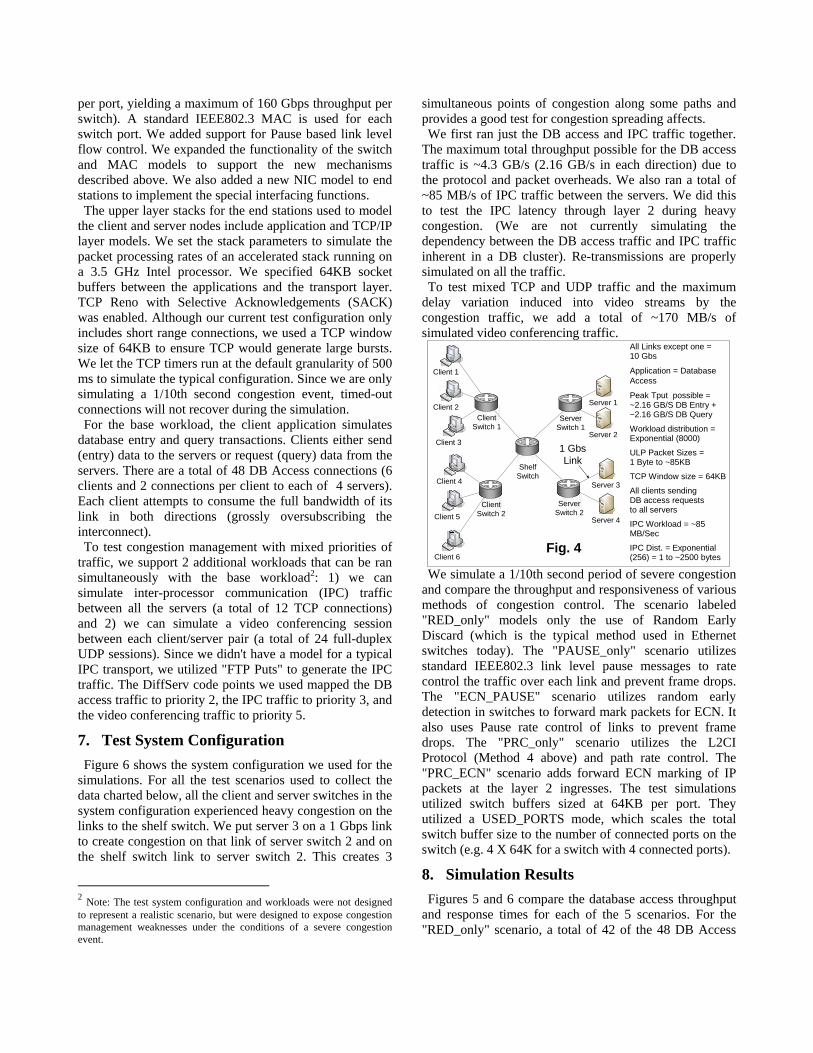
7. Test System Configuration Figure 6 shows the system configuration we used for the
simulations. For all the test scenarios used to collect the data charted below, all the client and server switches in the system configuration experienced heavy congestion on the links to the shelf switch. We put server 3 on a 1 Gbps link to create congestion on that link of server switch 2 and on the shelf switch link to server switch 2. This creates 3
2 Note: The test system configuration and workloads were not designed to represent a realistic scenario, but were designed to expose congestion management weaknesses under the conditions of a severe congestion event.
simultaneous points of congestion along some paths and provides a good test for congestion spreading affects. We first ran just the DB access and IPC traffic together.
The maximum total throughput possible for the DB access traffic is ~4.3 GB/s (2.16 GB/s in each direction) due to the protocol and packet overheads. We also ran a total of ~85 MB/s of IPC traffic between the servers. We did this to test the IPC latency through layer 2 during heavy congestion. (We are not currently simulating the dependency between the DB access traffic and IPC traffic inherent in a DB cluster). Re-transmissions are properly simulated on all the traffic. To test mixed TCP and UDP traffic and the maximum
delay variation induced into video streams by the congestion traffic, we add a total of ~170 MB/s of simulated video conferencing traffic.
Fig. 4
All Links except one = 10 Gbs
Application = Database Access
Peak Tput possible =~2.16 GB/S DB Entry +~2.16 GB/S DB Query
Workload distribution =Exponential (8000)
ULP Packet Sizes =1 Byte to ~85KB
TCP Window size = 64KB
All clients sendingDB access requeststo all servers
IPC Workload = ~85 MB/Sec
IPC Dist. = Exponential (256) = 1 to ~2500 bytes
Server 1
Client 1
Server 2
Server 3
Server 4
Client 2
Client 3
ClientSwitch 1
ClientSwitch 2
ShelfSwitch
ServerSwitch 1
ServerSwitch 2
Client 4
Client 5
Client 6
1 GbsLink
We simulate a 1/10th second period of severe congestion
and compare the throughput and responsiveness of various methods of congestion control. The scenario labeled "RED_only" models only the use of Random Early Discard (which is the typical method used in Ethernet switches today). The "PAUSE_only" scenario utilizes standard IEEE802.3 link level pause messages to rate control the traffic over each link and prevent frame drops. The "ECN_PAUSE" scenario utilizes random early detection in switches to forward mark packets for ECN. It also uses Pause rate control of links to prevent frame drops. The "PRC_only" scenario utilizes the L2CI Protocol (Method 4 above) and path rate control. The "PRC_ECN" scenario adds forward ECN marking of IP packets at the layer 2 ingresses. The test simulations utilized switch buffers sized at 64KB per port. They utilized a USED_PORTS mode, which scales the total switch buffer size to the number of connected ports on the switch (e.g. 4 X 64K for a switch with 4 connected ports).
8. Simulation Results Figures 5 and 6 compare the database access throughput
and response times for each of the 5 scenarios. For the "RED_only" scenario, a total of 42 of the 48 DB Access
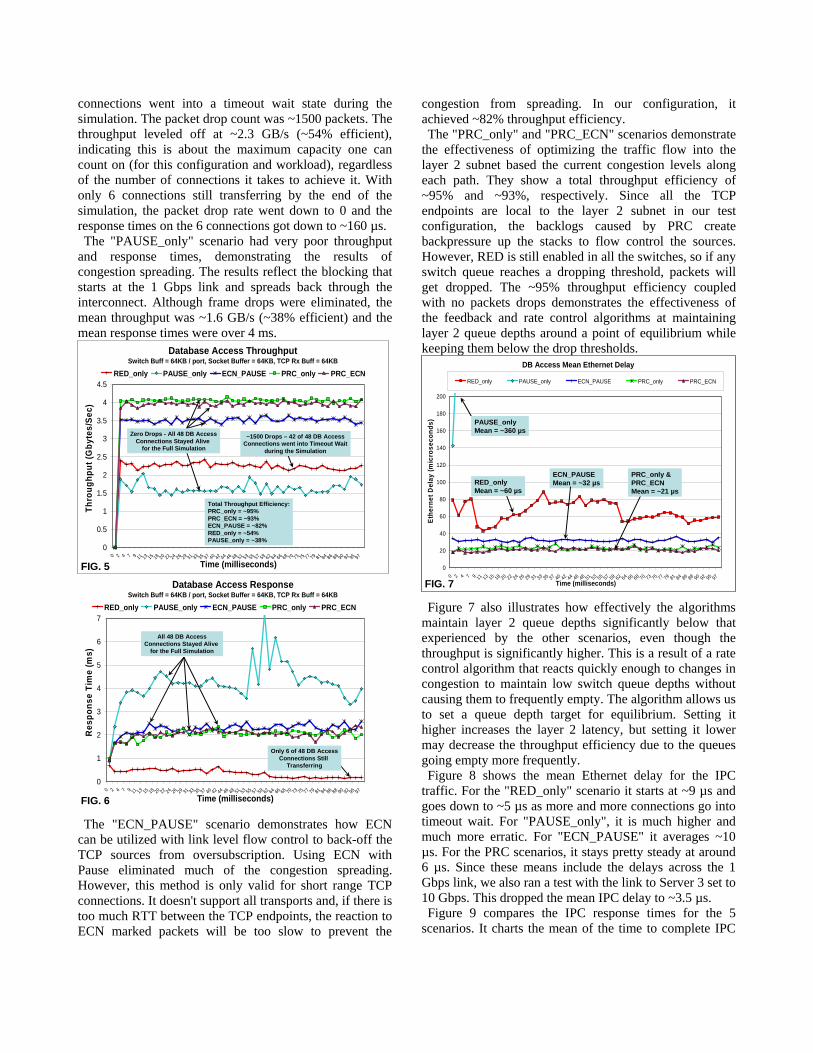
connections went into a timeout wait state during the simulation. The packet drop count was ~1500 packets. The throughput leveled off at ~2.3 GB/s (~54% efficient), indicating this is about the maximum capacity one can count on (for this configuration and workload), regardless of the number of connections it takes to achieve it. With only 6 connections still transferring by the end of the simulation, the packet drop rate went down to 0 and the response times on the 6 connections got down to ~160 µs. The "PAUSE_only" scenario had very poor throughput
and response times, demonstrating the results of congestion spreading. The results reflect the blocking that starts at the 1 Gbps link and spreads back through the interconnect. Although frame drops were eliminated, the mean throughput was ~1.6 GB/s (~38% efficient) and the mean response times were over 4 ms.
Database Access ThroughputSwitch Buff = 64KB / port, Socket Buffer = 64KB, TCP Rx Buff = 64KB
0
0.5
1
1.5
2
2.5
3
3.5
4
4.5
0 2 4 7 9 11 13 15 18 20 22 24 26 29 31 33 35 37 40 42 44 46 48 51 53 55 57 59 62 64 66 68 70 73 75 77 79 81 84 86 88 90 92 95 97
Time (milliseconds)
Thro
ughp
ut (G
byte
s/Se
c)
RED_only PAUSE_only ECN_PAUSE PRC_only PRC_ECN
Zero Drops - All 48 DB AccessConnections Stayed Alive
for the Full Simulation
~1500 Drops – 42 of 48 DB AccessConnections went into Timeout Wait
during the Simulation
Total Throughput Efficiency:PRC_only = ~95%PRC_ECN = ~93%ECN_PAUSE = ~82%RED_only = ~54%PAUSE_only = ~38%
FIG. 5Database Access Response
Switch Buff = 64KB / port, Socket Buffer = 64KB, TCP Rx Buff = 64KB
0
1
2
3
4
5
6
7
0 2 4 7 9 11 13 15 18 20 22 24 26 29 31 33 35 37 40 42 44 46 48 51 53 55 57 59 62 64 66 68 70 73 75 77 79 81 84 86 88 90 92 95 97
Time (milliseconds)
Res
pons
e Ti
me
(ms)
RED_only PAUSE_only ECN_PAUSE PRC_only PRC_ECN
Only 6 of 48 DB AccessConnections Still
Transferring
All 48 DB AccessConnections Stayed Alive
for the Full Simulation
FIG. 6 The "ECN_PAUSE" scenario demonstrates how ECN
can be utilized with link level flow control to back-off the TCP sources from oversubscription. Using ECN with Pause eliminated much of the congestion spreading. However, this method is only valid for short range TCP connections. It doesn't support all transports and, if there is too much RTT between the TCP endpoints, the reaction to ECN marked packets will be too slow to prevent the
congestion from spreading. In our configuration, it achieved ~82% throughput efficiency. The "PRC_only" and "PRC_ECN" scenarios demonstrate
the effectiveness of optimizing the traffic flow into the layer 2 subnet based the current congestion levels along each path. They show a total throughput efficiency of ~95% and ~93%, respectively. Since all the TCP endpoints are local to the layer 2 subnet in our test configuration, the backlogs caused by PRC create backpressure up the stacks to flow control the sources. However, RED is still enabled in all the switches, so if any switch queue reaches a dropping threshold, packets will get dropped. The ~95% throughput efficiency coupled with no packets drops demonstrates the effectiveness of the feedback and rate control algorithms at maintaining layer 2 queue depths around a point of equilibrium while keeping them below the drop thresholds.
DB Access Mean Ethernet Delay
0
20
40
60
80
100
120
140
160
180
200
0 2 4 7 9 11 13 15 18 20 22 24 26 29 31 33 35 37 40 42 44 46 48 51 53 55 57 59 62 64 66 68 70 73 75 77 79 81 84 86 88 90 92 95 97Time (milliseconds)
Ethe
rnet
Del
ay (m
icro
seco
nds)
RED_only PAUSE_only ECN_PAUSE PRC_only PRC_ECN
PAUSE_onlyMean = ~360 µs
ECN_PAUSEMean = ~32 µsRED_only
Mean = ~60 µs
PRC_only &PRC_ECNMean = ~21 µs
FIG. 7
Figure 7 also illustrates how effectively the algorithms maintain layer 2 queue depths significantly below that experienced by the other scenarios, even though the throughput is significantly higher. This is a result of a rate control algorithm that reacts quickly enough to changes in congestion to maintain low switch queue depths without causing them to frequently empty. The algorithm allows us to set a queue depth target for equilibrium. Setting it higher increases the layer 2 latency, but setting it lower may decrease the throughput efficiency due to the queues going empty more frequently. Figure 8 shows the mean Ethernet delay for the IPC
traffic. For the "RED_only" scenario it starts at ~9 µs and goes down to ~5 µs as more and more connections go into timeout wait. For "PAUSE_only", it is much higher and much more erratic. For "ECN_PAUSE" it averages ~10 µs. For the PRC scenarios, it stays pretty steady at around 6 µs. Since these means include the delays across the 1 Gbps link, we also ran a test with the link to Server 3 set to 10 Gbps. This dropped the mean IPC delay to ~3.5 µs. Figure 9 compares the IPC response times for the 5
scenarios. It charts the mean of the time to complete IPC
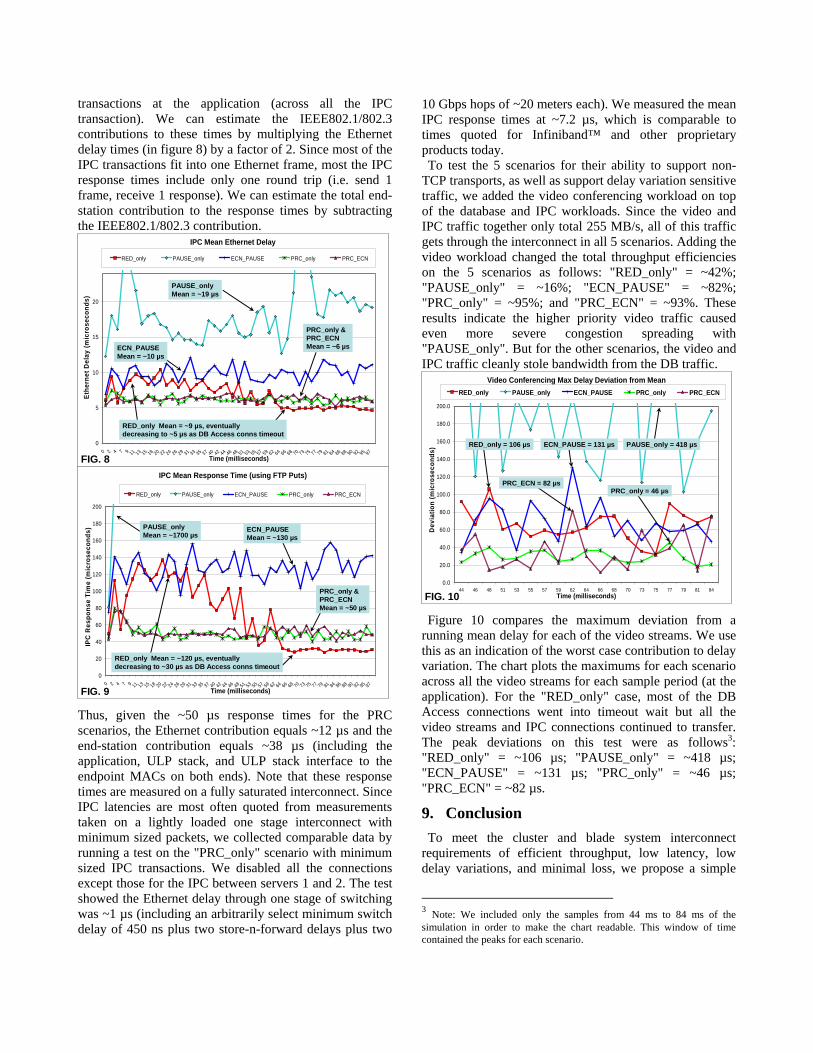
transactions at the application (across all the IPC transaction). We can estimate the IEEE802.1/802.3 contributions to these times by multiplying the Ethernet delay times (in figure 8) by a factor of 2. Since most of the IPC transactions fit into one Ethernet frame, most the IPC response times include only one round trip (i.e. send 1 frame, receive 1 response). We can estimate the total end-station contribution to the response times by subtracting the IEEE802.1/802.3 contribution.
IPC Mean Ethernet Delay
0
5
10
15
20
0 2 4 7 9 11 13 15 18 20 22 24 26 29 31 33 35 37 40 42 44 46 48 51 53 55 57 59 62 64 66 68 70 73 75 77 79 81 84 86 88 90 92 95 97Time (milliseconds)
Ethe
rnet
Del
ay (m
icro
seco
nds)
RED_only PAUSE_only ECN_PAUSE PRC_only PRC_ECN
FIG. 8
PAUSE_onlyMean = ~19 µs
ECN_PAUSEMean = ~10 µs
PRC_only &PRC_ECNMean = ~6 µs
RED_only Mean = ~9 µs, eventuallydecreasing to ~5 µs as DB Access conns timeout
IPC Mean Response Time (using FTP Puts)
0
20
40
60
80
100
120
140
160
180
200
0 2 4 7 9 11 13 15 18 20 22 24 26 29 31 33 35 37 40 42 44 46 48 51 53 55 57 59 62 64 66 68 70 73 75 77 79 81 84 86 88 90 92 95 97Time (milliseconds)
IPC
Res
pons
e Ti
me
(mic
rose
cond
s)
RED_only PAUSE_only ECN_PAUSE PRC_only PRC_ECN
FIG. 9
RED_only Mean = ~120 µs, eventuallydecreasing to ~30 µs as DB Access conns timeout
PRC_only &PRC_ECNMean = ~50 µs
PAUSE_onlyMean = ~1700 µs
ECN_PAUSEMean = ~130 µs
Thus, given the ~50 µs response times for the PRC scenarios, the Ethernet contribution equals ~12 µs and the end-station contribution equals ~38 µs (including the application, ULP stack, and ULP stack interface to the endpoint MACs on both ends). Note that these response times are measured on a fully saturated interconnect. Since IPC latencies are most often quoted from measurements taken on a lightly loaded one stage interconnect with minimum sized packets, we collected comparable data by running a test on the "PRC_only" scenario with minimum sized IPC transactions. We disabled all the connections except those for the IPC between servers 1 and 2. The test showed the Ethernet delay through one stage of switching was ~1 µs (including an arbitrarily select minimum switch delay of 450 ns plus two store-n-forward delays plus two
10 Gbps hops of ~20 meters each). We measured the mean IPC response times at ~7.2 µs, which is comparable to times quoted for Infiniband™ and other proprietary products today. To test the 5 scenarios for their ability to support non-
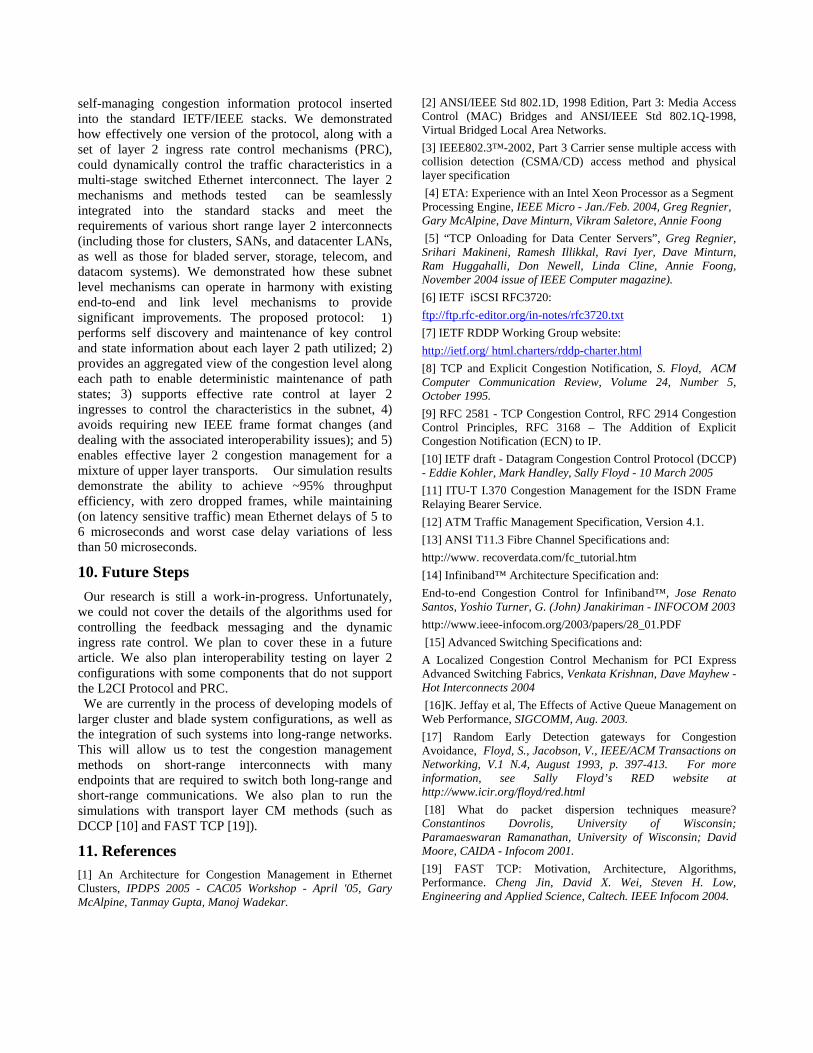
TCP transports, as well as support delay variation sensitive traffic, we added the video conferencing workload on top of the database and IPC workloads. Since the video and IPC traffic together only total 255 MB/s, all of this traffic gets through the interconnect in all 5 scenarios. Adding the video workload changed the total throughput efficiencies on the 5 scenarios as follows: "RED_only" = ~42%; "PAUSE_only" = ~16%; "ECN_PAUSE" = ~82%; "PRC_only" = ~95%; and "PRC_ECN" = ~93%. These results indicate the higher priority video traffic caused even more severe congestion spreading with "PAUSE_only". But for the other scenarios, the video and IPC traffic cleanly stole bandwidth from the DB traffic.
Video Conferencing Max Delay Deviation from Mean
0.0
20.0
40.0
60.0
80.0
100.0
120.0
140.0
160.0
180.0
200.0
44 46 48 51 53 55 57 59 62 64 66 68 70 73 75 77 79 81 84Time (milliseconds)
Dev
iatio
n (m
icro
seco
nds)
RED_only PAUSE_only ECN_PAUSE PRC_only PRC_ECN
FIG. 10
PAUSE_only = 418 µsRED_only = 106 µs ECN_PAUSE = 131 µs
PRC_ECN = 82 µsPRC_only = 46 µs
Figure 10 compares the maximum deviation from a running mean delay for each of the video streams. We use this as an indication of the worst case contribution to delay variation. The chart plots the maximums for each scenario across all the video streams for each sample period (at the application). For the "RED_only" case, most of the DB Access connections went into timeout wait but all the video streams and IPC connections continued to transfer. The peak deviations on this test were as follows3: "RED_only" = ~106 µs; "PAUSE_only" = ~418 µs; "ECN_PAUSE" = ~131 µs; "PRC_only" = ~46 µs; "PRC_ECN" = ~82 µs.
9. Conclusion To meet the cluster and blade system interconnect
requirements of efficient throughput, low latency, low delay variations, and minimal loss, we propose a simple
3 Note: We included only the samples from 44 ms to 84 ms of the simulation in order to make the chart readable. This window of time contained the peaks for each scenario.
self-managing congestion information protocol inserted into the standard IETF/IEEE stacks. We demonstrated how effectively one version of the protocol, along with a set of layer 2 ingress rate control mechanisms (PRC), could dynamically control the traffic characteristics in a multi-stage switched Ethernet interconnect. The layer 2 mechanisms and methods tested can be seamlessly integrated into the standard stacks and meet the requirements of various short range layer 2 interconnects (including those for clusters, SANs, and datacenter LANs, as well as those for bladed server, storage, telecom, and datacom systems). We demonstrated how these subnet level mechanisms can operate in harmony with existing end-to-end and link level mechanisms to provide significant improvements. The proposed protocol: 1) performs self discovery and maintenance of key control and state information about each layer 2 path utilized; 2) provides an aggregated view of the congestion level along each path to enable deterministic maintenance of path states; 3) supports effective rate control at layer 2 ingresses to control the characteristics in the subnet, 4) avoids requiring new IEEE frame format changes (and dealing with the associated interoperability issues); and 5) enables effective layer 2 congestion management for a mixture of upper layer transports. Our simulation results demonstrate the ability to achieve ~95% throughput efficiency, with zero dropped frames, while maintaining (on latency sensitive traffic) mean Ethernet delays of 5 to 6 microseconds and worst case delay variations of less than 50 microseconds.
10. Future Steps Our research is still a work-in-progress. Unfortunately,
we could not cover the details of the algorithms used for controlling the feedback messaging and the dynamic ingress rate control. We plan to cover these in a future article. We also plan interoperability testing on layer 2 configurations with some components that do not support the L2CI Protocol and PRC. We are currently in the process of developing models of
larger cluster and blade system configurations, as well as the integration of such systems into long-range networks. This will allow us to test the congestion management methods on short-range interconnects with many endpoints that are required to switch both long-range and short-range communications. We also plan to run the simulations with transport layer CM methods (such as DCCP [10] and FAST TCP [19]).
11. References [1] An Architecture for Congestion Management in Ethernet Clusters, IPDPS 2005 - CAC05 Workshop - April '05, Gary McAlpine, Tanmay Gupta, Manoj Wadekar.
[2] ANSI/IEEE Std 802.1D, 1998 Edition, Part 3: Media Access Control (MAC) Bridges and ANSI/IEEE Std 802.1Q-1998, Virtual Bridged Local Area Networks. [3] IEEE802.3™-2002, Part 3 Carrier sense multiple access with collision detection (CSMA/CD) access method and physical layer specification [4] ETA: Experience with an Intel Xeon Processor as a Segment Processing Engine, IEEE Micro - Jan./Feb. 2004, Greg Regnier, Gary McAlpine, Dave Minturn, Vikram Saletore, Annie Foong [5] “TCP Onloading for Data Center Servers”, Greg Regnier, Srihari Makineni, Ramesh Illikkal, Ravi Iyer, Dave Minturn, Ram Huggahalli, Don Newell, Linda Cline, Annie Foong, November 2004 issue of IEEE Computer magazine). [6] IETF iSCSI RFC3720: ftp://ftp.rfc-editor.org/in-notes/rfc3720.txt [7] IETF RDDP Working Group website: http://ietf.org/ html.charters/rddp-charter.html [8] TCP and Explicit Congestion Notification, S. Floyd, ACM Computer Communication Review, Volume 24, Number 5, October 1995. [9] RFC 2581 - TCP Congestion Control, RFC 2914 Congestion Control Principles, RFC 3168 – The Addition of Explicit Congestion Notification (ECN) to IP. [10] IETF draft - Datagram Congestion Control Protocol (DCCP) - Eddie Kohler, Mark Handley, Sally Floyd - 10 March 2005 [11] ITU-T I.370 Congestion Management for the ISDN Frame Relaying Bearer Service. [12] ATM Traffic Management Specification, Version 4.1. [13] ANSI T11.3 Fibre Channel Specifications and: http://www. recoverdata.com/fc_tutorial.htm [14] Infiniband™ Architecture Specification and: End-to-end Congestion Control for Infiniband™, Jose Renato Santos, Yoshio Turner, G. (John) Janakiriman - INFOCOM 2003 http://www.ieee-infocom.org/2003/papers/28_01.PDF [15] Advanced Switching Specifications and: A Localized Congestion Control Mechanism for PCI Express Advanced Switching Fabrics, Venkata Krishnan, Dave Mayhew - Hot Interconnects 2004 [16]K. Jeffay et al, The Effects of Active Queue Management on Web Performance, SIGCOMM, Aug. 2003. [17] Random Early Detection gateways for Congestion Avoidance, Floyd, S., Jacobson, V., IEEE/ACM Transactions on Networking, V.1 N.4, August 1993, p. 397-413. For more information, see Sally Floyd’s RED website at http://www.icir.org/floyd/red.html [18] What do packet dispersion techniques measure? Constantinos Dovrolis, University of Wisconsin; Paramaeswaran Ramanathan, University of Wisconsin; David Moore, CAIDA - Infocom 2001. [19] FAST TCP: Motivation, Architecture, Algorithms, Performance. Cheng Jin, David X. Wei, Steven H. Low, Engineering and Applied Science, Caltech. IEEE Infocom 2004.