Conforming Tax Avoidance and Capital Market Pressure Brad ...
60
Conforming Tax Avoidance and Capital Market Pressure Brad Badertscher University of Notre Dame Sharon Katz Columbia University Sonja Rego* Deloitte Foundation Accounting Faculty Fellow Indiana University Ryan Wilson University of Oregon October 2016 ABSTRACT: In this study we develop a measure of corporate tax avoidance that reduces both financial and taxable income, which we refer to as “book-tax conforming” tax avoidance. We use LIFO/FIFO inventory method conversions, as well as samples of private and public firms, to validate our measure of conforming tax avoidance. We then investigate the prevalence of conforming tax avoidance within a sample of public firms. Results from the validation tests indicate that our measure of conforming tax avoidance successfully captures book-tax conforming transactions and thus, variation in conforming tax avoidance at private and public firms. Consistent with expectations, we also find that the extent to which public firms engage in conforming tax avoidance varies systematically with the capital market pressures to which they are subject. For example, public firms that lack analyst following, do not issue equity securities, report lower sales growth, or smaller discretionary accruals engage in relatively more conforming tax avoidance and less nonconforming tax avoidance. Our study develops a new measure of conforming tax avoidance that should be useful in future research and it provides new insights on the extent to which public firms are willing to reduce income tax liabilities at the expense of reporting lower financial income. * Corresponding author: Sonja Rego, Kelley School of Business, Indiana University, 1309 E 10 th Street, Bloomington, IN 47405. Email: [email protected]. Phone: (812) 855-6356. All of the authors are grateful for helpful comments from T. J. Atwood, Erik Beardsley, John Campbell, Alex Edwards, Dave Guenther, Michelle Hutchens, Brad Lindsey, Sean McGuire, Ed Maydew (discussant), Stevie Neuman, Andy Schmidt, Casey Schwab, Terry Shevlin, Bridget Stomberg, Jake Thornock, Erin Towery, and Jaron Wilde, and workshop participants at North Carolina State University, the University of Georgia, the University of Missouri, the University of Illinois Symposium on Tax Research XIV, and the UBCOW conference. Professor Rego appreciates research funding provided by the Deloitte Foundation and the Kelley School of Business.
Transcript of Conforming Tax Avoidance and Capital Market Pressure Brad ...
Conforming Tax Avoidance and Capital Market Pressure
Brad Badertscher University of Notre Dame
Sharon Katz
Columbia University
Sonja Rego* Deloitte Foundation Accounting Faculty Fellow
Indiana University
Ryan Wilson University of Oregon
October 2016 ABSTRACT: In this study we develop a measure of corporate tax avoidance that reduces both financial and taxable income, which we refer to as “book-tax conforming” tax avoidance. We use LIFO/FIFO inventory method conversions, as well as samples of private and public firms, to validate our measure of conforming tax avoidance. We then investigate the prevalence of conforming tax avoidance within a sample of public firms. Results from the validation tests indicate that our measure of conforming tax avoidance successfully captures book-tax conforming transactions and thus, variation in conforming tax avoidance at private and public firms. Consistent with expectations, we also find that the extent to which public firms engage in conforming tax avoidance varies systematically with the capital market pressures to which they are subject. For example, public firms that lack analyst following, do not issue equity securities, report lower sales growth, or smaller discretionary accruals engage in relatively more conforming tax avoidance and less nonconforming tax avoidance. Our study develops a new measure of conforming tax avoidance that should be useful in future research and it provides new insights on the extent to which public firms are willing to reduce income tax liabilities at the expense of reporting lower financial income.
* Corresponding author: Sonja Rego, Kelley School of Business, Indiana University, 1309 E 10th Street, Bloomington, IN 47405. Email: [email protected]. Phone: (812) 855-6356. All of the authors are grateful for helpful comments from T. J. Atwood, Erik Beardsley, John Campbell, Alex Edwards, Dave Guenther, Michelle Hutchens, Brad Lindsey, Sean McGuire, Ed Maydew (discussant), Stevie Neuman, Andy Schmidt, Casey Schwab, Terry Shevlin, Bridget Stomberg, Jake Thornock, Erin Towery, and Jaron Wilde, and workshop participants at North Carolina State University, the University of Georgia, the University of Missouri, the University of Illinois Symposium on Tax Research XIV, and the UBCOW conference. Professor Rego appreciates research funding provided by the Deloitte Foundation and the Kelley School of Business.

1 !
1. Introduction
Accounting research has long examined corporate tax practices, especially income tax
avoidance. Recent studies focus almost exclusively on tax strategies that reduce income tax
liabilities but not financial statement (i.e., book) income, which we refer to as nonconforming tax
avoidance. However, firms can also reduce their income tax liabilities by engaging in
transactions that reduce both book and taxable incomes, which we refer to as conforming tax
avoidance. Although recent accounting research generally disregards the existence of
conforming tax avoidance, older accounting research assumes that in some circumstances (e.g.,
when capital market pressure is low, or in anticipation of large tax rate changes) firms adopt
conforming tax strategies (e.g., Penno and Simon 1986; Guenther 1994; Maydew 1997).1 These
studies examine specific transactions that reduce both book and taxable incomes, such as LIFO
inventory decisions (e.g., Hunt, Moyer, and Shevlin 1996) or gains and losses from sales and
divestitures (e.g., Klassen 1997). However, the accounting literature lacks a broad measure
specifically designed to capture conforming tax avoidance. In this study, we develop such a
measure. We use LIFO / FIFO inventory method conversions, as well as samples of private and
public firms, to validate our measure of conforming tax avoidance. We then investigate the
prevalence of conforming tax avoidance amongst a large sample of public firms.
Following Shackelford and Shevlin’s (2001) call for research on the determinants of tax
aggressiveness, and Weisbach’s (2002) recognition of the undersheltering puzzle,2 accounting
researchers have extensively examined corporate tax avoidance. Most studies measure tax
avoidance with effective tax rate (ETR) or book-tax difference-based measures, and thus by
!!!!!!!!!!!!!!!!!!!!!!!!!!!!!!!!!!!!!!!!!!!!!!!!!!!!!!!!!!!!!1 Guenther (1994) and Maydew (1997) refer to these practices as “tax-induced earnings management.” 2 Weisbach (2002) was among the first to ask why many firms do not fully take advantage of tax planning opportunities, which has since been referred to as the “undersheltering puzzle.”

2 !
construction focus on nonconforming tax strategies. While nonconforming tax avoidance is
without question an important, if not dominant, tax planning strategy, it is not the only tax
strategy. If we are to have a more complete understanding of the determinants of corporate tax
avoidance and the undersheltering puzzle, we require empirical measures of both conforming
and nonconforming tax avoidance.
Understanding the extent to which firms utilize conforming tax strategies is important
because some firms could exhibit high effective tax rates (or low book-tax differences) and thus
cause outsiders to conclude the firms do not avoid income taxes, when in fact they are relying on
previously undetected, book-tax conforming tax strategies. In this case, studies measuring the
extent of tax avoidance in the economy would be understating the amount of income tax
avoidance if they solely rely on nonconforming measures of tax avoidance. Research examining
the cross-sectional determinants of tax avoidance could generate incorrect inferences regarding
the types of firms or managers that avoid income taxes if conforming tax avoidance is not
considered. Further, investors and analysts may incorrectly evaluate the tax planning
effectiveness of these firms and their managers. In sum, our new measure of conforming tax
avoidance, in combination with existing measures of nonconforming tax avoidance, provides a
more complete picture of the tax planning effectiveness of firms and their managers.
Our measure of conforming tax avoidance is based on the ratio of cash taxes paid to
lagged total assets, which captures total tax avoidance, as well as non-tax operating decisions.
Like cash ETR, this ratio is decreasing in tax avoidance. The numerator focuses on actual
income tax payments and excludes tax accruals, which can distort a firm’s current tax expense.3
!!!!!!!!!!!!!!!!!!!!!!!!!!!!!!!!!!!!!!!!!!!!!!!!!!!!!!!!!!!!!3 Prior research indicates managers sometimes use specific tax accruals (e.g., income tax reserves or valuation allowances) to manage earnings and thus meet or beat an earnings benchmark (Dhaliwal, Gleason, and Mills 2004; Schrand and Wong 2003; Krull 2004; Frank and Rego 2006; Cazier, Rego, Tian, and Wilson 2015).

3 !
The denominator is a lagged balance sheet measure that is sensitive to neither current period
transactions (e.g., earnings manipulations) nor to Henry and Sansing’s (2014) observation that
cash ETRs are distorted in the presence of low pretax income.4 However, both conforming and
nonconforming tax strategies reduce the ratio of cash taxes paid to lagged total assets. To
remove the impact of nonconforming tax strategies, we orthogonalize the ratio to book-tax
differences. Specifically, we regress the ratio of cash taxes paid to lagged total assets on positive
and negative book-tax differences, by industry and fiscal year combinations, and extract the
residuals from these regressions as our measure of conforming tax avoidance,
CONFORM_TAX.5,6
We validate CONFORM_TAX as a measure of conforming tax avoidance through a series
of empirical tests. First, we identify samples of firms that convert from the FIFO inventory
method to the LIFO inventory method (and vice versa). Under U.S. federal income tax rules,
firms that adopt LIFO for federal income tax purposes must also adopt that method for financial
accounting purposes. Thus, the conversion from FIFO to LIFO, which represents an increase in
conforming tax avoidance, should be captured by our measure of conforming tax avoidance.7
!!!!!!!!!!!!!!!!!!!!!!!!!!!!!!!!!!!!!!!!!!!!!!!!!!!!!!!!!!!!!4 An alternative denominator for this measure is cash flow from operations. However, conforming tax planning can involve real earnings management activity such as increased spending on administrative costs near year-end. This increased spending would reduce cash tax payments and operating cash flows and would not change the ratio of cash taxes paid to operating cash flows (unless the increased spending dropped the firm into a different tax rate bracket or caused the firm to report a pretax loss). As a result, using cash flow from operations as the scalar would result in a measure of overall tax avoidance that would fail to detect important types of conforming tax avoidance. Nevertheless, we report results of using cash flow from operations as denominator in the robustness section. 5 We note that our measure of conforming tax avoidance is not equivalent to a measure of downward earnings management. Downward earnings management through accruals often results in book-tax differences that would not be reflected in our measure. For example, if a firm over-reserves for bad debts to build cookie jar reserves for future earnings manipulations, this action would reduce GAAP earnings but would also lead to a book-tax difference and not reduce taxable income. 6!We further control for NOLs, changes in NOLs and for a proxy for operating efficiency. In a robustness test we also exclude firm-years with negative cash taxes paid or negative pretax income. !7 This assumption holds provided inventory costs are increasing through time, causing a firm’s income tax deduction for cost of goods sold to be higher, and thus cash taxes paid to be lower under LIFO than under FIFO.
4 !
Results for empirical tests that examine the mean change in CONFORM_TAX from the year prior
to LIFO conversion to the year after LIFO conversion confirm that CONFORM_TAX captures an
increase in book-tax conforming expenditures.
Second, we compare CONFORM_TAX for matched samples of private and public-firm
years. Prior research provides evidence that private firms are more willing to engage in book-tax
conforming tax strategies that reduce both book and taxable incomes than public firms, since
public firms are typically subject to greater capital market pressure and thus prefer to avoid
income taxes through methods that reduce tax but not book income (e.g., Penno and Simon 1986;
Cloyd et al. 1996; Mills and Newberry 2001). We utilize two different types of private firms in
our analyses, including firms with privately-owned equity but publicly-traded debt (“quasi-
private” firms) and also “pure-private” firms, whose debt and equity are both privately-held.8
For each private firm sample, we create a matched, control sample of firms with publicly-traded
equity (“public firms”). Both of our private vs. public firm analyses reveal that private firms
have significantly lower mean and median values of CONFORM_TAX than matched samples of
public firms. Taken together, the results for tests that examine FIFO / LIFO conversions and that
compare CONFORM_TAX at private and public firms consistently indicate that
CONFORM_TAX captures conforming tax avoidance.
Third, we regress CONFORM_TAX on a private firm indicator variable and proxies for
expenses that reduce both book and taxable incomes. These tests not only examine whether
private firms engage in more conforming tax avoidance than similar public firms, but they also
examine which expenses firms incur to reduce their income tax liabilities. The multivariate
!!!!!!!!!!!!!!!!!!!!!!!!!!!!!!!!!!!!!!!!!!!!!!!!!!!!!!!!!!!!!8 The quasi-private sample firms are typically larger than pure-private sample firms. As a result, the quasi-private firms are more similar to public firms with respect to management and organizational structure than the pure-private firms, and thus potentially provide more appropriate private vs. public firm comparisons. We include the pure-private firm analyses for completeness.
5 !
results indicate that private firms use more conforming tax strategies than public firms and that
both types of firms incur a variety of discretionary expenditures (including advertising and
selling, general, and administrative expenses) that reduce their income tax liabilities. In
supplemental tests we further validate our measure of conforming tax avoidance by examining
changes in conforming tax avoidance at firms that transition between public and quasi-private
ownership, and through a simulation analysis.
Our final tests use the new measure of tax avoidance to examine the extent to which
public firms engage in conforming tax avoidance. Recent research relies exclusively on tax
measures that only capture book-tax nonconforming tax avoidance (e.g., ETR or book-tax
difference measures). As a result, we have little knowledge of the extent to which public firms
adopt conforming tax strategies. Prior research asserts firms that are subject to less capital
market pressure are more likely to adopt book-tax conforming tax strategies, as they are less
concerned with the amount of income reported in financial reports (e.g., Penno and Simon 1986;
Cloyd et al. 1996). Thus, we predict public firms that are subject to lower capital market
pressure engage in more conforming tax avoidance and less nonconforming tax avoidance than
other public firms. Our empirical results are consistent with these predictions, where lower
capital market pressure is proxied by a lack of analyst following, no stock issuance in the current
and two subsequent years, lower sales growth, and smaller discretionary accruals. We conclude
that conforming tax avoidance is a significant – albeit overlooked – aspect of corporate tax
strategies at public firms.
Our study makes several contributions to the accounting literature. To our knowledge,
our study is the first to develop and validate a measure of tax avoidance that is specifically
designed to capture only book-tax conforming tax avoidance. This measure will allow

6 !
researchers to consider a broader set of corporate tax strategies than those examined in prior
research. For example, researchers can potentially use this measure to further evaluate the
“undersheltering puzzle.” Perhaps some firms that appear to be undersheltering are simply
utilizing book-tax conforming tax strategies. Increasing our understanding of the extent to which
firms avoid income taxes in a conforming vs. nonconforming manner should also increase our
understanding of how tax avoidance impacts firm value, an issue for which the accounting
literature currently provides mixed evidence. Although we do not tackle these research questions
in this study, we are hopeful that our measure of conforming tax avoidance can be used in future
research to investigate these and other important corporate tax issues.
Lastly, we acknowledge that unlike nonconforming tax avoidance, conforming tax
avoidance is indistinguishable from certain types of non-tax motivated, downward earnings
management. We rely on theory from prior research to identify settings where we would expect
to observe conforming tax avoidance, but we cannot entirely eliminate the possibility that the
documented conforming tax avoidance is a result of downward earnings management that is
motivated by non-tax considerations (e.g., earnings smoothing, big bath, etc.). The remainder of
this study proceeds as follows. Section 2 describes prior research. Section 3 develops our
measure of conforming tax avoidance. Section 4 validates our conforming tax avoidance
measure, while Section 5 examines variation in conforming tax avoidance at public firms.
Robustness tests are described in Section 6. Section 7 concludes.
2. Background and Literature Review
2.1 Extant Measures of Corporate Tax Avoidance

7 !
Although previously described as a measure of corporate “tax burden” (e.g., Callihan
1994), the average effective tax rate (ETR) is one of the first measures of corporate tax
avoidance commonly used in the accounting literature (e.g., Phillips 2003; Rego 2003).9 Recent
research typically calculates the average ETR as the ratio of total tax expense to pretax income,
although other variations of this ratio exist in the literature. Because the numerator is based on a
firm’s taxable income (plus deferred tax expense), while the denominator is based on financial
statement income, the average ETR roughly captures “permanent” differences between book and
taxable incomes. There are many sources of permanent book-tax differences, but most are
related to income taxation (e.g., foreign and state tax rate differentials, tax credits, income from
municipal bonds, structured transactions subject to different book and tax treatment). As a
result, the average ETR is now considered a measure of nonconforming tax avoidance.
Due to flaws in the ability of average ETR to accurately measure nonconforming tax
avoidance, Dyreng, Hanlon, and Maydew (2008) develop an alternative ETR measure, the cash
ETR. Recent research calculates the cash ETR as the ratio of cash taxes paid to adjusted pretax
income, where both the numerator and the denominator are summed over a multi-year time
period – often 3 or 5 years – to smooth out transitory shocks to cash taxes paid and pretax
income. Importantly, the numerator is not affected by tax accruals, such as changes in tax
reserves or the valuation allowance, which can distort the numerator of average ETR as a proxy
for income taxes paid. Cash ETRs also differ from average ETRs because they capture both
temporary and permanent book-tax differences, while average ETRs only capture permanent
differences. Nonetheless, prior research classifies both as measures of nonconforming tax
avoidance.
!!!!!!!!!!!!!!!!!!!!!!!!!!!!!!!!!!!!!!!!!!!!!!!!!!!!!!!!!!!!!9 The average ETR is also referred to as the “GAAP” ETR because firms that are required to file financial statements with the SEC must disclose this measure in the tax footnotes of their financial statements.

8 !
Recent accounting research also employs several book-tax difference-based measures as
proxies for nonconforming tax avoidance. First, total book-tax differences are calculated as the
difference between pretax income and estimated taxable income (e.g., Mills 1998, Desai 2003),
and by construction include both temporary and permanent book-tax differences. Second, some
researchers isolate permanent book-tax differences as a measure of nonconforming tax
avoidance, since anecdotal evidence suggests that many tax planning strategies generate
permanent rather than temporary book-tax differences (e.g., Weisbach 2002; McGill and Outslay
2004). Third, other researchers calculate discretionary permanent book-tax differences, which
exclude permanent differences over which managers have little control (e.g., Frank et al. 2009).
All three of these book-tax difference-based measures capture nonconforming tax strategies.
For several reasons research on corporate tax avoidance focuses on measures that only
capture nonconforming tax strategies. First, as discussed below, public firms generally prefer to
avoid income taxes in ways that reduce taxable income but not book income; that is, they prefer
nonconforming tax strategies. Second, even if researchers would like to examine conforming tax
avoidance, there is no widely-accepted measure of conforming tax avoidance in the accounting
literature. Hanlon and Heitzman (2010) in footnote 49 mention the ratio of cash taxes paid to
cash flow from operations as a potential measure of conforming tax avoidance, but acknowledge
that this measure only captures tax avoidance via tax accruals that reduce cash taxes paid but not
cash flow from operations.10 As a result, it excludes book-tax conforming tax strategies
involving the acceleration of expenses or the deferral of revenue that affect cash flow from
operations. We also note that older accounting studies (discussed below) rely on features unique
!!!!!!!!!!!!!!!!!!!!!!!!!!!!!!!!!!!!!!!!!!!!!!!!!!!!!!!!!!!!!10 In untabulated robustness tests Dyreng, Hanlon, and Maydew (2010) are the first to suggest and use the ratio of cash taxes paid to cash flow from operations as an alternative to average and cash ETRs; however, they do not evaluate the types of tax avoidance this ratio does (or does not) capture. We are not aware of other studies that utilize this measure.

9 !
to their research setting to measure conforming tax avoidance, which they refer to as “tax-
induced earnings management.”
2.2 Research on Book-Tax Conforming Tax Avoidance
There are two streams of research on corporate tax avoidance that are most salient to our
study. First, some prior research examines whether firms engage in tax-motivated earnings
management to take advantage of changes in corporate tax rates. Second, more recent research
examines the incentives for tax avoidance at public and private firms.
2.2.1 Tax-Induced Earnings Management
The Tax Reform Act of 1986 reduced the corporate federal income tax rate from 46
percent in 1986 to 34 percent in 1988. This large tax rate decrease incentivized firms to shift
taxable income and losses from one time period to another. Several studies examine the extent
to which firms engaged in such income shifting behaviors, including Scholes, Wilson, and
Wolfson (1992), Guenther (1994), and Maydew (1997). Although these studies adopt different
research methodologies, they each assume that firms shift income and losses in a book-tax
conforming manner, which we refer to as conforming tax avoidance but they refer to as tax-
induced earnings management.
While Scholes et al. (1992) examine income shifting through gross margins and selling,
general, and administrative expenses, Guenther (1994) utilizes current accruals as his proxy for
tax-motivated income shifting, and Maydew (1997) evaluates income shifting through both
recurring (i.e., gross margin) and nonrecurring (i.e., one-time asset dispositions) revenues and
expenses.11 Consistent with the intuition in these studies, we assume that conforming tax
!!!!!!!!!!!!!!!!!!!!!!!!!!!!!!!!!!!!!!!!!!!!!!!!!!!!!!!!!!!!!11 Other studies also assume that firms avoid income taxes in a book-tax conforming manner; however, many of these studies focus on specific types of transactions, such as inventory choice (e.g., Dopuch and Pincus 1988; Hunt, Moyer, and Shevlin 1996), compensation decisions (Matsunaga, Shevlin, and Shores 1992), or asset dispositions

10 !
avoidance can be achieved through transactions that affect gross margin, selling, general, and
administrative expenses, or gains and losses on one-time asset dispositions.12 However, we
develop a measure that is designed to capture all conforming tax avoidance, while those studies
focus on predictable changes in specific revenues or expenditures.
2.2.2 Tax Avoidance at Public and Private Firms
Accounting research has long recognized that public and private firms are subject to
different non-tax costs, and thus face different tax and non-tax tradeoffs. For example, Penno
and Simon (1986) assert that because public firms depend on external capital markets for equity
financing they are more likely than private firms to use income-increasing accounting methods.
They also explain that relative to private firms, the greater separation of ownership and control at
public firms causes the compensation contracts for public firm managers to rely more heavily on
accounting numbers and thus may further influence the accounting choices of managers at public
firms. The questionnaire results in Penno and Simon (1986) imply that managers at private firms
are more likely to adopt book-tax conforming tax strategies than managers at public firms.
Cloyd, Pratt, and Stock (1996) survey financial executives at public and private firms and
confirm that public firm managers are less likely to select conforming tax strategies than private
firm managers. Mills and Newberry (2001) extend Cloyd et al. (1996) by investigating the book-
tax differences of public and private firms. Using firm-level tax return data, Mills and Newberry
(2001) is the first study to provide large sample evidence that public firms report larger book-tax
differences than private firms, consistent with public firms facing greater non-tax (i.e., financial
reporting) costs. Taken together, the results in these studies indicate that public firms are more
!!!!!!!!!!!!!!!!!!!!!!!!!!!!!!!!!!!!!!!!!!!!!!!!!!!!!!!!!!!!!(Klassen 1997). Because we are interested in a broad measure of conforming tax avoidance, we focus our main discussion on prior studies that examine broad-based, tax-motivated income shifting. 12 See Appendix B for specific examples of book-tax conforming tax planning strategies.
11 !
likely than private firms to adopt nonconforming tax strategies. They also imply that private
firms are more likely to adopt conforming tax strategies.13 However, prior research does not
examine cross-sectional variation in conforming tax avoidance amongst public firms, since an
aggregate measure of conforming tax avoidance has not been available.
3. Developing a New Measure of Conforming Tax Avoidance
3.1 Research Design: Measuring Conforming Tax Avoidance
We base our measure of conforming tax avoidance on the ratio of cash taxes paid to
lagged total assets. Tax avoidance strategies that reduce income tax payments to tax authorities
reduce the numerator of this ratio. For example, a firm that accelerates expense recognition (e.g.,
advertising or selling, general, and administrative expenditures) from January 2015 to December
2014 will pay less income tax on its 2014 U.S. income tax return than it otherwise would have.
Moreover, the numerator of the ratio is not distorted by tax accruals that affect financial
accounting income but not income tax payments, including changes in tax reserves, the valuation
allowance, and deferred income taxes on foreign earnings not designated as permanently
reinvested abroad. The denominator of the ratio is a lagged balance sheet measure that is
sensitive to neither current period transactions (e.g., earnings manipulations) nor to Henry and
Sansing’s (2014) observations that cash ETRs are distorted in the presence of low pretax income
and are sensitive to variation in pretax profitability. Using lagged total assets as the scaler
!!!!!!!!!!!!!!!!!!!!!!!!!!!!!!!!!!!!!!!!!!!!!!!!!!!!!!!!!!!!!13 In related research, Beatty and Harris (1998) provide some evidence that private banks avoid more income taxes than public banks, and Mikhail (1999) utilizes marginal tax rate measures and finds that private insurance companies engage in more tax planning than public insurance companies. However, these studies examine specific types of transactions and are limited to regulated industries such as banks and insurance companies.

12 !
implicitly assumes, holding all else equal (including tax avoidance), that firms of similar asset
size pay similar amounts of income taxes.14
However, both conforming and nonconforming tax strategies reduce the ratio of cash
taxes paid to lagged total assets. For example, given a corporate tax rate of 35 percent, the tax
benefit from selling an asset that generates a $100 loss that reduces both book and taxable
incomes is equal to the tax benefit from claiming $100 of bonus depreciation that reduces taxable
income but not book income. Both tax benefits would reduce the ratio of cash taxes paid to
lagged total assets; however, while the former would be considered conforming tax avoidance,
the latter would be considered nonconforming tax avoidance. Thus, we require a means of
eliminating nonconforming tax avoidance from the ratio of cash taxes paid to lagged total assets.
To remove the impact of nonconforming tax strategies, we orthogonalize the ratio to both
positive and negative book-tax differences. Specifically, we regress the ratio of cash taxes paid
to lagged total assets (TAXESPAID_TO_ASSETS) on total book-tax differences (BTD), an
indicator variable (NEG) set to one for observations with negative book-tax differences (and zero
otherwise), the interaction of BTD and NEG, and other control variables discussed below. We
use ordinary least squares regression to estimate equation (1) below by industry (3-digit NAICS
code) and fiscal year combinations:
TAXESPAID_TO_ASSETSit = β0 + β1BTDit + β2NEGit + β3BTDit × NEGit + β4NOLit
+ β5ΔNOLit + β6 SALES_TO_NOA + εit (1)
!!!!!!!!!!!!!!!!!!!!!!!!!!!!!!!!!!!!!!!!!!!!!!!!!!!!!!!!!!!!!14 Obviously, firms of similar asset size do not necessarily pay similar amounts of income tax, due to variation in industry membership, operational structure, and other non-tax operating decisions. We control for these other sources of variation in the ratio of cash taxes paid to lagged total assets in our research design discussed below.
13 !
In most analyses, we estimate equation (1) using Compustat data for all public and quasi-private
firm-year observations for which we have requisite data. See Appendix A for detailed variable
definitions.15
We interact the indicator variable NEG with BTD to allow for the fact that positive and
negative book-tax differences could have a differential effect on cash taxes paid. While positive
book-tax differences are likely a result of nonconforming tax planning, negative book-tax
differences may reflect other factors such as changes in the valuation allowance. We also control
for the level of net operating loss carryforwards (NOL) and changes in NOLs (ΔNOL) because
the utilization of NOLs will reduce cash taxes paid, but is not indicative of conforming tax
planning. Lastly, non-tax operating decisions could affect our measure of conforming tax
avoidance. For example, a manager may decide to pay higher wages than other firms in the
same industry because s/he wants to attract and retain loyal employees. These higher wages
would reduce both book and taxable income and thus our measure of conforming tax avoidance.
To control for the impact of non-tax operating decisions, we also include the ratio of net sales to
net operating assets (SALES_TO_NOA) in equation (1). This ratio captures the amount of net
sales generated by a firm’s net operating assets, and thus is one measure of operating efficiency.
Presumably, if a firm is spending more on employee wages, advertising, or R&D for strategic
rather than tax reasons, then these firms should exhibit different rates of operating efficiency
than other firms. By controlling for operating efficiency in equation (1), we reduce the
measurement error in our proxy for conforming tax avoidance.
!!!!!!!!!!!!!!!!!!!!!!!!!!!!!!!!!!!!!!!!!!!!!!!!!!!!!!!!!!!!!15 In tests that compare pure-private and public firms, we calculate BTD differently for pure-private firms because Sageworks does not provide all the tax data items necessary to compute BTD as shown in Appendix A. Specifically, in tests that compare pure-private and public firms, we calculate BTD for pure-private firms as [pretax income – (cash taxes paid / 0.35)]. We then re-estimate equation (1) based on a sample that includes public, quasi-private, and pure-private firm-year observations.
14 !
We extract the residual (ε) from equation (1) as our measure of conforming tax
avoidance, CONFORM_TAX. The residual captures deviations in TAXESPAID_TO_ASSETS
from the expected value of that ratio, for that industry-year combination. Thus, our estimation
method assumes the average firm in the same industry and fiscal year is the appropriate
benchmark for measuring an individual firm’s relative amount of conforming tax avoidance.
Based on the properties of ordinary least squares regression, CONFORM_TAX is not correlated
with BTD, negative BTD, NOL, ΔNOL, or SALES_TO_NOA and in fact, is orthogonal to
nonconforming tax avoidance and non-tax operating decisions (as measured by
SALES_TO_NOA). As a result, CONFORM_TAX captures conforming tax avoidance that
reduces a firm’s scaled cash taxes paid below the average scaled cash taxes paid for a specific
industry and fiscal year combination. However, it also captures measurement error to the extent
that the variables in equation (1) do not adequately measure the underlying constructs of
nonconforming tax avoidance and non-tax operating decisions, respectively.
3.2 Discussion of Results from the Estimation of CONFORM_TAX
We estimate equation (1) based on all public and quasi-private firm-year observations
in Compustat with requisite data available for fiscal years 1990 through 2010, excluding
observations for financial institutions or firms in regulated industries (SIC codes 6000–6999
and 4800–4900). Our data requirements for equation (1) generate a sample of 55,802 public
firm-year observations. To identify quasi-private firms, we follow Katz (2009) and Givoly et
al. (2010) and select all firm-year observations on Compustat in fiscal years 1990 through
2010 that satisfy the criteria: (1) the firm’s stock price at fiscal year-end is unavailable (i.e.,
SEC filings are available, but not year-end stock price); (2) the firm has total debt as well as
total annual revenues exceeding $1 million; (3) the firm is a U.S. domiciled company; (4) the
15 !
firm is not a subsidiary of another public firm; and (5) the firm is not a financial institution or
in a regulated industry (SIC codes 6000–6999 and 4800–4900). To ensure our sample of
quasi-private firms includes only private firms with public debt, we remove firms with only
historical prospectus information, firms with public equity, firms lacking required financial
statement data, firms involved in bankruptcy proceedings, and foreign-domiciled firms.
These procedures generate a sample of 2,796 quasi-private firm-years with public debt.
Taken together, we have 58,598 public and quasi-private firm-year observations from fiscal
years 1990 through 2010 to estimate equation (1).
Table 1, Panel A provides descriptive statistics for the variables included in equation (1),
while Panel B provides descriptive statistics for the 1,249 regressions (by industry and fiscal year
combinations) that generate firm-year values of CONFORM_TAX. Panel A shows that the mean
(median) value of cash taxes paid to total assets (TAXESPAID_TO_ASSET) is 0.031 percent
(0.019 percent), while the mean (median) values of BTD are 0.012 (0.012), NEG are 0.371
(0.000), NOL are 0.292 (0.000), ΔΝΟL are 0.002 (0.000), and SALES_TO_NOA are 0.024
(0.018).
The statistics in Table 1, Panel B indicate the mean coefficient on BTD is positive, but the
median is negative. The coefficient on BTD is only positive in 36.15 percent of the regressions.
This result is somewhat unexpected and suggests that on average, more positive book-tax
differences are associated with higher ratios of cash tax payments to lagged total assets
(TAXESPAID_TO_ASSET). However, the mean and median coefficients on negative book-tax
differences (BTD×NEG) are both positive, consistent with more negative book-tax differences
being associated with lower ratios of cash taxes paid to lagged total assets. The mean coefficient
on NOL is positive, but the median is negative and near zero. The mean coefficient on ΔNOL is
16 !
fairly large and negative (-0.372), but the median coefficient on positive and near zero. Finally,
the mean and median coefficients on SALES_TO_NOA are fairly large in magnitude (0.455 and
0.207, respectively), consistent with non-tax operating decisions having a significant impact on
the cash tax payments. The mean (median) adjusted R-squared is 32 percent (26.7 percent),
which suggests that the variables in equation (1) jointly explain some of the variation in
TAXESPAID_TO_ASSET for most industry-year combinations, but much variation in this ratio
remains unexplained. By construction, the mean value of CONFORM_TAX is 0 for the sample
of public and quasi-private firm-years used to estimate CONFORM_TAX.
[INSERT TABLE 1 HERE]
4. Validating CONFORM_TAX as a New Measure of Conforming Tax Avoidance
4.1 CONFORM_TAX before and after FIFO / LIFO Inventory Method Conversions
We validate our measure of conforming tax avoidance through a series of empirical tests.
In our first validation test, we identify firms that convert from the first-in-first-out (FIFO)
inventory method to the last-in-first-out (LIFO) inventory method (or vice versa) on Compustat.
We then compare the mean and median values of CONFORM_TAX in the years before and after
a FIFO to LIFO (or LIFO to FIFO) conversion. Under U.S. federal income tax rules, firms that
adopt the LIFO inventory method must also use that method for financial reporting purposes.
Thus, we expect firms that convert from one method to the other to exhibit greater book-tax
conformity under LIFO than under FIFO, and thus to exhibit lower values of CONFORM_TAX
in LIFO years compared to FIFO years (provided inventory costs are increasing through time).16
!!!!!!!!!!!!!!!!!!!!!!!!!!!!!!!!!!!!!!!!!!!!!!!!!!!!!!!!!!!!!16 Like ETR-based measures of tax avoidance, lower values of CONFORM_TAX indicate greater tax avoidance. Thus, the reader should interpret the results for CONFORM_TAX in the same manner as they would interpret results for ETR-based measures of tax avoidance.

17 !
To identify public firms that convert from the FIFO inventory method to the LIFO
inventory method (and vice versa), we utilize the Compustat inventory valuation method
code (INVALCD) which equals 1 for FIFO and 2 for LIFO. We also require either LIFO or
FIFO to be the primary inventory valuation method. Our sample includes 121 public firms
that transition from LIFO to FIFO and 46 public firms that transition from FIFO to LIFO.
Table 2 and Figure 1 present results for our first set of tests validating CONFORM_TAX
as a measure of conforming tax avoidance. Provided inventory costs are increasing through
time, we expect the inventory costs of LIFO firms to be higher than those for FIFO firms. As a
result, we predict our measure of conforming tax avoidance, CONFORM_TAX will be lower
(higher) in years that firms utilize LIFO (FIFO), due to the larger (smaller) tax deductions for
inventory costs under LIFO (FIFO). By examining the change in CONFORM_TAX for firms
that convert to and from LIFO and FIFO, we hold all else constant except the firms’ change in
inventory method. Figure 1 is a graphical representation of the results shown in Table 2.
[INSERT FIGURE 1 AND TABLE 2 HERE]
Table 2, Panel A presents descriptive statistics for CONFORM_TAX for the subset of 46
firms identified as switching from FIFO to LIFO in year t. Switching from FIFO to LIFO is an
example of firms adopting a book-tax conforming tax strategy. As such, we expect to observe a
decrease in CONFORM_TAX after the conversion. (Recall that CONFORM_TAX is decreasing
in conforming tax avoidance.) Consistent with expectations, the results indicate a significant
decrease [at the (p < 0.10) level] in the mean value of CONFORM_TAX from year t-1 (the final
FIFO year) to year t (the first LIFO year) and a further decrease in year t+1. Panel B presents
descriptive statistics for CONFORM_TAX for the subset of 121 firms that transition from LIFO
to FIFO in year t, and thus experience a decrease in book-tax conformity. As expected, the

18 !
descriptive statistics indicate a significant increase [at the (p < 0.10) level] in mean and median
CONFORM_TAX from year t-1 when firms followed LIFO to years t and t+1 when the firms
convert to FIFO. Overall, we interpret the results in Table 2 as validation that our measure
(CONFORM_TAX) effectively detects changes in the level of conforming tax avoidance.!
4.2 Comparing CONFORM_TAX at Public vs. Private Firms
In our second validation test, we examine whether CONFORM_TAX systematically
differs across matched samples of private and public firms. In these analyses we use two
different samples of private firms, including the quasi-private firms described above and also
a sample of “pure private” firms for fiscal years 2001 through 2010. We obtain the pure-
private firm data from Sageworks Inc., a company that collects private firm data from a large
number of accounting firms and then develops financial analysis tools, primarily for
accounting firms and banks.17 To construct our sample of pure-private companies, we follow
Minnis (2011) and Badertscher, Shroff, and White (2013) and exclude all observations with
data quality issues as well as non-U.S. based companies. Specifically, we delete all firm-
years that fail to satisfy basic accounting identities as well as those with net income (NI),
cash flow from operations (CFO), accruals (ACC), or property, plant, and equipment (PPE)
that are greater than total assets at year-end. We also require firm-years to have assets and
sales greater than $100,000 (Minnis 2011). We remove financial firms (NAICS 52) and
regulated utilities (NAICS 22). Finally, we drop firm-year observations with missing values
for gross fixed assets, total assets, sales, and net income. Applying the above sampling
!!!!!!!!!!!!!!!!!!!!!!!!!!!!!!!!!!!!!!!!!!!!!!!!!!!!!!!!!!!!!17 Sageworks provides data from income statements and balance sheets along with basic demographic information, such as the NAICS industry codes and geographic location. Although firms are anonymous, each firm in the Sageworks database has a unique identifier allowing us to construct a panel dataset.

19 !
restrictions and requiring all observations to be obtained from audited financial statements
generates an initial sample of 15,251 pure-private firm-years.18
Since public, quasi-private, and pure-private firms differ significantly with respect to
average firm size, we match each private firm-year observation to a public firm in the same 3-
digit NAICS industry and fiscal year, with the closest total assets.19 This matching procedure
results in a matched sample of 1,065 pairs of quasi-private and public firm-year observations,
and a matched sample of 1,570 pairs of pure-private and public firm-year observations. We then
test whether the mean and median values of CONFORM_TAX differ across the public and
private firm matched samples. Consistent with assertions in prior research (e.g., Penno and
Simon 1986), we predict that private firms are more likely to use conforming tax strategies and
thus have lower CONFORM_TAX than similar public firms.
We also use these same matched samples of private and public firms to regress our
measure of conforming tax avoidance on a private firm indicator variable, a series of book-tax
conforming expenses through which firms can avoid income taxes, and control variables. The
basic regression model is shown in equation (2) below. We use ordinary least squares regression
to estimate equation (2) and cluster the standard errors by firm.
!!!!!!!!!!!!!!!!!!!!!!!!!!!!!!!!!!!!!!!!!!!!!!!!!!!!!!!!!!!!!18 In the U.S., public and private companies are subject to the same set of GAAP accounting standards. Generally, private companies are not legally obligated to follow GAAP, but they may do so to satisfy lenders, venture capitalists, or other stakeholders. Based on our conversations with Sageworks, our sample of private firms adhere to GAAP-compliant financial statements. 19 In untabulated robustness tests, we also match public and private firms based on additional factors. First, we follow the matching procedure described above but also match firms based on pretax income. Second, we perform a propensity score matching procedure that matches firms based on pretax income and additional factors. In both cases, the results are substantially similar to our tabulated results. We do not match firms based on pretax income in our tabulated analyses because firms that engage in conforming tax avoidance are essentially managing their pretax income downward, and thus, we view matching firms based on pretax income as potentially controlling for the phenomena that CONFORM_TAX is intended to capture.

20 !
CONFORM_TAX = β0 + β1PRIVATE + β2EXPENSES + β3ACQUISITION_D +
β4LOG_ASSETS + ε (2)
We include two control variables in equation (2). First, acquisitions of other firms (or
their assets) likely distort the ratio of cash taxes paid to lagged total assets, since current year
cash tax payments would no longer be linked to prior year total assets. Thus, we include an
indicator variable, ACQUISITIONS_D, which equals one if assets acquired in the current year
are greater than 5 percent of prior year total assets, and zero otherwise. Second, prior research
provides mixed evidence on whether corporate tax avoidance is systematically associated with
firm size (e.g., Zimmerman 1983; Mills, Erickson, and Maydew 1998; Rego 2003). To ensure
that our results are not driven by political costs or opportunities for tax avoidance, we include the
natural log of total assets (LOG_ASSETS) in our regressions.
We also include two different vectors of book-tax conforming expenditures
(EXPENSES), which firms can use to reduce their income tax payments. By construction, higher
values of EXPENSES should be associated with lower CONFORM_TAX, and thus we expect
most of the coefficients on the expense variables to be negative (exceptions are noted below).
To the extent private firms avoid more taxes than public firms in a book-tax conforming manner
that is not captured by EXPENSES, we expect the coefficient on PRIVATE to be negative and
significant.
To identify expenses (EXPENSES) that firms incur to avoid taxes in a book-tax
conforming manner, we rely on our own professional experiences, as well as conversations with
tax partners at large, public accounting firms. Based on these insights, we separately include two
vectors of book-tax conforming expenditures (EXPENSES) in equation (2) above. Appendix B
provides examples of the conforming tax strategies on which we base our first EXPENSE vector,
21 !
which includes the following items: interest expense (INT_EXP), advertising expense
(ADVERT_EXP), R&D expense (R&D_EXP), selling, general, and administrative expenditures
(SGA_EXP), special items (SPEC_ITEMS),20 and a LIFO indicator variable (LIFO_DUMM),
where available. Managers have some discretion over the timing of these expenditures and can
choose to incur them in tax-efficient time periods (e.g., accelerate them to the current tax year or
incur them in high tax rate years), which we refer to as conforming tax avoidance. With two
exceptions, we expect the coefficients on each of the expense variables to be negative. First,
firms can choose to deduct R&D expenditures on their tax returns (a form of conforming tax
avoidance) or to claim R&D tax credits (a form of nonconforming tax avoidance). Thus, it is
unclear whether R&D is associated with conforming tax avoidance at the average firm. Second,
special items include income-increasing and income-decreasing items. While conforming tax
strategies can generate income-decreasing special items, the presence of income-increasing
special items would add noise to the average association between CONFORM_TAX and
SPEC_ITEMS.
One difficulty with the expenses listed above is that we cannot distinguish between non-
discretionary and discretionary (i.e., tax-motivated) expenditures. To this end, we adopt the real
earnings management proxies developed in Roychowdhury (2006). In most studies these proxies
are intended to capture discretionary operating decisions that increase financial statement
income; nonetheless, they also capture discretionary operating decisions that reduce financial
and taxable income, and thus should also capture conforming tax avoidance (i.e., tax-motivated
downward earnings management). We expect our measure of conforming tax avoidance to be
associated with each of the real earnings management proxies to the extent managers use their
!!!!!!!!!!!!!!!!!!!!!!!!!!!!!!!!!!!!!!!!!!!!!!!!!!!!!!!!!!!!!20 Note that we multiple special items (SPEC_ITEMS) by negative one so that larger values are consistent with our other expense variables (e.g., INT_EXP), which are income-decreasing measures.
22 !
discretion over the “real” transactions that underlie each earnings management metric. Thus,
these tests not only serve to validate our measure of conforming tax avoidance, but also shed
light on how managers reduce financial and taxable income in a book-tax conforming manner.
Following the analyses in Roychowdhury (2006), our second vector of book-tax
conforming EXPENSES includes: 1) discretionary changes in cash flow from operations
(DISCR_CFO), which captures the timing of sales through changes in product prices or credit
terms; 2) discretionary changes in production (DISCR_PROD), which captures changes in the
cost of goods sold due to changes in production; and 3) discretionary expenses (DISCR_EXP),
which includes advertising, R&D, and SG&A expenditures.21 We estimate each of these
variables cross-sectionally using a sample that includes all public and private firms with requisite
data. See Appendix A for details. If managers use their discretion over transactions that underlie
these real earnings management variables to reduce a firm’s income tax liabilities (and thus
reduce both financial and taxable income), then we expect the coefficient on DISCR_CFO
(DISCR_PROD and DISCR_EXP) to be positive (negative) and significant.
We separately examine the two vectors of expenses because we consider them substitutes
for each other. While the second (discretionary) expense vector is more similar than the first
(total) expense vector to the construct of interest (i.e., discretionary choices that reduce both
financial and taxable income), it also likely includes measurement error since the discretionary
expense variables are only estimates of deviations from normal expenditures. Thus, we consider
the two expense vectors as alternative proxies for the same underlying construct.
4.3 Results for Conforming Tax Avoidance at Public and Quasi-Private Firms
!!!!!!!!!!!!!!!!!!!!!!!!!!!!!!!!!!!!!!!!!!!!!!!!!!!!!!!!!!!!!21 Essentially, Roychowdhury (2006) estimates normal and abnormal operating activities relative to current and lagged sales and change in sales.

23 !
Table 3 presents descriptive statistics for our comparison of matched samples of quasi-
private and public firm-year observations. With respect to tax characteristics, the quasi-private
firms exhibit significantly lower mean and median TAXESPAID_TO_ASSETS,
CONFORM_TAX, and cash effective tax rates (CASH_ETR). These differences are consistent
with quasi-private firms engaging in more overall, conforming, and nonconforming tax strategies
than similar public firms. However, we view these findings as primarily descriptive as they do
not control for other firm characteristics. We also note that the mean and median CASH_ETR
values are similar to those in prior research (e.g., Dyreng et al. 2008). In terms of more general
non-tax firm characteristics, the descriptive statistics indicate that quasi-private and public firms
are similar in size based on the total assets and net sales statistics, which suggests the matching
procedure was effective. However, the quasi-private firms exhibit significantly lower pre-and
after-tax profit rates (PTROA and ATROA), cash flow from operations (CFO), but higher levels
of long-term debt (LT_DEBT). The last result is not surprising, since many of the quasi-private
firms were taken private by private equity firms.
[INSERT TABLE 3 HERE]
The final set of descriptive statistics in Table 3 examines possible mechanisms for
conforming tax avoidance. Specifically, we test for differences in the level of interest expense,
R&D and SG&A expenditures, advertising expense, and special items across the samples of
quasi-private and public firms. We also test for differences in the use of the LIFO inventory
method and the three proxies for real earnings management. The results of these analyses are
mixed. The quasi-private firms exhibit significantly higher mean and median levels of interest
expense, but lower levels of R&D and SG&A expenditures. There is not a significant difference
in the mean or median level of advertising expenditures, special items, or the LIFO inventory
24 !
method. The mean values for discretionary changes in cash flow from operations (DISCR_CFO)
and discretionary changes in production (DISCR_PROD) differ in the predicted direction
between quasi-private and public firms; however, the results for discretionary expenditures
(DISCR_EXP) are contrary to expectation.22 In sum, the results in Table 3 are consistent with
quasi-private firms engaging in more conforming tax avoidance than similar public firms, which
further validates our conforming tax avoidance measure beyond the FIFO / LIFO analyses in
Table 2. However, Table 3 does not increase our understanding of how the quasi-private firms
achieve lower values of CONFORM_TAX.
Panel A of Table 4 presents the Pearson correlations for the variables of interest in our
comparison of the quasi-private and matched public firms. Consistent with the descriptive
statistics in Table 3, we observe significant and negative Pearson correlations between the
private firm indicator variable (PRIVATE) and both CONFORM_TAX (ρ = -0.285) and
CASH_ETR (ρ = -0.051). Interestingly, we also observe a strong positive correlation between
CONFORM_TAX and CASH ETR (ρ = 0.282). This result suggests that conforming and
nonconforming tax avoidance strategies may not be substitutes. In fact, it suggests the same
firms that engage in significant amounts of conforming tax avoidance also use nonconforming
tax strategies to reduce their income taxes.23 With respect to the correlations between PRIVATE
and specific expense variables, the correlations are generally consistent with the descriptive
statistics in Table 3 (e.g., quasi-private firms report more interest expense but less R&D and
!!!!!!!!!!!!!!!!!!!!!!!!!!!!!!!!!!!!!!!!!!!!!!!!!!!!!!!!!!!!!22 If managers use their discretion over real transactions to decrease financial and taxable income, then we expect lower values of DISCR_CFO and higher values of DISCR_PROD and DISCR_EXP. 23 In untabulated analysis we regress CONFORM_TAX on CASH_ETR while controlling for pretax ROA. The conditional correlation between CONFORM_TAX and CASH_ETR after controlling for pretax profitability is reduced from 0.282 to 0.042. Thus, pretax profitability accounts for the large positive correlation between CONFORM_TAX and CASH_ETR.

25 !
SG&A expenditures). None of the correlations between the expense variables are large enough
to raise concerns for multicollinearity in our regression analyses.
[INSERT TABLE 4 HERE]
Panel B of Table 4 presents the results of our regression analyses examining whether
quasi-private firms engage in more conforming tax avoidance than similar public firms and the
mechanisms through which that avoidance is achieved. Consistent with the descriptive statistics
in Table 3, in column 1 we find the coefficient on PRIVATE is negative and significant (-0.014),
indicating that private firms engage in more conforming tax avoidance even after controlling for
acquisitions, and firm size. In column 2 we add proxies for possible mechanisms for achieving
conforming tax avoidance. The coefficients on INT_EXP, ADV_EXP, and SGA_EXP are
negative and significant, indicating that higher levels of these items are associated with more
conforming tax avoidance.
In column 3 we include the three measures of real earnings management. As expected,
we find a significant and positive coefficient on DISCR_CFO, indicating that decreases in
discretionary cash flow from operations are associated with higher levels of conforming tax
avoidance. Also consistent with expectations, we find significant negative coefficients on both
DISCR_PROD and DISCR_EXP indicating that discretionary changes in production and
discretionary expenditures are both associated with more conforming tax avoidance. We
interpret these results as indicating that managers at sample firms use their discretion over the
real transactions that underlie the real earnings management variables. Overall, the results in
Table 4 provide support for our prediction that private firms engage in more conforming tax
avoidance than similar public firms, and sample firms appear to use special items, advertising,
R&D, and SG&A expenditures to reduce their income taxes in a book-tax conforming manner.
26 !
4.4 Results for Conforming Tax Avoidance at Public and Pure-Private Firms
Table 5 provides descriptive statistics for our comparison of pure-private firms and
matched public firms. Similar to the results for quasi-private and public firms in Table 3, pure-
private firms exhibit significantly lower mean and median TAXESPAID_TO_ASSETS,
CONFORM_TAX, and CASH_ETR than matched public firms. Thus, consistent with Table 3,
these statistics suggest that pure-private firms engage in more overall, conforming, and
nonconforming tax avoidance than public firms. However, as before we view these findings as
primarily descriptive because they do not control for other firm characteristics.
Table 5 also contains descriptive statistics for basic firm characteristics and potential
mechanisms for conforming tax avoidance. Note that Sageworks provides far fewer data items
than Compustat for our sample of pure-private firms. Thus, the analyses in Tables 5 and 6
exclude the R&D, LIFO, SPEC_ITEMS, and ACQUISITION_D variables that are included in
Tables 3 and 4. The mean and median statistics in Table 5 indicate the pure-private and public
firms are similar in size based on total assets (ASSETS), which suggests the matching procedure
was effective. However, the pure-private firms exhibit significantly higher mean and median net
sales (SALES) and SALES_TO_NOA, but lower pre- and after-tax rates of profitability (PTROA
and ATROA) than similar public firms. The results also indicate that pure-private firms report
higher levels of SG&A expenditures (SGA_EXP), greater discretionary changes in production
(DISCR_PROD), but lower discretionary expenses (DISCR_EXP). The last result is contrary to
expectation. In sum, the results in Table 5 are consistent with pure-private firms engaging in
more conforming tax avoidance than similar public firms.
[INSERT TABLE 5 HERE]

27 !
Table 6, Panel A provides the correlation coefficients between the private firm indicator
variable (PRIVATE), CONFORM_TAX, CASH_ETR, and potential mechanisms for conforming
tax avoidance. Similar to Table 4, we find negative correlations between PRIVATE and
CONFORM_TAX (ρ = -0.092) and CASH_ETR (ρ = -0.070), respectively. The results also
indicate that CONFORM_TAX and CASH_ETR are positively correlated (ρ = 0.431) based on
our sample of pure-private and matched public firms.24
[INSERT TABLE 6 HERE]
Panel B presents the results for regression analyses examining whether pure-private firms
engage in more conforming tax avoidance than a matched sample of public firms. Consistent
with the Table 5 descriptive statistics, in column 1 we find the coefficient on PRIVATE is
negative and significant (-0.005), indicating that pure-private firms engage in more conforming
tax avoidance than similar public firms, even after controlling for firm size. In column 2 we add
proxies for possible mechanisms to achieve more conforming tax avoidance. The coefficients on
INT_EXP, ADV_EXP, and SGA_EXP are all negative and significant, consistent with higher
levels of these expenditures being associated with more conforming tax avoidance. Despite the
inclusion of these expense variables, the coefficient on the private firm indicator variable
(PRIVATE) remains negative and highly significant.
In column 3 we include the proxies for real earnings management instead of the expense
variables included in column 2. As expected, we find a significant and positive coefficient on
DISCR_CFO, indicating that decreases in discretionary cash flow from operations are associated
with higher levels of conforming tax avoidance. Also consistent with expectations, we find
!!!!!!!!!!!!!!!!!!!!!!!!!!!!!!!!!!!!!!!!!!!!!!!!!!!!!!!!!!!!!24 In untabulated analysis we regress CONFORM_TAX on CASH_ETR while controlling for pretax ROA. The conditional correlation between CONFORM_TAX and CASH_ETR after controlling for pretax profitability is reduced from 0.431 to 0.034. Thus, pretax profitability accounts for the large positive correlation between CONFORM_TAX and CASH_ETR.

28 !
negative coefficients on DISCR_PROD and DISCR_EXP, consistent with discretionary changes
in production and discretionary expenditures leading to more conforming tax avoidance. We
interpret these results as indicating that managers at sample firms use their discretion over the
real transactions that underlie the real earnings management variables. Taken together, the
results in Tables 2, 4, and 6 indicate that CONFORM_TAX captures conforming tax avoidance
and sample firms appear to rely on real transactions over which they have managerial discretion
to avoid income taxes in a book-tax conforming manner.
5. Examining Variation in Conforming Tax Avoidance at Public Firms
5.1 Hypotheses Development
The results in Tables 2 – 6 consistently indicate that CONFORM_TAX captures
conforming tax avoidance. Thus, we now use that measure to investigate the extent to which
public firms avoid taxes in a book-tax conforming manner. As discussed above, public and
private firms are subject to different capital market pressures, which affect their financial and tax
reporting choices (e.g., Penno and Simon 1986; Cloyd et al. 1996; Mills and Newberry 2001).
Consistent with capital market pressure systematically differing across public and private firms,
we further assert that capital market pressures also vary within samples of publicly-traded firms.
For example, public firms that require external financing are subject to greater capital market
pressure than public firms with sufficient cash on hand to fund operations. We predict that this
variation in capital market pressure amongst public firms should systematically influence the
extent to which public firms engage in book-tax conforming vs. nonconforming tax avoidance.
Specifically, we assert public firms that are subject to greater capital market pressure are less
likely to avoid taxes in a book-tax conforming manner and more likely to avoid taxes in a

29 !
nonconforming manner. Such behavior would allow public firms subject to greater capital
market pressure to report higher income in their financial statements than to tax authorities.
In contrast, we expect public firms subject to lower capital market pressure will engage in
more conforming tax avoidance. This expectation is based on the fact that nonconforming tax
avoidance is costly and if the benefits of nonconforming strategies are smaller for firms subject
to lower capital market pressure, then conforming tax planning strategies become more
appealing. Prior research illustrates that, despite its obvious appeal, nonconforming tax
avoidance can impose significant costs. For example, Mills (1998) demonstrates that book-tax
differences (an indicator of nonconforming tax avoidance) are positively associated with IRS
settlements, while Wilson (2009) shows that book-tax differences are positively associated with
identified cases of tax sheltering. Both results are consistent with tax authorities using book-tax
differences to identify corporate tax avoidance. Further, Hanlon (2005) finds that large
temporary book-tax differences are associated with lower earnings persistence and that investors
appear to recognize large temporary book-tax differences as a sign of lower earnings persistence.
For firms facing lower levels of capital market pressure, we expect the benefits of conforming
tax avoidance to outweigh the costs of nonconforming tax avoidance. Our formal hypotheses,
stated in the alternative, are:
H1a: Conforming tax avoidance is decreasing in capital market pressure at public firms.
H1b: Nonconforming tax avoidance is increasing in capital market pressure at public
firms.
We acknowledge that Mills and Newberry (2001) also examine H1b, using total book-tax
differences as their measure of nonconforming tax avoidance and several proxies for capital
market pressure, including debt constraints, manager bonus contracts, and benchmark beating

30 !
behavior. However, their research design does not allow them to test H1a (i.e., the extent to
which conforming tax avoidance varies with capital market pressure at public firms), which is
the focus of our study.25 Furthermore, H1a and H1b jointly imply that under specific conditions,
conforming and nonconforming tax strategies are substitutes at public firms. That is, public
firms subject to greater capital market pressure decide to engage in more nonconforming tax
avoidance and less conforming tax avoidance. We test this empirical prediction below.
5.2 Examining Variation in Conforming Tax Avoidance at Public Firms
To test H1a and H1b, we use seemingly unrelated regression (SUR) to estimate equations
(3) and (4) below. OLS estimation of these equations is inappropriate because the error terms in
equations (3) and (4) are likely correlated and the regressions models include many of the same
explanatory variables (e.g., Beasley 2008). We estimate equations (3) and (4) using a sample
that only includes public firms with requisite data for fiscal years 1990 through 2010. We cluster
the standard errors by firm.
CONFORM_TAX = β0 + β1AF + β2ST_ISSUE + β3SALES_GR + β4DACC +
β5ACQUISITION_D + β6INT_EXP + β7LOG_ASSETS + ε (3)
CASH_ETR3 = γ0 + γ1AF + γ2ST_ISSUE + γ3SALES_GR + γ4DACC +
γ5ACQUISITION_D + γ6PPE + γ7LOG_ASSETS + δ (4)
While CONFORM_TAX is our proxy for conforming tax avoidance, we use CASH_ETR3
as our proxy for nonconforming tax avoidance because this measure captures a broad spectrum
of nonconforming tax strategies. Consistent with prior research, we smooth out transitory shocks
!!!!!!!!!!!!!!!!!!!!!!!!!!!!!!!!!!!!!!!!!!!!!!!!!!!!!!!!!!!!!25 We note that zero book-tax differences do not necessarily indicate book-tax conformity. Book-tax differences can also equal zero if changes in the valuation allowance exactly offset changes in deferred tax assets for which managers do not expect to realize future tax benefits. Moreover, because low (or negative) book-tax differences do not capture conforming tax avoidance (i.e., they only capture book-tax differences), the analyses in Mills and Newberry (2001) do not shed light on the extent to which public firms engage in conforming tax avoidance.
31 !
to pretax income by calculating CASH_ETR3 over a 3-year time period. Equations (3) and (4)
include four proxies for capital market pressure (AF, ST_ISSUE, SALES_GR, DACC), which we
briefly describe below. They also include two control variables (ACQUISITION_D,
LOG_ASSETS), which are as defined in equation (2) above. Lastly, we include one unique
explanatory variable in each equation, so the system of equations is properly identified.
Specifically, we include INT_EXP in equation (3) and gross property, plant, and equipment
(PPE) in equation (4). In each case, we expect the unique variable to be highly correlated with
the dependent variable of the equation in which it is included, but exhibit little correlation with
the dependent variable of the other equation. See Appendix A for complete variable definitions.
We consider a broad set of capital market pressure variables, since different firms likely
face different types of capital market pressure. One common proxy for capital market pressure is
anticipated equity issuances (e.g., Teoh, Welch, and Wong 1998; Shivakumar 2000). Thus, we
include an indicator variable (ST_ISSUE) that equals one for firms that issue stock in year t, t+1,
or t+2 (and zero otherwise). Prior accounting research also suggests that managers at public
firms are under intense pressure to meet or beat market expectations, especially consensus
analyst forecasts (e.g., Jensen 2005; Graham, Harvey, and Rajgopal 2005). Thus, we include AF,
an indicator variable that equals one for public firms that are followed by sell-side analysts (and
zero otherwise). Numerous accounting studies provide evidence that firms manage earnings to
meet or beat market expectations, and often times such behaviors are associated with high
growth firms (e.g., Barth, Elliott, and Finn 1999; Bartov, Givoly, and Hayn 2002; Skinner and
Sloan 2002). Thus, we include sales growth (SALES_GR) and discretionary accruals (DACC) as
additional proxies for capital market pressure. Note that ST_ISSUE, AF, SALES_GR, and DACC
are all increasing in capital market pressure. H1a (H1b) predicts that as capital market pressure
32 !
increases, firms engage in less (more) conforming (nonconforming) tax avoidance. Thus, we
predict that the coefficients on the capital market pressure variables will be positive (negative) in
equation (3) [(4)], where CONFORM_TAX (CASH_ETR3) is the dependent variable.
5.3 Results for Conforming and Nonconforming Tax Avoidance at Public Firms
Tables 7 and 8 present results for tests of H1a and H1b. The analyses in Tables 7 and 8
are based on all public firms with requisite data in fiscal years 1990 through 2010, and thus is a
much larger sample than those in Tables 3 and 5. Table 7, Panel A provides descriptive statistics
for CONFORM_TAX, CASH_ETR3, and the four proxies for capital market pressure, including
analyst following (AF), stock issuances (ST_ISSUE), sales growth (SALES_GR), and
discretionary accruals (DACC). These statistics reveal that the average public firm is followed
by sell-side analysts (AF), does not issue equity securities (ST_ISSUE), experiences 14.3 percent
sales growth (SALES_GR), and has small positive abnormal accruals (DACC).
[INSERT TABLE 7 HERE]
Panel B presents results for univariate comparisons of conforming (CONFORM_TAX)
and nonconforming (CASH_ETR3) tax avoidance at public firms that are subject to high versus
low capital market pressure, based on four separate proxies for capital market pressure.
Specifically, high (low) capital market pressure is proxied by: 1) analyst following, AF = 1 (vs.
no analyst following, AF = 0); 2) stock issuance during the three-year period starting in year t,
ST_ISSUE = 1 (vs. no stock issuance over the same period, ST_ISSUE = 0); 3) top (vs. bottom)
25th percentile of sales growth (SALES_GR); and 4) the top (vs. bottom) 25th percentile of
discretionary accruals (DACC). In the latter two comparisons, observations in the second and
third quartiles of SALES_GR and DACC are excluded.

33 !
Consistent with H1a, we find public firms that are subject to low capital market pressure
– as proxied by no analyst following (AF), no stock issuances (ST_ISSUE), low sales growth
(SALES_GR), and low discretionary accruals (DACC) – engage in more conforming tax
avoidance (CONFORM_TAX) than public firms subject to high capital market pressure.
Consistent with H1b, we find public firms that are subject to high capital market pressure – as
proxied by analyst following (AF), stock issuances (ST_ISSUE), high sales growth (SALES_GR),
and high discretionary accruals (DACC) – engage in more nonconforming tax avoidance
(CASH_ETR) than public firms subject to low capital market pressure. Thus, the univariate
comparisons in Table 7 provide preliminary evidence in support of H1a and H1b and suggest
that firms’ tax avoidance choices vary based on the level of capital market pressures to which
they are subject.26
Table 8 provides results for seemingly unrelated regressions of conforming tax avoidance
(CONFORM_TAX, column 1) and nonconforming tax avoidance (CASH_ETR3, column 2) on
proxies for capital market pressure [equations (3) and (4)]. In each regression we include the
four proxies for capital market pressure, along with controls for acquisitions (ACQUISITION_D)
and firm size (LOG_ASSETS), as well as unique regressors in each equation to identify the
system of equations (i.e., INT_EXP and PPE, respectively). Consistent with Table 7, Panel B,
the results for CONFORM_TAX in Table 8, column 1 indicate public firms that are subject to
lower capital market pressure – as proxied by no analyst following, no stock issuances, lower
!!!!!!!!!!!!!!!!!!!!!!!!!!!!!!!!!!!!!!!!!!!!!!!!!!!!!!!!!!!!!26 We also utilized managerial stock ownership and dual class stock as proxies for capital market pressure. Although we found some evidence that firms with high managerial stock ownership (which we view as subject to less capital market pressure) engaged in more conforming tax avoidance than firms with low managerial stock ownership, we found no difference in CONFORM_TAX at firms with vs. without dual class stock ownership. Given the data constraints imposed by these alternative proxies, the results are not included in Tables 7 and 8.
34 !
sales growth, and lower discretionary accruals – engage in more conforming tax avoidance than
public firms subject to higher capital market pressure. These results are consistent with H1a.
[INSERT TABLE 8 HERE]
Next we examine the association between capital market pressure and nonconforming tax
avoidance, as measured by the CASH_ETR3. The results in column 2 indicate public firms that
are subject to higher capital market pressure – as proxied by analyst following, stock issuances,
higher sales growth, and more positive discretionary accruals – engage in more nonconforming
tax avoidance than public firms subject to lower capital market pressure. These results are
consistent with H1b. In sum, the results in Tables 7 and 8 are consistent with each other and
support our predictions that conforming tax avoidance is decreasing in capital market pressure,
while nonconforming tax avoidance is increasing in capital market pressure, at public firms.
6. Robustness Tests
6.1 Firms that Transition between Public and Quasi-Private Ownership
Our initial validation test of CONFORM_TAX examines changes in CONFORM_TAX at
firms that convert to and from the FIFO and LIFO inventory methods. In alternative validation
tests, we examine changes in CONFORM_TAX at firms that transition to and from public and
quasi-private ownership. Specifically, Figure 2 Panel A (B) demonstrates how the mean value of
CONFORM_TAX changes for sub-samples of firms that transition from public to quasi-private
(quasi-private to public) ownership. As expected, the results suggest that firms engage in more
conforming tax avoidance (i.e., CONFORM_TAX decreases) in years a firm is quasi-privately-
held as compared to years it is publicly-traded. In contrast, firms engage in less nonconforming
tax avoidance (i.e., CASH_ETR increases) in years a firm is quasi-privately-held as compared to

35 !
years it is publicly-traded. In sum, Figure 2 provide additional evidence that CONFORM_TAX
captures conforming tax avoidance.
[INSERT FIGURE 2 HERE]
6.2 Comparisons of CONFORM_TAX and Simulated CONFORM_TAX
To further validate our conforming tax avoidance measure we also conduct a simulation.
As noted in De Simone, Nickerson, Seidman and Stomberg (2014), simulated data can be
beneficial in our setting since firms do not often disclose the details of their tax avoidance
activities. Specifically, we “seed” our data with an increase in conforming tax avoidance (e.g.,
accelerate discretionary expense recognition to the current fiscal year), which reduces cash taxes
paid but does not affect total book-tax differences. We simulate the amount of discretionary
expense recognition by reducing pre-tax income by either one, three or five percent. Similar to
Dechow et al. (1995) and Dechow et al. (2012), we conduct the following steps:
1) From among the 58,598 public firm-years with positive pre-tax income from 1990 to
2010, we randomly select 100 firm-year observations. The 100 firm-years are
designated as conforming tax avoiding years. The remaining firm-years are
designated as non-conforming tax avoiding years.
2) For the 100 firm-years designated as conforming tax avoiding years from step one, we
artificially induce conforming tax avoidance by recalculating
TAXESPAID_TO_ASSETS as follows: [Cash taxes paid - (X * Pretax income × 0.35)]
divided by lagged total assets, where X is either one, three, or five percent.
3) We conduct a pooled regression of equation (1) as described in section 3, by industry
and fiscal year combinations, using all 58,598 public firm-years and calculate
36 !
CONFORM_TAX_SEED for the 100 firm-years designated as conforming tax
avoiding years from step one.
4) Steps one through three are repeated 1,000 times.
5) We compare the original CONFORM_TAX of each firm-year observation, to the
CONFORM_TAX_SEED from step three, when both exist. In instances where a firm-
year has more than one CONFORM_TAX_SEED observation, we average the
CONFORM_TAX_SEED observations created in the 1,000 simulations.27
We report the results from the simulation analyses in Table 9. Both mean and median
values of seeded conforming tax avoidance (CONFORM_TAX_SEED) are significantly larger in
magnitude than non-seeded values of conforming tax avoidance (CONFORM_TAX). For
example, the mean values of conforming tax avoidance are statistically significantly larger by
0.0005, 0.0010, and 0.0016 after artificially inducing conforming tax avoidance by one, three or
five percent of pretax income, respectively. We conclude that our method of calculating
conforming tax avoidance adequately captures tax-motivated transactions that reduce both book
and taxable income.
[INSERT TABLE 9 HERE]
6.3 Results from Other Robustness Tests
Our measure of conforming tax avoidance is based on the ratio of cash taxes paid to
lagged total assets. In untabulated supplemental tests we instead start with the ratio of cash taxes
paid to cash flow from operations, as mentioned in Hanlon and Heitzman (2010). We then
orthogonalize it exactly as described in Section 3 and re-estimate all of our empirical tests based
on this alternative measure of conforming tax avoidance. Results are largely similar to those
!!!!!!!!!!!!!!!!!!!!!!!!!!!!!!!!!!!!!!!!!!!!!!!!!!!!!!!!!!!!!27 Instead of averaging multiple CONFORM_TAX_SEED results, our results remain quantitatively similar if we randomly select one of them.

37 !
tabulated in this paper. However, because the ratio of cash taxes paid to cash flow from
operations does not capture all forms of conforming tax avoidance, we consider it inferior to the
ratio of cash taxes paid to lagged total assets.
Although the computation of CASH_ETR3 requires a firm to have positive cash taxes
paid and adjusted pretax income over a 3-year time period, our computation of CONFORM_TAX
does not impose any profitability requirements. Consequently, some firm-year observations
included in Tables 1-6 report negative cash taxes paid or negative pretax income (approximately
20 and 10 percent, respectively, of the quasi-private / matched public and pure-private / matched
public firm samples). To evaluate whether our results are robust to the exclusion of loss
observations, we re-estimate all tests after excluding firm-years with negative cash taxes paid or
negative pretax income. The results (untabulated) are qualitatively similar to those shown in
Tables 1-6. We conclude that our findings are not driven by loss firms.
7. Conclusions
Recent tax research essentially disregards the existence of tax planning strategies that
reduce both book and taxable incomes, which we refer to as conforming tax avoidance. This
disregard for conforming tax avoidance is likely the product of two factors: 1) extant empirical
research focuses on large, public firms that are subject to greater capital market pressure and thus
primarily use nonconforming tax strategies, and 2) the lack of an empirical proxy specifically
designed to capture conforming tax avoidance. We expand the accounting literature first, by
developing and validating a measure of conforming tax avoidance, and second, by investigating
the extent to which conforming and nonconforming tax avoidance at public firms varies with the
amount of capital market pressure to which the firm is subject.

38 !
We develop our measure of nonconforming tax avoidance based on the ratio of cash taxes
paid to lagged total assets. This ratio excludes tax accruals, which can distort a firm’s current tax
expense but captures both conforming and nonconforming tax strategies. To remove the impact
of nonconforming tax avoidance from the ratio, we orthogonalize it to book-tax differences.
That is, we regress the ratio of cash taxes paid to lagged total assets on book-tax differences, by
industry and fiscal year combinations, and keep the residual as our measure of conforming tax
avoidance. The residual captures variation in the ratio of cash taxes paid to lagged total assets
that is unrelated to book-tax differences and also excludes the average value of the ratio when
book-tax differences are zero for a particular industry-fiscal year combination. In short, it
captures abnormal values of cash taxes paid for a particular industry-fiscal year combination,
after removing nonconforming tax strategies.
We then validate our measure of conforming tax avoidance through a series of tests.
First, we use a sample of firms that convert from the first-in-first-out (FIFO) inventory method to
the last-in-first-out (LIFO) inventory method (and vice versa) to test whether our measure of
conforming tax avoidance captures predictable changes in book-tax conformity. FIFO-to-LIFO
conversions should increase book-tax conforming tax avoidance and thus cause our measure of
conforming tax avoidance to decrease after the change in accounting method. Our results are
consistent with expectations. We then use two different samples of private firms to examine
whether private firms engage in more conforming tax avoidance than similar public firms,
consistent with results in prior accounting research. Results from both of our matched-pair
samples of private and public firms confirm that private firms engage in more conforming tax
avoidance than public firms, and also reveal that private firms rely on expenditures that are

39 !
subject to greater managerial discretion, such as advertising, SG&A, and R&D, to reduce their
tax liabilities.
Finally, we predict that a public firm’s decision to adopt book-tax conforming vs.
nonconforming tax strategies varies with the amount of capital market pressure to which the firm
is subject. We predict that firms subject to greater (lower) capital market pressure will engage in
more nonconforming (conforming) tax avoidance. We measure capital market pressure through
a variety of empirical proxies, including: analyst following, stock issuances, sales growth, and
discretionary accruals. Our results are as predicted across all of our proxies for capital market
pressure.
Our research makes two important contributions to the accounting literature. We develop
a measure of conforming tax avoidance that can be used in future research to obtain a deeper
understanding of the tax strategies adopted by a variety of firms. We particularly expect our
measure to provide new insights into the tax planning at smaller companies that are subject to
less capital market pressure than larger firms. Our study also explicitly examines how
conforming and nonconforming tax avoidance varies at large, public companies, with a specific
focus on how capital market pressure influences tax choices. Our study differs from prior
research that focuses on specific transactions that reduce both book and taxable income, and
from research that examines how capital market pressure affects nonconforming tax avoidance at
public and private firms.

40 !
REFERENCES
Badertscher, B., B. Jorgensen, S. Katz, and W. Kinney. ‘Public Equity and Audit Pricing in the U.S.’ Journal of Accounting Research 52 (2014): 303-339.
Badertscher, B., S. Katz, and S. Rego. ‘The Separation of Ownership and Control and Corporate
Tax Avoidance.’ Journal of Accounting and Economics 56 (2013a): 228-250. Badertscher, B., N. Shroff, and H. White. ‘Externalities of Public Firms: Evidence from Private
Firms’ Investment Decisions.’ Journal of Financial Economics 109 (2013b): 682-706. Barth, M., J.A. Elliott, and M.W. Finn. ‘Market Rewards Associated with Patterns of Increasing
Earnings.’ Journal of Accounting Research 37 (1999): 387-413. Bartov, E., D. Givoly, and C. Hayn. ‘The Rewards to Meeting or Beating Earnings
Expectations.’ Journal of Accounting and Economics 33 (2002); 173-204. Beatty, A. and D. Harris. ‘The Effects of Taxes, Agency Costs and Information Asymmetry on
Earnings Management: A Comparison of Public and Private Firms.’ Review of Accounting Studies 4 (1998): 299-326.
Callihan, D. ‘Corporate Effective Tax Rates: A Synthesis of the Literature.’ Journal of
Accounting Literature 13 (1994): 1-43. Cazier, R., S. Rego, X. Tian, and R. Wilson. ‘Did FIN 48 Limit the Use of Tax Reserves as a
Tool for Earnings Management?.’ Review of Accounting Studies, Forthcoming. Chen, S., X. Chen, Q. Cheng, and T. Shevlin. ‘Are Family Firms More Tax Aggressive than
Non-Family Firms?.’ Journal of Financial Economics 95 (2010): 41-61. Cloyd, B., J. Pratt, and T. Stock. ‘The Use of Financial Accounting Choice to Support
Aggressive Tax Positions: Public and Private Firms.’ Journal of Accounting Research 34 (1996): 23- 43.
Dechow, P.M, R.G. Sloan and A.P. Sweeney. ‘Detecting Earnings Management.’ The
Accounting Review 70 (1995): 193-215. Dechow, P.M., A.P. Hutton, J.H. Kim and R. G. Sloan. ‘Detecting Earnings Management: A
New Approach.’ Journal of Accounting Research 50 (2012): 275-334. Desai, M. ‘The Divergence between Book and Tax Income.’ Tax Policy and the Economy 17, J.
M. Poterba (ed.), Cambridge: MIT Press (2003):169–206. De Simone, L., J. Nickerson, J. K. Seidman and B. Stomberg. ‘How Reliably Do Financial
Statement Proxies Identify Tax Avoidance?’ Working Paper, Stanford University (2014).
41 !
Dhaliwal, D., C. Gleason, and L. Mills, ‘Last-Chance Earnings Management: Using the Tax Expense to Meet Analysts’ Forecasts.’ Contemporary Accounting Research 21 (2004): 431–459.
Dopuch N., and M. Pincus. ‘Evidence on the Choice of Inventory Accounting Methods: LIFO
versus FIFO.’ Journal of Accounting Research 26 (1988): 28-59. Dyreng, S., M. Hanlon, and E. Maydew. ‘Long-Run Corporate Tax Avoidance.’ The Accounting
Review 83 (2008): 61-82 Dyreng, S., M. Hanlon, and E. Maydew. ‘The Effects of Executives on Corporate Tax
Avoidance.’ The Accounting Review 85(2010): 1163-1189. Frank, M., L. Lynch, and S. Rego. ‘Tax Reporting Aggressiveness and Its Relation to Aggressive
Financial Reporting.’ The Accounting Review 84 (2009):!467-496. Frank, M., and S. Rego. ‘Do Managers Use the Valuation Allowance Account to Manage
Earnings Around Certain Earnings Targets?.’ Journal of the American Taxation Association 28 (2006): 43-65.
Givoly, D., C. Hayn, and S. Katz. ‘Does Public Ownership of Equity Improve Earnings
Quality?.’ The Accounting Review 85(2010): 195-225. Graham, J., C. Harvey, and S. Rajgopal. ‘The Economic Implications of Corporate Financial
Reporting.’ Journal of Accounting and Economics 40 (2005): 3-73. Guenther, D. ‘Earnings Management in Response to Corporate Tax Rate Changes: Evidence
from the 1986 Tax Reform Act.’ The Accounting Review 69 (1994): 230–243. Hanlon, M. ‘The Persistence and Pricing of Earnings, Accruals, and Cash Flows When Firms
Have Large Book-Tax Differences.’ The Accounting Review 80 (2005): 137-166. Hanlon, M., and S. Heitzman. ‘A Review of Tax Research.’ Journal of Accounting and
Economics 50 (2010): 127-178. Henry, E. and R. Sansing. ‘Data Truncation Bias and the Mis-measurement of Corporate Tax
Avoidance,’ Unpublished paper, University of Connecticut, 2014. Available at http://papers.ssrn.com/sol3/papers.cfm?abstract_id=2329694.
Hunt, A., S. Moyer, and T. Shevlin. ‘Managing Interacting Accounting Measures to Meet
Multiple Objectives: A Study of LIFO Firms.’ Journal of Accounting and Economics 21 (1996): 339–374.
Jensen, M. ‘Agency Costs of Overvalued Equity.’ Financial Management 34 (2005): 5-19.

42 !
Katz, S. ‘Earnings Quality and Ownership Structure: The Role of Private Equity Sponsors.’ The Accounting Review 84 (2009): 623-658.
Klassen, K. ‘The Impact of Inside Ownership Concentration on the Trade-Off Between Financial
and Tax Reporting.’ The Accounting Review 72 (1997): 455-474. Krull, L. ‘Permanently Reinvested Foreign Earnings, Taxes, and Earnings Management. The
Accounting Review 79 (2004): 745-767. Matsunaga, S., T. Shevlin, and D. Shores. ‘Disqualifying Dispositions of Incentive Stock
Options: Tax Benefits versus Financial Reporting Costs.’ Journal of Accounting Research 30 (1992): 37–76.
Maydew, E. ‘Tax Induced Earnings Management by Firms with Net Operating Losses.’ Journal
of Accounting Research 35 (1997): 83-96. McGill, G., and E. Outslay. “Lost in Translation: Detecting Tax Shelter Activity in Financial
Statements.’ National Tax Journal 57 (2004): 739-756. Mikhail, M. ‘Coordination of Earnings, Regulatory Capital and Taxes in Private and Public
Companies.’ Unpublished Paper, Massachusetts Institute of Technology, 1999. Available at http://papers.ssrn.com/sol3/papers.cfm?abstract_id=165010.
Mills, L. ‘Book-Tax Differences and Internal Revenue Service Adjustments.’ Journal of
Accounting Research 36 (1998): 343-356. Mills, L., M. Erickson, and E. Maydew. ‘Investments in Tax Planning.’ Journal of American
Taxation Association 20 (1998): 1–20. Mills, L. and K. Newberry. ‘The Influence of Tax and Nontax Costs on Book-Tax Reporting
Differences: Public and Private Firms.’ Journal of the American Taxation Association 23 (2001): 1-19.
Minnis, M. ‘The Value of Financial Statement Verification in Debt Financing: Evidence from
Private U.S. Firms.’ Journal of Accounting Research 49 (2011): 457–506. Nissim, D. and S. Penman. ‘Financial Statement Analysis of Leverage and How It Informs
About Profitability and Price-to-Book Ratios.’ Review of Accounting Studies 8 (2003): 531–559.
Penno, M., and D. Simon. ‘Accounting Choices: Public versus Private Firms.’ Journal of
Business Finance & Accounting 13 (1986): 561-569. Phillips, J. ‘Corporate Tax-Planning Effectiveness: The Role of Compensation-Based Incentives.
The Accounting Review 78 (2003): 847-874.
43 !
Rego, S. ‘Tax-Avoidance Activities of U.S. Multinational Corporations.’ Contemporary Accounting Research 20 (2003): 805-833.
Rego, S. and R. Wilson. ‘Equity Risk Incentives and Corporate Tax Aggressiveness.’ Journal of
Accounting Research 50 (2012): 775-810. Roychowdhury, S. ‘Earnings Management through Real Activities Manipulation.’ Journal of
Accounting and Economics 42 (2006): 335-370. Scholes, M., G. Wilson, and M. Wolfson, M. ‘Firms' Responses to Anticipated Reductions in
Tax Rates: The Tax Reform Act of 1986.’ Journal of Accounting Research 30 (1992): 161-185.
Schrand, C., and F. Wong. ‘Earnings Management Using the Valuation Allowance for Deferred
Tax Assets under SFAS No. 109.’ Contemporary Accounting Research 20 (2003): 579-611.
Shackelford, D. and T. Shevlin. ‘Empirical Tax Research in Accounting.’ Journal of Accounting
and Economics 31 (2001): 321-387. Shevlin, T. ‘Symposium on Corporate Tax Shelters Part II: Commentary: Corporate Tax
Shelters and Book-Tax Differences.’ New York University Tax Review 55 (2002): 427. Shivakumar, L. ‘Do Firms Mislead Investors by Overstating Earnings before Seasoned Equity
Offerings?’ Journal of Accounting and Economics 29 (2000): 339-371. Skinner, D.J. and R.G. Sloan. ‘Earnings Surprises, Growth Expectations, and Stock Returns or
Don’t Let an Earnings Torpedo Sink your Portfolio.’ Review of Accounting Studies 7 (2002): 289-312.
Teoh, S.H., I. Welch, and T.J. Wong. ‘Earnings Management and the Underperformance of
Seasoned Equity Offerings.’ Journal of Financial Economics 50 (1998): 63-99. Weisbach, D. ‘Ten Truths about Tax Shelters.’ Tax Law Review 55 (2002): 215 - 253. Wilson, R.’ An Examination of Corporate Tax Shelter Participants.’ The Accounting Review 84
(2009): 969-999. Zimmerman, J. “Taxes and Firm Size.’ Journal of Accounting and Economics 5 (1983): 119-149. !
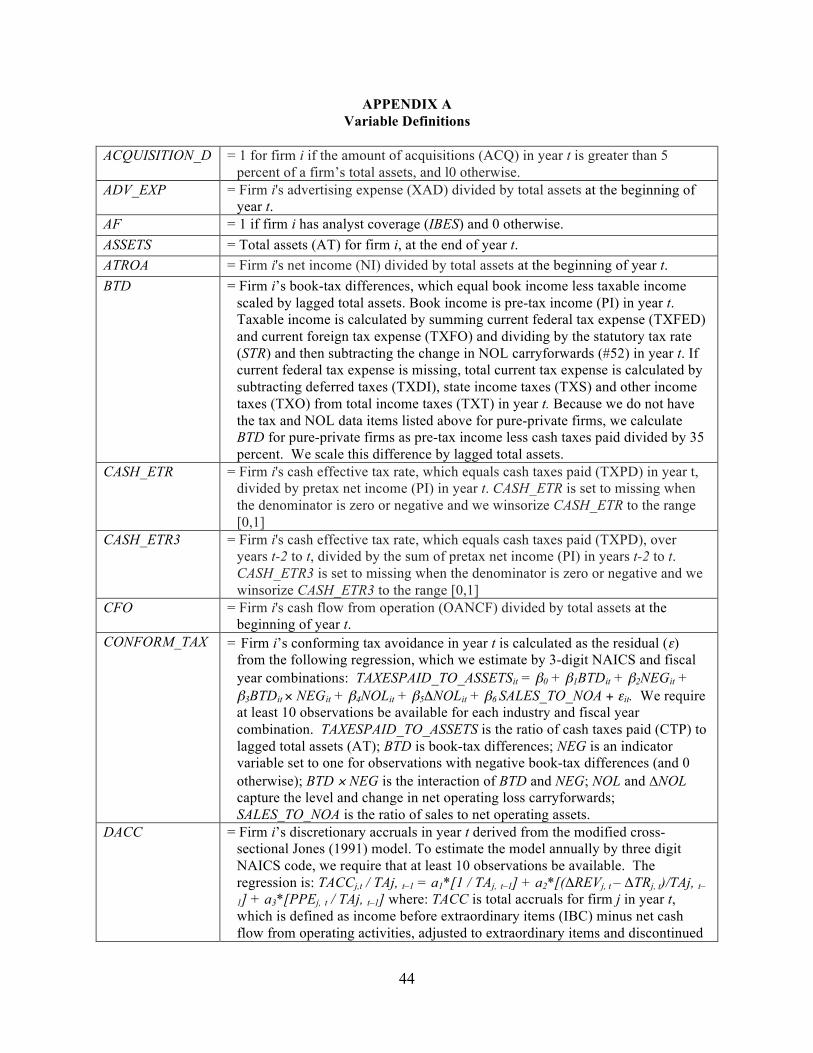
44 !
APPENDIX A Variable Definitions
ACQUISITION_D = 1 for firm i if the amount of acquisitions (ACQ) in year t is greater than 5
percent of a firm’s total assets, and l0 otherwise. ADV_EXP = Firm i's advertising expense (XAD) divided by total assets at the beginning of
year t. AF = 1 if firm i has analyst coverage (IBES) and 0 otherwise. ASSETS = Total assets (AT) for firm i, at the end of year t. ATROA = Firm i's net income (NI) divided by total assets at the beginning of year t. BTD = Firm i’s book-tax differences, which equal book income less taxable income
scaled by lagged total assets. Book income is pre-tax income (PI) in year t. Taxable income is calculated by summing current federal tax expense (TXFED) and current foreign tax expense (TXFO) and dividing by the statutory tax rate (STR) and then subtracting the change in NOL carryforwards (#52) in year t. If current federal tax expense is missing, total current tax expense is calculated by subtracting deferred taxes (TXDI), state income taxes (TXS) and other income taxes (TXO) from total income taxes (TXT) in year t. Because we do not have the tax and NOL data items listed above for pure-private firms, we calculate BTD for pure-private firms as pre-tax income less cash taxes paid divided by 35 percent. We scale this difference by lagged total assets.
CASH_ETR = Firm i's cash effective tax rate, which equals cash taxes paid (TXPD) in year t, divided by pretax net income (PI) in year t. CASH_ETR is set to missing when the denominator is zero or negative and we winsorize CASH_ETR to the range [0,1]
CASH_ETR3 = Firm i's cash effective tax rate, which equals cash taxes paid (TXPD), over years t-2 to t, divided by the sum of pretax net income (PI) in years t-2 to t. CASH_ETR3 is set to missing when the denominator is zero or negative and we winsorize CASH_ETR3 to the range [0,1]
CFO = Firm i's cash flow from operation (OANCF) divided by total assets at the beginning of year t.
CONFORM_TAX = Firm i’s conforming tax avoidance in year t is calculated as the residual (ε) from the following regression, which we estimate by 3-digit NAICS and fiscal year combinations: TAXESPAID_TO_ASSETSit = β0 + β1BTDit + β2NEGit + β3BTDit × NEGit + β4NOLit + β5ΔNOLit + β6 SALES_TO_NOA + εit. We require at least 10 observations be available for each industry and fiscal year combination. TAXESPAID_TO_ASSETS is the ratio of cash taxes paid (CTP) to lagged total assets (AT); BTD is book-tax differences; NEG is an indicator variable set to one for observations with negative book-tax differences (and 0 otherwise); BTD × NEG is the interaction of BTD and NEG; NOL and ∆NOL capture the level and change in net operating loss carryforwards; SALES_TO_NOA is the ratio of sales to net operating assets.
DACC = Firm i’s discretionary accruals in year t derived from the modified cross-sectional Jones (1991) model. To estimate the model annually by three digit NAICS code, we require that at least 10 observations be available. The regression is: TACCj,t / TAj, t–1 = a1*[1 / TAj, t–1] + a2*[(ΔREVj, t – ΔTRj, t)/TAj, t–1] + a3*[PPEj, t / TAj, t–1] where: TACC is total accruals for firm j in year t, which is defined as income before extraordinary items (IBC) minus net cash flow from operating activities, adjusted to extraordinary items and discontinued

45 !
operations OANCF – XIDOC). TA is the beginning-of-the-year total assets (lagged AT). ΔREV is the change in sales in year t (SALE), PPE is gross property, plant, and equipment in year t (PPEGT), and ΔTR is the change in trade receivables in year t (RECTR).
DISCR_CFO = Firm i’s discretionary cash flow from operations in year t derived from the cross-sectional Roychowdhury (2006) model. To estimate the model annually by three digit NAICS code, we require that at least 10 observations be available. The regression is: CFOj,t / TAj, t–1 = a1*[1 / TAj, t–1] + a2*[(Sj, t)/TAj, t–1] + a3*[ΔS, t / TAj, t–1] where: CFO is cash flow from operations (OANCF) for firm j in year t, TA is the beginning-of-the-year total assets (lagged AT). S is sales in year t (SALE), ΔS is change in sales in year t. For every firm-year, DISCR_CFO is the actual CFO minus the “normal” CFO calculated using estimated coefficients from the model and the firm-year’s sales and lagged assets.
DISCR_EXP = Firm i’s discretionary expenditures in year t derived from the cross-sectional Roychowdhury (2006) model. To estimate the model annually by three digit NAICS code, we require that at least 10 observations be available. The regression is: DISEXPj,t / TAj, t–1 = a1*[1 / TAj, t–1] + a2*[(Sj, t-1)/TAj, t–1] where: DISEXP is discretionary expenditures in period t and is the sum of advertising expense (XAD), research and development expense (XRD) and selling, general, and administrative expense (XSGA), TA is the beginning-of-the-year total assets (lagged AT). S is sales in year t-1 (lagged SALE).
DISCR_PROD = Firm i’s discretionary production costs in year t derived from the cross-sectional Roychowdhury (2006) model. To estimate the model annually by three digit NAICS code, we require that at least 10 observations be available. Following Roychowdhury we first estimate a model for “normal” COGS by estimating the following regression: COGSj,t / TAj, t–1 = a1*[1 / TAj, t–1] + a2*[( Sj, t)/TAj, t–1] where COGS is the cost of goods sold (COGS); TA is total assets (AT), and S is sales (SALE). Next we first estimate a model for “normal” inventory growth by estimating the following regression: ΔINVj,t / TAj, t–1 = a1*[1 / TAj, t–1] + a2*[( ΔSj, t)/TAj, t–1] + a3*[ΔS, t-1 / TAj, t–1] where ΔINV is the change in inventory in year t. Production cost (PROD) is then cost of goods sold (COGS) plus change in inventory (INV) for firm j in year t. Using the COGS and ΔINV equations we estimate normal production costs from the following year-3 digit NAICS industry regression: PRODj,t / TAj, t–1 = a1*[1 / TAj, t–1] + a2*[(Sj,
t)/TAj, t–1] + a3*[ΔS, t-1 / TAj, t–1] where TA is the beginning-of-the-year total assets (lagged AT). S is sales in year t (SALE), ΔS is change in sales in year t-1.
FOROPER = 1 if firm i’s foreign pre-tax income (PIFO) or foreign income taxes (TXFO) is positive or negative and 0 otherwise.
INT_EXP = Firm i's interest expense (XINT) divided by total assets at the beginning of year t.
LIFO_DUMM = 1 if the primary inventory valuation method (INVALCD) is LIFO. LOG_ASSETS = Natural logarithm of the total assets (AT) for firm i, at the end of year t. LTDEBT = Firm i’s leverage in year t, measured as total long-term debt (DLTT) divided by
total assets. NOL = 1 if firm i has net operating loss carryforwards (TLCF) available at the
beginning of year t, and 0 otherwise. ∆NOL = Change in firm i’s net operating loss carryforwards (TLCF) available at the
beginning of year t, scaled by total assets at the beginning of year t. PPE = Firm i’ gross amount of property, plant, and equipment (PPEGT)

46 !
PRIVATE = 1 if the firm does not have publicly traded securities (debt, equity, or both). PTROA = Firm i's pre-tax net income (PI) divided by total assets at the beginning of year t. R&D = Firm i's research and development expense (XRD) divided by total assets at the
beginning of year t. SALES = Firm i ‘s sales (SALE) at the end of year t divided by total assets at the
beginning of year t. SALES_GR = Firm i’s sales growth, where sales growth is sales (SALE) at the end of year t
less sales at the beginning of year t divided by sales at the beginning of year t. SALES_TO_NOA = Sales (SALE) at the end of year t divided by net operating assets (SEQ-
CHE+DLC+DLTT) at the end of year t. SGA_EXP = Firm i's selling, general and administrative expense (XSGA) divided by total
assets at the beginning of year t. SPEC_ITEMS = -1 × (firm i’s special items (SPI) divided by total assets at the beginning of year
t). ST_ISSUE = 1 if shares outstanding in year t is greater than 110 percent of shares outstanding
in year t-1. TAXESPAID_TO_ASSETS
= Firm i's cash taxes paid (CTP) divided by total assets at the beginning of year t.
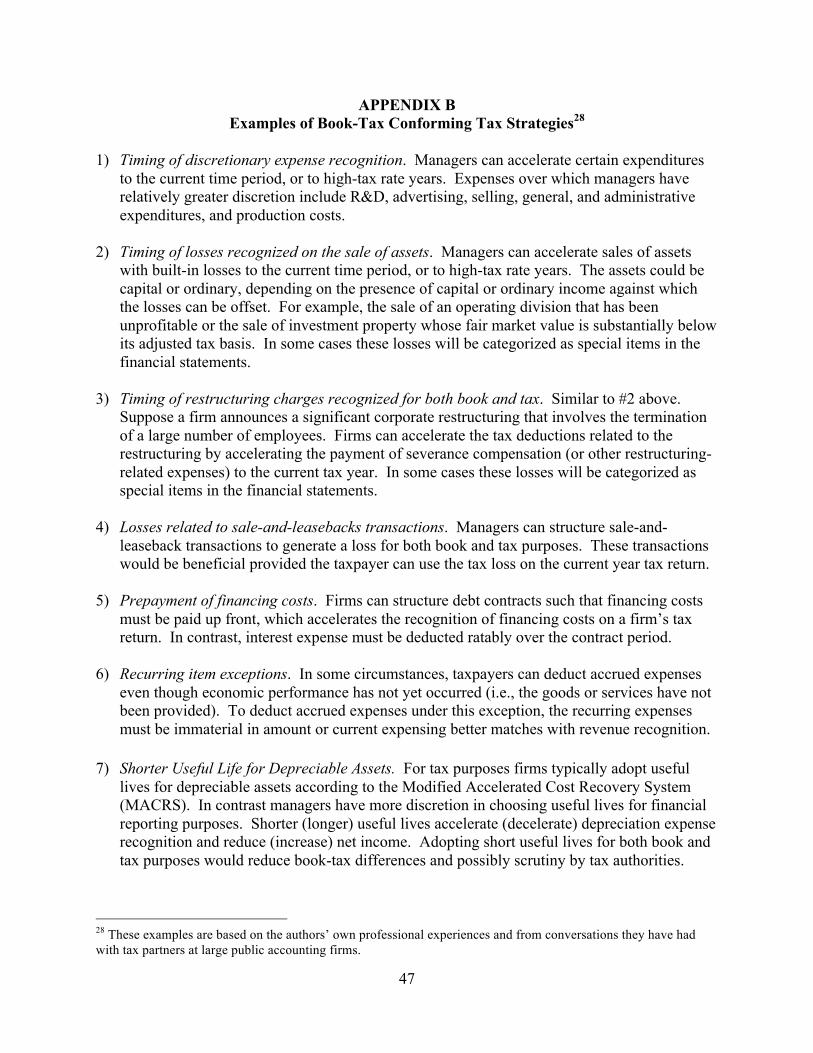
47 !
APPENDIX B Examples of Book-Tax Conforming Tax Strategies28
1) Timing of discretionary expense recognition. Managers can accelerate certain expenditures
to the current time period, or to high-tax rate years. Expenses over which managers have relatively greater discretion include R&D, advertising, selling, general, and administrative expenditures, and production costs.
2) Timing of losses recognized on the sale of assets. Managers can accelerate sales of assets
with built-in losses to the current time period, or to high-tax rate years. The assets could be capital or ordinary, depending on the presence of capital or ordinary income against which the losses can be offset. For example, the sale of an operating division that has been unprofitable or the sale of investment property whose fair market value is substantially below its adjusted tax basis. In some cases these losses will be categorized as special items in the financial statements.
3) Timing of restructuring charges recognized for both book and tax. Similar to #2 above.
Suppose a firm announces a significant corporate restructuring that involves the termination of a large number of employees. Firms can accelerate the tax deductions related to the restructuring by accelerating the payment of severance compensation (or other restructuring-related expenses) to the current tax year. In some cases these losses will be categorized as special items in the financial statements.
4) Losses related to sale-and-leasebacks transactions. Managers can structure sale-and-
leaseback transactions to generate a loss for both book and tax purposes. These transactions would be beneficial provided the taxpayer can use the tax loss on the current year tax return.
5) Prepayment of financing costs. Firms can structure debt contracts such that financing costs
must be paid up front, which accelerates the recognition of financing costs on a firm’s tax return. In contrast, interest expense must be deducted ratably over the contract period.
6) Recurring item exceptions. In some circumstances, taxpayers can deduct accrued expenses
even though economic performance has not yet occurred (i.e., the goods or services have not been provided). To deduct accrued expenses under this exception, the recurring expenses must be immaterial in amount or current expensing better matches with revenue recognition.
7) Shorter Useful Life for Depreciable Assets. For tax purposes firms typically adopt useful
lives for depreciable assets according to the Modified Accelerated Cost Recovery System (MACRS). In contrast managers have more discretion in choosing useful lives for financial reporting purposes. Shorter (longer) useful lives accelerate (decelerate) depreciation expense recognition and reduce (increase) net income. Adopting short useful lives for both book and tax purposes would reduce book-tax differences and possibly scrutiny by tax authorities.
!!!!!!!!!!!!!!!!!!!!!!!!!!!!!!!!!!!!!!!!!!!!!!!!!!!!!!!!!!!!!28 These examples are based on the authors’ own professional experiences and from conversations they have had with tax partners at large public accounting firms.

48 !
FIGURE 1 Mean Conforming Tax Avoidance (CONFORM_TAX) before and after FIFO / LIFO Inventory Method Conversions
!
0.0019
&0.0025&0.0027&0.0024
0.0024
0.0018
&0.003
&0.002
&0.001
0.000
0.001
0.002
0.003
t&1 t! t+1
FIFO to LIFO (n=46) LIFO to FIFO (n=121)
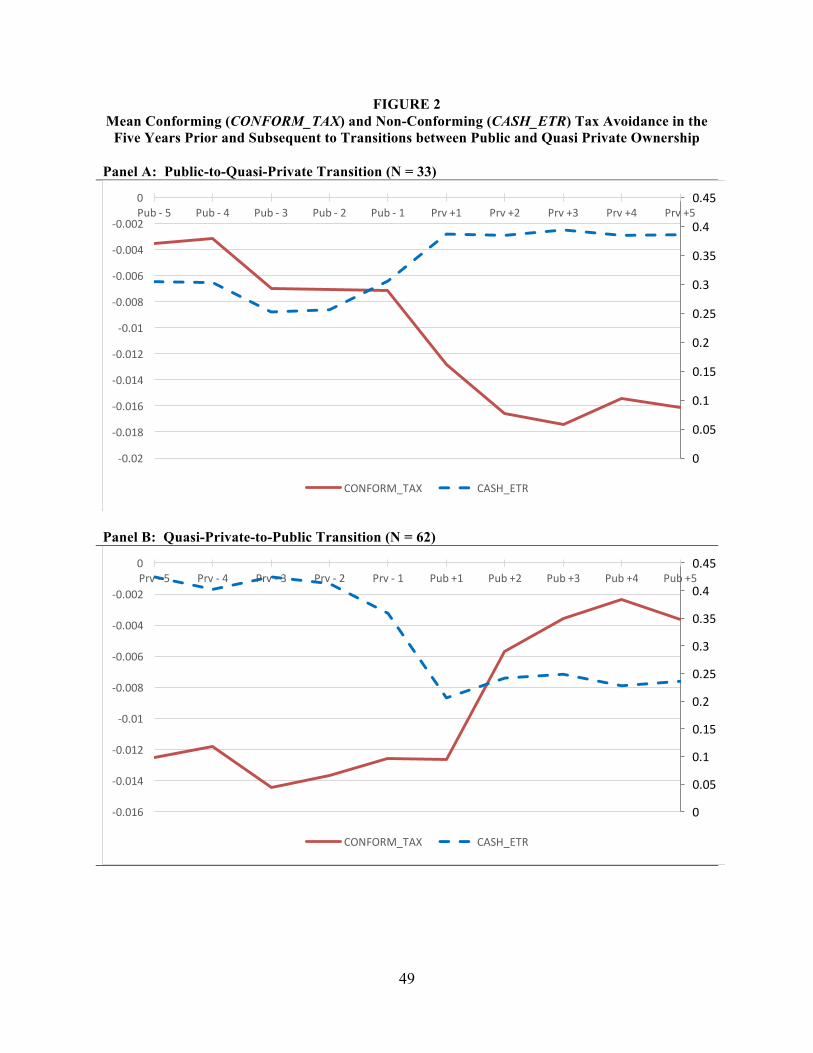
49 !
FIGURE 2 Mean Conforming (CONFORM_TAX) and Non-Conforming (CASH_ETR) Tax Avoidance in the
Five Years Prior and Subsequent to Transitions between Public and Quasi Private Ownership
Panel A: Public-to-Quasi-Private Transition (N = 33)
Panel B: Quasi-Private-to-Public Transition (N = 62)
0
0.05
0.1
0.15
0.2
0.25
0.3
0.35
0.4
0.45
)0.02
)0.018
)0.016
)0.014
)0.012
)0.01
)0.008
)0.006
)0.004
)0.002
0Pub!) 5 Pub!) 4 Pub!) 3 Pub!) 2 Pub!) 1 Prv!+1 Prv!+2 Prv!+3 Prv!+4 Prv!+5
CONFORM_TAX CASH_ETR
0
0.05
0.1
0.15
0.2
0.25
0.3
0.35
0.4
0.45
)0.016
)0.014
)0.012
)0.01
)0.008
)0.006
)0.004
)0.002
0Prv!) 5 Prv!) 4 Prv!) 3 Prv!) 2 Prv!) 1 Pub!+1 Pub!+2 Pub!+3 Pub!+4 Pub!+5
CONFORM_TAX CASH_ETR
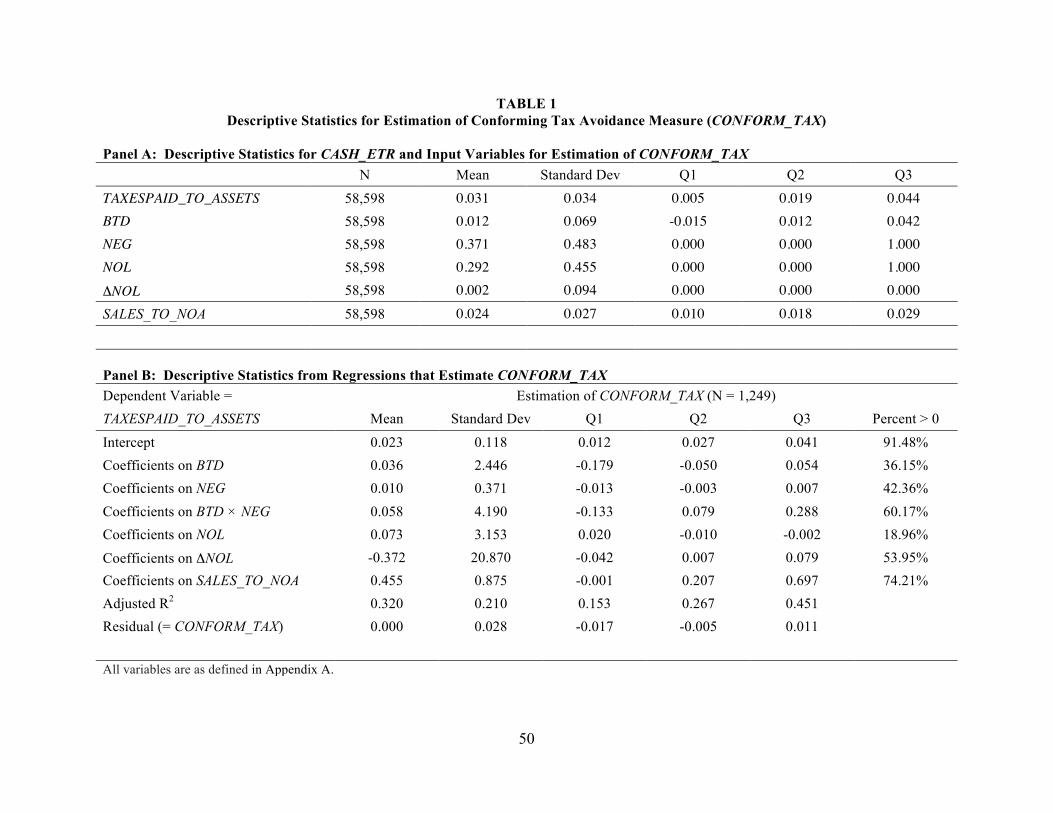
50 !
TABLE 1 Descriptive Statistics for Estimation of Conforming Tax Avoidance Measure (CONFORM_TAX)
Panel A: Descriptive Statistics for CASH_ETR and Input Variables for Estimation of CONFORM_TAX N Mean Standard Dev Q1 Q2 Q3 TAXESPAID_TO_ASSETS 58,598 0.031 0.034 0.005 0.019 0.044 BTD 58,598 0.012 0.069 -0.015 0.012 0.042 NEG 58,598 0.371 0.483 0.000 0.000 1.000 NOL 58,598 0.292 0.455 0.000 0.000 1.000 ΔNOL 58,598 0.002 0.094 0.000 0.000 0.000 SALES_TO_NOA 58,598 0.024 0.027 0.010 0.018 0.029 Panel B: Descriptive Statistics from Regressions that Estimate CONFORM_TAX Dependent Variable = Estimation of CONFORM_TAX (N = 1,249) TAXESPAID_TO_ASSETS Mean Standard Dev Q1 Q2 Q3 Percent > 0
Intercept 0.023 0.118 0.012 0.027 0.041 91.48%
Coefficients on BTD 0.036 2.446 -0.179 -0.050 0.054 36.15%
Coefficients on NEG 0.010 0.371 -0.013 -0.003 0.007 42.36%
Coefficients on BTD × NEG 0.058 4.190 -0.133 0.079 0.288 60.17%
Coefficients on NOL 0.073 3.153 0.020 -0.010 -0.002 18.96%
Coefficients on ΔNOL -0.372 20.870 -0.042 0.007 0.079 53.95%
Coefficients on SALES_TO_NOA 0.455 0.875 -0.001 0.207 0.697 74.21%
Adjusted R2 0.320 0.210 0.153 0.267 0.451
Residual (= CONFORM_TAX) 0.000 0.028 -0.017 -0.005 0.011
All variables are as defined in Appendix A.

51 !
TABLE 2 Conforming Tax Avoidance Statistics for Public Firms that Transition between FIFO and LIFO Inventory Methods
Panel A: Firms that Transition from FIFO (in Year t-1) to LIFO (in Year t and t+1) N Mean Standard Dev Q1 Q2 Q3
(1) CONFORM_TAX_t-1 46 0.0019 0.0168 -0.0136 -0.0026 0.0133
(2) CONFORM_TAX_t 46 -0.0025 0.0212 -0.0162 -0.0040 0.0125
(3) CONFORM_TAX_t+1 46 -0.0027 0.0172 -0.0173 -0.0042 0.0081
Difference (3) – (1) -0.0047* -0.0016
Panel B: Firms that Transition from LIFO (in Year t-1) to FIFO (in Year t and t+1)
N Mean Standard Dev Q1 Q2 Q3
(1) CONFORM_TAX_t-1 121 -0.0024 0.0172 -0.0146 -0.0057 0.0100
(2) CONFORM_TAX_t 121 0.0024 0.0239 -0.0106 -0.0009 0.0123
(3) CONFORM_TAX_t+1 121 0.0018 0.0173 -0.0133 -0.0025 0.0128
Difference (3) – (1) 0.0042* 0.0033*
*,**,*** indicate significance at the 10%, 5%, and 1% level using a two-tailed t-test, respectively. Differences between means are tested for significance using a two-tailed t-test; differences in medians are tested for significance using a two-tailed Wilcoxon signed rank test. All variables are as defined in Appendix A.
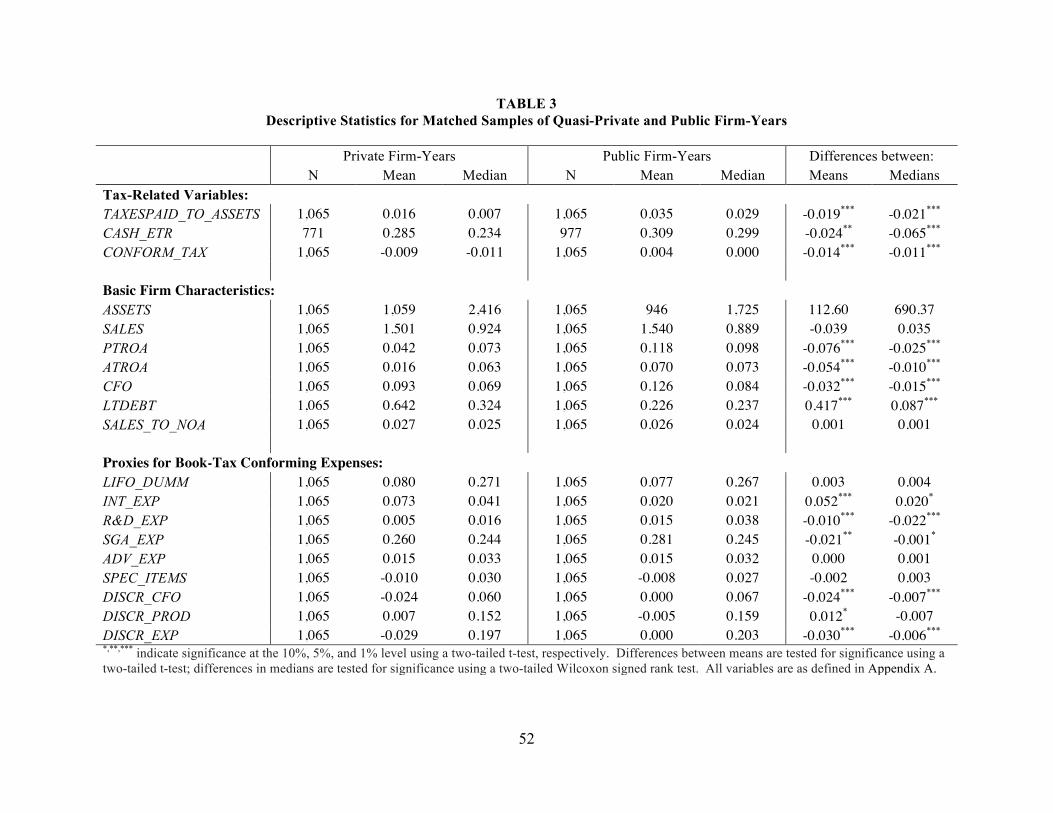
52 !
TABLE 3 Descriptive Statistics for Matched Samples of Quasi-Private and Public Firm-Years
Private Firm-Years Public Firm-Years Differences between: N Mean Median N Mean Median Means Medians Tax-Related Variables: TAXESPAID_TO_ASSETS 1,065 0.016 0.007 1,065 0.035 0.029 -0.019*** -0.021*** CASH_ETR 771 0.285 0.234 977 0.309 0.299 -0.024** -0.065*** CONFORM_TAX 1,065 -0.009 -0.011 1,065 0.004 0.000 -0.014*** -0.011*** Basic Firm Characteristics: ASSETS 1,065 1,059 2,416 1,065 946 1,725 112.60 690.37 SALES 1,065 1.501 0.924 1,065 1.540 0.889 -0.039 0.035 PTROA 1,065 0.042 0.073 1,065 0.118 0.098 -0.076*** -0.025*** ATROA 1,065 0.016 0.063 1,065 0.070 0.073 -0.054*** -0.010*** CFO 1,065 0.093 0.069 1,065 0.126 0.084 -0.032*** -0.015*** LTDEBT 1,065 0.642 0.324 1,065 0.226 0.237 0.417*** 0.087*** SALES_TO_NOA 1,065 0.027 0.025 1,065 0.026 0.024 0.001 0.001 Proxies for Book-Tax Conforming Expenses: LIFO_DUMM 1,065 0.080 0.271 1,065 0.077 0.267 0.003 0.004 INT_EXP 1,065 0.073 0.041 1,065 0.020 0.021 0.052*** 0.020* R&D_EXP 1,065 0.005 0.016 1,065 0.015 0.038 -0.010*** -0.022*** SGA_EXP 1,065 0.260 0.244 1,065 0.281 0.245 -0.021** -0.001* ADV_EXP 1,065 0.015 0.033 1,065 0.015 0.032 0.000 0.001 SPEC_ITEMS 1,065 -0.010 0.030 1,065 -0.008 0.027 -0.002 0.003 DISCR_CFO 1,065 -0.024 0.060 1,065 0.000 0.067 -0.024*** -0.007*** DISCR_PROD 1,065 0.007 0.152 1,065 -0.005 0.159 0.012* -0.007 DISCR_EXP 1,065 -0.029 0.197 1,065 0.000 0.203 -0.030*** -0.006*** *,**,*** indicate significance at the 10%, 5%, and 1% level using a two-tailed t-test, respectively. Differences between means are tested for significance using a two-tailed t-test; differences in medians are tested for significance using a two-tailed Wilcoxon signed rank test. All variables are as defined in Appendix A.

53 !
TABLE 4 Conforming Tax Avoidance Analyses Based on Matched Samples of Quasi-Private and Public Firm-Years
Panel A: Spearman Correlations
CONFORM_ TAX CASH_ETR INT_EXP ADV_EXP R&D_EXP SGA_EXP SPEC_
ITEMS DISCR_
CFO DISCR_ PROD
DISCR_ EXP
PRIVATE -0.285 -0.051 0.627 0.005 -0.165 -0.042 -0.035 -0.184 0.037 -0.074 CONFORM_TAX 0.282 -0.277 0.027 0.043 0.119 0.036 0.411 -0.237 0.161 CASH_ETR -0.052 -0.022 -0.001 0.031 0.030 -0.115 0.006 -0.014 INT_EXP 0.088 -0.130 -0.005 -0.106 -0.222 -0.049 0.000 ADV_EXP -0.095 0.324 -0.013 0.049 -0.213 0.381 R&D_EXP 0.052 -0.050 0.081 -0.088 0.054 SGA_EXP -0.054 0.092 -0.482 0.730 SPEC_ITEMS 0.103 0.022 -0.052 DISCR_CFO -0.324 0.148 DISCR_PROD -0.594 Bold indicates significance at the greater than 10% level based on a two-tailed t-test. All variables are as defined in Appendix A. ! !

54 !
Panel B: Results for Regressions of CONFORM_TAX on Proxies for Book-Tax Conforming Expenses
Predicted Dep. Var. = CONFORM_TAX Dep. Var. = CONFORM_TAX Dep. Var. = CONFORM_TAX
Sign Coefficient T-Statistic Coefficient T-Statistic Coefficient T-Statistic
Intercept 0.007 2.031** 0.008 2.037** 0.006 1.883* PRIVATE - -0.014 -13.916*** -0.008 -5.984*** -0.011 -11.513*** INT_EXP - -0.105 -5.461***
ADV_EXP - -0.010 -1.794*
R&D_EXP ? -0.017 -0.907
SGA_EXP - -0.010 -3.962***
SPEC_ITEMS ? 0.019 0.966
LIFO_DUMM - 0.002 0.937
DISCR_CFO + 0.127 12.879*** DISCR_PROD - -0.016 -3.400*** DISCR_EXP - -0.004 -1.839* ACQUISITION_D ? 0.001 0.468 0.002 1.358 0.002 1.888* LOG_ASSETS ? 0.003 3.026*** 0.004 4.185*** 0.005 5.285***
Adjusted R2 -0.27% -0.28% 0.21%
N 2,130 2,130 2,130 *,**,*** indicate significance at the 10%, 5%, and 1% level using a two-tailed t-test, respectively. The t-statistics have been adjusted to control for clustering by multiple firm observations. All variables are as defined in Appendix A.
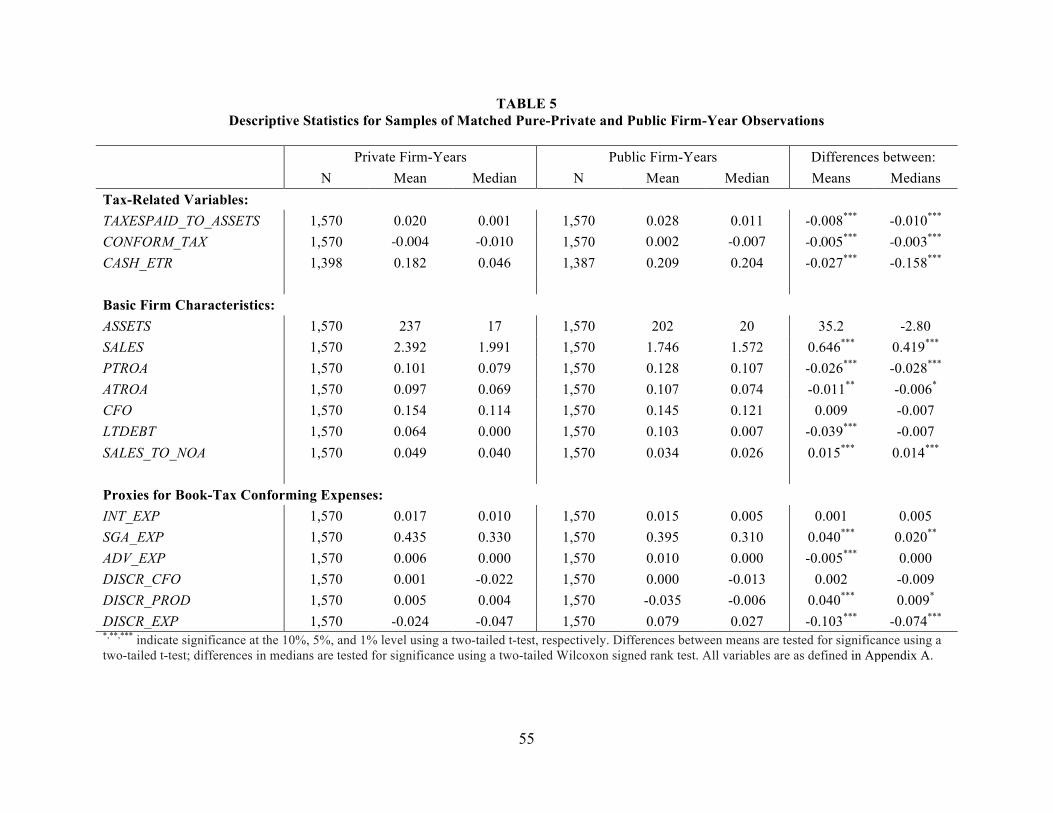
55 !
TABLE 5 Descriptive Statistics for Samples of Matched Pure-Private and Public Firm-Year Observations
Private Firm-Years Public Firm-Years Differences between: N Mean Median N Mean Median Means Medians Tax-Related Variables: TAXESPAID_TO_ASSETS 1,570 0.020 0.001 1,570 0.028 0.011 -0.008*** -0.010*** CONFORM_TAX 1,570 -0.004 -0.010 1,570 0.002 -0.007 -0.005*** -0.003*** CASH_ETR 1,398 0.182 0.046 1,387 0.209 0.204 -0.027*** -0.158*** Basic Firm Characteristics: ASSETS 1,570 237 17 1,570 202 20 35.2 -2.80 SALES 1,570 2.392 1.991 1,570 1.746 1.572 0.646*** 0.419*** PTROA 1,570 0.101 0.079 1,570 0.128 0.107 -0.026*** -0.028*** ATROA 1,570 0.097 0.069 1,570 0.107 0.074 -0.011** -0.006* CFO 1,570 0.154 0.114 1,570 0.145 0.121 0.009 -0.007 LTDEBT 1,570 0.064 0.000 1,570 0.103 0.007 -0.039*** -0.007 SALES_TO_NOA 1,570 0.049 0.040 1,570 0.034 0.026 0.015*** 0.014*** Proxies for Book-Tax Conforming Expenses: INT_EXP 1,570 0.017 0.010 1,570 0.015 0.005 0.001 0.005 SGA_EXP 1,570 0.435 0.330 1,570 0.395 0.310 0.040*** 0.020** ADV_EXP 1,570 0.006 0.000 1,570 0.010 0.000 -0.005*** 0.000 DISCR_CFO 1,570 0.001 -0.022 1,570 0.000 -0.013 0.002 -0.009 DISCR_PROD 1,570 0.005 0.004 1,570 -0.035 -0.006 0.040*** 0.009* DISCR_EXP 1,570 -0.024 -0.047 1,570 0.079 0.027 -0.103*** -0.074*** *,**,*** indicate significance at the 10%, 5%, and 1% level using a two-tailed t-test, respectively. Differences between means are tested for significance using a two-tailed t-test; differences in medians are tested for significance using a two-tailed Wilcoxon signed rank test. All variables are as defined in Appendix A.
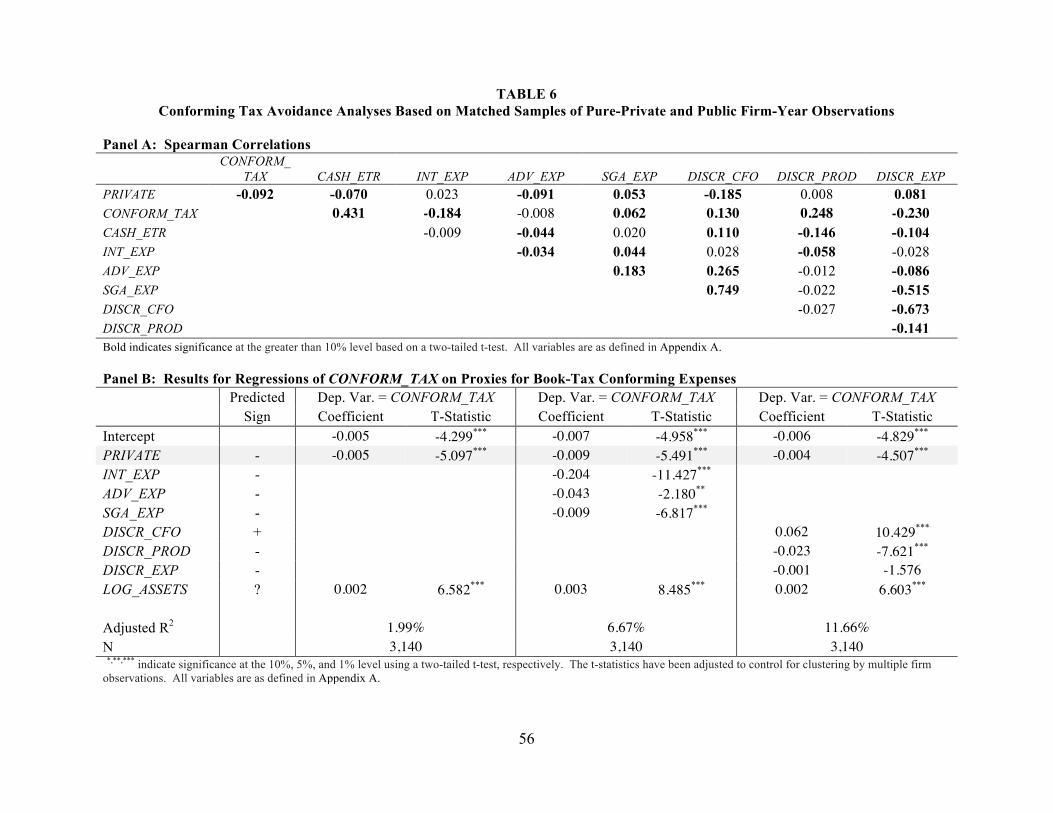
56 !
TABLE 6 Conforming Tax Avoidance Analyses Based on Matched Samples of Pure-Private and Public Firm-Year Observations
Panel A: Spearman Correlations
CONFORM_ TAX CASH_ETR INT_EXP ADV_EXP SGA_EXP DISCR_CFO DISCR_PROD DISCR_EXP
PRIVATE -0.092 -0.070 0.023 -0.091 0.053 -0.185 0.008 0.081 CONFORM_TAX 0.431 -0.184 -0.008 0.062 0.130 0.248 -0.230 CASH_ETR -0.009 -0.044 0.020 0.110 -0.146 -0.104 INT_EXP -0.034 0.044 0.028 -0.058 -0.028 ADV_EXP 0.183 0.265 -0.012 -0.086 SGA_EXP 0.749 -0.022 -0.515 DISCR_CFO -0.027 -0.673 DISCR_PROD -0.141 Bold indicates significance at the greater than 10% level based on a two-tailed t-test. All variables are as defined in Appendix A. Panel B: Results for Regressions of CONFORM_TAX on Proxies for Book-Tax Conforming Expenses Predicted Dep. Var. = CONFORM_TAX Dep. Var. = CONFORM_TAX Dep. Var. = CONFORM_TAX Sign Coefficient T-Statistic Coefficient T-Statistic Coefficient T-Statistic Intercept -0.005 -4.299*** -0.007 -4.958*** -0.006 -4.829*** PRIVATE - -0.005 -5.097*** -0.009 -5.491*** -0.004 -4.507*** INT_EXP - -0.204 -11.427*** ADV_EXP - -0.043 -2.180** SGA_EXP - -0.009 -6.817*** DISCR_CFO + 0.062 10.429*** DISCR_PROD - -0.023 -7.621*** DISCR_EXP - -0.001 -1.576 LOG_ASSETS ? 0.002 6.582*** 0.003 8.485*** 0.002 6.603*** Adjusted R2 1.99% 6.67% 11.66% N 3,140 3,140 3,140 *,**,*** indicate significance at the 10%, 5%, and 1% level using a two-tailed t-test, respectively. The t-statistics have been adjusted to control for clustering by multiple firm observations. All variables are as defined in Appendix A.
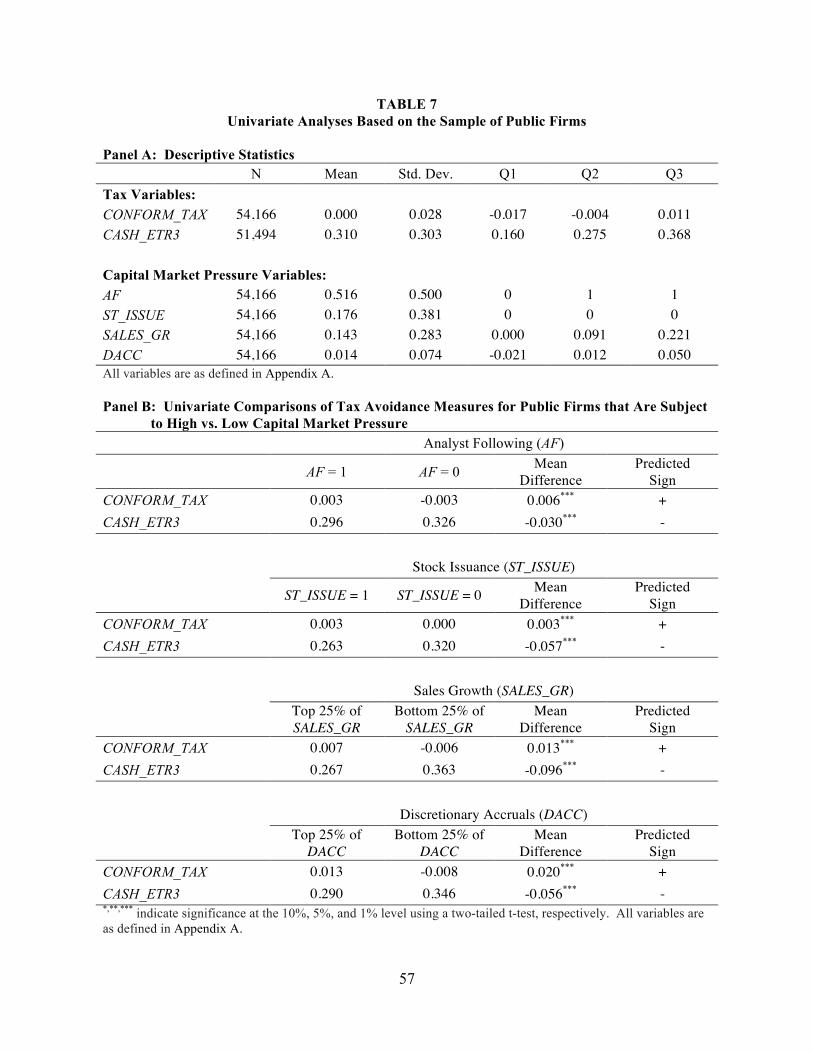
57 !
TABLE 7 Univariate Analyses Based on the Sample of Public Firms
Panel A: Descriptive Statistics
N Mean Std. Dev. Q1 Q2 Q3 Tax Variables: CONFORM_TAX 54,166 0.000 0.028 -0.017 -0.004 0.011 CASH_ETR3 51,494 0.310 0.303 0.160 0.275 0.368 Capital Market Pressure Variables: AF 54,166 0.516 0.500 0 1 1 ST_ISSUE 54,166 0.176 0.381 0 0 0 SALES_GR 54,166 0.143 0.283 0.000 0.091 0.221 DACC 54,166 0.014 0.074 -0.021 0.012 0.050 All variables are as defined in Appendix A. Panel B: Univariate Comparisons of Tax Avoidance Measures for Public Firms that Are Subject
to High vs. Low Capital Market Pressure Analyst Following (AF)
AF = 1 AF = 0 Mean Difference
Predicted Sign
CONFORM_TAX 0.003 -0.003 0.006*** + CASH_ETR3 0.296 0.326 -0.030*** - Stock Issuance (ST_ISSUE)
ST_ISSUE = 1 ST_ISSUE = 0 Mean Difference
Predicted Sign
CONFORM_TAX 0.003 0.000 0.003*** + CASH_ETR3 0.263 0.320 -0.057*** - Sales Growth (SALES_GR)
Top 25% of SALES_GR
Bottom 25% of SALES_GR
Mean Difference
Predicted Sign
CONFORM_TAX 0.007 -0.006 0.013*** + CASH_ETR3 0.267 0.363 -0.096*** - Discretionary Accruals (DACC)
Top 25% of DACC
Bottom 25% of DACC
Mean Difference
Predicted Sign
CONFORM_TAX 0.013 -0.008 0.020*** + CASH_ETR3 0.290 0.346 -0.056*** - *,**,*** indicate significance at the 10%, 5%, and 1% level using a two-tailed t-test, respectively. All variables are as defined in Appendix A.

58 !
TABLE 8 Results for Seemingly-Unrelated Regressions of Tax Avoidance Measures on Proxies for Capital Market Pressure
Predicted
(1) Dependent Variable =
CONFORM_TAX Predicted
(2) Dependent Variable =
CASH_ETR3 Sign Coefficient T-Statistic Sign Coefficient T-Statistic
Intercept -0.003*** -3.208 0.342*** 31.747
SALES_GR + 0.016*** 35.842 - -0.084*** -16.534
AF + 0.006*** 20.843 - -0.019*** -6.519
ST_ISSUE + 0.001*** 3.926 - -0.020*** -5.097
DACC + 0.102*** 61.399 - -0.287*** -15.231
ACQUISITION_D ? 0.004*** 11.533 ? -0.009** -2.479
INT_EXP - -0.176*** -31.482
PPE - -0.005 -1.491
LOG_ASSETS ? 0.000*** -3.383 ? -0.003*** -3.855
Industry FE? Yes Yes
Year FE? Yes Yes
Adjusted R2 13.06% 3.71%
N 51,494 51,494 *,**,*** indicate significance at the 10%, 5%, and 1% level using a two-tailed t-test, respectively. The t-statistics have been adjusted to control for clustering by multiple firm observations. All variables are as defined in Appendix A.

59 !
TABLE 9 Descriptive Statistics for Simulated CONFORM_TAX Data
Level of Seed N Standard Dev Q1 Mean Q2 Q3
CONFORM_TAX 47,977 0.0276 -0.0173 0.0000 -0.0046 0.0107 CONFORM_TAX_SEED 1% 47,977 0.0271 -0.0174 -0.0004 -0.0047 0.0103 Difference 0.0005 *** 0.0001 * CONFORM_TAX 47,977 0.0276 -0.0173 0.0000 -0.0046 0.0107 CONFORM_TAX_SEED 3% 47,977 0.0267 -0.0178 -0.0010 -0.0051 0.0096 Difference 0.0010 *** 0.0005 ** CONFORM_TAX 47,977 0.0276 -0.0173 0.0000 -0.0046 0.0107 CONFORM_TAX_SEED 5% 47,977 0.0263 -0.0182 -0.0016 -0.0054 0.0089 Difference 0.0016 *** 0.0009 *** *,**,*** indicate significance at the 10%, 5%, and 1% level using a two-tailed t-test, respectively. The t-statistics have been adjusted to control for clustering by multiple firm observations. All variables are as defined in Appendix A.