Conflicts of Interests Among Shareholders - EFMA ANNUAL MEETINGS/2011 … · facilities, term...
47
Debt Specialization * Paolo Colla Università Bocconi † Filippo Ippolito Università Bocconi ‡ Kai Li University of British Columbia § This version: September, 2010 First version: October, 2009 * We thank Miguel Ferreira, Mark Flannery, Emilia Garcia, Mike Lemmon, Dave Mauer, Michael Meloche, Gordon Phillips, Zacharias Sautner, Philip Valta, seminar participants at the New University of Lisbon (Nova), University Carlos III de Madrid, Universitat Pompeu Fabra, Stockholm School of Economics and SIFR, and conference participants at the 6 th Portuguese Finance Network Conference (Azores), the 2010 China International Conference in Finance (Beijing), the ESSFM Conference (Gerzensee), and the European Finance Association Meetings (Frankfurt) for helpful comments. We thank Milka Dimitrova and Huasheng Gao for excellent research assistance. Li acknowledges the financial support from the Social Sciences and Humanities Research Council of Canada. All remaining errors are our own. † Department of Finance-2-D2-08, Università Bocconi, Via G. Röntgen, 20136 Milano, Italy, (+39) 02.5836.5346, [email protected]. ‡ Department of Finance-2-D2-02, Università Bocconi, Via G. Röntgen, 20136 Milano, Italy, (+39) 02.5836.5918, [email protected]. § Sauder School of Business, University of British Columbia, 2053 Main Mall, Vancouver, BC V6T 1Z2, 604.822.8353, [email protected].
Transcript of Conflicts of Interests Among Shareholders - EFMA ANNUAL MEETINGS/2011 … · facilities, term...

Debt Specialization*
Paolo Colla
Università Bocconi†
Filippo Ippolito
Università Bocconi‡
Kai Li
University of British Columbia§
This version: September, 2010 First version: October, 2009
* We thank Miguel Ferreira, Mark Flannery, Emilia Garcia, Mike Lemmon, Dave Mauer, Michael Meloche, Gordon
Phillips, Zacharias Sautner, Philip Valta, seminar participants at the New University of Lisbon (Nova), University
Carlos III de Madrid, Universitat Pompeu Fabra, Stockholm School of Economics and SIFR, and conference
participants at the 6th
Portuguese Finance Network Conference (Azores), the 2010 China International Conference in
Finance (Beijing), the ESSFM Conference (Gerzensee), and the European Finance Association Meetings (Frankfurt)
for helpful comments. We thank Milka Dimitrova and Huasheng Gao for excellent research assistance. Li
acknowledges the financial support from the Social Sciences and Humanities Research Council of Canada. All
remaining errors are our own. † Department of Finance-2-D2-08, Università Bocconi, Via G. Röntgen, 20136 Milano, Italy, (+39) 02.5836.5346,
[email protected]. ‡ Department of Finance-2-D2-02, Università Bocconi, Via G. Röntgen, 20136 Milano, Italy, (+39) 02.5836.5918,
Sauder School of Business, University of British Columbia, 2053 Main Mall, Vancouver, BC V6T 1Z2,
604.822.8353, [email protected].
Debt Specialization
Abstract
This paper provides the first large sample evidence on the patterns and determinants of debt
structure using a new database of publicly listed U.S. firms. Within what is generally referred to
as debt financing, we are able to distinguish between commercial paper, revolving credit
facilities, term loans, senior and subordinated bonds and notes, and capital leases. We first show
that most of the sample firms concentrate their borrowing in only one of these debt instruments,
and only the low growth, low risk large firms with high profitability and the highest level of
leverage borrow through multiple debt instruments. We then show that the extent of debt
specialization is increasing in firm growth opportunities, cash flow risk, and asset maturity, while
decreasing in asset tangibility. Finally, we find that firm characteristics that are known to be
associated with their leverage decisions also affect their usage of different debt instruments. Our
paper suggests that debt structure decisions, like capital structure decisions, are made based on a
cost and benefit analysis to maximize firm value.
Keywords: debt specialization, debt structure, commercial paper, revolving credit facilities, term
loans, senior bonds and notes, subordinate bonds and notes, capital leases
JEL classification: G32

I. Introduction
Much attention has been devoted to the issues of why firms choose between equity and debt, and
how optimal capital structure is designed to minimize the cost of financing (see the survey by
Frank and Goyal (2008) of the voluminous literature on capital structure). In this paper, we focus
on a much less studied topic in capital structure, namely debt structure. Our goals are to explore
the types of debt commonly employed by public U.S. companies, and to relate their usage to the
costs and benefits of different types of debt financing. To our knowledge, our paper is the first to
provide large sample evidence on the subject.
The existing literature suggests a number of important and as of yet unanswered
questions concerning the patterns and determinants of debt structure: How are different types of
debt used in practice to meet corporate funding needs? Do firms tend to specialize in one or two
debt instruments, or do they borrow simultaneously from a variety of sources? How do these
choices vary with firm characteristics, such as their asset maturity structure and their access to
the public bond markets?
To answer these questions, we take advantage of a new database available through
Capital IQ, an affiliate of the Standard and Poor’s, to examine debt structure of publicly listed
U.S. firms.1 Within what is generally referred to as debt financing, we are able to distinguish
between commercial paper, revolving credit facilities, term loans, senior and subordinated bonds
and notes, and capital leases. After merging the Capital IQ database with the Compustat
database, we end up with a large panel data set that comprises 16,115 firm-year observations
involving 3,296 unique firms for the period 2002-2009. In addition to information on debt
structure, the sample also contains leverage and other firm characteristics (e.g., firm size and
profitability).
1 The SEC mandated electronic submission of SEC filings in 1996. Capital IQ has been collecting information about
debt structure since then. The coverage has much improved since 2002 which is the starting point of our sample
period.

2
Our first main finding is that firms specialize in their borrowing: Most sample firms
concentrate their borrowing in only one of the above debt instruments. As primarily an
exploratory exercise, we use cluster analysis to search for patterns of debt structure. We identify
six distinctly different groups of firms: Five of them are predominant users of one single debt
instrument, while only one group relies simultaneously on more than one debt instrument. This
last group is mainly composed of the low growth, low risk large firms with high profitability and
the highest level of leverage. The evidence is suggestive that the average public U.S. firm
specializes in borrowing one type of debt to meet its funding needs.
To further corroborate the above finding, we analyze conditional debt structure. We
require firms to allocate a significant fraction of their debt to a given type of debt, and then
examine the composition of their debt structure under this condition. We find that the majority of
firms rely overwhelmingly on only one type of debt; specifically, the one which we have
conditioned upon. For example, conditioning for firms to have more than 30% of their debt in
term loans, we find that among this subset of firms term loans represent over 70% of their debt.
We show that this result is robust to different specifications of the conditioning threshold.
Second, we find that a key factor for understanding debt structure is credit quality. We
show that debt structure varies substantially between not only rated and unrated firms but also
across firms with different credit ratings: Large and high credit quality firms tend to have access
to different sources of financing, while small and unrated firms rely exclusively on either capital
leases or bank debt for financing. Further, there are some significant non-linear relations between
actual credit ratings and types of debt beyond the usual categorization of firms being rated or not:
For example, the amount of senior bonds and notes is increasing in credit quality, peaks at the
rating of A, and then is decreasing in credit quality as the latter further improves. Faulkender and
Petersen (2006) show that firms that do not have access to the public debt markets, as measured
by not having a debt rating, tend to have lower debt ratios. Our finding highlights that the actual

3
credit rating, a comprehensive measure of firm credit worthiness, affects firm access to different
sources of financing as well.
Third, we analyse the determinants of debt specialization and find that the extent of debt
specialization is decreasing in asset tangibility, while increasing in market-to-book (M/B) ratios,
cash flow volatility, and asset maturity. Interestingly, we also observe that the most recent
financial crisis had a strong impact on firms’ increasing adoption of debt specialization.
Finally, we address the question of how choices of different debt instruments vary with
firm characteristics. We rely on some recent papers in capital structure (see for example, Fama
and French (2002) and Lemmon, Roberts and Zender (2008)) to identify firm characteristics that
are known to be associated with cross-sectional variations in leverage, including profitability,
asset tangibility, M/B ratios, firm size, cash flow volatility, the dividend payer dummy variable,
asset maturity, and firm age. We find that the effects these firm characteristics have on leverage
and on different debt instruments can vary substantially. For example, the previous literature has
established that profitability is negatively and significantly associated with leverage as predicted
by the pecking order theory. Our analysis further shows that this negative association is mainly
driven by three types of debt: senior and subordinated bonds and notes, and capital leases. In
contrast, profitability is positively and significantly associated with commercial paper and
revolving lines of credit. We also show that asset maturity is negatively and significantly
associated with revolving lines of credit and capital leases, while positively and significantly
associated with senior and subordinated bonds and notes. These results indicate that using a
gross measure of leverage such as total debt can be misleading, as it hides heterogeneity across
different debt instruments. The evidence supports our conjecture that debt structure decisions,
like capital structure decisions, are made based on a cost and benefit analysis to maximize firm
value.
Our paper is closely related to and motivated by Rauh and Sufi (2010) who examine
types, sources, and priorities of debt using a sample of 305 randomly selected non-financial rated

4
public firms for the period 1996-2006 (2,453 firm-year observations). They show that almost
three quarters of their firm-year observations employ more than two different debt instruments,
and that a quarter of the sample firms has no significant one-year change in their level of debt but
significant changes in their debt composition. Further, high credit quality firms (BBB and higher)
primarily use two tiers of capital: equity and senior unsecured debt. Low credit quality firms (BB
and lower) tend to use several tiers of debt including secured, senior unsecured, and subordinated
issues.
Our work differs from Rauh and Sufi (2010) in the following aspects. First, our much
larger sample allows us to examine the financing patterns of unrated firms as well—these
represent over 60% of our firm-year observations and 9% of the total assets of our sample firms,
and thus account for an important part of the overall economy. By contrast, Rauh and Sufi’s
sample is limited to rated firms. Second, as a result of our broader sample, we are able to
uncover the phenomenon of debt specialization in firm financing behavior, which is otherwise
unobservable. Indeed, Rauh and Sufi conclude that financing through multiple sources of debt is
the norm among large and rated firms in their sample, which we confirm only among a
subsample of our firms. Moreover, we also show that smaller firms with no or poor credit ratings
borrow through only one type of debt. Finally, we examine the determinants of this debt
specialization phenomenon that we uncover.
The outline of the paper is as follows. Section II reviews the related literature and
develops our hypotheses. Section III describes our data and sample, and provides an overview of
debt structure in our sample firms. Section IV presents evidence on the extent of debt
specialization. Section V provides our explanations for the observed financing pattern. Section
VI carries out various robustness checks on our main results. Finally, Section VII summarizes
our findings and concludes.
II. Literature Review and Hypothesis Development

5
How should firms choose their capital structure? In the ideal world of Modigliani-Miller
(1958, 1963), capital structure choices are irrelevant for firm value and so any choice is optimal.
Starting from Miller (1977), finance researchers have reassessed the ―irrelevance‖ result by
reintroducing various market frictions that make firm value dependent on capital structure
choices. Among these frictions, bankruptcy costs, taxes, agency problems, and information
asymmetries are the most well studied (see Myers (2001) for an excellent review). By trading off
the costs and benefits of debt financing, firms with different characteristics employ different
levels of debt at which firm value is maximized.
Extending the optimal capital structure perspective to debt structure choices, we expect
debt structure to vary across firms with different characteristics that capture different costs and
benefits associated with a particular debt type. Indeed, the existing literature on firms’ usage of
different types of debt shows that debt instrument choices depend on, by and large, the same
factors that affect capital structure choices. In this section we review the literature that suggests
that debt specialization happens from a cost and benefit analysis based on firm heterogeneity.
A. Commercial Paper
Although to our knowledge there is no theoretical work specific to commercial paper,
there is ample empirical evidence identifying firm size and default risk as the main firm
characteristics associated with its usage: Only large firms with strong credit ratings have the
opportunity to access the commercial paper market. Kahl, Shivdasani, and Wang (2008) suggest
that commercial paper represents a state-contingent funding source that partially substitutes the
need for precautionary cash holdings. Gao and Yun (2009) examine the interplay between
precautionary cash holdings and commercial paper during the recent financial crisis. They find
that the aggregate commercial paper borrowing declined 15% after the collapse of Lehman
Brothers, but the effect was concentrated among firms with high default risk. These high default

6
risk firms drew heavily from existing lines of credit to substitute lost borrowing from the
commercial paper market. Using large firm size and old firm age to proxy for low default risk,
our first hypothesis with respect to commercial paper is:
H1: The use of commercial paper is increasing in firm size, age, and credit ratings.
B. Revolving Credit Facilities
The literature on revolving credit examines why firms are granted a credit line and why
they draw down on it. Holmström and Tirole (1998), DeMarzo and Sannikov (2006), and
DeMarzo and Fishman (2010) show that credit lines help reduce the trade-off between inefficient
liquidation and moral hazard. A firm cannot wait to borrow funds after a liquidity shock is
realized. The optimal liquidity policy can be implemented either in terms of precautionary cash
holdings, or in terms of an irrevocable line of credit. Empirically, Jiménez, López, and Saurina
(2008) and Sufi (2009) show that drawdowns on credit lines increase as firm financial conditions
worsen. Ivashina and Scharfstein (2009) further show that drawdowns on existing credit lines
increased drastically during the 2008 financial crisis.
This literature suggests that firms with high agency costs and high cash flow uncertainty
are more in need of a credit line. However, these very firms are also more likely to draw down
on the credit line when their financial conditions worsen. Anticipating this, banks offer a credit
line only to firms with low agency costs and low cash flow uncertainty. Using the M/B ratio to
proxy for agency costs, and cash flow volatility to proxy for cash flow uncertainty, our second
hypothesis with respect to revolving credit facilities is thus:
H2: The use of revolving lines of credit is decreasing in M/B ratios and cash flow volatility.
C. Bank versus Bond Financing
7
There is a large theoretical literature that examines the trade-off between bank versus
bond financing. Diamond (1991) first introduces the idea that the choice between borrowing
directly (through issuing corporate bonds, without monitoring) and borrowing through a bank
where monitoring is primarily driven by the lender’s need to reduce moral hazard. Chemmanur
and Fulghieri (1994) further demonstrate that banks’ desire to acquire a reputation for making
the ―right‖ renegotiation versus liquidation decision provides them incentives to devote a larger
amount of resources than bondholders toward such evaluations. In equilibrium, bank loans
dominate bonds from the point of view of minimizing inefficient liquidation; however, firms
with a lower probability of financial distress choose bonds over bank loans. Along similar lines,
Bolton and Freixas (2000) show that firms turn to banks as a source of financing mainly because
banks are good at helping them through times of financial distress. In equilibrium the riskier
firms prefer bank loans, the safer ones tap the bond markets, and the ones in between issue both
equity and bonds.
The empirical evidence mostly provides support for the above key idea that banks
specialize in lending to firms with higher agency and liquidation costs. Houston and James (1996)
show that reliance on bank borrowing is decreasing in firm size, growth opportunities, leverage,
and the firm’s access to public debt markets. Johnson (1997) finds that firms use more public
debt if they have lower information and monitoring costs, lower likelihood and costs of
inefficient liquidation, and weaker incentives to harm the lenders. Hadlock and James (2002)
show that firms are more likely to choose bank loans when asymmetric information problems are
elevated. Cantillo and Wright (2000) find that large companies with abundant cash and collateral
tap credit markets directly; and these markets cater to safe and profitable industries.
In summary, the prior literature suggests that firms with lower monitoring needs and
better fundamentals prefer public debt to bank financing. We expect monitoring needs to be
lower for firms with larger size, higher asset tangibility, higher growth opportunities, and higher

8
credit ratings. Hence our third hypothesis with respect to the choice between bank debt and
public debt is:
H3: The use of bank debt is decreasing in asset tangibility, M/B ratios, firm size, and credit
ratings; while the use of public debt is increasing in asset tangibility, M/B ratios, firm size, and
credit ratings.
D. Capital Leases
The final strand of literature examines leases and shows that the use of leases induces a
trade-off between lower liquidation costs and higher agency costs. Eisfeldt and Rampini (2010)
show that there are two mechanisms at work in a lease: 1) leasing allows the lessor (owner) to
repossess the asset when the lessee files for bankruptcy, which gives the lessor a stronger claim
than that of secured lenders; 2) leasing entails agency costs, as the lessee retains control while
the lessor keeps ownership (separation of ownership and control). They predict that firms that are
financially constrained prefer to lease an asset, while firms that are less constrained prefer to own
the asset. Krishnan and Moyer (1994) document that lessee firms have low retained earnings,
high growth rates, low coverage ratios, and in general a high bankruptcy risk. Yan (2006) further
shows that leases and debt are substitutes and that in those firms with more growth options or
larger marginal tax rates, or in those firms paying no dividends, the substitutability is more
pronounced.
In summary, the existing theory and evidence on capital leases suggest that financially
constrained firms with high growth and high risk are the best candidates for borrowing through
leases, and hence our final hypothesis with respect to capital leases is:
H4: The use of capital leases is decreasing in profitability, dividend payout, and credit ratings,
while increasing in M/B ratios and cash flow volatility.

9
III. Data Overview
A. Sample Description
We start with U.S. firms traded on AMEX, NASDAQ, and NYSE covered by both
Capital IQ (CIQ) and Compustat from 2002 to 2009. CIQ compiles detailed information on
capital structure and debt structure by going through financial footnotes contained in firms’ 10K
SEC filings.2 We remove utilities (SIC codes 4900-4949) and financials firms (SIC codes 6000-
6999) and end up with 27,802 firm-year observations. We further remove 1) firm-years with
missing value of total assets (26,729 observations remaining); 2) firm-years with zero total debt
(19,142 observations remaining); 3) firm-years with market or book leverage outside the unit
interval (as in Lemmon, Roberts and Zender (2008), 17,572 observations remaining); and 4)
firm-years for which the difference between total debt as reported in Compustat and the sum of
debt types as reported in CIQ exceeds 10% of total debt. Our final sample has 16,115 firm-year
observations involving 3,296 unique firms.
In constructing our variables we use the same definitions as in Lemmon, Roberts and
Zender (2008). Table A1 in the Appendix provides a detailed description of the variables used in
our analysis. Total assets are expressed in millions of 2002 U.S. dollars.
Table 1 presents descriptive statistics. Columns (1) and (2) report means and medians of
the key firm characteristics aggregated across all years for our sample firms. Columns (3) and (4)
present means and medians of the same key firm characteristics for the Compustat leveraged
firms, i.e., firms with positive debt. This Compustat sample is formed by imposing similar filters
as to our sample except filter 4) above. Our sample covers approximately 90% of the Compustat
leveraged firms. Columns (5) and (6) test whether our sample is different from the Compustat
leveraged firms.
2 Regulation S-X requires firms to detail their long-term debt instruments. Regulation S-K requires firms to discuss
their liquidity, capital resources, and operating results. As a result of these regulations, firms detail their long-term
debt issues and bank revolving credit facilities. Firms often also provide information on notes payable within a year
(Rauh and Sufi (2010)).

10
We show that over the sample period 2002-2009, the mean (median) market leverage as
measured by the ratio of total debt to the sum of total debt and market value of equity is 0.252
(0.195). Using a sample of non-financial, non-utility firms from Compustat over the period 1986-
2000, Faulkender and Petersen (2006) report that the mean (median) market leverage is 0.222
(0.183) for leveraged firms. In comparison to the Compustat leveraged firm sample, our sample
firms are not significantly different in most dimensions compared except dividend payout
(although the economic significance of this difference is small). We conclude that our sample is
representative of the Compustat leveraged firms.
B. Debt Structure Overview
CIQ decomposes total debt into seven mutually exclusive debt types: commercial paper
(CP), drawn revolving credit facilities (RC), term loans (TL), senior bonds and notes (SBN),
subordinated bonds and notes (SUB), capital leases (CL),3 and other debt (Other).
4 Table A2 in
the Appendix provides an example illustrating how CIQ collects and constructs the various debt
types. Table 2 provides detailed summary statistics for debt types (normalized by total debt).
Panel A of Table 2 shows that first, the majority of sample firms rely on senior bonds and
notes for financing. The sample mean (median) ratio of senior bonds and notes to total debt (TD)
is 0.382 (0.208). Second, the median ratios of both revolving credit and term loans to total debt
are close to zero or zero, while the 75th
percentiles are much greater than zero; suggesting that
between a quarter and half of the sample firms rely on revolving credit facilities or term loans,
both provided by banks. When adding up both debt instruments to obtain total bank debt, we find
3 Capital leases are different from operating leases. While in an operating lease, lease expenses are treated as an
operating cost, a capital lease is recognized both as an asset and as a liability on the balance sheet, and is thus
subject to depreciation. Typically, firms prefer to keep leases off the books and defer expenses, which gives them
the incentive to report all leases as operating leases. As a result, the Financial Accounting Standards Board has ruled
the conditions under which a lease should be reported as a capital lease. Though often disregarded in the existing
literature, the distinction between capital and operating leases is important for our purposes. In our analysis of debt
we will only consider capital leases, as operating leases are not reported as debt on the balance sheet. 4 Other debt mostly consists of short-term borrowings. Occasionally, it takes other forms such as deferred credits,
fair value adjustments related to hedging contracts, or trust-preferred securities.

11
that more than half of the sample firms employ bank debt, with the sample mean (median) at
0.431 (0.322) (untabulated). Third, more than a quarter of the sample firms employ capital
leases, even though they are much less important on average than bank debt. The sample mean
ratio of capital leases to total debt is 0.054, while that of revolving credit (term loans) is 0.220
(0.212). Fourth, less than a quarter of the sample firms use subordinated bonds and notes. Lastly,
the 90th
percentile of commercial paper is zero (untabulated), suggesting that less than 10% of
the sample firms use commercial paper for financing.
Total adjustment is the difference between the total debt variable obtained from
Compustat and the sum of seven debt instruments from CIQ. When forming our sample, we have
imposed the filter that the total adjustment for firms in the sample be less than 10% of total debt.
After applying this filter, there is little discrepancy between the sum of debt instruments from
CIQ and total debt from Compustat: Both the mean and median ratios of total adjustment to total
debt are zero, and the 1st and 99
th percentiles are -0.029 and 0.038, respectively. These statistics,
together with our sample’s broad coverage of the Compustat leveraged firms, are reassuring
about the CIQ’s data quality.
To capture the extent of firms’ concentrated use of different debt instruments, for firm i
in year t we first compute the sum of the squared ratios of seven debt instruments to total debt
outstanding:
2
t,i
t,i
2
t,i
t,i
2
t,i
t,i
2
t,i
t,i
2
t,i
t,i
2
t,i
t,i
2
t,i
t,i
t,i
TD
Other
TD
CL
TD
SUB
TD
SBN
TD
TL
TD
RC
TD
CPSS
(1)
We then normalize SS to get the normalized Herfindahl-Hirschman Index (henceforth simply
referred to as HHI):
711
71SS
HHIt,i
t,i
(2)

12
Thus, a firm that employs exclusively one single debt instrument has HHI equals one, while HHI
equals zero for a firm that simultaneously employs all seven debt instruments in equal
proportions. Higher HHI values indicate firms’ tendency to specialize in fewer debt instruments.
Complementary to HHI, we also compute another specialization measure, the Shannon
Entropy (henceforth referred to as Entropy):
t,i
t,i
t,i
t,i
t,i
t,i
t,i
t,i
t,i
t,i
t,i
t,i
t,i
t,i
t,i
t,i
t,i
t,i
t,i
t,i
t,i
t,i
t,i
t,i
t,i
t,i
t,i
t,i
t,i
TD
Otherln
TD
Other
TD
CLln
TD
CL
TD
SUBln
TD
SUB
TD
SBNln
TD
SBN
TD
TLln
TD
TL
TD
RCln
TD
RC
TD
CPln
TD
CPEnt
(3)
This ranges from zero (for firms specialized in borrowing through one debt instrument for all
their financing needs) to ln(7) 1.946 (for firms diversified in borrowing across all seven debt
instruments in equal proportions).
Table 2 Panel A shows that the mean (median) HHI is 0.702 (0.729) while for Entropy
the mean (median) is 0.434 (0.426). Moreover, about one fourth of our sample firms have HHI
values close to unity (or equivalently Entropy values close to zero), suggesting that firms have a
great tendency to specialize in one debt instrument.
Table 2 Panel B presents the time series evidence on debt types as well as our two
specialization measures. We find that firms appear to rely more on bank financing (both
revolving credit and term loans) and less on commercial paper, subordinated bonds and notes,
and capital leases over the sample period. Their use of senior bonds and notes and other debt has
been stable over time. Furthermore, there is a moderate increase in the degree of debt
specialization over time: the mean HHI (Entropy) is 0.676 (0.476) in 2002 and increases
(decreases) to 0.719 (0.407) in 2009. The observed temporal variation motivates our introduction
of year fixed effects in our multivariate analysis later.
In summary, although there are many different debt instruments, for our sample of firms,
senior bonds and notes are the most commonly employed debt instrument, followed by revolving

13
credit and term loans. Moreover, many sample firms tend to rely heavily on only one debt
instrument for meeting their financing needs. In the rest of the paper, we provide a more detailed
investigation of the patterns and determinants of debt structure.
C. Credit Ratings and Debt Structure
The literature has previously examined the relation between credit ratings and leverage.
Diamond (1991), Chemmanur and Fulghieri (1994), and Bolton and Freixas (2000) have shown
that credit quality is the primary source of variation driving a firm’s optimal choices of different
types of debt. Faulkender and Petersen (2006) examine the role of the source of capital in firms’
financing decisions, and show that firms with access to public bond markets (as measured by
being rated) have substantially more debt. Kisgen (2006) finds that firm credit ratings affect
capital structure decisions: Firms near a credit rating upgrade or downgrade issue less debt.
Lemmon and Zender (2009) use the likelihood of being rated as a proxy for debt capacity and
show that after accounting for debt capacity, the pecking order appears to be a good description
of a firm’s financing behavior. Rauh and Sufi (2010) document that high credit quality firms
(BBB and higher) rely almost exclusively on two tiers of capital—equity and senior unsecured
debt—while lower credit quality firms (BB and lower) use multiple tiers of debt including
secured, senior unsecured, and subordinated issues.
Motivated by this prior body of work, Table 3 presents an overview of the relation
between credit ratings and debt structure. We consider a firm-year to be rated if the firm has at
least one monthly Standard & Poor’s long-term issuer rating, as recorded in Compustat (data
item 280). About 40% of our firm-year observations are unrated. In untabulated analysis, we find
that there is little temporal variation in the fraction of firms being rated over time.5
5 Using Compustat firms over the period 1986-2000, Faulkender and Petersen (2006) show that only 19% (21%) of
firms (with positive debt) have debt ratings. They conclude that public debt is uncommon. In unreported analysis,
we find that rated firms in our sample are larger (both in terms of sales and book value of assets), and have a higher
book leverage ratio than those in Faulkender and Petersen (2006). This is consistent with Lemmon and Zender’s

14
Panel A of Table 3 presents differences in the use of various debt types between unrated
and rated firms in our sample. We show that revolving credit facilities and term loans together,
on average, account for more than half of unrated firms’ total debt, while senior bonds and notes
account for slightly less than 25% of their total debt. Rated firms are much heavier users of
senior and subordinated bonds and notes. Unrated firms are much heavier users of capital leases.
Further, we show that unrated firms are more specialized in borrowing than rated firms, as
captured by both the HHI and Entropy measures. At the bottom of Panel A, we also present
sample mean (median) market leverage of unrated and rated firms. Consistent with Faulkender
and Petersen (2006), we show that unrated firms—with a mean (median) market leverage ratio of
0.210 (0.148)—tend to employ less debt than rated firms—who have a mean (median) market
leverage ratio of 0.319 (0.275). Overall, unrated firms use significantly less commercial paper as
well as senior and subordinated bonds and notes; and significantly more revolving credit, term
loans, and capital leases than their rated counterparts—suggesting that both banks and lessors
have a comparative advantage in dealing with information asymmetry and moral hazard
associated with unrated firms (Diamond (1991), Chemmanur and Fulghieri (1994), and Eisfeldt
and Rampini (2010)).
To further examine the relation between actual credit ratings and debt structure, we first
assign to each monthly S&P letter rating class an integer number ranging from 1 (AAA) to 22
(D). Then, for each rated firm-year we round the average monthly numeric rating class to the
nearest integer, and refer to it as the firm rating in a given year. We find that about 6% of our
firm-years have a credit rating of A and higher, while close to 16% of our sample firms have
investment grade ratings (equal to or higher than BBB-, untabulated).6
(2009) finding that large firms with high leverage are more likely to be rated. Focusing on 305 randomly chosen
Compustat firms with a long-term issuer rating in at least one year from 1996-2006, Rauh and Sufi (2010) show that
three-quarters of their firm-year observations are rated. 6 Using Compustat firms from 1986-2001, Kisgen (2006) shows that 44.2% of his sample firms have a credit rating
of A and higher, and 69.1% of his sample have investment grade ratings. Rauh and Sufi (2010) report 21.7% of their
firms have a credit rating of A and higher, and close to half have investment grade ratings. The difference in rating

15
Panel B of Table 3 provides an overview of differences in the usage of various debt types
(as a share of total debt) across a broad rating spectrum. We first show that commercial paper is
used almost exclusively by investment grade firms, especially AAA- and AA-rated firms.
Second, term loans and subordinated bonds and notes are most heavily used by speculative grade
(equal to or lower than BB-) firms. Third, we document a non-linear relation between credit
quality and the amount of senior bonds and notes used by our sample firms: The amount of
senior bonds is increasing in credit quality, peaks at the rating of A, and then is decreasing in
credit quality. Finally, we find that firms belonging to lower rating classes are characterized by
higher values of HHI (and lower values of Entropy), suggesting that the extent of debt
specialization is decreasing in credit quality.
We conclude that credit quality affects both the composition of debt structure and the
extent of debt specialization. Later in our multivariate analyses, we will include dummy
variables for each different rating class and for firms being unrated to control for the complex
relation between credit ratings and debt structure.7
D. Industries and Debt Structure
Table 4 presents an overview of the relation between two-digit SIC codes and debt
structure and debt specialization measures. The top three most represented industries are
Chemicals and Allied Products (10.45%), Business Services (9.80%), and Electronic Equipment
(8.17%). These three industrial sectors exhibit similar levels of specialization, as captured by
both the HHI and Entropy measures. The three industries with the highest level of debt
specialization are: Legal Services, Furniture and Home Furnishings, and Apparel and Accessory
Stores. The three industries with the lowest level of debt specialization are: Local Passenger
distributions between the Kisgen’s sample and our sample is probably due to the fact that his sample includes
financials and utilities which tend to have better ratings than industrial firms. 7 We assign an integer equal to 23 to the variable ―Rating‖ for an unrated firm-year observation.

16
Transit, Auto Repair and Services, and Electric, Gas, and Sanitary Services. Overall, Table 4
shows significant variation in debt structure and debt specialization across different industries,
which motivates the inclusion of industry dummies in our multivariate analyses later.
IV. Debt Specialization
In this section, we present comprehensive evidence on the extent of debt specialization in
our sample firms.
A. Cluster Analysis
Our first piece of evidence on debt specialization comes from cluster analysis, which is
commonly used to discover unknown structures in data by maximizing variance (in terms of the
Euclidean distance) between clusters and minimizing it within clusters. Once we separate data in
clusters, we effectively remove much of the variance in any of the debt types. Table 5 presents
the mean and median values for different debt types and key firm characteristics across the
identified clusters using firm-year observations, sorted according to ascending group mean firm
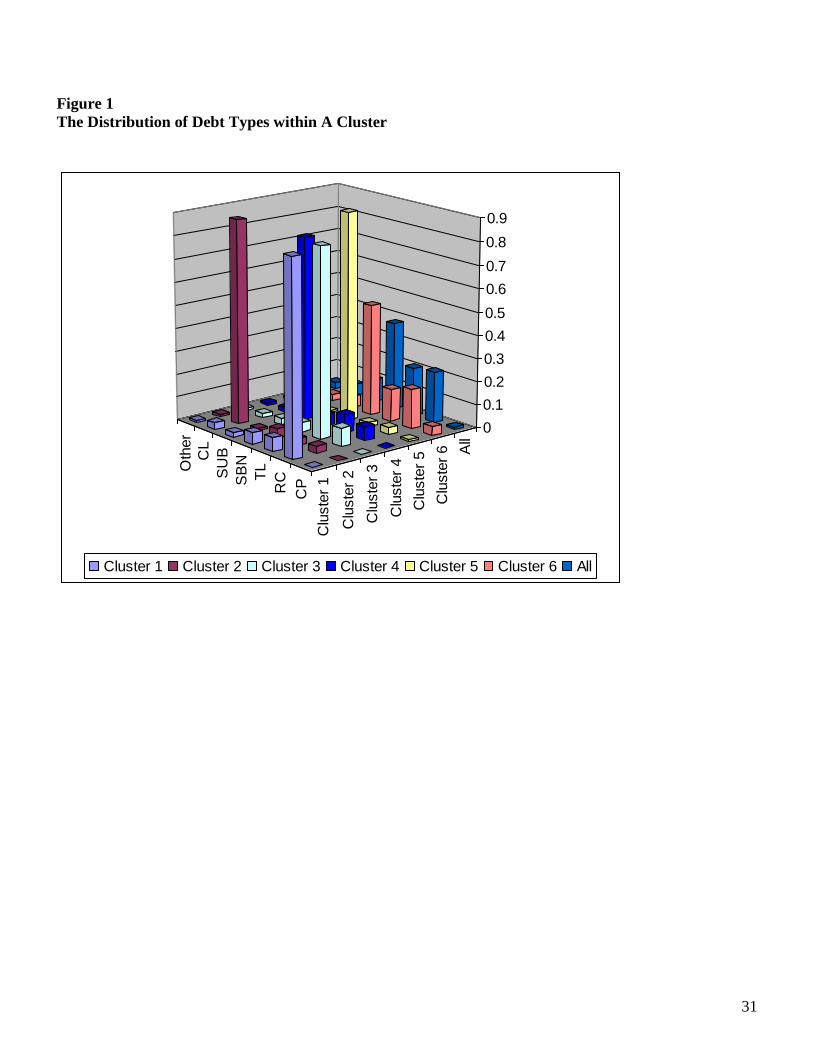
size.8 Figure 1 presents the distribution of different debt types within each cluster (mean ratios
are used).
There are a total of six clusters for our sample firms. Across these six clusters, the extent
of debt specialization as captured by the HHI and Entropy measures are fairly similar across the
first five clusters, while it decreases drastically for cluster 6 which includes the largest firms in
the sample. More specifically, cluster 1 includes the smallest firms in our sample with market
leverage close to the sample average. These firms tend to use predominantly revolving lines of
credit for financing. The group mean (median) revolving lines of credit to total debt ratio is 0.84
8 Firm characteristics are measured contemporaneously. Using lagged measures gives qualitatively the same results
except that sample size is slightly smaller.

17
(0.90). Cluster 2 includes the second smallest firms in our sample with the lowest level of market
leverage. These firms tend to use predominantly capital leases for financing. The group mean
(median) capital leases to total debt ratio is 0.88 (1.00). Cluster 3 firms tend to use
predominantly term loans for financing. The group mean (median) term loans to total debt ratio
is 0.82 (0.88). Cluster 4 firms tend to use predominantly subordinated bonds and notes for
financing. The group mean (median) subordinated bonds and notes to total debt ratio is 0.79
(0.83). Firms in cluster 5 are considerably bigger and these firms tend to use predominantly
senior bonds and notes for financing. The group mean (median) senior bonds and notes to total
debt ratio is 0.91 (0.95). Finally, cluster 6 includes some of the largest firms in the sample. These
firms tend to use a mix of senior bonds and notes, revolving credit, and term loans. The group
mean (median) senior notes and bonds, revolving credit, and term loans to total debt ratio is 0.48
(0.52), 0.17 (0.10), and 0.14 (0.02), respectively. It is worth noting that this group of firms has
the lowest M/B ratios and cash flow volatility, and the highest level of market leverage among
the sample firms.
In summary, the evidence from cluster analysis suggests that the vast number of sample
firms specialize in borrowing from one type of debt, and only the largest and least risky firms
simultaneously employ multiple types of debt. Moreover, we do not observe asset maturity to
vary considerably across clusters, which suggests that debt specialization cannot be the mere by-
product of firms matching the maturity of their liabilities to that of their assets. Our evidence
thus far is consistent with the prior theoretical literature suggesting that the use of different types
of debt is determined by firm characteristics including their credit quality and ability to access
the public debt market, and within a large sample of firms like ours, there would be some level of
debt specialization based on firms’ costs and benefits analysis. What is striking in our findings is
that debt specialization seems to be a dominant phenomenon.
Our findings on debt specialization are in stark contrast to Rauh and Sufi (2010), who
show that their average sample firm simultaneously employs multiple types of debt. We attribute

18
the difference in findings to the different samples examined in their paper and ours. They focus
primarily on large and rated firms, while in our sample only about 40% of the firms are rated.
B. Conditional Debt Structure
Our second piece of evidence on debt specialization comes from examining conditional
debt structures. Table 6 Panel A presents the shares of firm-year observations conditional on a
particular debt type exceeding 30% of total debt (i.e., the significant user). Looking across the
rows in Panel A, we find that significant users of one debt type are rarely significant users of any
other debt types. This is true with the exception of the significant users of commercial paper
which simultaneously employ a significant amount of senior bonds and notes. In all other cases,
Panel A indicates that if a firm’s use of a particular type of debt exceeds 30% of its total debt,
that type is likely to be its only source of debt financing. These results provide further support for
the phenomenon that firms specialize in borrowing from one type of debt. If firms were
simultaneously employing multiple types of debt, we would have observed few firms exceeding
30% of their debt from a single source of financing.
Panel B presents both the mean and median ratios of each debt type to total debt
conditional on a particular debt type exceeding 30% of total debt. Specifically, we first impose
the condition that a firm’s use of a particular debt type exceeds 30% of its debt, thus identifying
a subset of firms. Then, for this subset we compute mean and median ratios of all debt types to
total debt and test the null hypothesis that the mean (median) ratio is no greater than 30%. We
also report the number of firm-year observations whose particular debt type is strictly greater
than 30% of total debt. For example, in the first row we require that the amount of commercial
paper exceeds 30% of debt. This leaves us with 142 observations. For these observations the
mean (median) ratio of commercial paper to total debt is 0.528 (0.468), the mean (median) ratio
of revolving credit to total debt is 0.038 (0.000), and so on for all other types.

19
Examining the numbers in bold face along the diagonal line of Panel B, we show that the
ratio of a given debt type to total debt is between 65% and 80%, conditional on the ratio of that
particular type of debt to total debt exceeding the threshold of 30% (again with the notable
exception of the significant users of commercial paper). Further, the t- and median tests strongly
reject the null that the mean and median ratios of various debt types are no greater than 30%. The
off-diagonal numbers reveal that any significant reliance on more than one debt type is rarely
observed: The exception is that the significant users of commercial paper are also significant
users of senior bonds. The results in Panel B highlight the general phenomenon that very few
firms use other sources of debt over and beyond the one which we condition upon. This is strong
evidence of firms relying primarily on a single debt instrument.
Figure 2 presents the distribution of different debt types conditional on a particular debt
type exceeding 30% of total debt. With the exception of the significant users of commercial
paper, we observe the conditional mean ratio of various debt types easily exceeding 70% (as
shown along the vertical axis).
We conclude that specialization—not diversity—in types of debt is the dominant
phenomenon for debt structure. The natural question to ask next is what drives debt
specialization.
V. Explaining Debt Specialization and Debt Structure
The vast literature on capital structure has shown that the optimal capital structure
decision is made based on the trade-off between costs and benefits of debt financing. Extending
this line of thinking, we expect that the extent of debt specialization is also driven by firm
characteristics that proxy for costs and benefits of debt specialization.
A. Determinants of Debt Specialization

20
Since we are the first to examine the determinants of debt specialization, we rely on prior
work in capital structure to decide on possible explanatory variables (see for example, Fama and
French (2002), Lemmon, Roberts and Zender (2008), and Frank and Goyal (2008)). We estimate
the following regression:
t,i
t,iAt,iM
t,iDt,iVt,iS
t,iMBt,iTt,iPt,i
FERatingFEIndustryFEYear
AgeFirmMaturityAsset
PayerDividendVolatilityCFSizeFirm
B/MyTangibilitityProfitabiltionSpecializaDebt
1
111
111
(4)
where the dependent variables are the two measures of the extent of debt specialization: HHI and
Entropy. Table 7 Columns (1) and (3) present the OLS regression results.
For both specialization measures, we show that asset tangibility is negatively and
significantly, while M/B ratios, cash flow volatility, and asset maturity are positively and
significantly, associated with the extent of debt specialization. Our findings suggest that when
there are low monitoring costs as captured by high asset tangibility, firms are able to borrow
from a variety of different sources of financing; leading to reduced reliance on a few debt
instruments. On the other hand, when there are severe information asymmetry and high default
risk as captured by high growth and high cash flow risk, firms are forced to concentrate their
borrowing to fewer different sources of financing such as public debt or capital leases (see our
hypotheses H3 and H4). The positive and significant association between asset maturity and debt
specialization is mostly driven by senior bonds and notes, which is shown to be the predominant
source of financing (Table 2 Panel A) and positively associated with asset maturity (Table 5, see
cluster 5). Interestingly, we also show that in the midst of the 2008 financial crisis, firms
scrambled to borrow from as many sources of financing as possible; leading to a significant
decline in the degree of debt specialization, consistent with the evidence reported in Ivashina and
Scharfstein (2009) and Gao and Yun (2009). Afterwards, the degree of debt specialization
reverts back.

21
To get a sense of the extent to which firm characteristics affect the degree of debt
specialization, we consider four alternative specifications of Equation (4) by separately including
firm characteristics, year, industry, or rating fixed effects. Table 7 Columns (2) and (4) present
the OLS regression results when including firm characteristics only, while the lower part in
Table 7 reports the adjusted R2 for the different fixed effects specifications. The effects of firm
characteristics on debt specialization are fairly similar whether the different fixed effects are
included or not. When considering firm characteristics only, large firms appear to be less
specialized, but this effect is not robust to the inclusion of various fixed effects.
The full model specification in Equation (4) achieves an adjusted R2 of 0.084 and 0.099
for HHI and Entropy, respectively, while the goodness-of-fit of a model with firm characteristics
only is about 50% lower. Industry and rating fixed effects contribute similar levels of
explanatory power achieving an adjusted R2 in the range of 0.32 to 0.45, while year fixed effects
alone are not overall effective in explaining debt specialization. All fixed effects together
account for about three-quarters of the total explanatory power achieved by the full model
specification in Equation (4).
In summary, consistent with the theoretical predictions on the relation between the use of
different debt types and firm characteristics reviewed in Section II, we show that the extent of
debt specialization is also driven by concerns of information asymmetry and agency problems.
B. Determinants of Debt Structure
To examine the determinants of debt structure, we estimate the following regression
model:
t,i
t,iAt,iM
t,iDt,iVt,iS
t,iMBt,iTt,iPt,i
FERatingFEIndustryFEYear
AgeFirmMaturityAsset
PayerDividendVolatilityCFSizeFirm
B/MyTangibilitityProfitabilTypeDebt
1
111
111
(5)

22
where the dependent variables—debt types—are calculated as a fraction of total debt. As we
have shown in Table 2 Panel A, the distribution of debt types has a ―mass point‖ of observations
at zero for over half of the firm-year observations when a particular debt type is not employed,
which may raise some concerns about the conditional normality of the dependent variable in
Equation (5). As a result, we estimate Equation (5) with a Tobit specification that accounts for
two-sided censoring of the dependent variables at zero and one, and present results in Table 8.9
We show that firm size and age is positively and significantly associated with the use of
commercial paper, consistent with our first hypothesis (H1). Moreover, we show that
profitability, tangibility, M/B ratios, and the dividend payer dummy are positively and
significantly associated with the usage of commercial paper (Column (1)). Given that
profitability and tangibility are important determinants of credit ratings and that dividend
payments may signal profitability, the evidence further corroborates our first hypothesis.
We show that M/B ratios and cash flow volatility are negatively and significantly
associated with revolving credit facilities, consistent with our second hypothesis (H2). Outside
the predictions of our second hypothesis, we also show that profitability, asset tangibility, and
the dividend payer dummy are positively and significantly, while firm size and asset maturity are
negatively and significantly, associated with revolving credit facilities (Column (2)). The former
is consistent with banks’ close monitoring of line of credit drawdowns (Jiménez, López, and
Saurina (2008) and Sufi (2009))—they only provide credit lines to firms that are sufficiently
profitable, i.e., paying dividends. The latter is also intuitive as small firms tend to have more
volatile cash flows leading to lower usage of revolving credit; and as revolving credit facilities
9 In untabulated analysis, we first establish a benchmark by regressing market leverage on the same set of firm
characteristics. We find that consistent with prior research such as Frank and Goyal (2008) and Lemmon, Roberts,
and Zender (2008), profitability, M/B, cash flow volatility, and the dividend payer dummy are negatively and
significantly associated with market leverage; while asset tangibility and firm size are positively and significantly
associated with market leverage.

23
tend to have short maturity, they are expected to be matched with firms with shorter asset
maturity (Stohs and Mauer (1996)).
Columns (3)–(5) present evidence on the choice between bank loans and publicly traded
debt. We show that M/B ratios, firm size, cash flow volatility, and firm age are negatively and
significantly associated with term loans; mostly in support of the first half of our third hypothesis
(H3). Our evidence is consistent with the prior literature suggesting that firms with higher
monitoring costs prefer bank debt to public debt (Diamond (1991) for example). The exception is
that asset tangibility, which reduces the monitoring needs of a lender, is shown to be positively
and significantly associated with term loans. On the other hand, this finding is consistent with
banks’ risk aversion and their common practice of secured lending (Column (3)).
We further show that M/B ratios as well as firm size and age are positively and
significantly associated with senior bonds and notes, mostly consistent with the second half of
our third hypothesis (H3). Our evidence supports the predictions from prior literature that firms
with lower monitoring costs borrow from the public debt market (Chemmanur and Fulghieri
(1994) for example). Outside the predictions of our third hypothesis, we show that cash flow
volatility, the dividend payer dummy, and asset maturity are positively and significantly, while
profitability is negatively and significantly, associated with senior bonds and notes (Column (4)).
In contrast to senior bonds and notes, we show that asset tangibility, M/B ratios, and the dividend
payer dummy are negatively and significantly, while firm size is not significantly, associated
with subordinated bonds and notes. These findings support the idea that subordinated bonds and
notes are likely to be unsecured and made to firms of inferior quality, while term loans and
senior bonds and notes are generally secured. Our results suggest that it is important to separately
examine the determinants of senior versus subordinated bonds and notes as they appear to be
driven by different firm fundamentals.
Column (6) shows that profitability, the dividend payer dummy, and asset maturity are
negatively and significantly associated with capital leases; mostly consistent with our fourth and

24
final hypothesis (H4). M/B ratios or cash flow volatility are not shown to be significantly
associated with capital leases. The positive association between asset tangibility and capital
leases is by construction: capital leases are secured lending. Our evidence confirms the important
trade-off between lower liquidation costs and higher agency costs in capital leases which leads to
only financially constrained firms preferring to lease an asset (Eisfeldt and Rampini (2010)).
Overall, our regression results using different debt instruments as the dependent variables
are in support of our hypotheses. We conclude that low growth, low risk, small and young firms
with tangible assets tend to borrow primarily from banks. Less profitable, high risk, large firms
with long maturity assets use mainly bond financing. More profitable, low risk, large and old
firms with tangible assets use commercial paper. Our results highlight that similar to capital
structure decisions, firms make a tradeoff between the benefits and costs of using different debt
instruments and end up with an optimal debt structure at which firm value is maximized.
VI. Robustness Checks
In this section, we implement various robustness checks on our main results. First, to
mitigate the fact that in our unbalanced panel some firms with complete time series observations
from 2002 to 2009 receive more weight than other firms with fewer observations, we implement
the cluster analysis by using the time series average of each debt type and hence the firm-level
observations. Table 9 Panel A presents the result. We still observe six distinct clusters of firms
with five of them engaged in debt specialization, even though the degree of specialization is
somehow weakened based on the firm-level observations as compared to that based on the firm-
year observations in Table 5. This drop in the degree of specialization is expected if debt
specialization tends to persist over time in the same way that capital structure does (documented
by Lemmon, Roberts, and Zender (2008)), while the time series averaging (as reported in Panel
A) ignores the temporal persistence in debt specialization.

25
Second, we also re-examine conditional debt structures and show that our results are
robust to a different threshold. In Panels B and C we use 10% as the threshold. For example, in
the first row of the table, we require firm-year observations with the ratio of commercial paper to
total debt exceeding 10%. We find that the patterns of specialization in borrowing are
qualitatively similar to what we observe in Table 6 Panels A and B where we use 30% as the
threshold.
Finally, in order to assess the importance of firm characteristics relative to various fixed
effects in explaining debt type choices, we consider four alternative specifications of Equation
(5) by separately including firm characteristics, year, industry, or rating fixed effects. Results
from a Tobit specification are presented in Panel D. The economic and statistical significance of
firm characteristics is overall robust to the inclusion of different fixed effects. The goodness-of-
fit of a specification including firm characteristics only is about 50% of the full specification.
Industry fixed effects are important determinants of the capital leases choice, while rating fixed
effects are mostly relevant in explaining the use of commercial paper and subordinated bonds
and notes.
VII. Conclusions
This paper provides a comprehensive analysis of the patterns and determinants of debt
structure. We first show that debt structure varies substantially between unrated and rated firms
and across a wide spectrum of credit ratings and industry classifications. We then present fresh
evidence on firms’ specialization in borrowing. Cluster analysis identifies six distinct groups of
firms, five of which concentrate their borrowing through one type of debt. Conditional on
borrowing a significant fraction of their debt through a particular type of debt instrument, firms
are found to specialize in borrowing by limiting themselves to a few debt instruments. We find
that debt specialization is decreasing in asset tangibility, increasing in M/B ratios, cash flow

26
volatility, and asset maturity. We further show that debt structure is driven by the same common
factors that are known to explain capital structure, such as profitability, growth opportunities,
and credit ratings; though these factors tend to have very different influences on different types
of debt, consistent with different lenders’ expertise in dealing with information asymmetry and
agency problems. We conclude that debt structure plays an important role in capital structure
decisions.

27
References:
Bolton, Patrick, and Xavier Freixas, 2000, Equity, bonds and bank debt: Capital structure and
financial market equilibrium under asymmetric information, Journal of Political Economy
108, 324-351.
Cantillo, Miguel, and Julian Wright, 2000, How do firms choose their lenders? An empirical
investigation, Review of Financial Studies 13, 155-189.
Chemmanur, Thomas, and Paolo Fulghieri, 1994, Reputation, renegotiation, and the choice
between bank loans and publicly traded debt, Review of Financial Studies 7, 475-506.
DeMarzo, Peter M., and Michael J. Fishman, 2007, Optimal long-term financial contracting,
Review of Financial Studies 20, 2079-2128.
DeMarzo, Peter M., and Yuliy Sannikov, 2006, Optimal security design and dynamic capital
structure in a continuous-time agency model, Journal of Finance 61, 2681-2724.
Diamond, Douglas, 1991, Monitoring and reputation: The choice between bank loans and directly
placed debt, Journal of Political Economy 99, 689-721.
Eisfeldt, Andrea L. and Rampini, Adriano A., 2009. Leasing, ability to repossess, and debt
capacity, Review of Financial Studies 22, 1621-1657.
Fama, Eugene F., and Kenneth R. French, 2002, Testing trade-off and pecking order predictions
about dividends and debt, Review of Financial Studies 15, 1-33.
Faulkender, Michael, and Mitchell Petersen, 2006, Does the source of capital affect capital
structure? Review of Financial Studies 19, 45-79.
Frank, Murray Z., and Vidhan Goyal, 2008, ―Tradeoff and pecking order theories of debt,‖ in:
Handbook of Corporate Finance: Empirical Corporate Finance Vol. II (Elsevier/North-
Holland), ed. B. E. Eckbo.
Gao, Pengjie, and Hayong Yun, 2009, Commercial paper, lines of credit, and the real effects of
the Financial Crisis of 2008: Firm-level evidence from the manufacturing industry,
University of Notre Dame Working Paper.
Hadlock, Charles, and Christopher James, 2002, Do banks provide financial slack? Journal of
Finance 57, 1383-1419.
Holmström, Bengt, and Jean Tirole, 1998, Private and public supply of liquidity, Journal of
Political Economy 106, 1-40.
Houston, Joel, and Christopher James, 1996, Bank information monopolies and the mix of private
and public debt claims, Journal of Finance 51, 1863-1889.

28
Ivashina, Victoria, and David S. Scharfstein, 2009, Bank lending during the Financial Crisis of
2008, Harvard Business School Working Paper.
Jiménez, Gabriel, José A. López, and Jesús Saurina, 2009, Empirical analysis of corporate credit
lines, Review of Financial Studies 22, 5069-5098.
Johnson, Shane, 1997, An empirical analysis of the determinants of corporate debt ownership
structure, Journal of Financial and Quantitative Analysis 32, 47-69.
Kahl, Matthias, Anil Shivdasani, and Yihui Wang, 2008, Do firms use commercial paper to
enhance financial flexibility? University of North Carolina Working Paper.
Kisgen, Darren, 2006, Credit ratings and capital structure, Journal of Finance 61, 1035-1072.
Krishnan, V. Sivarama, and R. Charles Moyer, 1994, Bankruptcy costs and the financial leasing
decision, Financial Management 23, 31-42.
Lemmon, Michael, Michael R. Roberts, and Jamie Zender, 2008, Back to the beginning:
Persistence and the cross-section of corporate capital structure, Journal of Finance 63,
1575-1608.
Lemmon, Michael, and Jamie Zender, 2009, Debt capacity and tests of capital structure theories,
Journal of Financial and Quantitative Analysis forthcoming.
Miller, Merton H., 1977, Debt and taxes, Journal of Finance 32, 261-276.
Modigliani, Franco, and Merton H. Miller, 1958, The cost of capital, corporate finance, and the
theory of investment, American Economic Review 48, 261-297.
Modigliani, Franco, and Merton H. Miller, 1963, Corporate income taxes and the cost of capital:
A correction, American Economic Review 53, 443-453.
Myers, Stewart C., 2001, Capital structure, Journal of Economic Perspectives 15, 81-102.
Rauh, Joshua D., and Amir Sufi, 2010, Capital structure and debt structure, Review of Financial
Studies forthcoming.
Stohs, Mark Hoven, and David C. Mauer, 1996, The determinants of corporate debt maturity
structure, Journal of Business 69, 279-312.
Sufi, Amir, 2009, Bank lines of credit in corporate finance: An empirical analysis, Review of
Financial Studies 22, 1057-1088.
Yan, An, 2006, Leasing and debt financing: Substitutes or complements?, Journal of Financial
and Quantitative Analysis 41, 709-731.

29
APPENDIX
Table A1
Description of Compustat Variables
Variable Definition
Profitability Operating Income Before Depreciation (13) / Total Assets (6)
Tangibility Net Property, Plant, and Equipment (PPENT 8) / Total Assets (6)
Preferred Stock Max[Preferred Stock Liquidating Value (10), Preferred Stock Redemption Value (56),
Preferred Stock Carrying Value (130)]
Total Debt Debt in Current Liabilities (34) + Long-Term Debt (9)
MV Equity Stock Price (199) × Common Shares Used to Calculate EPS (54)
M/B (Market Value of Equity + Total Debt + Preferred Stock Liquidating Value (10) –
Deferred Taxes and Investment Tax Credit (35)) / Total Assets (6)
Firm Size Book Value of Total Assets (6)
CF Volatility Standard Deviation of Quarterly Operating Income (13) over Previous 12 Quarters Scaled
by Total Assets (6)
Dividend Payer Dummy =1 if common stock dividends (21) are positive, and zero otherwise
Asset Maturity (Current Assets (4)/(Current Assets (4)+ PPENT)*(Current Assets (4)/Cost of Goods Sold
(41)) + (PPENT/(Current Assets (4)+ PPENT)*( PPENT/Depr. and Amort. (14))
Firm Age Number of years a firm is included with a non-missing stock price in Compustat
Rated Dummy =1 if the firm is rated by the S&P, and zero otherwise
Rating Monthly S&P ratings (280)
Market Leverage Total Debt / (Total Debt + Market Value of Equity)
Book Leverage Total Debt/Total Assets (6)
CP Commercial Paper
RC Revolving Credit Facilities (Drawn)
TL Term Loans
SBN Senior Bonds and Notes
SUB Subordinated Bonds and Notes
CL Capital Leases
Other Other Debt + Total Trust Preferred Stock
Total Principal Due Commercial Paper + Revolving Credit + Term Loans + Senior Bonds + Subordinated
Bonds + Capital Leases + Other
Total Adjustment Total Debt - Total Principal Due
HHI {[[CP/(Total Debt)]2+ [RC/(Total Debt)]
2+ [TL/(Total Debt)]
2+ [SBN/(Total Debt)]
2+
[SUB/(Total Debt)]2+ [CL/(Total Debt)]
2+ [(Other)/(Total Debt)]
2] -(1/7)}/(1-(1/7))
Entropy - [CP/(Total Debt)*ln(CP/(Total Debt))+ RC/(Total Debt)*ln(RC/(Total Debt))+ TL/(Total
Debt)*ln(TL/(Total Debt)) + SBN/(Total Debt)*ln(SUB/(Total Debt)) + CL/(Total
Debt)*ln(CL/(Total Debt)) + Other/(Total Debt)*ln(Other/(Total Debt))]

30
Table A2
An Example of How Capital IQ Classifies Debt Type
The following table illustrates how CIQ calculates each item (in millions of dollars) for AMR Corporation for the fiscal year ended
December 31, 2003. All information is available under Item 8 of Form 10K.
Item CIQ Calculation
Capital Structure Data
Total Debt 13,930 Long-term debt, less current maturities (11,901) + Obligations under capital
leases, less current obligations (1,225) + Current maturities of long-term
debt (603) + Current obligations under capital leases (201) = 13,930
Total Equity 46 Stockholders’ equity (46)
Total Capital 13,976 Total debt + Stockholders’ equity
Debt Structure Data
Total Revolving Credit 834 Credit facility agreement due through 2005 (834)
Total Term Loans 0
Total Senior Bonds and
Notes
11,668 Secured variable and fixed rate indebtedness due through 2021 (6,041) +
Enhanced equipment trust certificates due through 2011 (3,747) + Special
facility revenue bonds due through 2036 (947) + Debentures due through
2021 (330) + Notes due through 2039 (303) + Senior convertible notes due
through 2023 (300)
Total Capital Leases 1,426 Obligations under capital leases, less current obligations (1,225) + Current
obligations under capital leases (201)
Other Borrowings 2 Other (2)
Additional Totals
Total Senior Debt 13,930 = Total debt
Total Convertible Debt 300 Senior convertible notes due through 2023 (300)
Curr. Port. of Long-
Term Debt/Capital
Leases
804 Current maturities of long-term debt (603) + Current obligations under
capital leases (201)
Long-Term Debt (Incl.
Capital Leases)
13,126 Long-term debt, less current maturities (11,901) + Obligations under capital
leases, less current obligations (1,225)
Total Bank Debt 834 Credit facility agreement due through 2005 (834)
Total Secured Debt 11,214 Secured variable and fixed rate indebtedness due through 2021 (6,041) +
Enhanced equipment trust certificates due through 2011 (3,747) +
Obligations under capital leases, less current obligations (1,225) + Current
obligations under capital leases (201)
Total Unsecured Debt 2,716 Special facility revenue bonds due through 2036 (947) + Credit facility
agreement due through 2005 (834) + Debentures due through 2021 (330) +
Notes due through 2039 (303) + Senior convertible notes due through 2023
(300) + Other (2)
31
Figure 1
The Distribution of Debt Types within A Cluster
CPRCT
L
SB
N
SU
BCL
Oth
er
Clu
ste
r 1
Clu
ste
r 2
Clu
ste
r 3
Clu
ste
r 4
Clu
ste
r 5
Clu
ste
r 6 A
ll
0
0.1
0.2
0.3
0.4
0.5
0.6
0.7
0.8
0.9
Cluster 1 Cluster 2 Cluster 3 Cluster 4 Cluster 5 Cluster 6 All

32
Figure 2
The Distribution of Debt Types Conditional on Significant Amount Employed (30% threshold)
CPRCT
L
SB
N
SU
BCL
Oth
er
CP RC T
L
SB
N
SU
B CL
Oth
er
0
0.1
0.2
0.3
0.4
0.5
0.6
0.7
0.8
CP RC TL SBN SUB CL Other

33
Table 1
Sample Overview
The sample consists of non-utilities (excluding SIC codes 4900-4949) and non-financials (excluding SIC codes 6000-6999) U.S.
firms covered by both Capital IQ and Compustat from 2002 to 2009. Definitions of the variables are provided in Table A1. We
have removed 1) firm-years with missing value of total assets, 2) firm-years with market or book leverage outside the unit interval,
3) firm-years with total principal due missing or smaller than $1 million, 4) firm-years for which total adjustment exceed 10% of
total debt. After the above filtering, there are 16,115 firm-year observations involving 3,296 unique firms in the sample. Applying
the same filters (except the data discrepancy filter 4) to the Compustat population over the same time period as our sample, we
obtain 18,164 (leveraged) firm-year observations. Firm Size is expressed in millions of 2002 dollars. This table presents means and
medians aggregated across all years for our sample and Compustat leveraged firms. We test for difference between our sample and
the Compustat sample using the t-test and the two-sample Wilcoxon rank-sum (Mann-Whitney) test.
Our Sample
Compustat Leveraged
Firms
Test of Difference
Compustat Leveraged Firms vs.
Our Sample
(1) (2) (3) (4) (5) (6)
Mean Median Mean Median t-test
(p-value)
MW-test
(p-value)
Mkt Leverage 0.252 0.195 0.252 0.193 0.301
(0.763)
-0.630
(0.529)
Profitability 0.086 0.114 0.083 0.113 -1.275
(0.202)
-1.618
(0.106)
Tangibility 0.288 0.213 0.286 0.212 -0.909
(0.363)
-0.893
(0.372)
M/B 1.503 1.148 1.497 1.138 -0.328
(0.743)
-1.464
(0.143)
Firm Size 3784.9 565.8 3631.5 532.7 -0.736
(0.462)
-2.039
(0.042)
CF Volatility 0.018 0.010 0.018 0.010 0.679
(0.497)
1.541
(0.123)
Dividend Payer 0.342 0.000 0.330 0.000 -2.227
(0.026)
-2.227
(0.026)
Asset Maturity 4.501 2.767 4.497 2.757 -0.078
(0.938)
-0.427
(0.669)
Firm Age 17.711 13.000 17.593 13.000 -0.798
(0.425)
-0.706
(0.480)
# Obs. 16,115 18,164

34
Table 2
Summary Statistics for Debt Types
This table reports summary statistics for the various debt types, which include commercial paper, revolving credit facilities, term
loans, senior bonds and notes, subordinated bonds and notes, capital leases, and other debt. All debt types are calculated as a
fraction of total debt. Definitions of the variables are provided in Table A1. HHI and Entropy measure the degree of debt
specialization, which is increasing in HHI and decreasing in Entropy. Panel A reports mean and key percentiles across all firm-year
observations for all the above variables. Panel B presents time series evidence on debt types.
Panel A: Percentiles of debt types
Debt Types Share of Total debt
Mean 1st
Percentile
5th
Percentile
25th
Percentile
Median 75th
Percentile
95th
Percentile
99th
Percentile
Comm. Paper 0.009 0.000 0.000 0.000 0.000 0.000 0.010 0.280
Revolving Credit 0.220 0.000 0.000 0.000 0.006 0.345 0.999 1.000
Term Loans 0.212 0.000 0.000 0.000 0.000 0.343 0.999 1.000
Sen. Bonds and Notes 0.382 0.000 0.000 0.000 0.208 0.806 1.000 1.000
Sub. Bonds and Notes 0.098 0.000 0.000 0.000 0.000 0.000 0.831 1.000
Capital Leases 0.054 0.000 0.000 0.000 0.000 0.012 0.308 1.000
Other Debt 0.025 0.000 0.000 0.000 0.000 0.001 0.118 0.695
Total Adjustment 0.000 -0.029 -0.001 0.000 0.000 0.000 0.006 0.038
HHI 0.702 0.202 0.276 0.449 0.729 0.993 1.000 1.000
Entropy 0.434 0.000 0.000 0.022 0.426 0.702 1.077 1.267
Panel B: Debt types over time
Year Debt Types
CP RC TL SBN SUB CL Other HHI Entropy # Obs.
2002 0.011 0.229 0.185 0.359 0.124 0.063 0.030 0.676 0.473 1747
2003 0.009 0.204 0.181 0.389 0.132 0.056 0.028 0.691 0.451 2075
2004 0.010 0.192 0.186 0.406 0.117 0.059 0.029 0.708 0.428 2101
2005 0.010 0.199 0.203 0.403 0.105 0.056 0.025 0.706 0.427 2104
2006 0.011 0.221 0.213 0.390 0.092 0.053 0.020 0.706 0.428 2113
2007 0.011 0.229 0.237 0.374 0.079 0.050 0.021 0.709 0.422 2120
2008 0.008 0.263 0.245 0.347 0.067 0.045 0.023 0.699 0.436 2119
2009 0.005 0.221 0.247 0.384 0.065 0.051 0.027 0.719 0.407 1736

35
Table 3
Credit Ratings and Debt Structure
This table provides descriptive statistics on the relation between credit ratings and debt types. Total debt is decomposed into
commercial paper, revolving credit facilities, term loans, senior bonds, subordinated bonds, capital leases, and other debt. All debt
types are calculated as a fraction of total debt. Definitions of the variables are provided in Table A1. Data on ratings ranging from
AAA to D are from Compustat (280). HHI and Entropy measure the degree of debt specialization, which is increasing in HHI and
decreasing in Entropy. Panel A presents debt structure in terms of mean and median debt ratios across unrated and rated groups.
We test for difference between rated and unrated using the t-test and the two-sample Wilcoxon rank-sum (Mann-Whitney) test.
Panel B presents debt structure in terms of mean and median debt ratios across different rating classes.
Panel A: Debt structure across rated and unrated groups
Unrated Rated Test of Difference Between
Unrated and Rated
(1) (2) (3) (4) (5) (6)
Mean Median Mean Median t-test
(p-value)
MW-test
(p-value)
Debt Types Share of Total Debt
Commercial Paper 0.001 0.000 0.022 0.000 -18.300
(0.000)
-34.402
(0.000)
Revolving Credit 0.297 0.047 0.094 0.000 45.647
(0.000)
23.914
(0.000)
Term Loans 0.248 0.000 0.154 0.000 18.957
(0.000)
6.771
(0.000)
Senior Bonds and Notes 0.276 0.012 0.553 0.660 -45.137
(0.000)
-41.163
(0.000)
Sub. Bonds and Notes 0.078 0.000 0.130 0.000 -12.731
(0.000)
-22.137
(0.000)
Capital Leases 0.076 0.000 0.018 0.000 24.482
(0.000)
4.873
(0.000)
Other Debt 0.023 0.000 0.029 0.000 -3.153
(0.002)
-35.366
(0.000)
HHI 0.735 0.809 0.649 0.624 20.357
(0.000)
23.354
(0.000)
Entropy 0.379 0.317 0.522 0.560 -23.925
(0.000)
-25.957
(0.000)
Market Leverage 0.210 0.148 0.319 0.275 -31.824
(0.000)
-36.506
(0.000)
Firm Size 522.2 215.5 9075.7 2434.6 -21.516
(0.000)
-89.568
(0.000)
# Obs. 9970 6145
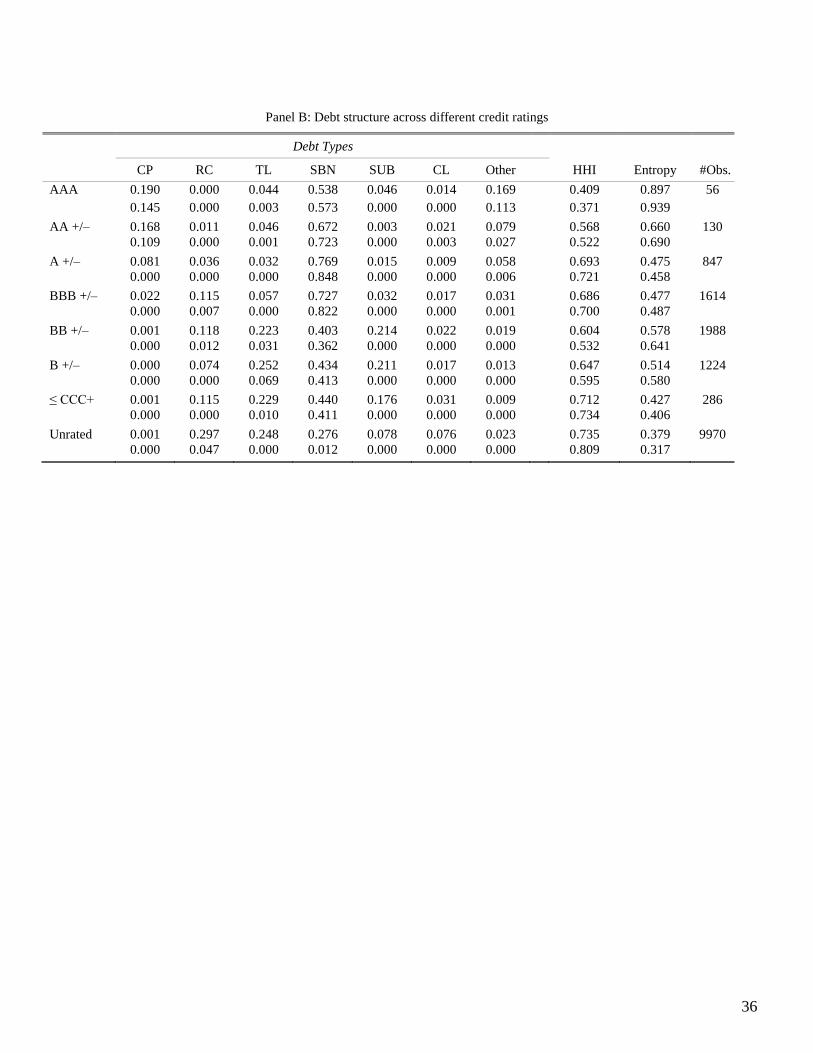
36
Panel B: Debt structure across different credit ratings
Debt Types
CP RC TL SBN SUB CL Other HHI Entropy #Obs.
AAA 0.190 0.000 0.044 0.538 0.046 0.014 0.169 0.409 0.897 56
0.145 0.000 0.003 0.573 0.000 0.000 0.113 0.371 0.939
AA +/– 0.168 0.011 0.046 0.672 0.003 0.021 0.079 0.568 0.660 130
0.109 0.000 0.001 0.723 0.000 0.003 0.027 0.522 0.690
A +/– 0.081 0.036 0.032 0.769 0.015 0.009 0.058 0.693 0.475 847
0.000 0.000 0.000 0.848 0.000 0.000 0.006 0.721 0.458
BBB +/– 0.022 0.115 0.057 0.727 0.032 0.017 0.031 0.686 0.477 1614
0.000 0.007 0.000 0.822 0.000 0.000 0.001 0.700 0.487
BB +/– 0.001 0.118 0.223 0.403 0.214 0.022 0.019 0.604 0.578 1988
0.000 0.012 0.031 0.362 0.000 0.000 0.000 0.532 0.641
B +/– 0.000 0.074 0.252 0.434 0.211 0.017 0.013 0.647 0.514 1224
0.000 0.000 0.069 0.413 0.000 0.000 0.000 0.595 0.580
≤ CCC+ 0.001 0.115 0.229 0.440 0.176 0.031 0.009 0.712 0.427 286
0.000 0.000 0.010 0.411 0.000 0.000 0.000 0.734 0.406
Unrated 0.001 0.297 0.248 0.276 0.078 0.076 0.023 0.735 0.379 9970
0.000 0.047 0.000 0.012 0.000 0.000 0.000 0.809 0.317

37
Table 4
Debt Structure across Industries
This table provides the breakdown by industry of the various debt types. Firm-year observations are assigned to industries
according to their two-digit SIC codes. Firm-year observations are assigned to industries according to their two-digit SIC codes.
Non-classifiable establishments with two-digit SIC code 99 have been dropped. All debt types are calculated as a fraction of total
debt. Definitions of the variables are provided in Table A1. This table reports the percentage of observations in each industry
(Column ―%‖), the percentage of observations with a given debt type exceeding 50% of total debt within each industry, and the
average HHI and Entropy values within each industry.
Industry % CP>50% RC>50% TL>50% SBN>50% SUB>50% CL>50% Other>50% HHI Entropy
Agriculture, Forestry, Fishing 0.52 0.00 15.48 8.33 66.67 2.38 0.00 3.57 0.70 0.43
Mining 6.78 0.00 28.75 12.55 45.97 6.41 0.55 0.92 0.72 0.39
Construction 1.73 0.00 16.85 13.26 50.90 10.39 2.15 0.72 0.69 0.46
Manufacturing Food and Kindred Products 2.75 1.35 10.84 25.96 51.47 2.26 0.90 0.45 0.66 0.50
Tobacco Products 0.25 0.00 0.00 0.00 90.24 4.88 0.00 0.00 0.75 0.38
Textile Mill Products 0.40 0.00 16.92 3.08 58.46 3.08 0.00 0.00 0.57 0.65 Apparel and Oth. Textile Prod. 1.05 0.00 17.06 21.76 48.24 6.47 0.59 0.59 0.74 0.37
Lumber and Wood Products 0.55 0.00 10.23 11.36 71.59 2.27 0.00 0.00 0.66 0.48
Furniture and Fixtures 0.85 0.00 24.09 14.60 54.01 2.92 0.00 0.00 0.73 0.41 Paper and Allied Products 1.28 0.00 7.25 17.87 56.52 2.90 4.83 0.48 0.60 0.60
Printing and Publishing 1.56 4.37 25.40 22.62 35.32 4.37 0.00 0.40 0.68 0.45
Chemicals and Allied Products 10.45 0.30 8.31 22.68 44.24 12.47 4.99 1.48 0.76 0.35 Petroleum and Coal Products 0.91 0.68 8.22 17.12 61.64 7.53 0.00 0.00 0.67 0.51
Rubber and Plastics Products 1.02 0.00 13.33 17.58 44.24 4.85 1.82 2.42 0.63 0.55
Leather and Leather Products 0.43 0.00 40.58 14.49 31.88 10.14 0.00 0.00 0.75 0.34 Stone, Clay, and Glass Products 0.62 0.00 16.00 12.00 65.00 5.00 0.00 1.00 0.75 0.37
Primary Metal Industries 1.80 0.00 15.86 16.21 48.62 13.45 1.38 0.69 0.69 0.46
Fabricated Metal Products 1.74 0.71 13.17 18.86 46.98 9.61 1.07 1.07 0.66 0.50 Industrial Mach. and Equip. 6.24 0.50 20.60 19.00 35.42 14.73 3.18 0.90 0.72 0.41
Electronic Equipment 8.17 0.00 19.89 20.12 30.22 15.57 5.92 2.13 0.74 0.38
Transportation Equipment 2.44 3.05 17.30 13.99 47.58 5.60 0.00 1.78 0.65 0.52 Instruments and Related Prod. 6.63 0.65 21.52 27.78 30.22 8.14 2.90 2.06 0.71 0.41
Misc. Manufacturing Industries 0.99 0.00 23.13 29.38 34.38 6.25 1.25 0.00 0.75 0.36
Transportation and Communication Services
Railroad Transportation 0.35 0.00 3.51 10.53 84.21 0.00 0.00 0.00 0.63 0.60
Local Passenger Transit 0.11 0.00 0.00 38.89 11.11 11.11 0.00 0.00 0.46 0.75
Trucking and Warehousing 1.00 0.62 26.71 4.35 46.58 4.97 4.97 1.24 0.62 0.54 Water Transportation 0.63 0.00 8.82 20.59 57.84 0.00 0.00 0.98 0.65 0.50
Transportation by Air 1.07 0.00 0.58 21.97 65.32 0.58 1.16 2.31 0.65 0.54
Pipelines, Except Natural Gas 0.25 0.00 14.63 2.44 75.61 7.32 0.00 0.00 0.74 0.35 Transportation Services 0.47 0.00 33.33 21.33 29.33 4.00 1.33 2.67 0.71 0.42
Communication 4.29 0.00 7.24 27.93 45.30 6.37 4.34 1.16 0.68 0.47
Electric, Gas, and Sanitary Services
0.76 0.00 18.03 19.67 40.16 6.56 0.00 0.00 0.54 0.70
Wholesale Trade 4.49 0.97 38.04 14.52 29.05 5.95 1.66 1.11 0.66 0.49
Retail Trade Eating and Drinking Places 2.15 0.29 27.17 21.39 25.72 5.78 10.98 2.02 0.67 0.48
General Merchandise Stores 0.84 0.00 19.85 4.41 66.91 0.74 4.41 0.00 0.71 0.44
Food Stores 0.61 0.00 8.08 10.10 41.41 23.23 9.09 1.01 0.57 0.65 Auto Dealers & Serv. Stations 0.91 0.00 55.48 12.33 20.55 0.00 1.37 0.00 0.59 0.60
Apparel and Accessory Stores 1.01 0.00 14.11 24.54 39.88 9.82 8.59 1.23 0.77 0.32 Furniture & Home Furnishings 0.52 0.00 19.28 3.61 54.22 0.00 16.87 1.20 0.80 0.29
Miscellaneous Retail 2.28 0.00 30.52 10.63 34.33 12.26 5.99 1.09 0.69 0.45
Services Hotels and Other Lodging Plac. 0.56 0.00 4.44 37.78 51.11 4.44 0.00 0.00 0.65 0.52
Personal Services 0.52 0.00 15.66 15.66 57.83 3.61 0.00 0.00 0.63 0.53
Business Services 9.80 0.19 23.75 20.58 28.94 11.91 7.47 1.96 0.77 0.34 Auto Repair and Services 0.37 0.00 25.00 8.33 51.67 1.67 1.67 0.00 0.52 0.75
Miscellaneous Repair Services 0.04 0.00 85.71 14.29 0.00 0.00 0.00 0.00 0.54 0.63
Motion Pictures 0.45 0.00 11.11 50.00 13.89 9.72 2.78 0.00 0.61 0.56 Amusement and Recreation 1.34 0.00 22.22 17.13 26.85 18.06 0.00 0.46 0.57 0.63
Health Services 2.80 0.00 18.40 25.94 33.92 8.65 4.43 1.11 0.67 0.48
Legal Services 0.05 0.00 0.00 0.00 25.00 75.00 0.00 0.00 0.96 0.07 Educational Services 0.52 0.00 33.73 13.25 21.69 8.43 18.07 0.00 0.67 0.48
Social Services 0.30 0.00 6.25 22.92 35.42 6.25 10.42 0.00 0.62 0.56
Engineering and Mangmt. Serv. 2.05 0.00 29.70 24.55 26.06 3.03 8.48 3.33 0.73 0.39
# Obs. 61 3165 3156 6377 1452 611 212 16067

38
Table 5
Cluster Analysis
This table provides clustering of firm-year observations according to debt types. All debt types are calculated as a fraction of total debt. Definitions of the
variables are provided in Table A1. Firm Size is expressed in millions of 2002 dollars. For the cluster analysis, we employ the Stata command cluster
kmeans with clusters defined over all seven debt types simultaneously. We use the Euclidean distance measure and run kmeans with up to 15 clusters. Using
the stopping rule based on the Calinski/Harabasz index, we obtain six clusters. This table presents the sample mean and median of debt types and key firm
characteristics for the resulting six clusters sorted by ascending cluster average firm size.
Debt Types
Cluster CP RC TL SBN SUB CL Other Profita-
bility
Tangi-
bility
M/B Firm
Size
CF
Vol.
Div.
Payer
Asset
Maturity
Firm
Age
Rated
(%)
Rating HHI Entropy Mkt.
Lev
#Obs.
1 0.00 0.84 0.06 0.05 0.02 0.03 0.01 0.10 0.28 1.38 594 0.02 0.29 3.71 15.61 0.10 12.04 0.74 0.38 0.22 3107
0.00 0.90 0.00 0.00 0.00 0.00 0.00 0.11 0.19 1.06 233 0.01 0.00 2.11 12.00 0.00 12.00 0.79 0.35 0.15
2 0.00 0.03 0.03 0.04 0.01 0.88 0.01 0.01 0.25 1.88 595 0.03 0.12 3.53 11.47 0.06 12.81 0.82 0.26 0.09 617
0.00 0.00 0.00 0.00 0.00 1.00 0.00 0.08 0.17 1.46 214 0.02 0.00 2.32 9.00 0.00 12.00 1.00 0.00 0.02
3 0.00 0.08 0.82 0.04 0.03 0.02 0.01 0.07 0.27 1.56 810 0.02 0.22 4.26 13.16 0.23 13.52 0.72 0.41 0.25 3224
0.00 0.00 0.88 0.00 0.00 0.00 0.00 0.11 0.21 1.16 226 0.01 0.00 2.60 10.00 0.00 13.00 0.75 0.40 0.18
4 0.00 0.06 0.08 0.05 0.79 0.02 0.01 0.08 0.24 1.49 1233 0.02 0.15 4.13 15.75 0.51 13.21 0.67 0.47 0.30 1611
0.00 0.00 0.00 0.00 0.83 0.00 0.00 0.10 0.15 1.19 679 0.01 0.00 2.60 12.00 1.00 13.00 0.67 0.49 0.25
5 0.01 0.03 0.02 0.91 0.01 0.02 0.01 0.09 0.31 1.58 6527 0.02 0.50 5.26 21.76 0.58 10.01 0.83 0.28 0.24 5011
0.00 0.00 0.00 0.95 0.00 0.00 0.00 0.12 0.25 1.20 1438 0.01 1.00 3.38 18.00 1.00 9.00 0.88 0.23 0.19
6 0.04 0.17 0.14 0.48 0.05 0.03 0.10 0.10 0.32 1.34 8450 0.01 0.42 4.75 20.81 0.53 10.44 0.39 0.86 0.32 2545
0.00 0.10 0.02 0.52 0.00 0.00 0.00 0.12 0.25 1.07 1343 0.01 0.00 3.10 17.00 1.00 11.00 0.39 0.86 0.26
All 0.01 0.22 0.21 0.38 0.10 0.05 0.03 0.09 0.29 1.50 3785 0.02 0.34 4.50 17.71 0.38 11.07 0.70 0.43 0.25 16115
0.00 0.01 0.00 0.21 0.00 0.00 0.00 0.11 0.21 1.15 566 0.01 0.00 2.77 13.00 0.00 12.00 0.73 0.43 0.20

39
Table 6
Conditional Debt Structure
This table provides evidence on conditional debt structure. All debt types are calculated as a fraction of total debt. Definitions of
the variables are provided in Table A1. A firm-year observation is classified as relying on a significant amount of a given debt type
if the amount of that debt type exceeds 30% of total debt. Panel A presents the shares of observations with significant amounts of
various debt types conditional on a particular debt type (given in the first column of the table) being significant. Panel B presents
the mean (first row) and median (second row) of each debt type conditional on a particular debt type (given in the first column of
the table) being significant, together with the number of observations for which a given debt type exceeds 30% of total debt (third
row). We test for mean and median debt type ratios being strictly greater than 30% (one-sided) using the t-test and the sign test.
***, **, and * denote statistical significance at the 1%, 5%, and 10% levels, respectively.
Panel A: Shares of observations conditional on significant amounts of debt types (30% threshold)
Debt Types
CP RC TL SBN SUB CL Other
CP>30% 1.000 0.021 0.028 0.655 0.000 0.007 0.042
RC>30% 0.001 1.000 0.147 0.186 0.049 0.018 0.010
TL>30% 0.001 0.148 1.000 0.144 0.086 0.019 0.009
SBN>30% 0.012 0.106 0.082 1.000 0.035 0.015 0.013
SUB>30% 0.000 0.103 0.179 0.130 1.000 0.008 0.005
CL>30% 0.001 0.096 0.100 0.135 0.021 1.000 0.017
Other>30% 0.016 0.116 0.100 0.253 0.026 0.037 1.000

40
Panel B: Debt structure conditional on significant amounts of debt types (30% threshold)
Debt Types
CP RC TL SBN SUB CL Other
CP>30% 0.528*** 0.038 0.023 0.355*** 0.004 0.010 0.041
0.468*** 0.000 0.000 0.407*** 0.000 0.000 0.003
142 3 4 93 0 1 6
RC>30% 0.001 0.717*** 0.094 0.120 0.031 0.025 0.012
0.000 0.742*** 0.000 0.000 0.000 0.000 0.000
3 4323 634 802 212 79 44
TL>30% 0.001 0.101 0.716*** 0.097 0.052 0.024 0.009
0.000 0.000 0.731*** 0.000 0.000 0.000 0.000
4 634 4294 619 368 82 38
SBN>30% 0.015 0.083 0.062 0.775*** 0.024 0.021 0.020
0.000 0.000 0.000 0.830*** 0.000 0.000 0.000
93 802 619 7577 268 111 96
SUB>30% 0.000 0.077 0.113 0.086 0.698*** 0.016 0.009
0.000 0.000 0.000 0.000 0.683*** 0.000 0.000
0 212 368 268 2059 17 10
CL>30% 0.001 0.066 0.068 0.083 0.013 0.758*** 0.012
0.000 0.000 0.000 0.000 0.000 0.881*** 0.000
1 79 82 111 17 820 14
Other>30% 0.013 0.074 0.066 0.150 0.017 0.036 0.642***
0.000 0.000 0.000 0.000 0.000 0.000 0.561***
6 44 38 96 10 14 379

41
Table 7
Explaining Debt Specialization
This table presents OLS regression results to explain the extent of debt specialization. The dependent variable is HHI for Columns
(1) and (2), and Entropy for Columns (3) and (4). Definitions of the variables are provided in Table A1. Firm characteristics are
lagged by one year. Columns (1) and (3) present regression results for specifications including firm characteristics, year, industry
and rating fixed effects, while Columns (2) and (4) include firm characteristics only. Industry fixed effects are based on two-digit
SIC codes. Rating fixed effects are based on 22 rating dummies and the unrated dummy. Standard errors are clustered at the firm
level. The base year is 2003, and year 2002 is omitted because of multicollinearity. The lower part presents Adjusted R2 for
specifications with fixed effects only. Standard errors are clustered at the firm level and reported in parentheses. ***, **, and *
denote statistical significance at the 1%, 5%, and 10% levels, respectively.
Regressors (1)
HHI
(2)
HHI
(3)
Entropy
(4)
Entropy
Profitability 0.007 -0.013 -0.024 0.002
(0.025) (0.025) (0.035) (0.035)
Tangibility -0.142*** -0.126*** 0.220*** 0.187***
(0.031) (0.023) (0.044) (0.032)
M/B 0.021*** 0.022*** -0.032*** -0.033***
(0.003) (0.003) (0.005) (0.005)
Firm Size 0.001 -0.010*** 0.004 0.020***
(0.004) (0.003) (0.005) (0.004)
CF Volatility 0.466*** 0.538*** -0.647*** -0.748***
(0.122) (0.130) (0.165) (0.179)
Dividend Payer 0.011 0.014 -0.021 -0.024
(0.010) (0.010) (0.015) (0.014)
Asset Maturity 0.004*** 0.003*** -0.005*** -0.004***
(0.001) (0.001) (0.001) (0.001)
Firm Age -0.001 -0.001 0.001** 0.001**
(0.000) (0.000) (0.001) (0.001)
Year 2004 0.007 -0.009
(0.006) (0.009)
Year 2005 0.001 0.000
(0.008) (0.011)
Year 2006 -0.001 0.002
(0.008) (0.012)
Year 2007 -0.006 0.006
(0.009) (0.012)
Year 2008 -0.022** 0.029**
(0.009) (0.012)
Year 2009 0.027*** -0.042***
(0.009) (0.013)
Constant 0.346*** 0.749*** 0.927*** 0.319***
(0.085) (0.019) (0.114) (0.028)
Ind. FE Yes No Yes No
Rating FE Yes No Yes No
#Obs. 11,351 11,351 11,351 11,351
Adjusted R2 0.084 0.036 0.099 0.047
Adjusted R2 from fixed effects specifications
Year FE 0.001 0.001
Ind. FE 0.038 0.045
Rating FE 0.032 0.040
All FE 0.065 0.078

42
Table 8
Explaining Debt Structure
This table presents Tobit regression results to explain firms’ use of different debt types. Definitions of the variables are provided in
Table A1. Firm characteristics are lagged by one year. Industry fixed effects are based on two-digit SIC codes. Rating fixed effects
are based on 22 rating dummies and the unrated dummy. The tobit regressions account for two-sided censoring of the dependent
variables at 0 and 1. Standard errors are clustered at the firm level and reported in parentheses. ***, **, and * denote statistical
significance at the 1%, 5%, and 10% levels, respectively.
Regressors Debt Types Scaled by Total Debt
(1)
CP
(2)
RC
(3)
TL
(4)
SBN
(5)
SUB
(6)
CL
(7)
Other
Profitability 0.619*** 0.408*** 0.136 -0.230*** -0.160*** -0.170*** -0.092***
(0.049) (0.018) (0.091) (0.077) (0.037) (0.050) (0.033)
Tangibility 0.049** 0.113*** 0.186** 0.059 -0.709*** 0.155*** 0.001
(0.021) (0.013) (0.086) (0.077) (0.033) (0.043) (0.032)
M/B 0.017*** -0.040*** -0.034*** 0.019* -0.023*** 0.006 -0.003
(0.004) (0.003) (0.011) (0.010) (0.006) (0.005) (0.005)
Firm Size 0.041*** -0.054*** -0.072*** 0.073*** 0.090*** 0.007 0.033***
(0.001) (0.001) (0.010) (0.009) (0.002) (0.005) (0.005)
CF Volatility -2.498*** -1.407*** -1.094** 1.057*** 0.580*** -0.171 -0.151
(0.604) (0.102) (0.450) (0.390) (0.159) (0.163) (0.192)
Div Payer 0.074*** 0.063*** -0.026 0.077*** -0.346*** -0.055*** 0.000
(0.009) (0.006) (0.029) (0.024) (0.014) (0.014) (0.010)
Asset Mat. -0.001 -0.014*** -0.004 0.015*** 0.011*** -0.009*** -0.002
(0.001) (0.001) (0.004) (0.003) (0.001) (0.002) (0.001)
Firm Age 0.002*** 0.000 -0.004*** 0.004*** -0.000 -0.000 0.001***
(0.000) (0.000) (0.001) (0.001) (0.001) (0.000) (0.000)
Constant -0.777*** -2.756*** 0.887*** -0.387** -6.209*** -0.236 -0.148
(0.011) (0.007) (0.286) (0.173) (0.017) (0.179) (0.138)
Year FE Yes Yes Yes Yes Yes Yes Yes
Ind. FE Yes Yes Yes Yes Yes Yes Yes
Rating FE Yes Yes Yes Yes Yes Yes Yes
#Obs. 11,351 11,351 11,351 11,351 11,351 11,351 11,351
Pseudo R2 0.652 0.127 0.080 0.141 0.152 0.128 0.222

43
Table 9
Robustness Checks
This table provides robustness checks on results reported in Tables 5, 6, and 8. All debt types are calculated as a fraction of total debt. Definitions of the
variables are provided in Table A1. Panel A presents the sample mean and median of debt types and key firm characteristics for the six clusters sorted by
ascending cluster average firm size, using the firm-level observations obtained by time series averages. For Panels B and C, firm-year observations are
classified as relying on a significant amount of a given debt type if the amount of that debt type exceeds 10% of total debt. Panel B presents the shares of
observations with significant amounts of various debt types conditional on a particular debt type (given in the first column of the table) being significant.
Panel C presents the mean (first row) and median (second row) of each debt type conditional on a particular debt type (given in the first column of the table)
being significant, together with the number of observations for which a given debt type exceeds 10% of total debt (third row). We test for mean and median
debt type ratios being strictly greater than 10% (one-sided) using the t-test and the sign test. Panel D presents Tobit regression results to explain firms’ use
of different debt types including firm characteristics only. Firm characteristics are lagged by one year. The lower part in Panel D presents Pseudo R2 for
specifications with fixed effects only. Standard errors are clustered at the firm level and reported in parentheses. ***, **, and * denote statistical
significance at the 1%, 5%, and 10% levels, respectively.
Panel A: Cluster analysis using the firm-level observations
Debt Types
Cluster CP RC TL SBN SUB CL Other Profita-
bility
Tangi-
bility
M/B Firm
Size
CF
Vol.
Div.
Payer
Asset
Maturity
Firm
Age
Rated
(%)
Rating HHI Entropy Mkt.
Lev
#Obs.
1 0.00 0.83 0.06 0.04 0.01 0.02 0.01 0.09 0.26 1.40 435 0.02 0.25 3.63 13.71 0.06 22.34 0.77 0.33 0.19 654
0.00 0.89 0.00 0.00 0.00 0.00 0.00 0.11 0.17 1.10 176 0.01 0.00 1.89 10.50 0.00 23.00 0.84 0.26 0.14
2 0.00 0.04 0.04 0.04 0.00 0.84 0.00 0.01 0.21 1.82 525 0.03 0.09 3.73 9.80 0.05 22.54 0.85 0.21 0.07 161
0.00 0.00 0.00 0.00 0.00 1.00 0.00 0.07 0.13 1.42 195 0.02 0.00 2.62 7.00 0.00 23.00 1.00 0.00 0.02
3 0.00 0.07 0.81 0.03 0.03 0.02 0.01 0.04 0.25 1.60 627 0.02 0.18 4.06 10.85 0.19 21.03 0.76 0.34 0.22 728
0.00 0.00 0.85 0.00 0.00 0.00 0.00 0.11 0.18 1.25 164 0.01 0.00 2.55 8.50 0.00 23.00 0.83 0.28 0.16
4 0.00 0.05 0.08 0.06 0.76 0.02 0.01 0.08 0.23 1.55 1168 0.02 0.15 4.02 14.81 0.49 18.25 0.70 0.43 0.29 308
0.00 0.00 0.00 0.00 0.77 0.00 0.00 0.11 0.15 1.23 631 0.01 0.00 2.63 11.25 0.00 22.00 0.73 0.43 0.25
5 0.02 0.16 0.14 0.39 0.04 0.04 0.08 0.07 0.29 1.44 5274 0.02 0.28 4.42 16.93 0.37 18.48 0.50 0.71 0.27 491
0.00 0.10 0.04 0.46 0.00 0.00 0.00 0.11 0.22 1.12 607 0.01 0.00 2.81 12.50 0.00 23.00 0.43 0.74 0.22
6 0.01 0.03 0.02 0.88 0.01 0.01 0.01 0.08 0.30 1.60 5614 0.02 0.46 5.13 19.57 0.53 15.98 0.80 0.30 0.23 954
0.00 0.00 0.00 0.92 0.00 0.00 0.00 0.12 0.23 1.23 1167 0.01 0.00 3.37 14.00 1.00 15.00 0.85 0.26 0.19
All 0.01 0.22 0.23 0.34 0.09 0.06 0.02 0.07 0.27 1.54 2782 0.02 0.28 4.31 15.17 0.31 19.22 0.74 0.38 0.22 3296
0.00 0.01 0.00 0.10 0.00 0.00 0.00 0.11 0.19 1.20 392 0.01 0.00 0.00 23.00 0.00 23.00 0.78 0.35 0.17
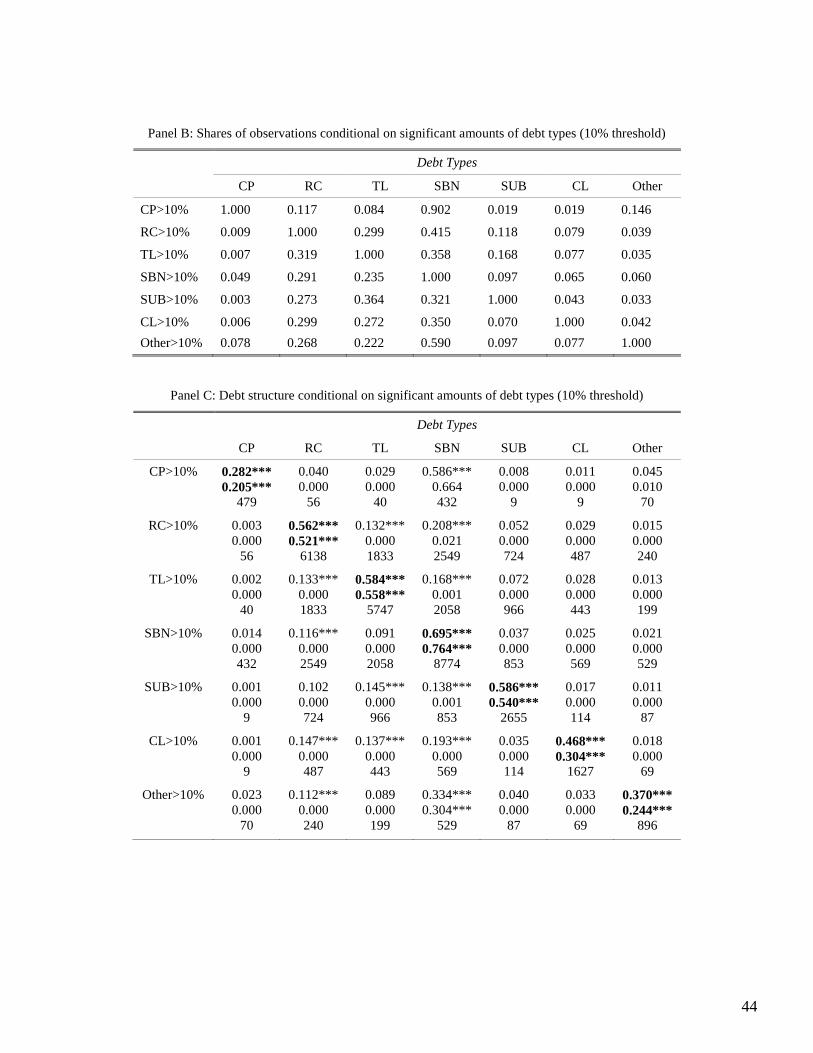
44
Panel B: Shares of observations conditional on significant amounts of debt types (10% threshold)
Debt Types
CP RC TL SBN SUB CL Other
CP>10% 1.000 0.117 0.084 0.902 0.019 0.019 0.146
RC>10% 0.009 1.000 0.299 0.415 0.118 0.079 0.039
TL>10% 0.007 0.319 1.000 0.358 0.168 0.077 0.035
SBN>10% 0.049 0.291 0.235 1.000 0.097 0.065 0.060
SUB>10% 0.003 0.273 0.364 0.321 1.000 0.043 0.033
CL>10% 0.006 0.299 0.272 0.350 0.070 1.000 0.042
Other>10% 0.078 0.268 0.222 0.590 0.097 0.077 1.000
Panel C: Debt structure conditional on significant amounts of debt types (10% threshold)
Debt Types
CP RC TL SBN SUB CL Other
CP>10% 0.282*** 0.040 0.029 0.586*** 0.008 0.011 0.045
0.205*** 0.000 0.000 0.664 0.000 0.000 0.010
479 56 40 432 9 9 70
RC>10% 0.003 0.562*** 0.132*** 0.208*** 0.052 0.029 0.015
0.000 0.521*** 0.000 0.021 0.000 0.000 0.000
56 6138 1833 2549 724 487 240
TL>10% 0.002 0.133*** 0.584*** 0.168*** 0.072 0.028 0.013
0.000 0.000 0.558*** 0.001 0.000 0.000 0.000
40 1833 5747 2058 966 443 199
SBN>10% 0.014 0.116*** 0.091 0.695*** 0.037 0.025 0.021
0.000 0.000 0.000 0.764*** 0.000 0.000 0.000
432 2549 2058 8774 853 569 529
SUB>10% 0.001 0.102 0.145*** 0.138*** 0.586*** 0.017 0.011
0.000 0.000 0.000 0.001 0.540*** 0.000 0.000
9 724 966 853 2655 114 87
CL>10% 0.001 0.147*** 0.137*** 0.193*** 0.035 0.468*** 0.018
0.000 0.000 0.000 0.000 0.000 0.304*** 0.000
9 487 443 569 114 1627 69
Other>10% 0.023 0.112*** 0.089 0.334*** 0.040 0.033 0.370***
0.000 0.000 0.000 0.304*** 0.000 0.000 0.244***
70 240 199 529 87 69 896

45
Panel D: Tobit specifications
Regressors Debt Types Scaled by Total Debt
(1)
CP
(2)
RC
(3)
TL
(4)
SBN
(5)
SUB
(6)
CL
(7)
Other
Profitability 0.622*** 0.567*** 0.052 -0.294*** -0.175 -0.142*** -0.105***
(0.226) (0.097) (0.093) (0.079) (0.141) (0.051) (0.034)
Tangibility 0.105 0.189*** 0.037 0.067 -0.538*** 0.124*** -0.019
(0.108) (0.060) (0.072) (0.063) (0.135) (0.035) (0.026)
M/B 0.061*** -0.053*** -0.036*** 0.025*** -0.057** 0.006 -0.001
(0.016) (0.015) (0.011) (0.009) (0.023) (0.005) (0.005)
Firm Size 0.122*** -0.098*** -0.063*** 0.108*** 0.110*** 0.003 0.036***
(0.013) (0.007) (0.008) (0.007) (0.014) (0.003) (0.004)
CF Volatility -6.346*** -1.663*** -1.822*** 1.283*** 0.570 -0.186 -0.167
(2.263) (0.473) (0.533) (0.401) (0.648) (0.173) (0.206)
Div Payer 0.229*** 0.073*** -0.059** 0.126*** -0.560*** -0.066*** 0.014
(0.041) (0.023) (0.029) (0.024) (0.064) (0.013) (0.010)
Asset Mat. -0.011* -0.011*** -0.001 0.013*** 0.007 -0.009*** -0.002
(0.006) (0.003) (0.003) (0.003) (0.005) (0.002) (0.001)
Firm Age 0.005*** -0.001 -0.004*** 0.005*** -0.005** -0.001* 0.002***
(0.001) (0.001) (0.001) (0.001) (0.002) (0.000) (0.000)
Constant -1.866*** 0.671*** 0.512*** -0.648*** -1.013*** -0.069*** -0.395***
(0.149) (0.049) (0.055) (0.046) (0.100) (0.023) (0.031)
Year FE No No No No No No No
Ind. FE No No No No No No No
Rating FE No No No No No No No
#Obs. 11,351 11,351 11,351 11,351 11,351 11,351 11,351
Pseudo R2 0.493 0.058 0.029 0.101 0.049 0.029 0.160
Pseudo R2 from fixed effects specifications
Year FE 0.005 0.003 0.003 0.001 0.008 0.001 0.002
Ind. FE 0.152 0.053 0.032 0.034 0.037 0.093 0.071
Rating FE 0.558 0.047 0.027 0.087 0.079 0.015 0.119
All FE 0.626 0.103 0.064 0.113 0.129 0.107 0.177