
Confirmatory Factor Analysis in Mplus
47
description
Confirmatory Factor Analysis in Mplus. Philip Hyland. [email protected] www.philiphyland.webs.com. Presentation Outline. Theoretical Introduction to Confirmatory Factor Analysis (CFA) Methods of CFA How to run CFA in Mplus - PowerPoint PPT Presentation
Transcript of Confirmatory Factor Analysis in Mplus

Presentation Outline
Theoretical Introduction to Confirmatory Factor Analysis (CFA)
Methods of CFA
How to run CFA in Mplus
Interpreting Output of CFA in Mplus
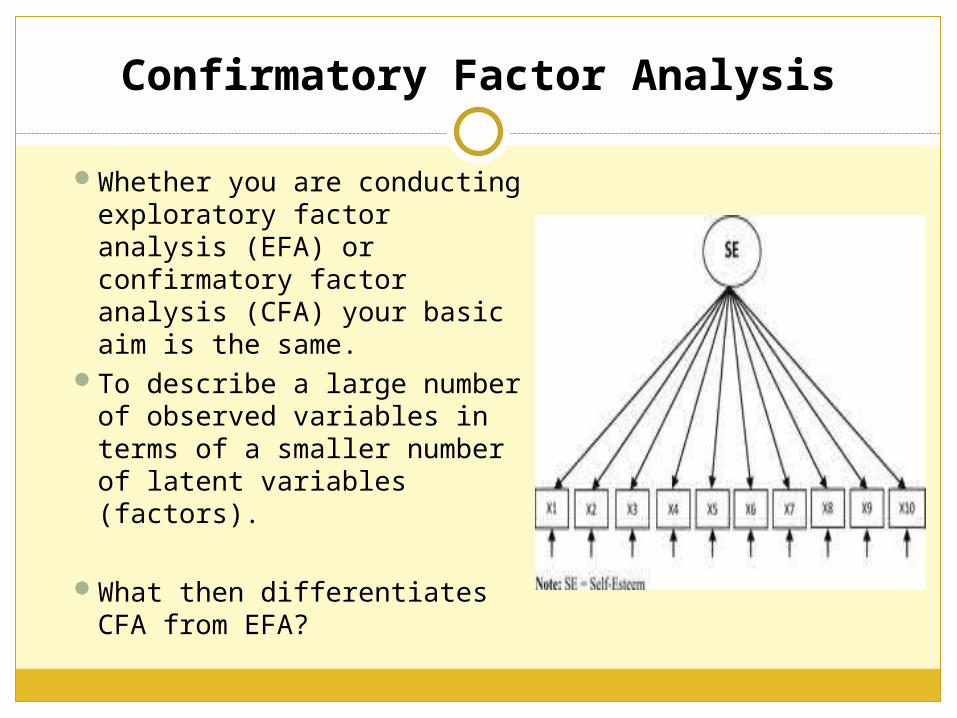
Whether you are conducting exploratory factor analysis (EFA) or confirmatory factor analysis (CFA) your basic aim is the same.
To describe a large number of observed variables in terms of a smaller number of latent variables (factors).
What then differentiates CFA from EFA?
Confirmatory Factor Analysis

CFA is a theoretically driven approach - EFA is statistically driven.
CFA has the ability to directly test specific hypotheses – EFA does not.
One of the primary reasons psychologists use CFA is to validate psychometric tests.
CFA vs. EFA

Construct validity involves determining whether a particular psychometric tool measures what it claims to.
For example, we developed the Measure of Criminal Social Identity to measure three distinct factors of Criminal Social Identity.
If we found that the observed covariance matrix was best explained by a 1 factor solution then this would undermine the measure’s construct validity.
We found a three factor solution was the best fit! (Boduszek, Adamson, Shevlin, & Hyland, 2012).
Construct Validity

Very often measures of psychological constructs are used without any explicit investigation that they are in fact measuring what they claim to measure.
CFA procedures afford psychologists the ability to explicitly investigate whether a given measure is performing as they intend it to.
Construct validity is only one element of the overall validation process but it is a critical element!
Construct Validity

Let’s look at our example for this section – The Posttraumatic Stress Diagnostic Scale (PDS: Foa, Cashman, Jaycox, & Perry, 1997)
The PDS contains questions that measure the severity of 17 symptoms listed in the DSM-IV which characterise PTSD.
The DSM-IV states that these 17 symptoms fall into three symptom categories (Factors): Intrusions, Avoidance & Emotional Numbing, and Hyperarousal.
PTSD Factor Structure

However, a large body of evidence suggest that these 17 symptoms are better represented by two distinct intercorrelated four-factor models.
Intrusions, Avoidance, Emotional Numbing, and Hyperarousal (King, Leskin, King, and Weathers 1998).
Intrusions, Avoidance, Dysphoria, and Hyperarousal (Simms, Watson, & Doebbeling, 2002).
PTSD Factor Structure

King

Simms
We now have a number of competing models that attempt to explain the underlying structure of these 17 symptoms.
Meaningless unless we have some empirical method of testing these competing prediction.
CFA makes it possible to test these competing theoretical predictions.
Competing Models

This testing procedure is related to the concept of model fit.
Let’s say we wanted to test the DSM’s 3-factor conceptualization.
We could go out a collect data from a sufficiently large sample of the population who have been exposed to a trauma.
If the DSM’s model reflects reality then there should be a covariance matrix within the obtained sample data consistent with this idea of three underlying factors.
In other words the obtained data should match (‘fit’) our theoretical prediction.
Model Fit

If our proposed model does not fit the data then our model is a not an accurate representation of reality.
This gets to the crux of why CFA is so valuable/powerful – Falsification.
A central feature of any scientific theory is that it must be falsifiable.
“A theory that explains everything explains nothing.” ~ Karl Popper
Falsification

Certain theoretical models may contain multiple factors that are proposed to be correlated.
If the correlations between factors are high, it is suggestive that the correlations among these factors may be accounted for by a superordinate factor, or factors.
An additional latent variable(s) may be responsible for the observed factor correlations.
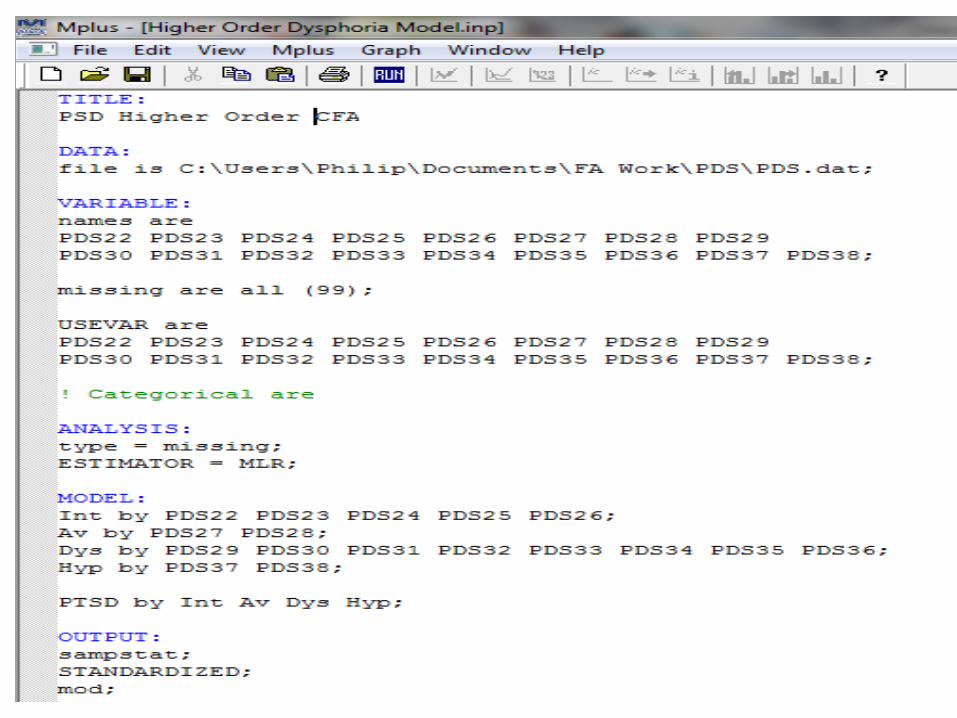
In our case the relationships between Intrusions, Avoidance, Dysphoria, and Hyperarousal may be explained by a higher-order latent variable - PTSD.
Higher Order Models

Assessing the accuracy of a theoretical model is judged in relation to its ‘goodness of fit’.
Same procedure as in the EFA!
Range of goodness of fit statistics available in Mplus.
Chi-Square, CFI, TLI, RMSEA, SRMR, AIC.
Model Fit

The 2 statistic is the most frequently cited index of absolute fit.
The probability of the 2 should be greater than the chosen alpha level (0.05).
Compares the observed covariance matrix with our theoretically proposed covariance matrix.
A non-significant result indicates no statistically significant difference between the actual covariance matrix and our proposed model to explain this covariance matrix.
Chi-Square (2)

The 2 statistic should be interpreted cautiously!Most criticisms of the 2 test are concerned with the
effects of sample size.The power of a test is positively related to sample size Poor models produce non-significant results with low
sample sizes while good models can produce statistically significant results when sample sizes are high.
Klein (1994) recommends evaluating the 2 result in relation to the degrees of freedom (df).
2:df values of less than 3:1 suggest good model fit.Despite the limitations of the 2 test researchers are
advised to always cite the value in their reports (Hoyle & Panter, 1995).
Chi-Square (2)

Comparative Fit Index (CFI; Bentler, 1990) and Tucker Lewis Index (TLI; Tucker and Lewis, 1973) are incremental fit indices.
CFI and TLI indicate how much better a model fits the data compared to a baseline model where all variables are uncorrelated.
Values can range from 0-1For these indices values above .90 indicate
reasonable fit Values above .95 indicated good model fit
(Bentler, 1990; Hu & Bentler, 1999).
CFI & TLI
The Root Mean Square Error of Approximation (RMSEA) is a measure of “discrepancy per degree of freedom” in a model (Browne & Cudeck, 1993).
This fit index recognises that models can only ever be approximately correct.
A flexible index based on chi-square yet takes parsimony into account
The addition of a parameter which reduces the chi-square by a substantial degree will cause a decrease in the RMSEA.
Produces calculation of confidence intervals and significance tests.
Values < 0.05 suggest good model fit.Values < 0.08 suggest reasonable model fit.
RMSEA

The standardized root mean-square residual (SRMR: Joreskog & Sorborn, 1981) is an absolute measure of fit
Is defined as the standardized difference between the observed correlation and the predicted correlation.
This measure tends to be smaller as sample size increases and as the number of parameters in the model increases – no penalties for model complexity.
Values < 0.05 indicate good model fitValues < 0.08 indicate reasonable model fit
SRMR
The Akaike Information Criterion (AIC; Akaike, 1974) is a comparative measure of model fit.
Only meaningful when multiple models are
estimated. Lower values indicate a better fit and so the
model with the lowest AIC is the best fitting model.
The AIC also contains explicit penalties for model complexity.
AIC
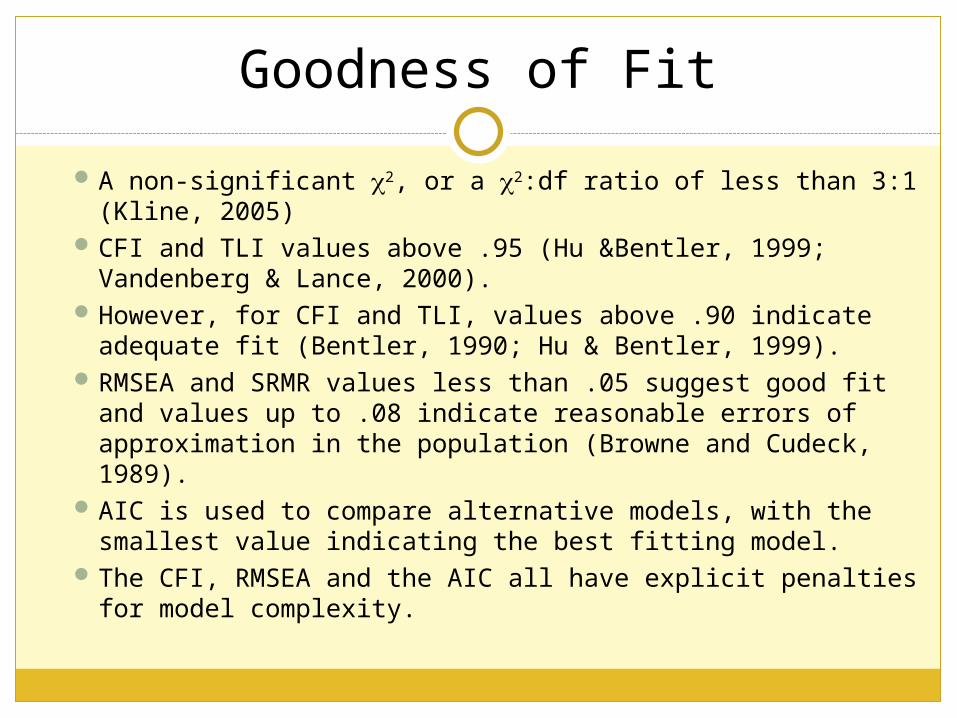
A non-significant 2, or a 2:df ratio of less than 3:1 (Kline, 2005)
CFI and TLI values above .95 (Hu &Bentler, 1999; Vandenberg & Lance, 2000).
However, for CFI and TLI, values above .90 indicate adequate fit (Bentler, 1990; Hu & Bentler, 1999).
RMSEA and SRMR values less than .05 suggest good fit and values up to .08 indicate reasonable errors of approximation in the population (Browne and Cudeck, 1989).
AIC is used to compare alternative models, with the smallest value indicating the best fitting model.
The CFI, RMSEA and the AIC all have explicit penalties for model complexity.
Goodness of Fit

The adequacy of any model can also be judge by investigating the factor loadings.
In CFA, there are generally no cross-factor loadings as in EFA, unless specifically indicated a priori.
These factor loadings represent the strength of the association between the latent variable and the observed variable.
Indicates how much of the variance in each indicator is explained by the latent variable.
The remainder is due to measurement error.
Factor Loadings

CFA is a theoretically driven analytic procedure.Allows researchers to determine the construct
validity of a measure.Has the ability to falsify proposed theoretical
models.Cannot prove that a model is “correct” – only fail
to reject it. Always the possibility that a better model exists which just hasn’t been tested.
Adequacy of a theoretical model is judged in terms of how well it “fits” the observed data – a range of fit statistics: 2, CFI, TLI, RMSEA, & SRMR.
Conclusion

How to Carry out CFA in Mplus
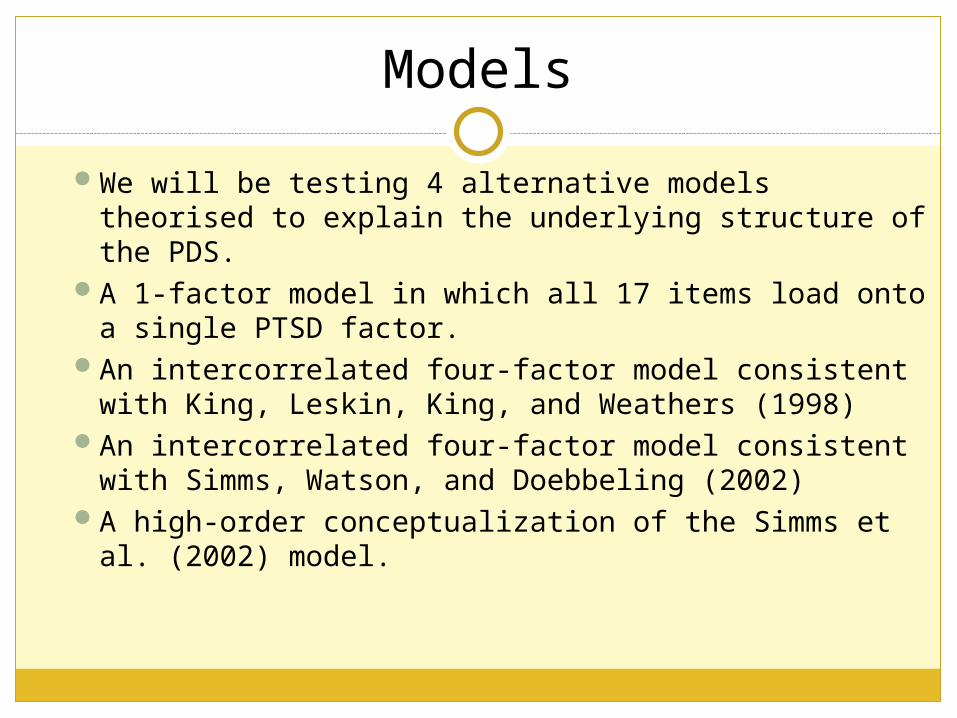
We will be testing 4 alternative models theorised to explain the underlying structure of the PDS.
A 1-factor model in which all 17 items load onto a single PTSD factor.
An intercorrelated four-factor model consistent with King, Leskin, King, and Weathers (1998)
An intercorrelated four-factor model consistent with Simms, Watson, and Doebbeling (2002)
A high-order conceptualization of the Simms et al. (2002) model.
Models

We will be using the data set entitled ‘PDS’Unlike SPSS, Mplus does not allow you to use
drop-down commands to estimate the model - you must write the syntax yourself (don’t panic!).
It is a good idea to create a shorter data set yourself for your specific analysis in Mplus.
Saving Data for Use in Mplus

Mplus cannot directly read an SPSS file.Mplus can easily read Tab delimited data, so we can save
our dataset as a .dat file. This can be done by choosing File, Save as.
Be sure to untick the box “Write Variable Names to Spreadsheet”
We will save the variable names quickly from SPSS by copying them from the Variable View window and pasting them into a new text editor or directly into an Mplus input file.
Ready to open a new Mplus window and start writing syntax.
Saving Data for Use in Mplus

Mplus Syntax for CFA

Mplus Syntax for CFA
Mplus Syntax for CFA
Mplus Syntax for CFA
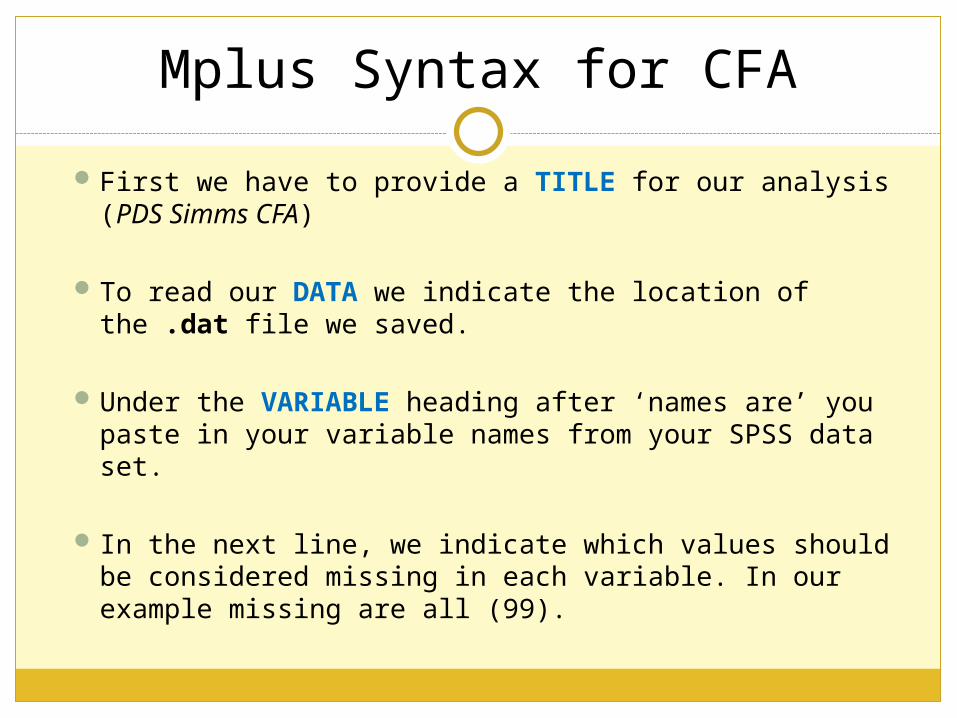
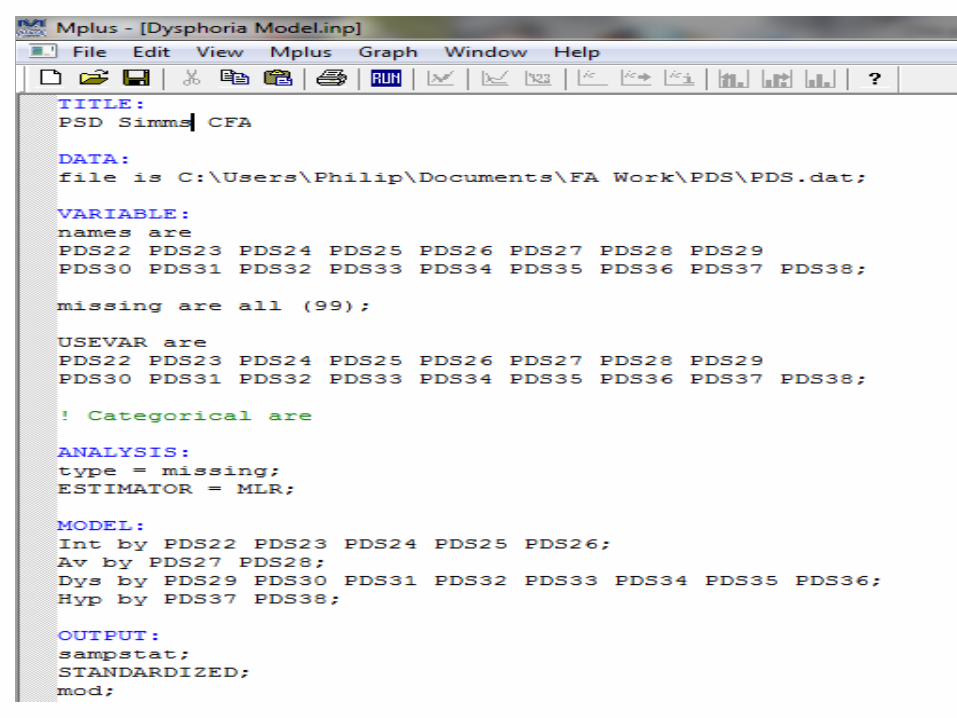
First we have to provide a TITLE for our analysis (PDS Simms CFA)
To read our DATA we indicate the location of the .dat file we saved.
Under the VARIABLE heading after ‘names are’ you paste in your variable names from your SPSS data set.
In the next line, we indicate which values should be considered missing in each variable. In our example missing are all (99).
Mplus Syntax for CFA

In USEVAR enter those variables which are to be used for the current analysis (PDS22-PDS38).
The CATEGORICAL option is used to specify which variables are treated as binary or ordered categorical (ordinal) variables in the model and its estimation.
Not applicable in this case so we place an ! in front – this eliminates this option
Under the ANALYSIS heading we must indicate what ESTIMATOR we will be using.
Mplus Syntax for CFA
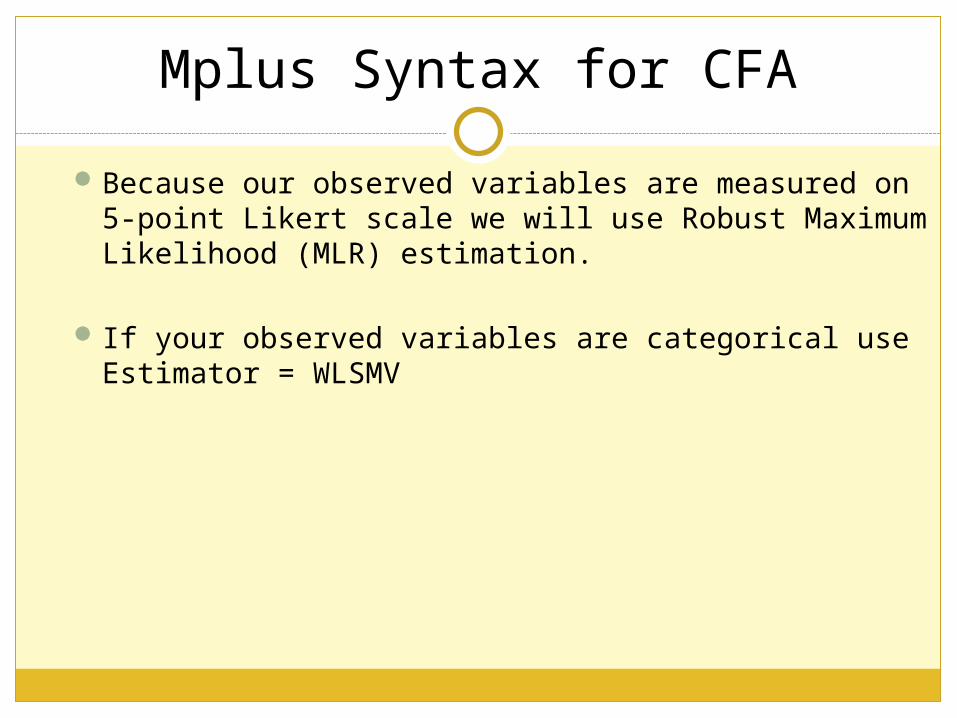
Because our observed variables are measured on 5-point Likert scale we will use Robust Maximum Likelihood (MLR) estimation.
If your observed variables are categorical use Estimator = WLSMV
Mplus Syntax for CFA

The MODEL statement specifies the particular model to be estimated.
This is the place where you have to create your latent variables (four factors in this example).
In CFA we use the command “by” to create latent variables.The latent variable “Intrusions” is measured by items
PDS22-PDS26The latent variable “Avoidance” is measured by items PDS
27-PDS28 The latent variable “Dysphoria” is measured by items
PDS29-PDS36The latent variable “Hyperarousal” is measured by items
PDS37-PDS38
Mplus Syntax for CFA

The metric of the factors is set automatically by the program by fixing the first factor loading in each “by” statement to 1.
The factor loadings (and error variances) for each indicator are estimated – along with a significance test.
The error variances are not correlated as the default.
The factors are correlated as the default .
In the OUTPUT: we want MODINDICES and STANDARDIZED.
Mplus Syntax for CFA

There are a few things to keep in mind when creating Mplus syntax.
First, all commands end with a semicolon; omitting the semicolon will lead to error messages.
Second, commands can take up more than one line, as the semicolon marks the command end.
Finally, Mplus is not case sensitive; capital and lowercase letters can be used interchangeably.
Mplus Syntax for CFA

Once you have created syntax for confirmatory factor analysis press to run the model.
Save this as an input file under some name e.g., dysphoria model.inp in the same folder as the PDS.dat file.
This produces a text output (.out) file stored in the working directory with the results.
For this model the output file looks like the following:
Mplus Output for CFA
Mplus Output for CFA

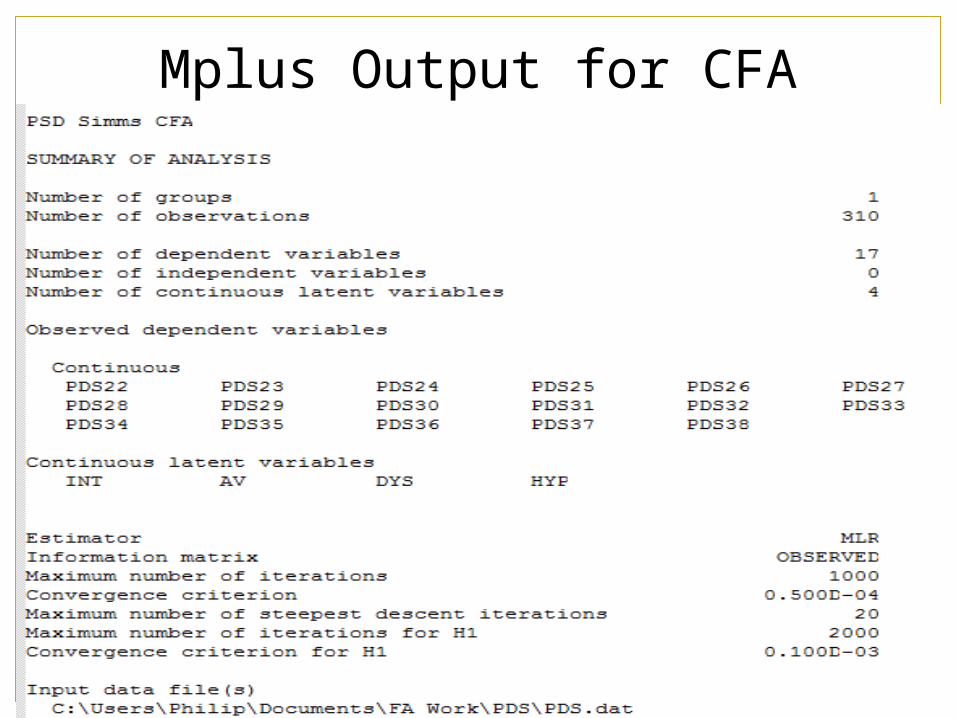
The first part of the output provides a summary of the analysis including:
The number of groups (1)The number of observations (participants included in
the analysis, N=310) The number of items included in the confirmatory
model (number of dependent variables = 17) The number of latent variables (4). Furthermore, Mplus gives more info which you do
not need to report except what Estimator was used (in this example it was MLR= robust maximum likelihood).
Mplus Output for CFA

The next step is to investigate how well the model fit our data.
This model of the symptom structure was specified and estimated in Mplus as an intercorrelated 4-factor solution.
Before we look at the factor structure we have to assess the fit between the data and pre-established theoretical model.
Goodness-of-fit indices are used to assess model fit.
Assessing Model Fit


If this 4-factor model fits the data, and better than other models tested, then we are interested in more details about this model.
Mplus output provides lots of information however you are interested only in few of them.
Unstandardized Factor Loadings and Standard Errors
Standardized Factor Loadings and Significance Levels
Factor Correlations.
Assessing Model Fit

Unstandardized/S.E.

Standardized Results (STDXY)

Presenting Results
Table 2
Fit Indices for Alternative Factor Models of the PDS
Measure χ2 df CFI TLI RMSEA SRMR AIC
PDS
King et al.
208.115*
113
.96
.95
.05
.04
10357.414
Simms et al. 152.937* 113 .98 .98 .03 .03 10257.512
DSM-IV 269.955* 116 .93 .92 .07 .05 10439.115
Note. χ2 = chi square goodness of fit statistic; df = degrees of freedom; RMSEA = Root-Mean-Square Error of Approximation; AIC = Akaike Information Criterion; CFI = Comparative Fit Index; TLI = Tucker Lewis Index; SRMR = Standardized Square Root Mean Residual. * Indicates χ2 are statistically significant (p < .001).