Confined Flow of Polymer Blends - Materials...
12
Confined Flow of Polymer Blends C. Tufano, G. W. M. Peters,* and H. E. H. Meijer EindhoVen UniVersity of Technology, Department of Mechanical Engineering, EindhoVen, The Netherlands ReceiVed NoVember 23, 2007. In Final Form: January 25, 2008 The influence of confinement on the steady-state morphology of two different emulsions is investigated. The blends, made from polybutene (PB) in polydimethylsiloxane (PDMS) and polybutadiene (PBD) in PDMS, are sheared between two parallel plates, mostly with a standard gap spacing of 40 μm, in the range of shear rates at which the transition from “bulk” behavior toward “confined” behavior is observed. For both cases, the influence of the concentration was systematically investigated, as well as the shear rate effects on the final steady-state morphology. By decreasing the shear rate, for each blend, the increasing droplets, i.e., increasing confinement for a fixed gap spacing, arrange themselves first into two layers, and when the degree of confinement reaches an even higher value, a single layer of droplets is formed. The ratio between the drop diameters and the gap spacing at which this transition occurs is always lower than 0.5. While decreasing the shear rate, the degree of confinement increases due to drop coalescence. Droplets arrange themselves in superstructures like ordered pearl necklaces and, at the lower shear rates, strings. The aspect ratio and the width of the droplet obtained from optical micrographs are compared to predictions of the single droplet Maffettone-Minale model (MM model 1 ). It is found that the theory, meant for unconfined shear flow, is not able to predict the drop deformation when the degree of confinement is above a critical value that depends on the blends considered and the shear rate applied. A recently developed extension of the MM model is reported by Minale (M model 2 ) where the effect of the confinement is included by using the Shapira-Haber correction. 3 Further extending this M model, by incorporating an effective viscosity as originally proposed by Choi and Showalter, 4 we arrive at the mM model that accurately describes the experiments of blends in confined flow. 1. Introduction 1.1. Blends in Unconfined Flow. The technological importance of physical blends of immiscible polymers is evident. When blending two “immiscible” polymers, they acquire a small-scale arrangement which is a function of the fluid properties and of the flow history applied during processing. This microstructure affects the rheological, optical, and transport properties of the mixture and, therefore, the properties of the final product. Basic understanding of the dispersion mechanisms originates from the work of Taylor, 5 and morphology development in emulsions has been subsequently extensively studied for different types of flows (for reviews see, e.g., refs 6-9). When flow is imposed on a mixture (restricting to Newtonian components), shear stresses tend to deform the droplets, while the interfacial tension tends to keep them in the spherical shape. The ratio of the viscous and interfacial stresses defines the capillary number, Ca ) (η m γ ˘ R)/σ, where η m is the viscosity of the matrix phase, γ ˘ is the shear rate, R the drop radius, and σ the interfacial tension. The critical capillary number is a function of the viscosity ratio, defined as p ) η d /η m , where η d is the viscosity of the dispersed phase and reflects the situation when interfacial tension is not longer able to balance the deformation stress induced by the flow. Once Ca(p) exceeds a critical value, Ca cr , the droplets deform irreversibly and break up. When Ca , 1, the deformation of the droplet in flow is limited and the drop shape is close to spherical. In this case, Taylor approximated the drop shape by an ellipse. Given the major (L) and the minor (B) axes of the ellipse in the velocity-velocity gradient plane (see Figure 1), the deformation parameter, D, was defined D is equal to zero in the case of a spherical drop, and it increases asymptotically to 1 when the drop deforms. For values of D close to 1, slender-body theories apply, 10-12 and assuming that during the deformation the cross-section of the deformed droplet remains circular (B ) W in Figure 1), a more appropriate deformation parameter, related to D, was defined A relatively simple, phenomenological, 3D model for drop deformation in an arbitrary flow field was presented by Maffettone and Minale 1 and it describes the transient evolution of an elliptically deformed drop in terms of the three axis (L, B, W). Analytical solutions for the steady-state shape in simple shear and in elongational flow are reported, preserving drop volume at any deformation. These models, as well as most of the present experimental work, address polymer blends used in macroscopic devices, and results are restricted to the “bulk regime”, where the characteristic size of the blend components is much smaller than the typical size of the flow geometry. 1.2. Blends in Confined Flow. More recently, emulsions flowing in microscopic devices have received attention 13-15 and miniaturization leads to processes in which the characteristic * To whom correspondence should be addressed. E-mail: g.w.m. [email protected]. (1) Maffettone, P. L.; Minale, M. J. Non-Newt. Fluid Mech. 1998, 78, 227- 241. (2) Minale, M. Rheol. Acta 2008, In press. (3) Shapira, M.; Haber, S. Int. J. Multiph. Flow 1990, 16, 305-321. (4) Choi, S. J.; Showalter, W. R. Phys. Fluids 1975, 18, 420-427. (5) Taylor, G. I. Proc. R. Soc. London, A 1932, 138, 41-48. (6) Rallison, J. M. Annu. ReV. Fluid Mech. 1984, 16, 45-66. (7) Stone, H. A. Annu. ReV. Fluid Mech. 1994, 26, 65-102. (8) Ottino, J. M.; De Roussel, P.; Hansen, S.; Khakhar, D. V. AdV. Chem. Eng. 1999, 25, 105-204. (9) Tucker, C. L.; Moldenaers, P. Annu. ReV. Fluid Mech. 2002, 34, 177-210. (10) Hinch, E. J.; Acrivos, P. J. Fluid Mech. 1980, 98, 305-328. (11) Khakhar, D. V.; Ottino, J. M. J. Fluid Mech. 1986, 166, 265-285. (12) Bentley, B. J.; Leal, L. G. J. Fluid Mech. 1986, 167, 241-283. D ) L - B L + B (1) r p ) L B ) 1 + D 1 - D (2) 4494 Langmuir 2008, 24, 4494-4505 10.1021/la7036636 CCC: $40.75 © 2008 American Chemical Society Published on Web 03/19/2008
Transcript of Confined Flow of Polymer Blends - Materials...

Confined Flow of Polymer Blends
C. Tufano, G. W. M. Peters,* and H. E. H. Meijer
EindhoVen UniVersity of Technology, Department of Mechanical Engineering, EindhoVen, The Netherlands
ReceiVed NoVember 23, 2007. In Final Form: January 25, 2008
The influence of confinement on the steady-state morphology of two different emulsions is investigated. The blends,made from polybutene (PB) in polydimethylsiloxane (PDMS) and polybutadiene (PBD) in PDMS, are sheared betweentwo parallel plates, mostly with a standard gap spacing of 40 μm, in the range of shear rates at which the transitionfrom “bulk” behavior toward “confined” behavior is observed. For both cases, the influence of the concentration wassystematically investigated, as well as the shear rate effects on the final steady-state morphology. By decreasing theshear rate, for each blend, the increasing droplets, i.e., increasing confinement for a fixed gap spacing, arrangethemselves first into two layers, and when the degree of confinement reaches an even higher value, a single layerof droplets is formed. The ratio between the drop diameters and the gap spacing at which this transition occurs is alwayslower than 0.5. While decreasing the shear rate, the degree of confinement increases due to drop coalescence. Dropletsarrange themselves in superstructures like ordered pearl necklaces and, at the lower shear rates, strings. The aspectratio and the width of the droplet obtained from optical micrographs are compared to predictions of the single dropletMaffettone-Minale model (MM model1). It is found that the theory, meant for unconfined shear flow, is not ableto predict the drop deformation when the degree of confinement is above a critical value that depends on the blendsconsidered and the shear rate applied. A recently developed extension of the MM model is reported by Minale (Mmodel2) where the effect of the confinement is included by using the Shapira-Haber correction.3 Further extendingthis M model, by incorporating an effective viscosity as originally proposed by Choi and Showalter,4 we arrive atthe mM model that accurately describes the experiments of blends in confined flow.
1. Introduction
1.1.Blends inUnconfinedFlow. The technological importanceof physical blends of immiscible polymers is evident. Whenblending two “immiscible” polymers, they acquire a small-scalearrangement which is a function of the fluid properties and ofthe flow history applied during processing. This microstructureaffects the rheological, optical, and transport properties of themixture and, therefore, the properties of the final product. Basicunderstanding of the dispersion mechanisms originates from thework of Taylor,5 and morphology development in emulsions hasbeen subsequently extensively studied for different types of flows(for reviews see, e.g., refs 6-9). When flow is imposed on amixture (restricting to Newtonian components), shear stressestend to deform the droplets, while the interfacial tension tendsto keep them in the spherical shape. The ratio of the viscous andinterfacial stresses defines the capillary number, Ca) (ηmγ̆R)/σ,where ηm is the viscosity of the matrix phase, γ̆ is the shear rate,R the drop radius, and σ the interfacial tension. The criticalcapillary number is a function of the viscosity ratio, defined asp ) ηd/ηm, where ηd is the viscosity of the dispersed phase andreflects the situation when interfacial tension is not longer ableto balance the deformation stress induced by the flow. OnceCa(p) exceeds a critical value, Cacr, the droplets deformirreversibly and break up.
When Ca, 1, the deformation of the droplet in flow is limitedand the drop shape is close to spherical. In this case, Taylorapproximated the drop shape by an ellipse. Given the major (L)and the minor (B) axes of the ellipse in the velocity-velocitygradient plane (see Figure 1), the deformation parameter, D, wasdefined
D is equal to zero in the case of a spherical drop, and it increasesasymptotically to 1 when the drop deforms. For values of Dclose to 1, slender-body theories apply,10-12 and assuming thatduring the deformation the cross-section of the deformed dropletremains circular (B ) W in Figure 1), a more appropriatedeformation parameter, related to D, was defined
A relatively simple, phenomenological, 3D model for dropdeformation in an arbitrary flow field was presented by Maffettoneand Minale1 and it describes the transient evolution of anelliptically deformed drop in terms of the three axis (L, B, W).Analytical solutions for the steady-state shape in simple shearand in elongational flow are reported, preserving drop volumeat any deformation. These models, as well as most of the presentexperimental work, address polymer blends used in macroscopicdevices, and results are restricted to the “bulk regime”, wherethe characteristic size of the blend components is much smallerthan the typical size of the flow geometry.
1.2. Blends in Confined Flow. More recently, emulsionsflowing in microscopic devices have received attention13-15 andminiaturization leads to processes in which the characteristic
* To whom correspondence should be addressed. E-mail: [email protected].
(1) Maffettone, P. L.; Minale, M. J. Non-Newt. Fluid Mech. 1998, 78, 227-241.
(2) Minale, M. Rheol. Acta 2008, In press.(3) Shapira, M.; Haber, S. Int. J. Multiph. Flow 1990, 16, 305-321.(4) Choi, S. J.; Showalter, W. R. Phys. Fluids 1975, 18, 420-427.(5) Taylor, G. I. Proc. R. Soc. London, A 1932, 138, 41-48.(6) Rallison, J. M. Annu. ReV. Fluid Mech. 1984, 16, 45-66.(7) Stone, H. A. Annu. ReV. Fluid Mech. 1994, 26, 65-102.(8) Ottino, J. M.; De Roussel, P.; Hansen, S.; Khakhar, D. V. AdV. Chem. Eng.
1999, 25, 105-204.(9) Tucker, C. L.; Moldenaers, P. Annu. ReV. Fluid Mech. 2002, 34, 177-210.
(10) Hinch, E. J.; Acrivos, P. J. Fluid Mech. 1980, 98, 305-328.(11) Khakhar, D. V.; Ottino, J. M. J. Fluid Mech. 1986, 166, 265-285.(12) Bentley, B. J.; Leal, L. G. J. Fluid Mech. 1986, 167, 241-283.
D ) L - BL + B
(1)
rp )LB) 1 + D
1 - D(2)
4494 Langmuir 2008, 24, 4494-4505
10.1021/la7036636 CCC: $40.75 © 2008 American Chemical SocietyPublished on Web 03/19/2008
sizes of device and morphology are comparable. When limitingto homogeneous shear flows, two types of studies in confinedflow can be considered: studies focused on the effects ofconfinement on a single droplet, experimental16-18 and numer-ical,1,3,2,19 and studies focusing on blends.20-24 We will investigateto what extend the relatively simple single-droplet models apply(see Sections 3 and 4) to the blends investigated. Only limitedexperimental work is available in literature, and the physics behindthe flow of emulsions in confined geometries is a new and growingfield of investigation. Migler20 reported a droplet-string transitionfor a blend of polydimethylsiloxane (PDMS) in polyisobutylene(PIB) at a mass ratio of 0.28 and viscosity ratio, p, equal to 1.The sample was loaded in a parallel plate geometry, with a fixedgap, H ) 36 μm. The shear rate was decreased gradually, andthe size of the inclusions increased due to coalescence. It enhancedthe degree of confinement, inducing the transition droplets-strings. Strings, wide enough to interact with the walls, werefound to be stable even upon cessation of flow. The stability ofnarrower strings during flow, and the occurrence of break-upupon cessation of flow, was explained by the suppression of theRaylegh-Tomotika mechanism by a shear field.25 Pathak et al.21
reported effects of the composition on the flow-inducedmorphology, again for blends of PDMS in PIB with p equal tounity. Apart from the transition droplets-strings, they observedthat the droplets arrange into discrete layers during shear. Theformation of two layers was observed at higher shear rates, whilethe transition to a single layer was found at lower shear rates.This transition was attributed to the increase in the average droplet
size, i.e., an increase in the degree of confinement. The effectsof mixture composition, shear rate applied, and confinement onthe development of the morphology in the transition zone betweenbulk behavior and string transition were summarized in amorphology diagram. Some arguments were offered in order toexplain the layering of droplets, based on the finite-size effects,migration of droplets from the walls toward the center, and dropletcollisions. However, the physics behind the phenomena occurringis still poorly understood. Pathak et al.22 investigated the effectof the confinement for a blend containing the 9.7 wt % of PDMSin PIB with p equal to unity. They reported three additionalstates to stable and unstable droplets present in the bulksstableand unstable strings and squashed dropletssand they concludedthat confinement promotes deformation and allows for theexistence of droplets with high aspect ratios, with dimensionsabove the critical values predicted with bulk theories. Finite-sizeeffects were also reported by Mietus et al.23 for a mixture ofwater droplets in oil in a Couette flow. They observed theformation of toroidal rings and water sheaths. Recently, Vanan-roye et al.24 also investigated the effects of confinement on themorphology of PIB/PDMS mixtures with p ) 0.46 and showedthat, for this case, the mean droplet size during simple shear canbe predicted by the same relations that apply in bulk situations.However, they also reported an organization of droplets insuperstructures depending on shear rates and concentrationsapplied and a transition to a single layer was observed forconfinement ratios lower than those reported in literature.
Our goal is to study flow-induced morphology developmentfor two material combinations that differ in viscosity ratio, in aconfined geometry using optical microscopy, and check for whatexperimental conditions the geometrical confinement influencesthe blend morphology. We will compare our experimental resultswith those found in literature and we will check when theMaffettone-Minale model still applies, and in addition, the resultsare compared to the predictions of a modified version of theMaffettone-Minale model, recently proposed by Minale,2 thattakes into account the degree of confinement. We propose afurther step by using the effective blend viscosity in this Minalemodel. The influence of shear rate and concentration applied ondroplet deformation is systematically investigated. The twoemulsions used are polybutene (PB)/PDMS and polybutadiene(PBD)/PDMS with PDMS as the continuous phase in both cases.The viscosity ratios, p, are equal to 0.33 and 1.26, respectively.Concentrations of 10%, 20%, and 30% are investigated.Confinement is generated by means of a parallel-plate geometryand the shear rate is gradually decreased to enter the transitionzone between bulk-like behavior and the range in which finite-size effects are present. In addition, a comparison between thesteady-state average drop size and the predictions of the partiallymobile interface model is carried out.
2. Materials and Methods
2.1. Materials. PB (Indopol H-25, BP Chemicals, UK; Mn )635) and PBD (Ricon 134, Sartomer; Mn ) 8000) are used asdispersed phases, and PDMS (UCT; Mn ) 62 700) as the continuousphase. The materials are liquid and transparent at room temperature.With a digital density meter (DMA 5000, Anton Paar), the densityof PB (FPB ) 874 Kg/m3), PBD (FPBD ) 891 Kg/m3) and PDMS(FPDMS) 972 Kg/m3) were measured at 23 °C. The density differencefor the PB/PDMS, as well as for the PBD/PDMS emulsions, is smallenough to allow the neglecting of buoyancy effects given the timescale of the experiments. Zero-shear viscosities were measured at23 °C using a rotational rheometer (Rheometrics, ARES II rotationalrheometer with a 10GM FRT transducer) equipped with a parallel-plate geometry and applying steady shear rates: ηPB ) 3.7 Pa‚s,ηPBD) 13.6 Pa‚s, ηPDMS) 10.9 Pa‚s. The viscosity ratios are pPB/PDMS
(13) Stone, H. A.; Stroock, A. D.; Ajdari, A. Annu. ReV. Fluid Mech. 2004,36, 381-411.
(14) Link, D. R.; Anna, S. L.; Weitz, D. A.; Stone, H. A. Phys. ReV. Lett. 2004,92, 0545031-0545034.
(15) Utada, A. S.; Lorenceau, E.; Link, D. R.; Kaplan, P. D.; Stone, H. A.;Weitz, D. A. Science 2005, 308, 537-541.
(16) Sibillo, V.; Pasquariello, G.; Simeone, M.; Cristini, V.; Guido, S. Phys.ReV. Lett. 2006, 97, 0545021-0545024.
(17) Vananroye, A.; Van Puyvelde, P.; Moldenaers, P. Langmuir 2006, 22,3972-3974.
(18) Vananroye, A.; Van Puyvelde, P.; Moldenaers, P. J. Rheol. 2007, 51,139-153.
(19) Janssen, P. J. A.; Anderson, P. D. Phys. Fluids 2007, 19, 0436021-04360211.
(20) Migler, K. B. Phys. ReV. Lett. 2001, 86, 1023-1026.(21) Pathak, J. A.; Davis, M. C.; Hudson, S. D.; Migler, K. B. J. Colloid
Interface Sci. 2002, 255, 391-402.(22) Pathak, J. A.; Migler, K. B. Langmuir 2003, 19, 8667-8674.(23) Mietus, W. G. P.; Matar, O. K.; Seevaratnam, G.; Wong, A.; Briscoe, B.
J.; Lawrence, C. J. Phys. ReV. Lett. 2001, 86, 1211-1214.(24) Vananroye, A.; Van Puyvelde, P.; Moldenaers, P. Langmuir 2006, 22,
2273-2280.(25) Frischknecht, A. Phys. ReV. Lett. 1998, E 58, 3495-3514.
Figure 1. Schematic picture of a deformed droplet in simple shearflow. Top and side view, with the notation for the axes L, B, andW and orientation angle θ.
Confined Flow of Polymer Blends Langmuir, Vol. 24, No. 9, 2008 4495
) 0.34 and pPBD/PDMS ) 1.24. For the whole range of shear ratesapplied, the viscosities of the pure components are independent ofshear rate and the first normal stress differences are too small to bemeasured with our equipment. The pure components behave asNewtonian fluids in the conditions in which the optical experimentsare carried out. The viscosity ratio, p, and dependent critical capillarynumber, Cacr(p), can be found, e.g., in Grace’s original data26 or byusing de Bruijn’s fit to these data,27 once p is known; we find Cacr
)0.47 for PB/PDMS and Cacr)0.5 for PBD/PDMS. The equilibriuminterfacial tension was measured at room temperature, σPB/PDMS )2.2×10⁻³ N/m and σPBD/PDMS)4.2×10-3N/m. Three compositions,10%, 20%, and 30% mass fraction of PB and PBD, respectively,were investigated and the blends were prepared following the provenprotocol of Vinckier et al.28 and Takahashi et al.29 (the correct amountof the two phases were weighted and mixed by hand with a spatulafor around 15 min). White, cream-like blends were obtained, andusing a vacuum oven for 1 h at room temperature, air-free sampleswere prepared.
2.2. Experimental Methods. Flow experiments were performedon freshly made mixtures using a CSS-450 Linkam shear cell fromLinkam Scientific Instruments. The sample chamber consists of twoparallel quartz plates. The gap, H, between these can be varied bymeans of a stepper motor. Steady shear flow, at the desired shearrates, can be applied. In most of the experiments the gap betweenthe plates, H, was set to 40 μm and calibration of the shear cell wasperformed prior to each experiment. In order to carefully set the gap,after checking the parallelism between the plates, two markers wereapplied, on the top and on the bottom window. The distance betweenthe two windows was determined by measuring the translation ofthe stage of a microscope, when focusing on the markers in thepresence of air. This procedure was already adopted by Pathak etal.22 Once the sample was loaded, the shear cell was placed on thestage of an Olympus optical microscope. Images were acquired,during and after flow, in the velocity-vorticity plane, using objectiveswith a magnification of 5×, 10×, 20×, and 50×. Experiments withPB/PDMS blends were performed at shear rates ranging between10 s-1 and 0.8 s-1 and an Olympus color view III camera was used.In order to detect the transition from bulk to confined behavior forthe PBD/PDMS system, it was necessary to perform experimentsat shear rates as high as 20 s-1. A high-speed camera, able to acquireup to 200 fps was used for these experiments. In the first case,images were analyzed with software tailor-made for the Olympuscamera (analySIS), while in the second case, commercial imageanalysis software was used (Scion Image). The temperature was setat 23( 1 °C. Samples were sheared at high shear rates for a sufficientlong time. Once a fine morphology was created, the shear rate wasdecreased in steps of 20% or less, allowing at least 2 h shearing ateach shear rate, required to obtain a steady morphology, after whichthe flow was stopped and the droplets were allowed to relax. Next,the flow was restarted at a lower shear rate. In the results presentedin Sections 3 and 4, we will refer to a dimensionless shear rate, γ̆/γ̆d,as proposed in ref 20 where γ̆d ) σ/Hηm. From the images takenduring flow, the axis W and Lp can be measured (see Figure 1), andfrom images taken after cessation of flow, the droplet radius, R, ismeasured. However, in order to investigate the influence of thedegree of confinement, shear rate, and blend concentration on themorphology evolution, the aspect ratios of the droplets need to beknown. When droplets are approximated with an ellipsoid, L andB are related to the projection of L in the velocity-vorticity plane(Lp):
The orientation angle, θ, is not measured since acquisition ofimages in the velocity-velocity gradient plane is not possible in ourexperimental setup. We will use the two limiting cases for θ todetermine rp, i.e., the orientation angle for unconfined flow predicted
by the Maffettone-Minale model (θMM) in combination with volumeconservation (see Section 2.3) and the case of θ ) 0, correspondingto droplets fully aligned in the flow direction.
2.3. Maffettone-Minale Model. Maffettone et al.1 proposed aphenomenological model (MM model in the rest of the text) topredict the deformation (L, B, and W) and the orientation angle(θMM) for single 3D droplets in an unconfined flow. The model isan extension of the well-known Taylor model that is limited to smalldeformation.5 The model, based on the assumptions that the dropis incompressible and its shape is ellipsoidal during flow, predictsthe three main axes of an elliptical drop and its orientation in anarbitrary flow field. The applicability of the model was proven forviscosity ratios below and above one, up to Cacr, which is the casein all the experiments we show here. For simple shear flow, analyticalsolutions for L, B, W, and θ as function of Ca and p are available
where f1MM and f2MM are dimensionless and non-negative functionsof p and Ca given by
The aspect ratio of a drop as function of the dimensionless numbersCa and p is obtained by substituting eqs 4 and 5 in the definitionof rp (eq 2)
Using conservation of volume, L, B, W and the radius of therelaxed droplets, R, can be related
With the measured values of Lp, W, and R and using eqs 3, 7, and11, L and B, and therefore the droplet aspect ratio, rp, can be calculated,i.e., assuming the orientation angle from the MM model applies.The other limiting case is obtained by taking θ ) 0 instead of usingeq 7. In the case strings are present, they break up upon cessationof the flow. In that case, following Pathak et al.,22 the radius of therelaxed drop can be calculated approximating the elongated dropwith a cylinder and equating the volume of the string (πLB2/4) tothe volume of the equivalent sphere (4πR3/3). This choice neglectsthe contribution of the two ends of each string. The aspect ratio ofthe droplets, rp, can be compared to the predictions of eq 10. Equation7 has been reported to properly predict the drop orientation, up toa degree of confinement 2R/H < 0.5.24 However, we will show that,for the blends and in the conditions investigated here, deviationsfrom the MM model predictions start to occur for a smaller degreeof confinement. The width of the droplets found experimentally are(26) Grace, H. P. Chem. Eng. Commun. 1982, 14, 225-277.
(27) De Bruijn, R. A. Ph.D. thesis, Eindhoven University of Technology,1989.
(28) Vinckier, I.; Moldenaers, P.; Mewis, J. J. Rheol. 1996, 40, 613-631.(29) Takahashi, Y.; Kurashima, N.; Noda, I.; Doi, M. J. Rheol. 1994, 38,
699-712.
L ) 2R [ f1MM2 + Ca2 + f2MMCa (f1MM
2 + Ca2)1/2
(f1MM2 + Ca2)1/3(f1MM
2 + Ca2 - f2MM2 Ca2)2/3]1/2
(4)
B ) 2R[ f1MM2 + Ca2 - f2MMCa (f1MM
2 + Ca2)1/2
(f1MM2 + Ca2)1/3(f1MM
2 + Ca2 - f2MM2 Ca2)2/3]1/2
(5)
W ) 2R[ f1MM2 + Ca2 - f2MM
2 Ca2
(f1MM2 + Ca2)1/3(f1MM
2 + Ca2 - f2MM2 Ca2)2/3]1/2
(6)
θMM ) 12
arctan (f1MM
Ca ) (7)
f1MM )40(p + 1)
(2p + 3) (19p + 16)(8)
f2MM ) 52p + 3
+ 3Ca2
2 + 6Ca2(9)
rp )f2MMCa + (f1MM
2 + Ca2)1/2 - (f1MM2 + Ca2 - f2MM
2 Ca2)1/2
f2MMCa + (f1MM2 + Ca2)1/2 + (f1MM
2 + Ca2 - f2MM2 Ca2)1/2
(10)
LBW ) 8R3 (11)
Lp2 ) B2 + L2 cos2 θ - B2 cos2 θ (3)
4496 Langmuir, Vol. 24, No. 9, 2008 Tufano et al.

well-predicted by the MM model, up to a certain degree ofconfinement. This value of 2R/H is found to be a function of theblend components, the blend concentrations and the shear ratesapplied. Above a critical value of the degree of confinement, thewidth of the elongated droplets becomes independent of the radius.Shapira and Haber3 extended the Taylor model5 to take into accountthe effect of confinement. However, this model is still limited tosmall droplet deformations. An extended version of the MM model,including the Shapira-Haber correction, is discussed in the nextsection. In order to detect the conditions to predict the formation ofsuperstructures like strings or, more general, to identify situationswhen confinement plays a role, the dependence of L and B on theCa number has also been studied.
2.4. Minale Model. Recently Minale2 modified the MM modelto take into account the effects of a geometrical confinement on thedrop shape during flow. We will refer to this model as the M model.While the MM model imposes that the drop recovers the analyticalasymptotic limits of Taylor for small deformation, in the M modelthe drop is forced to recover the analytical limits of the Shapira-Haber model.3 The following analytical expressions to calculate theaspect ratio, rp, and the width, W, of the droplet in a confined shearflow were derived
where the functions f1M and f2M are defined as follows
The functions f1MM and f2MM are given by eqs 8 and 9, respectively,the constant CS is taken to be equal to 5.7, the value for a drop placedin the mid plane.3 We will keep this value the same for all ourcalculations. The term R/H in the expressions of f1M and f2M accountsfor the degree of confinement, and the functions f1c and f2c are definedas follows
2.5. Minale Model with Effective Viscosity. We extended themodel proposed by Minale by incorporating an effective viscosityto make the model more suitable for realistic blend systems. Theeffective blend viscosity is taken according to Choi and Showalter:4
where φ is the blend volume fraction. This changes the Ca numberand the viscosity ratio, p, in the M model. We will refer to this modelas the modified M model (mM model). Of course, we can expectthis to be also a less approximation when the blend starts to becomestructured, i.e., layer formation occurs. In Sections 3 and 4 the
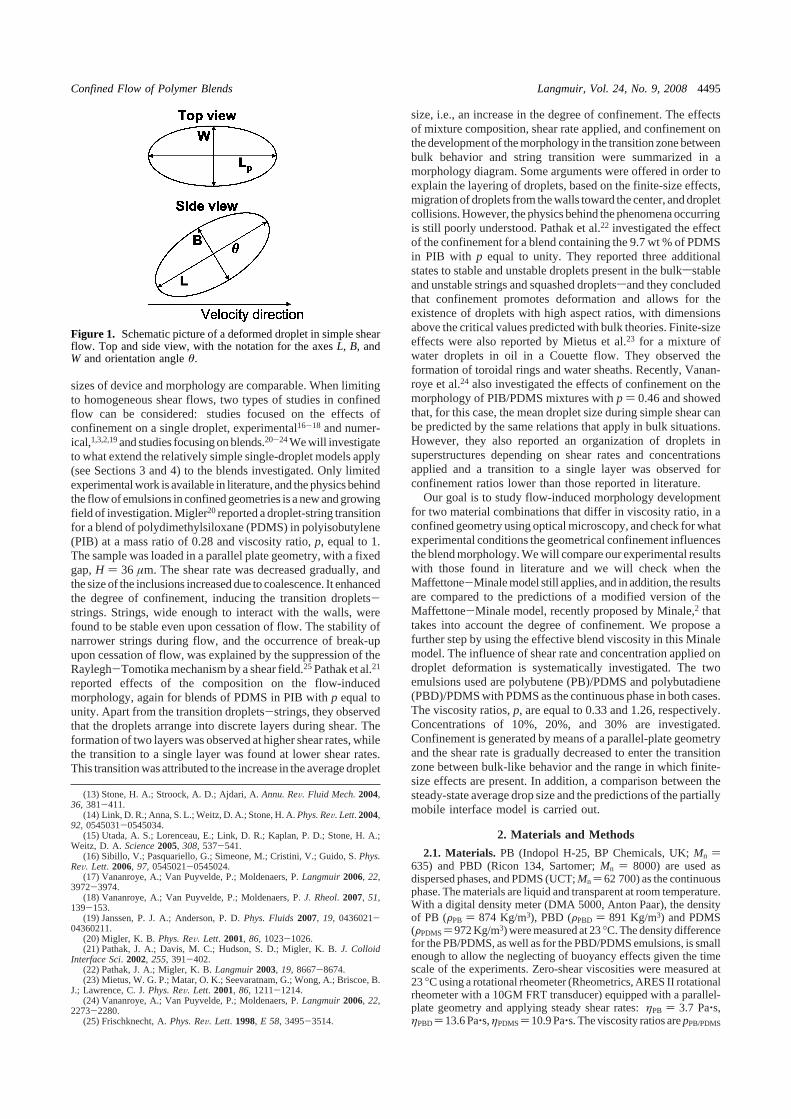
Figure 2. Left: droplet aspect ratio (rp) vs capillary number. Experimental data calculated when assuming θ predicted by the MM model(θMM, open circles) and θ ) 0 (filled circles), rp predicted by the MM model (eq 10, solid line), M model (eq 12, dashed line) and mM model(dash-dotted line). Right: steady-state droplet widths vs the radius in the relaxed shape, experimental data measured from microscopy images(circle), predictions of the MM model (eq 6, solid lines), the M model (eq 13, dashed line), and the mM model (dash-dotted line). The insertsshow the steady morphologies. Shear rates are made dimensionless (see Section 2.2).
f1M )f1MM
1 + CS (RH)3f1c
f2M ) f2MM[1 + CS (RH)3f2c] (14)
f1c )44 + 64p - 13p2
2(1 + p) (12 + p)f2c ) - 10 - 9p
12 + p(15)
ηmef,f ) ηm[1 + φ5p + 2
2(p + 1) (1 + φ5(5p + 2)
4(p + 10))] (16)
rp ) [(f1M2 + Ca2)1/2 + Ca f2M
(f1M2 + Ca2)1/2 - Ca f2M
]1/2
(12)
W ) 2R[f1M
2 + Ca2(1 - f2M2 )]1/6
(f1M2 + Ca2)1/6
(13)
Confined Flow of Polymer Blends Langmuir, Vol. 24, No. 9, 2008 4497

experimental values of rp and W are compared to the predictions ofthe MM model, M model, and mM model. In most cases the lastchoice gives a better agreement with the experimental data.
3. PBD/PDMS System
Figure 2, left, reports the measured deformation (symbols) asa function of Ca of single droplets in the confined geometry, fora 10 wt % PBD in PDMS. Results based on the orientation anglepredicted by the MM model (rp, open symbols) and with theorientation angle set equal to zero (rp, filled symbols) are shown.Determining the experimental rp values with the M model ormM model gives only slightly lower values compared to theMM model, and therefore, we will not report these data. Thelines are the predictions for the three different models. Theagreement found is reasonable (although the scatter in experi-mental results is sometimes quite large), and no serious devia-tions occur. It can be observed that the agreement improves forθ ) 0 (filled symbols in Figure 2). This indicates that droplets,under the effect of confinement, orient more than predictedby the MM model. Minor deviations were reported also byVananroye et al.,24 when Ca < Cacr, which is also the case forthis blend.
The right-hand side of Figure 2 shows the drop width, W, asa function of drop radius, R, in the relaxed state after stoppingthe flow. At lower R, W increases linearly with R and followsthe MM theory. At a critical radius, which depends slightly onthe shear rate applied, the width becomes constant and does notincrease with R. This starts at a degree of confinement on theorder of 0.3, which is less than reported by Vananroye et al.,24
who showed a constant width for a 5 wt % PIB in PDMS blend
at a degree of confinement equal to 0.42. The widths of dropletsbecoming constant, which was not reported by Pathak et al.,21
was attributed to the organization of droplets in pearl necklacesin Vananroye et al.,24 but in our case we find a constant widtheven before pearl necklace structures are formed, see the two toppictures on the right in Figure 2. In addition, the critical degreeof confinement above which W is constant increases withdecreasing the dimensionless shear rate. The M model does predictthe leveling off of the width, although the results are onlyqualitative. When the mM model is used, the agreement with theexperimental data improves, but the constant width is still notfully captured for these cases.
To investigate the influence of the dispersed phase concentra-tion, blends with mass fraction of 20% and 30% were analyzed,see Figures 3 and 4, respectively. The range of shear ratesinvestigated is the same as in the case of the 10 wt % PBD blend.In the experimental range of Ca numbers the aspect ratio of thedroplets is well captured by all three models, and for the widthof the 20 wt % droplets, the agreement is quite good at least forthe first two shear rates. At a dimensionless shear rate of 1.20,strings start to form; the analysis was limited only to the droplets.For the 30 wt % droplets, the discrepancy between the MMmodel and measured width starts already for a degree ofconfinement of 0.26 (see Figure 4, right). The mM model, again,gives good agreement with the experimental data.
In conclusion, for the range of Ca considered, the measureddroplet aspect ratios can be predicted well by all three modelsat all concentrations, and apparently, the most simple MM modelcan still be applied to express droplet deformation in confinedgeometries. In some cases the agreement was improved by
Figure 3. As Figure 2, now for a 20% concentration.
4498 Langmuir, Vol. 24, No. 9, 2008 Tufano et al.

reducing the orientation angle, suggesting that in confinementdrops orient more. The predicted widths of the droplets showthat the MM model is applicable only when the degree ofconfinement is limited, failing when 2R/H exceeds a criticalvalue. The minimum degree of confinement, above which theMM model fails, is a function of the shear rate and increases withdecreasing shear rate. For these conditions the M model wasdeveloped. The best agreement of the experimental widths of thedroplets with the predicted W is obtained with the mM model,i.e., when the viscosity of the matrix is substituted by the effectiveblend viscosity. The agreement improves for an increasingconcentration.
For lower shear rates, long elongated droplets, with Lp/W >4, and superstructure arrangements, like pearl necklaces andstrings, start to form. Changes in the concentration, from 10 to30 wt %, seem not to significantly affect the dimensionless shearrate at which this transition occurs, in agreement with themorphological diagram presented by Pathak et al.21
4. PB/PDMS System
Next we investigated the PB/PDMS blends using the samethree concentrations as for the PBD/PDMS blends. The gapbetween the parallel plates was kept at 40 μm, and the temperaturewas fixed at 23 °C. The transition toward confined behavior wasfound to occur at lower shear rates as compared to the PBD/PDMS blends. Therefore, experiments were carried out startingfrom a dimensionless shear rate of 1.98 downward.
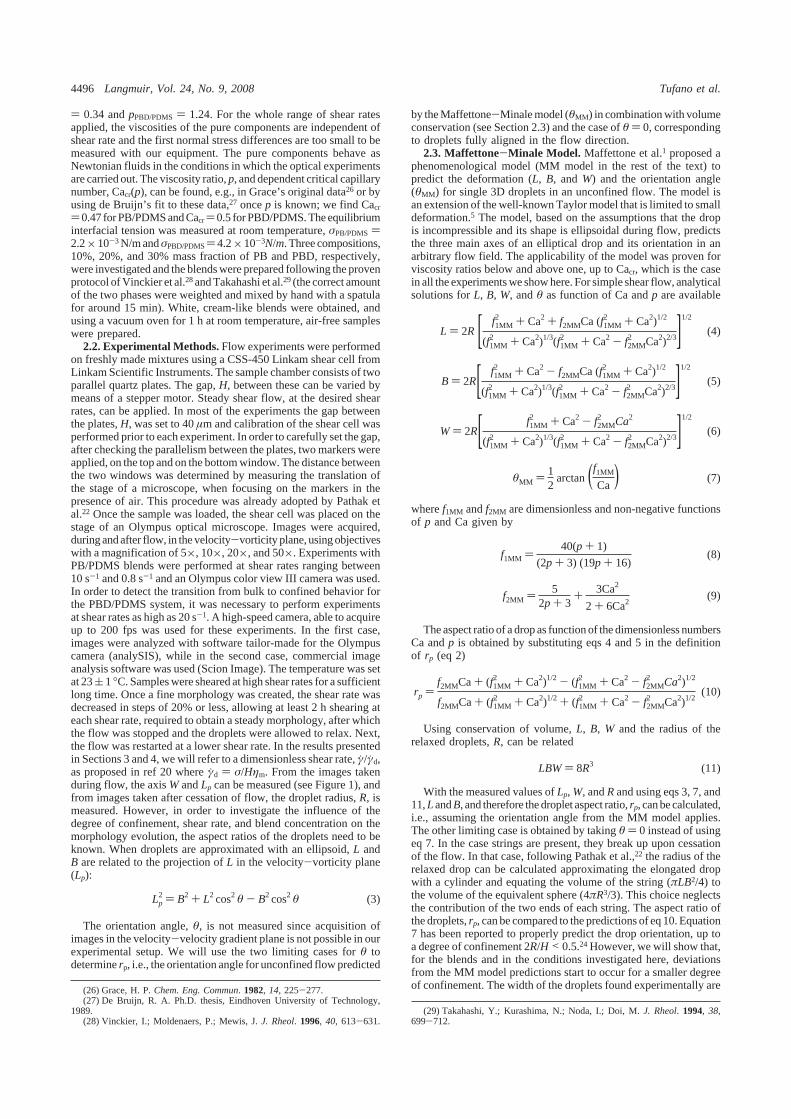
Figure 5 left, shows the experimental droplet ratio determinedby, again, using the MM model assumption for the orientation
angle, θMM, or θ ) 0, at dimensionless shear rates of 1.39, 0.99,and 0.32 (top to bottom). Also for the PB/PDMS system, the rp
values determined by using the orientation angle θ from the Mmodel or the mM model do not differ much from the valuescalculated by using the MM model, and therefore, we will notreport these data in the figures here after. For the highest shearrate, the experimental data for rp agree with the predictions ofthe three models only in the low Ca zone, whereas deviationsappears for Ca = 0.2 and higher. The droplets deform less thanpredicted by the models and arrange into a two-layer disorderedstructure, as can be seen in the optical micrographs shown inFigure 5 right top. Similar results were found by Vananroye etal.24 at a shear rate at which the morphology is comparable tothe one presented here. However, in their paper, consistentdeviations of the experimental rp from the theoretical predictionswere found for Ca values very close to, and even higher than,Cacr, which is clearly not the case here, i.e., deviations occur ata lower Ca values. With the 10 wt % PB blend, droplets at Caslightly larger than the Cacr were encountered only at adimensionless shear rate of 1.98, and they were found to bestable under the flow, in accordance with the observations ofPathak et al.22 When the dimensionless shear rate is reduced to0.99, droplets start to deform more than predicted by the MMmodel and slightly better agreement is found with the M modeland the mM model. When rp is calculated assuming the orientationangle equal to zero, the data shift below the rp curves, suggestingthat the droplets are not fully aligned (see Figure 5 middle).While reducing the shear rate further, Figure 5 bottom, the dropletsaccumulate into a one layer structure and align in the flow
Figure 4. As Figure 2, now for a 30% concentration.
Confined Flow of Polymer Blends Langmuir, Vol. 24, No. 9, 2008 4499

direction. The aspect ratio calculated with θ) 0 gives very goodagreement with all three models. At a dimensionless shear rateof 0.16, three strings were present, two of them, with width,W, of 25 and 27 μm, break up into droplets when the flow isstopped, while the one with W ) 70 μm, by definition a ribbon(W > B), stays stable. Migler20 explained this by suggesting thatthe walls suppress the break up due to the Rayleigh-Tomotikamechanism.
For the 10 wt % PB blend, the predictions of the width of thedroplets are, for the two lowest shear rates, in good agreementwith the measured values (see Figure 5 right). For these cases,the model predictions do not differ much in the range of
experimental results, in contrast with the PBD/PDMS blends(see Figures 2-4). The mM model is less predictive for thehighest shear rate although the trend of leveling off is also seenin the experimental results.
The effect of gap spacing on the transition from bulk to confinedbehavior was investigated for the 10 wt % PB blend using H )65 μm. The case shown (see Figure 6) is similar to H ) 40 μmwhere the aligned droplet structure occurs (Figure 5, bottom).Also the experimental results for rp, W, and the model pre-dictions are very similar. The transition occurs at a somewhatlarger dimensionless shear rate, 0.37 compared to 0.32 for H )40 μm.
Figure 5. Left: droplet aspect ratio (rp) vs capillary number. Experimental data calculated when assuming θ predicted by the MM model(θMM, open circles) and θ ) 0 (filled circles), rp predicted by the MM model (eq 10, solid line), M model (eq 12, dashed line), mM model(dash-dotted line). Right: steady-state droplet widths vs the radius in the relaxed shape, experimental data measured from microscopy images(circle), predictions of the MM model (eq 6, solid lines), the M model (eq 13, dashed line), and the mM model (dash-dotted line). The insertsshow the steady morphologies. Shear rates are made dimensionless (see Section 2.2).
Figure 6. As Figure 5, now for H ) 65 μm.
4500 Langmuir, Vol. 24, No. 9, 2008 Tufano et al.

Figure 7 shows the results for the 20 wt % PB/PDMS systemwith the predicted and experimental values of rp (left) and thedroplet width W (right) for, from top to bottom, dimensionlessshear rates of 0.99, 0.79, and 0.63. Increasing the dropconcentration to 20 wt % causes the droplet aspect ratio rp to behigher than the MM model prediction and to agree better withthe M model for all the shear rates investigated. The discrepancybecomes more pronounced when decreasing the shear rate andfor Ca > 0.2 for all the three models. Different from the 10 wt% blend, a clear effect of the confinement on the width W of thedroplets is observed, like in the PBD/PDMS system. Already atγ̆/γ̆d ) 0.99 droplets are in a single plane, although no orderedpearl necklaces are seen, and at 2R/H = 0.4, the width of thedroplets starts to deviate from the MM prediction. Thisdiscrepancy reduces when the mM model is used. Decreasingthe shear rate increases the value of 2R/H where confinementbecomes noticeable, similar to the results reported in Section 3.
Also for this concentration, the gap was varied by increasingit to H ) 50 and 100 μm, see Figure 8.
Increasing the gap, the shear rate at which confinement effectsare detected must decrease, to result in a larger average dropletradius. This is confirmed, especially for the twice as large gapof 100 μm. For H ) 50 μm, for the case shown, similar behavioras for H ) 40 μm is found (see Figure 7, top) and the width Wis well predicted by the mM model. For H ) 100 μm, noconfinement effect on W is observed anymore and this is alsopredicted by the models.
Results for the 30 wt % PB blend are summarized in Figure9. The agreement between experimental and calculated valuesof rp is good when the M model is considered and the degree
of confinement at which theW becomes independent of the dropletradius increases from 2R/H = 0.42-0.65 for γ̆/γ̆d ) 1.27 and0.79, respectively. The mM model gives good predictions of thewidth of the drops, confirming the statement that this modificationof the M model gives better agrement with the measurementsfor the higher concentrated blends.
5. Conditions to Identify Strings
Pathak et al.21 also investigated the dependence of L and B onCa across the transition from droplets to strings. When onlydroplets were present, they reported L and B to scale proportionallyto Ca, but when strings started to form, for a blend 9.7 wt %PDMS in PIB, at shear rate of 3 s-1, L/H and B/H scaled with(R/H)2.93 and (R/H)0.03, respectively, and they calculated that L/Bscales withCa2.93. This strong dependence, not found for droplet-like morphologies, was addressed as an unique condition forstring formation in confined emulsions.We fittedour experimentalL and B values with straight lines, eq 17, to verify this dependence.
For the 20 wt % PBD/PDMS and PB/PDMS systems, thepowers l and b are calculated for the two extreme cases of bulk-like morphology and strings. Next, we show how l and b changewith decreasing shear rate. Only the results obtained for the 10wt % PB in PDMS are reported since the analysis in all the othercases yields the same conclusions.
5.1. 20 wt % PBD. The experimental results for the 20 wt %PBD blend are shown in Figure 10 giving L and B vs Ca, forγ̆/γ̆d ) 1.87 (left) and 0.96 (right). The L and B values reported
Figure 7. As Figure 5, now for a 20% concentration.
L ∝ Cal B ∝ Cab (17)
Confined Flow of Polymer Blends Langmuir, Vol. 24, No. 9, 2008 4501

are calculated from the experimental Lp, W, and R with the MMmodel. The L and B values obtained using the M model and mM
model do not differ much from theses values and, therefore, arenot reported here. At the higher shear rate, elongated droplets
Figure 8. As Figure 5 now for a 20% concentration and H ) 50 μm (top) and H ) 100 μm (bottom).
Figure 9. As Figure 5, now for a 30% concentration.
4502 Langmuir, Vol. 24, No. 9, 2008 Tufano et al.

are present, while for the lower shear rate, strings are found. Fordrops (Figure 11, left), L and B depend on the Ca, approximatelywith the same order, l ) 1 and b ) 1.4. For the strings (Figure11, right) we find B to be a weak function of Ca, b ) 0.2, whileL indeed strongly depends on Ca, l ) 2.6.
5.2. 20 wt % PB. The dependence of L and B on Ca for γ̆/γ̆d
) 0.99 are shown in Figure 11, where a bulk-like morphologyis present, and for γ̆/γ̆d ) 0.5, where also strings are present.Fitting with eq 17 yields l) 1.21 and b) 1.06 at a dimensionlessshear rate of 0.99, and l ) 3.06 and b ) 0.01 at a dimensionlessshear rate of 0.5. Analogous to the case of the 20 wt % PBDblend, when strings form, L becomes a strong function of Ca,while B approximately becomes independent from Ca. Thepresence of strings apparently coincide with a strong dependenceof aspect ratio on capillary number.
5.3. Dependence of L and B on the Dimensionless ShearRate. In this section we show how the dependence of L and Bchanges with reducing the dimensionless shear rate. Only resultsfor the 10% PB in PDMS blend are presented since the conclusionswe draw for this system also hold for all the other blends. Thelengths L and the widths B of the drops, as well as the fitted linesobtained by using eq 17, are shown as a function of the capillarynumber in Figure 12, and the values for the parameters l and bobtained when fitting L and B respectively, are 1.1 and 0.89 atγ̆/γ̆d ) 1.39, 1.28; 0.77 at γ̆/γ̆d ) 0.99, 1.48; and 0.63 at γ̆/γ̆d
) 0.32. With decreasing shear rate, L becomes a stronger functionof Ca, while the B dependence becomes weaker. It should benoticed that, although the dependence of B on Ca is significantlylower than the dependence of L, it is still higher than the onecalculated for the 20 wt % PBD at γ̆/γ̆d ) 0.96 (see Figure 10,right) and for the 20 wt % PB at γ̆/γ̆d ) 0.50 (see Figure 11,right). This difference can be explained considering the twomorphologies. Indeed, while for the 20% PBD and the 20% PBblends strings are present, in the case of the 10% PB blend, still
Figure 10. Dependence of the two sizes of droplets (left) and strings (right) on the capillary number. Experimental data for L (circles) andB (squares), and the results of fitting with eq 17 (solid lines). The inserts show the steady morphologies.
Figure 11. As Figure 10, now for 20% PB in PDMS.
Figure 12. As Figure 10, now for 10% PB in PDMS.
Confined Flow of Polymer Blends Langmuir, Vol. 24, No. 9, 2008 4503

a droplet-matrix morphology exists, even at the lowest shear rateinvestigated. It can be concluded that, according to the resultsof Pathak et al.,22 the strong dependence of the rp ) L/B on Cais characteristic only for strings and, moreover, increasing thedegree of confinement, the dependence of rP on Ca increases.
6. Steady-State Morphology and Layering Effects
6.1. Average Droplet Size. The goal is to test whether bulktheories can be applied to describe blend morphology at rest,even when, due to the limited gap spacing, confinement effectsare present. Figure 13 shows the average droplet radii for the twosystems investigated: PBD/PDMS (left) and PB/PDMS (right).The mean radii were determined from micrographs, once theshear flow was stopped and the droplets relaxed, excludingdaughter droplets formed after breaking up of strings eventuallypresent during the flow. The break up line is found by imposingCa ) Cacr at all shear rates; the coalescence lines, yielding RPM,are calculated on the basis of bulk theory for immiscible blends30
using partially mobile interfaces:
wherehcr is the critical matrix film thickness between two collidingdroplets that was used here as an adjustable parameter, resultingin hcr ) 13.1 μm for PBD/PDMS and hcr ) 38.2 μm for PB/PDMS. The experimental radii are all in the vicinity of thecoalescence curve, as expected since experiments were performedby reducing the shear rates.
6.2. Layering Effect. Layering of drops into a single planeis expected to occur at confinements of 0.5, since above thisvalue, there is not enough space anymore to place droplets intotwo different layers.21 However, for the PBD/PDMS system, thetransition to a single layer occurred already at degree ofconfinement in the order of 2R/H ≈ 0.3 while, for the PB/PDMSblend, we found 2R/H ≈ 0.4. These values increased slightlywhen higher concentrations were considered. The low Reynoldsnumber, Re ≈ O(10-7), shows that inertia can be neglected andStokes flow prevails in all the experiments; the large Pecletnumber, Pe ≈ O(106), indicates that hydrodynamic interactionsare much more important than Brownian motions, and the lowBond number, Bo ≈ O(10-4), illustrates that interfacial tensiondominates buoyancy. The conditions used in our experimentsare the same as those reported by Pathak et al.,21 who argued thatthe number of layers in which droplets in a confined emulsioncan arrange, at a given shear rate, is controlled by three competing
phenomena. The first is wall migration as reported by King etal.,31 due to an “asymmetric disturbance velocity”, droplets aredrifted away from the walls toward the centerline. The other twoare finite size effects and droplet collision during shear. However,it has to be stressed that the physics behind the layering is stillpoorly understood.
7. Conclusions
Morphology evolution in confined geometries was investigatedfor two different binary emulsions using three different dropletconcentrations. The gap space was 40 μm, and the shear rateswere reduced to allow for coalescence, thereby increasing thedroplet radius to enter the confinement region. The transitionbetween a bulk-like behavior and a confinement effects wasfound in all the cases. For the blends with lower viscosity ratio,this transition was found at lower shear rates compared to thehigh viscosity ratio blends. At the higher shear rates, dropletsarrange in two or more layers. When the shear rate is decreased,a migration toward the centerline occurs. Due to coalescence,pearl necklaces and strings are formed at the lower shear rates.The transition from two to one layer occurs at 2R/H < 0.5,suggesting that the finite size effects are probably not the onlyreason for such an arrangement. At each shear rate, the projectionsof the two axes of the elliptical deformed droplets are measuredfrom optical micrographs, the aspect ratio calculated andcompared with the predictions of three different models: theMM model, M model, and mM model. In most cases, the threemodels predict reasonably well the experimental aspect ratio, insome cases better agreement is found by assuming a zeroorientation angle; thus, a confined geometry orients morecompared to the situation of equally sized droplets subjected tothe same flow history, but in a nonconfined environment. Thedroplet width W is measured from optical images and comparedto the predictions of the three aforementioned models and,depending on the system and concentration, a critical degree ofconfinement, above which all the droplets have a constant width,was found that increases with shear rate. This deviation fromunconstrained theory occurs even before the formation of orderedpearl necklaces structures. When the M model is used, meant fordrops flowing in simple shear rate and in confined geometries,this discrepancy is reduced.Byusing the effectiveviscosity insteadof the matrix viscosity in the M model, we obtain the mM modeland better agreement between model predictions and experimentsis found, improving with increasing the volume fraction of thedispersed phase. The dependence of L and B on the capillarynumber (L ∝ Cal, B ∝ Cab) shows that upon reducing the shear
(30) Janssen, J. M. H.; Meijer, H. E. H. Polym. Eng. Sci. 1995, 35, 1766-1780. (31) King, M. R.; Leighton, D. T. Phys. Fluids 2001, 13, 397-406.
Figure 13. Steady-state droplet size as a function of the shear rate for the PBD/PDMS system (left) and PB/PDMS system (right). Modelprediction for break up (solid line) and coalescence (dashed line) are shown.
RPM ) ( 4
�3
hcr
p )2/5( σηmγ̆)3/5
(18)
4504 Langmuir, Vol. 24, No. 9, 2008 Tufano et al.

rate, l increases, while b decreases and rp depends stronger onCa. When a drop-matrix morphology is present, l and b arealmost equal and close to 1 while, when strings form, b is smallwhile l becomes large, resulting in an aspect ratio proportionalto Ca2.6 for PBD/PDMS and Ca3.1 for PB/PDMS. It was shownthat this strong dependence of the drop aspect ratio on the capillarynumber arises only when confinement effects are present; thus,
this is a fingerprint of the presence of strings. The steady-stateaverage radii calculated when stopping the flow were comparedwith the predictions of the partially mobile drainage modeldescribing coalescence. The results show that the theory fornonconfined situations can describe the morphology evolutionalso in confined geometries.
LA7036636
Confined Flow of Polymer Blends Langmuir, Vol. 24, No. 9, 2008 4505