CONFIDENTIAL INFORMATION MEMORANDUM - … · CONFIDENTIAL INFORMATION MEMORANDUM Sample ......
15
1 City Blvd. West, Suite 450 Orange, CA 92868 CONFIDENTIAL INFORMATION MEMORANDUM Sample
-
Upload
duonghuong -
Category
Documents
-
view
257 -
download
2
Transcript of CONFIDENTIAL INFORMATION MEMORANDUM - … · CONFIDENTIAL INFORMATION MEMORANDUM Sample ......

1CityBlvd.West,Suite450 Orange,CA92868
CONFIDENTIAL INFORMATION MEMORANDUM
Sample

1 | P a g e
DISCLAIMER
This Confidential Information Memorandum (the "Memorandum") contains a variety of information including, but not limited to, a business summary, financial data, and product information. All information presented in the Memorandum was provided by THE COMPANY, referred to herein as the "Company". Financial statements used in the Memorandum were prepared by the Company internally. The Company's CPA firm did not participate in the preparation of the Memorandum or related financial information.
Prysmatic Advisors ("Prysmatic") has not independently verified any of the information included herein and makes no representations, either expressed or implied, as to the accuracy or the completeness of such information, or as to any conclusions drawn by a potential purchaser as a result of purchaser's use of this document.
Prysmatic is not and will not be responsible in any manner for the content, accuracy, and truthfulness of such information. Any representations and/or warranties to be made by the Company shall only be made in writing in an executed definitive acquisition agreement or purchase contract, which agreement shall control as to representations and warranties.
TRANSACTION
The purpose of this Memorandum is to acquaint prospective purchasers of the Company with basic information about the Company. This Memorandum is provided only to prospective purchasers who have executed an Agreement for Use and Non-Disclosure of Confidential Information (the "Mutual Confidentiality Agreement"). This Memorandum and the information contained herein are subject to the Confidentiality Agreement. A prospective purchaser is responsible for all costs and expenses that it incurs in connection with its potential acquisition of the Company and for expenses related to a Due Diligence review of the Company, whether or not an acquisition occurs.
For more information, contact:
Andy Peters, Managing Partner
Prysmatic Advisors 1 City Blvd. West, Suite 450
Orange, CA 92868
Email: [email protected] Office: 949-335-1936 Cell: 949-400-2132
Sample

2 | P a g e
TableofContents
Acquisition Highlights .................................................................................................................................. 3
Pro Forma Forward Looking Financials ....................................................................................................... 3
Product .......................................................................................................................................................... 4
Process .......................................................................................................................................................... 6
People ............................................................................................................................................................ 7
Transaction Objectives ................................................................................................................................ 11
Transaction Timing ..................................................................................................................................... 11
Historical Financial Summary .................................................................................................................... 12
Recast September 2014 Income Statement & Balance Sheet ..................................................................... 13
Sample
3 | P a g e
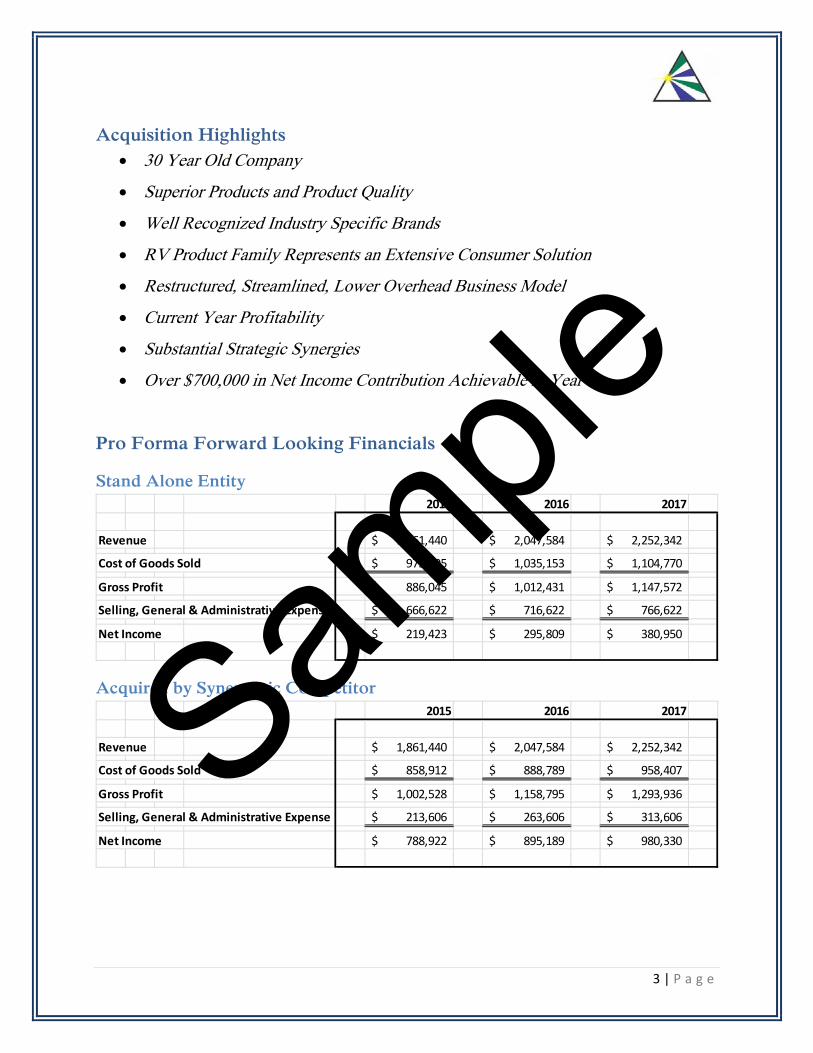
Acquisition Highlights 30 Year Old Company
Superior Products and Product Quality
Well Recognized Industry Specific Brands
RV Product Family Represents an Extensive Consumer Solution
Restructured, Streamlined, Lower Overhead Business Model
Current Year Profitability
Substantial Strategic Synergies
Over $700,000 in Net Income Contribution Achievable in Year 1
Pro Forma Forward Looking Financials
Stand Alone Entity
Acquired by Synergistic Competitor
2015 2016 2017
Revenue 1,861,440$ 2,047,584$ 2,252,342$
Cost of Goods Sold 975,395$ 1,035,153$ 1,104,770$
Gross Profit 886,045$ 1,012,431$ 1,147,572$
Selling, General & Administrative Expense 666,622$ 716,622$ 766,622$
Net Income 219,423$ 295,809$ 380,950$
2015 2016 2017
Revenue 1,861,440$ 2,047,584$ 2,252,342$
Cost of Goods Sold 858,912$ 888,789$ 958,407$
Gross Profit 1,002,528$ 1,158,795$ 1,293,936$
Selling, General & Administrative Expense 213,606$ 263,606$ 313,606$
Net Income 788,922$ 895,189$ 980,330$
Sample
4 | P a g e
Product The Company makes a line of eight (8) cleaning, treatment and service products that allow RV and motorcycle enthusiasts to maintain their equipment in top working order. Most products 1) have existed for over a decade; 2) were some of the initial products in the category; and, 3) have a loyal customer following. Combined with a renewed emphasis on sales and marketing, the Company believes these qualities form the basis for a much improved overall competitive market position.
In addition, the Company makes two (2) industrial products for 1) conveyor and chain maintenance and 2) precision machining of metal parts.
In 2013, the Company sold over 230,000 individual units each of which was provided to customers with a 100% satisfaction guarantee.
As the Company re-asserts itself in existing markets, opportunities to develop other target industries and applications will be explored. The Company attempted this type of diversification in the past but failed to devote sufficient marketing, advertising and sales resources to realize success. This mistake will not be repeated.
Recognition The consumer products made by the Company have been the recipient of back to back 2012 and 2013 Gold Awards from relevant industry publications. These awards confirm consistent consumer feedback. “The product works, works well, and is easy to use!”
Distribution Consumers buy products primarily through specialty retailers focused on the industry the products were designed to serve, recreational vehicles and motorcycles. The nation’s largest RV related retailer buys direct from the Company. Smaller retailers receive products indirectly through distributors focused on the respective industries. The company sells one consumer product, in one size only, directly to “the world’s largest retailer,” Walmart.
Industrial, agricultural and other end users acquire the specialty industrial products primarily through industrial supply stores and, on a more limited basis, directly from the company. This particular market is very much untapped. FEDEX buys one of the products for operating purposes but only at one location. The opportunities are endless. More aggressive sales efforts are already expanding sales in relevant industrial and agricultural markets.
Concentrations No single industry represents more than 60% of Company sales.
Over 39% of product is sold through distributors.
No single customer represents more than 25% of Company sales. No Single product represents more than 20% of Company sales.
Sample

5 | P a g e
Product and SKU Rationalization In 2013, Company revenues (~$2,000,000) were distributed across 22 different products and 96 different SKUs. Certain product lines contributed very little revenue and have therefore been eliminated from the go forward business plan. A total of 17 products with 35 SKUs were eliminated. Most of these SKUs were in the industrial product line. The discontinued industrial product lines were not only slow moving but also the lowest margin products sold by the company. Overall gross margins for the discontinued items were less than 50%. The remaining industrial products have “in-house” manufacturing margins in excess of 60%. These margins will be greater under the planned outsourced manufacturing model).
In addition to the product line rationalization, certain SKUs within the remaining product lines have been eliminated based on low sales volumes. Still other SKUs were produced and stocked separately based on minor differences in Canadian and US labeling requirements. Where possible, the Canadian and US SKUs have been consolidated to a single label. Whereas, previously nine (9) products had Canadian and US labels; going forward, only three (3) products will have Canadian and US versions.
The following table illustrates the resulting simplification of products and SKUs. Amazingly, eliminating more than 50% of the products and over 70% of the SKUs will only eliminate 8% of the revenue opportunity. With respect to revenue, management makes the simplifying assumption that customers will select from the remaining SKUs of a product line if they have previously purchased a discontinued SKU . . . (gallon or quart if half gallon is no longer available).
Note: The 2015 revenue in the above table assumes that the Company did not have the eliminated products in 2013, and therefore revenue would have been $1,853,277.
Note: Since this was drafted additional SKUs have been eliminated particularly for Canadian sales.
Historical
Products &
SKUs (2013)
Eliminated
Products &
SKUs
Planned
Products &
SKUs (2015)
Consumer Products 12 ‐4 8
Retail SKUs 62 ‐42 20
On‐Line SKUs 30 TBD
Industrial Products 10 ‐8 2
Industrial Product SKUs 34 ‐31 3
Total Products 22 ‐12 10
Total SKUs 96 ‐73 23
Historical & Ongoing Revenue 2,013,794$ (160,517)$ 1,853,277$
Sample

6 | P a g e
Rebranding The Company is in the process of rebranding its current disparate product labels into a family of products that will stand out from the competition. The Company has received a favorable reaction to the proposed labeling changes from the category manager at the World’s Largest RV Retailer.
Process The changes outlined above will have a dramatic simplifying effect on production planning and reduce overall finished goods inventory levels. Within the last three months, the Company has adopted a planning process that ties rolling seasonal sales to inventory and production requirements. In September 2013, inventory value on the books was $357,685. In a short span of 3 months since the adoption of the new production planning methodology, inventory has been reduced to $216,365 in September 2014. This number represents salable/usable inventory after adjusting numerous raw materials, packaging items and finished goods that are known to be obsolete or are in the process of being liquidated.
If the Company were to choose to maintain its in-house manufacturing capability, inventory would continue to decline. However, it has been determined that the Company’s in-house manufacturing is both antiquated and inefficient. Three outsourced fulfillment companies have been solicited to bid on the filling requirements of the Company. Trial runs will be completed in October 2014 with first production runs occurring in December 2014 through January 2015. Based on 2013 usage by item, the Company will be able to procure one year’s worth of product SKUs bottled and in the box ready for shipment for as little as $22,000 more than its 2014 direct material cost.
Historically, the Company significantly understated its Cost of Goods Sold for several reasons. The Company would buy several year’s supply of certain raw materials and packaging supplies in order to obtain access to volume related unit price discounts. The unintended consequence of this practice was to tie up needed cash in what often ended up being obsolete inventory. In 2014, the Company will absorb tens of thousands of dollars in write-offs as a consequence of this practice.
In addition, the Company’s definition of COGs was only based on direct materials and packaging components. No attribution was made for direct labor wages or indirect manufacturing costs like 1) manufacturing management salaries, 2) rent or 3) workers compensation costs. Moreover, COGS was dramatically understated due to known inefficiencies in the manufacturing process. Specifically, the Company used to do all of the following:
Remove one out of six bottles from the production line after the fill station because one of the fill heads has been broken for years.
Hand-apply a one inch diameter “Satisfaction Guaranteed” labels on every bottle produced. Labels were applied days or weeks in advance of production and labeled bottles were restocked and stored away so they could be handled again later when it was time for production.
Refill quart and pint bottles from a gallon bottle using a funnel when inventory of the needed size ran out.
Fill single bottles with a single spigot piston filler.
Sample

7 | P a g e
Pro forma estimates indicate that when direct labor, indirect manufacturing costs and rent are eliminated, the Company will enjoy a cost reduction of as much as $250,000 in 2015. These estimates are after allowing for an appropriate amount for outsourced storage and fulfillment costs through a third party logistics provider.
Models indicate that after outsourcing, the Company will be able to support its current business level with a maximum of $200,000 in inventory (substantially lower levels in the off season).
People
Trustees The Company is currently in the control of the Trustees of a family estate. The Founder passed on several years ago. His surviving spouse passed on in December 2013. The Estate provided the employed members of the family the option to buy the business. This offer was declined.
Senior Management The Company has been run for a number of years by second generation family members. The desire to sustain family lifestyles precluded taking bold steps for the benefit of the Company. Within the last six months, two family members have left the employ of the Company. The President, a son-in-law, has reduced his hours and compensation.
Management Consultants The Trustees of the Estate have hired a consulting firm to manage the operations of the Company. Under the direction of the consulting firm the management team has implemented numerous changes in the operations of the company.
Reorganization
Multi-year budget models
Rebranding
Sales Performance Standards
Product Line Rationalization
Production Planning & Inventory Control Outsourced Manufacturing
Operational management has embraced the changes and is independently sustaining and building upon the progress.
In addition, the team is working together to prepare the real estate occupied by the Company for sale by disposing of truckloads of unneeded equipment and materials that have accumulated over 30 years of occupancy. A much smaller physical location which combines adequate office and industrial warehouse space is being located. It is anticipated that rent will drop from $6,000 per month to under $3,500 per month as a result. Another $30,000 per year that can be devoted to marketing and sales!
Sample

8 | P a g e
Operational Management & Production Employees The operational management team is led by a very capable Office Manager with over 20 years of experience with the Company and an Operations Manager with over 40 years of experience working with and for the Founder of the Company.
The Office Manager has an intuitive sense regarding the anticipated sales and which customers should be contacted regarding expected orders. This has proved to be an invaluable resource in realizing month to month target revenue levels.
Between the Operations Manager and the President they know everything there is to know about product formulation (and re-formulation), blending process product testing and environmental compliance standards. This knowledge has been recently documented as both individuals are now at retirement age.
The two key employees are supported by a single office administrator that processes orders and shipping documentation.
Two or three warehouse employees and one to three temporary workers are needed to man the production lines depending on the product and container size. They also pick and pull orders for shipment to the customers.
Sales Management Sales Management is entrusted to a 20 year employee with the title of VP of Sales and Marketing. The VP has enduring contacts with key customers. In recent years, the sales and marketing efforts have been limited to “what we have always done” and very limited new customer development due to financially imposed constraints. Competitive pricing has been based on target gross margins as opposed to being part of an over-arching competitive strategy or an analysis of volume sensitivity at various price points. The sales and marketing dynamic is already in the process of changing in meaningful ways.
Re-Organization Prior to May 2014, the Company had an extensive in-house organizational structure with 10 full-time employees, one part-time employee and several seasonal operations employees. Considering the level of revenue and overall activity, many individuals were under-utilized. The Company was losing money consistently for the last several years and could not continue in business without addressing the overhead structure.
As of October 2014, full-time staff has been reduced to 6 full-time employees and 1 part-time employee. As indicated above, part of the reduction-in-force came from the departure of family members. Other positions were also eliminated. These changes required outsourcing IT, Graphic Arts and Website Design. As one might expect the professional resources hired by the Company are both more talented and more cost effective. The current part-time employee is the President who continues to support the Company transitional initiatives.
All employees and staff have been notified that additional headcount reduction will occur as 1) the company transitions from in-house to outsourced manufacturing; and, 2) fulfillment operations are turned over to professional logistics firms. By dealing forthrightly and fairly, the Company has maintained a
Sample

9 | P a g e
high level of commitment from all employees, even those who know their positions will ultimately be eliminated. In truth, it is a remarkable testimony to the quality of the key operations staff that they have embraced and managed a tidal wave of positive changes.
It is anticipated that the staff will be reduced to 5 or 6 full-time employees by January 2015. At that time, the former President may elect to function as a part-time consultant at an hourly rate. Prior to that time day to day leadership will be entrusted to a yet to be identified General Manager.
The Company is being positioned to succeed as a dynamic sales and marketing organization that can focus on building a dominant brand on existing high quality products. As the Company transitions out of its current turn-around/restructuring dynamic, that extensive additional resources will be devoted to marketing, advertising and sales. A new sales organization will unfold over the next few months. The proposed General Manager will be the sales team leader with the current VP of Sales and Marketing expected to continue as part of the sales team.
Pro Forma 2015 Organizational Chart
Trustees
General Manager
TBD
Sales
VP Sales & Mktg.
Accounting & Administration
Office Manager
Sales Order Processing & Administrative
Assistant
Admin Assistant.
Operations, Product Development/
Compliance & Vendor Management
Plant Manager
Production Planning & Purchasing
Production Supervisor
Outsourced Services
IT Marketing & Advertising
Manufacturing Fulfillment
Strategic Leadership
Consultant
Advisor
Former President
Sample

10 | P a g e
Profitability in 2014 and 2015 For the first time in several years the Company will make a profit in 2014. Profitability will be achieved despite the expenditure of tens of thousands of dollars to clean-up the facility, ease the transition of family members and dispose of obsolete materials.
By the end of 2014, the Company will have a substantially lower fixed overhead. Perhaps more importantly it is expected to have over $300,000 to deploy against targeted initiatives. For comparison purposes, at the end of 2013, the Company only had $144,000 in cash.
In 2015 substantial investments will be made in competitive analysis, marketing, advertising and sales resources.
The 2015 budget assumes, conservatively, that those investments will only result in a moderate uptick in sales. Budgeted profitability for 2015 is expected to exceed $200,000. For the following two years, it is expected that these initiatives will result in at least a 10% increase in top line revenue and higher profit margins. The Company will undoubtedly be a much stronger competitor in 2015 and beyond.
Synergistic Acquisition Opportunity As strong as the Company will be going into 2015, the Trustees believe that this may be an appropriate time to explore selling the business to a strategically interested company.
It appears from the industry data that a certain major industry player attempted to enter the Company’s particular product category with only moderate success in 2014. When one considers the resources that a major international company would deploy in such an endeavor, one can imagine a scenario where there might be interest in a brand or mix of products to achieve a breakout success.
On the other hand, other category-leading companies might also be interested in expanding their market penetration or dominance or at the very least seek to prevent a major competitor from having at its disposal a long-standing, well-recognized, respected brand and family of products.
The pro forma income statement for the Company in the hands of strategically situated competitor with existing overhead infrastructure indicates a gross profit contribution in excess of $1,000,000 and a net income contribution in excess of $700,000 in 2015.
While the Company is small in terms of revenue, the Trustees hope that these are sufficiently compelling numbers to generate an appropriate level of interest on the part of strategic companies.
Sample

11 | P a g e
Transaction Objectives The Trustees have a strong desire to see the wonderful products created by their father continue as an identifiable brand well into the future. This legacy has significance to every family member.
The Trustees see a great future for the Company based on the progress that is being made day by day and week by week by the current team of employees. It is very exciting to see the Company have a renewed sense of energy and drive that was epitomized by the entrepreneur founder. The Company is coming to life again.
The Trustees do not, however, have a desire to own the business long-term. They have successful professional lives separate from the industry served by the Company.
While the Trustees are motivated to complete a transaction, a transaction that does not acknowledge the strategic value of the Company may not be consummated. The Trustees understand that the anticipated performance under the new business model has not yet been demonstrated. Non-strategic buyers who cannot realize the synergies outlined above will not yet be drawn to this acquisition opportunity. It is clear to the Trustees that the Company will be worth more in the future based on a traditional value metrics. One year from now, the Company may well appeal to a broader spectrum of buyers once improved market share and profitability has been established.
Strategic acquirers can leverage this opportunity across an existing business platform to realize outstanding synergistic value based on conservative budgets and a compelling business model.
Transaction Timing The Trustees perceive that transaction timing may be important to any interested parties. An acquisition in the “off season” could be highly desirable for an acquiring entity as it will provide the time needed to adopt the business model changes or apply their existing business model. RV shows are slated for the late winter and early spring annually. Strategic competitors will quickly become well-acquainted with the products and should not require extended due diligence time in order to consummate a transaction.
Desirable transaction terms will be simple and straightforward commensurate with the status of the Company as part of a family estate . . . basic representations, warranties or contingencies. The Trustees will retain a seasoned transactional law attorney to negotiate the final legal documents for the transaction.
The sooner a strategic competitor has the Company in tow, the sooner they will have the opportunity to realize the tremendous opportunity represented by the brand and family of products. Sam
ple

12 | P a g e
Historical Financial Summary
Balance Sheet
Income Statement
YE 2011 YE 2012 YE 2013 Sep‐14
Assets
Current Assets
Cash 284,316$ 162,699$ 143,792$ 338,362$
Accounts Receivable 113,009$ 189,336$ 117,227$ 172,030$
Other Current Assets
Other 35,701$ 42,607$ 48,008$ 19,742$
Inventory 352,515$ 352,978$ 394,312$ 246,365$
Total Other Assets 388,216$ 395,585$ 442,320$ 266,107$
Total Current Assets 785,541$ 747,620$ 703,339$ 776,499$
Fixed Assets (Net of Accum. Depreciation) 151,358$ 139,669$ 131,214$ 122,317$
Total Assets 936,899$ 887,289$ 834,553$ 898,816$
Liabilities
Current Liabilities 55,719$ 46,542$ 52,809$ 38,037$
Long Term Liabilities
Other 8,075$ 4,146$ ‐$
Loans Payable 386,761$ 386,761$ 386,761$ 386,761$
Total Liabilities 450,555$ 437,449$ 439,570$ 424,797$
Stockholder Equity
Capital Stock 228,332$ 228,332$ 228,332$ 228,333$
Distributions (1,362,387)$ (1,362,387)$ (1,362,387)$ (1,362,387)$
Retained Earnings 1,710,032$ 1,652,702$ 1,616,206$ 1,561,355$
Current Period Income (57,330)$ (36,496)$ (54,851)$ 62,976$
Total Stockholder Equity 518,647$ 482,151$ 427,300$ 490,276$
2011 2012 2013 Sep‐14
Revenue 1,831,538$ 1,970,680$ 1,991,827$ 1,541,579$
Cost of Goods Sold 573,440$ 637,353$ 668,708$ 459,117$
Gross Profit 1,258,098$ 1,333,327$ 1,323,119$ 1,082,462$
Trucking, Warehousing & Supplies Expense 459,055$ 507,919$ 512,308$ 377,469$
Selling, General & Administrative Expense 819,827$ 817,030$ 825,000$ 615,710$
Interest, Tax & Depreciation 36,543$ 44,872$ 40,660$ 26,307$
Net Income (57,327)$ (36,494)$ (54,849)$ 62,976$
Note: Due to the extensive one time cost and writeoffs it is impossible to compare September YTD 2013 to 2014.
The significant observation to make is that despite these expenses, the company is now profitable.
Sample

13 | P a g e
Recast September 2014 Income Statement
Revenue 1,541,579$
Cost of Goods Sold 459,117$
Gross Profit 1,082,462$
Trucking, Warehousing & Supplies Expense 377,469$
Selling, General & Administrative Expense 615,710$
Interest, Tax & Depreciation 26,307$
Net Income 62,976$
2014 Adjustments
Excess Payroll (Direct Employee Benefits Only ‐ See Note)
VP Ops & Information Services ‐ Founder's Son 33,288$
Industrial Products Div. Manager ‐ Founder's Daughter 24,766$
Graphic Artist & Website Designer 26,980$
Total Excess Payroll 85,034$
Transfer of Assets to Employees
President ‐ Toyota SUV ‐ Founder's Son‐in‐Law 14,109$
Operations Manager ‐ Charles Schwab Retirement Acct 17,925$
Total Asset Transfers 32,034$
Other One Time Costs
Obsolete Inventory 26,637$
Facility Cleanup 20,346$
Total One Time Costs 46,983$
Total Adjustments 164,050$
Adjusted Net Income 227,026$
Note: No attempt has been made to calculate employer costs of terminated employees.
Hence the number reflected above are conservative estimates of the excess costs.
YTD 9/30/2014
Sample
14 | P a g e
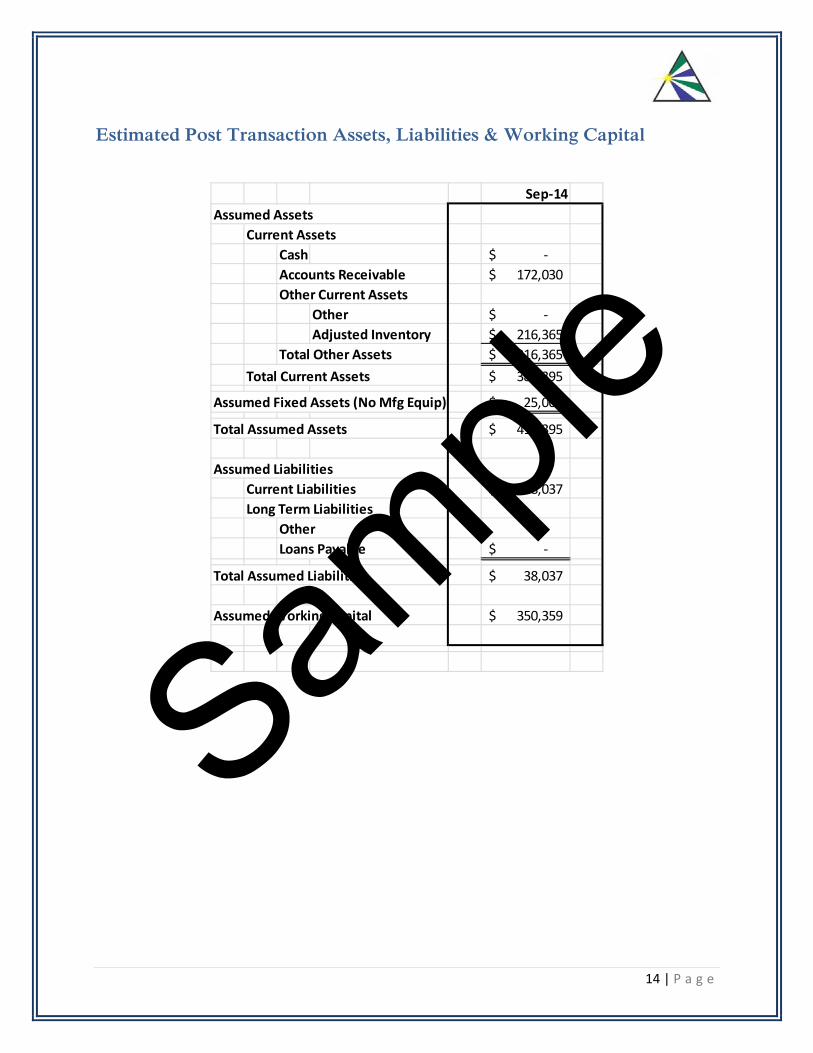
Estimated Post Transaction Assets, Liabilities & Working Capital
Sep‐14
Assumed Assets
Current Assets
Cash ‐$
Accounts Receivable 172,030$
Other Current Assets
Other ‐$
Adjusted Inventory 216,365$
Total Other Assets 216,365$
Total Current Assets 388,395$
Assumed Fixed Assets (No Mfg Equip) 25,000$
Total Assumed Assets 413,395$
Assumed Liabilities
Current Liabilities 38,037$
Long Term Liabilities
Other
Loans Payable ‐$
Total Assumed Liabilities 38,037$
Assumed Working Capital 350,359$
Sample