
CONFidence 2015: DTrace + OSX = Fun - Andrzej Dyjak
49
DTrace + OS X = Fun Andrzej Dyjak (@dyjakan) Confidence 2015, Kraków www.census-labs.com
Transcript of CONFidence 2015: DTrace + OSX = Fun - Andrzej Dyjak

DTrace + OS X = FunAndrzej Dyjak (@dyjakan)
Confidence 2015, Kraków
www.census-labs.com

> AGENDA
• Part 1: IntroductionI. What is DTrace?II. D languageIII. Past workIV. Similar projects
• Part 2: UsageI. One-linersII. ScriptsIII. Future workIV. References

> PART 1: INTRODUCTION

> What is DTrace?
„DTrace is a comprehensive dynamic tracing facility (...) that can be used by administrators and developers on live production systems to examine the behavior of both user programs and of the operating system itself. DTrace enables you to explore your system to understand how it works, track down performance problems across many layers of software, or locate the cause of aberrant behavior.”
To put it simply: Retarded debugger / DBI engine for user and kernel modes.

www.census-labs.com

www.census-labs.com
# cat example.dPROVIDER:MODULE:FUNCTION:NAME/PREDICATE/{
actions;}
# dtrace –s example.d# dtrace –n ’PROVIDER:MODULE:FUNCTION:NAME /PREDICATE/ {action;}’

www.census-labs.com

www.census-labs.com

BONUS: USDT (User-Level Statically Defined Tracing)„(…) providing debug macros that can be customized and placed throughout the code.”
Debugging / analysis capabilities can be improved even more.

> D language
• Data types• Variables• Built-ins• Operators• Control statements• Actions & subroutines• Default providers

> Data types
• char, short, int, long, long long, float, double, long double
• Aliases (like int32_t)• You can dereference pointers and
walk structure chains• You can cast things

> Variables
Types:• Scalars• Strings (differs from C)• Arrays• Associative arrays
Scope:• Globals: foobar = 1337• Clause-locals: this->foo = 13• Thread-locals: self->bar = 37• External variables: `internal_kernel_variable

> Built-ins
Built-in variables:• *curpsinfo, *curlwpsinfo, *curthread,
caller, arg0-9 and args[], execname, pid, ppid, timestamp, uregs[], …

> Operators
• Arithmetic• Relational (apply also to strings, e.g.
As a predicate /execname == ”foobar”/)
• Logical (XOR is ^^)• Bitwise (XOR is ^)• Assignment• Increment / Decrement

> Control statements
None. Loops and IFs (apart from predicates and ?:) are not implemented.

> Actions & subroutines
Generic and safe:• stack() / ustack()• tracemem()• alloca()• bcopy()• copyin() / copyinstr() / copyinto()• msgsize() / strlen()[ … ]

> Actions & subroutines cont’d
Destructive for specific process:• stop()• raise()• copyout() / copyoutstr()• system()

> Actions & subroutines cont’d
Destructive for the system:• breakpoint()• panic()• chill()

> Default providers
Most interesting:• syscall• pid• objc• fbt• proc[ … ]

www.census-labs.com

> Past work (in the context of security)
• BlackHat 2008 (and some others)– „RE:Trace - Applied Reverse Engineering
on OS X” by Tiller Beauchamp and David Weston
• Infiltrate 2013– „Destructive D-Trace” by nemo

> Similar projects (among others)
• SystemTap (Red Hat)– Very similar to DTrace, kinda like a response
from Red Hat for Linux– For interesting usage case see
http://census-labs.com/news/2014/11/06/systemtap-unbound-overflow/
• Detours (Microsoft)– „Software package for re-routing Win32 APIs
underneath applications.”– Similar in functionality, differs in the
implementation, e.g. http://blogs.msdn.com/b/oldnewthing/archive/2011/09/21/10214405.aspx

> PART 2: USAGE

> One-liners
• Syscalls stats• Bytes read by process stats• Process creation logging
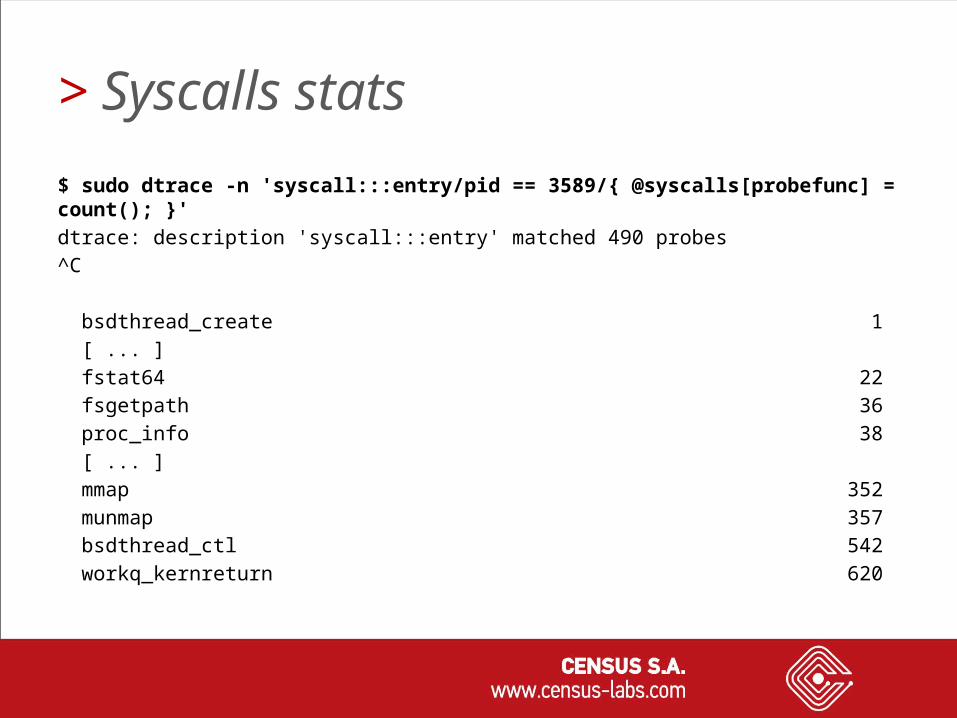
> Syscalls stats
$ sudo dtrace -n 'syscall:::entry/pid == 3589/{ @syscalls[probefunc] = count(); }'dtrace: description 'syscall:::entry' matched 490 probes^C
bsdthread_create 1 [ ... ] fstat64 22 fsgetpath 36 proc_info 38 [ ... ] mmap 352 munmap 357 bsdthread_ctl 542 workq_kernreturn 620

> Bytes read by process stats
$ sudo dtrace -n 'syscall::read:entry { @bytes[execname] = sum(arg2); }'dtrace: description 'syscall::read:entry ' matched 1 probe^C
Google Chrome H 26 authd 64 SFLIconTool 504 cfprefsd 858 CoreServicesUIA 1024 iTerm 1056 [ ... ] mds 589696 fseventsd 76866

> Process creation logging
$ sudo dtrace -qn 'syscall::posix_spawn:entry { printf("%Y %s\n", walltimestamp, copyinstr(arg1)); }'2015 May 26 13:39:35 /usr/libexec/xpcproxy2015 May 26 13:39:35 /Applications/Safari.app/Contents/MacOS/Safari2015 May 26 13:39:35 /usr/libexec/xpcproxy2015 May 26 13:39:35 /usr/libexec/xpcproxy2015 May 26 13:39:35 /System/Library/StagedFrameworks/Safari/WebKit.framework/Versions/A/XPCServices/com.apple.WebKit.Networking.xpc/Contents/MacOS/com.apple.WebKit.Networking2015 May 26 13:39:35 /System/Library/StagedFrameworks/Safari/WebKit.framework/Versions/A/XPCServices/com.apple.WebKit.WebContent.xpc/Contents/MacOS/com.apple.WebKit.WebContent2015 May 26 13:39:36 /usr/libexec/xpcproxy2015 May 26 13:39:36 /usr/libexec/SafariNotificationAgent

> One-liners cont’d
For some more ideas you can quickly check http://mfukar.github.io/2014/03/19/dtrace.html or just google for them.

> Scripts
• Tracking input• Memory allocation snooping• Hit tracing

> Tracking input
• I’ve covered this on my blog for read()
• However, often times mmap() is used instead and this led to an interesting problem
• Also, this can be reimplemented for network input as well

www.census-labs.com
BEGIN{ trackedfd[0] = 0; trackedmmap[0] = 0;}

www.census-labs.com
pid$target::__open:entry/copyinstr(arg0) == "/Users/ad/Desktop/test"/{ self->fname = copyinstr(arg0); self->openok = 1;}
pid$target::__open:return/self->openok/{ trackedfd[arg1] = 1; printf("Opening %s with fd %#x\n", self->fname, arg1); self->fname = 0; self->openok = 0;}

www.census-labs.com
pid$target::__mmap:entry/trackedfd[arg4] == 1/{ self->msz = arg1; self->mfd = arg4;}
pid$target::__mmap:return/self->msz/{ trackedmmap[arg1] = 1; printf("Mapping fd %#x to %#p size %#x\n", self->mfd, arg1, self->msz); ustack(); printf("\n");}

www.census-labs.com
pid$target::__munmap:entry/trackedmmap[arg0] == 1/{ printf("Unmapping %#p\n", arg0);
tracemem(copyin(arg0, arg1), 128); self->msz = 0; self->mfd = 0; trackedmmap[arg0] = 0;}

www.census-labs.com
pid$target::close:entry/trackedfd[arg0] == 1/{ trackedfd[arg0] = 0;}

> Memory allocation snooping
• Implementation of a simple tool that imitates output of ltrace for memory allocation functions from libc
But there are more possible scenarios, e.g.:• Heap layout analysis• Snooping into custom memory allocators• Tracking kernel memory allocations

www.census-labs.com
pid$target::malloc:entry{ self->msize = arg0;}
pid$target::malloc:return/self->msize/{ printf("malloc(%d) = %#p\n", self->msize, arg1); self->msize = 0;}

www.census-labs.com
pid$target::valloc:entry{ self->vsize = arg0;}
pid$target::valloc:return/self->vsize/{ printf("valloc(%d) = %#p\n", self->vsize, arg1); self->vsize = 0;}

www.census-labs.com
pid$target::calloc:entry{ self->ccount = arg0; self->csize = arg1;}
pid$target::calloc:return/self->csize/{ printf("calloc(%d, %d) = %#p\n", self->ccount, self->csize, arg1); self->ccount = 0; self->csize = 0;}
www.census-labs.com
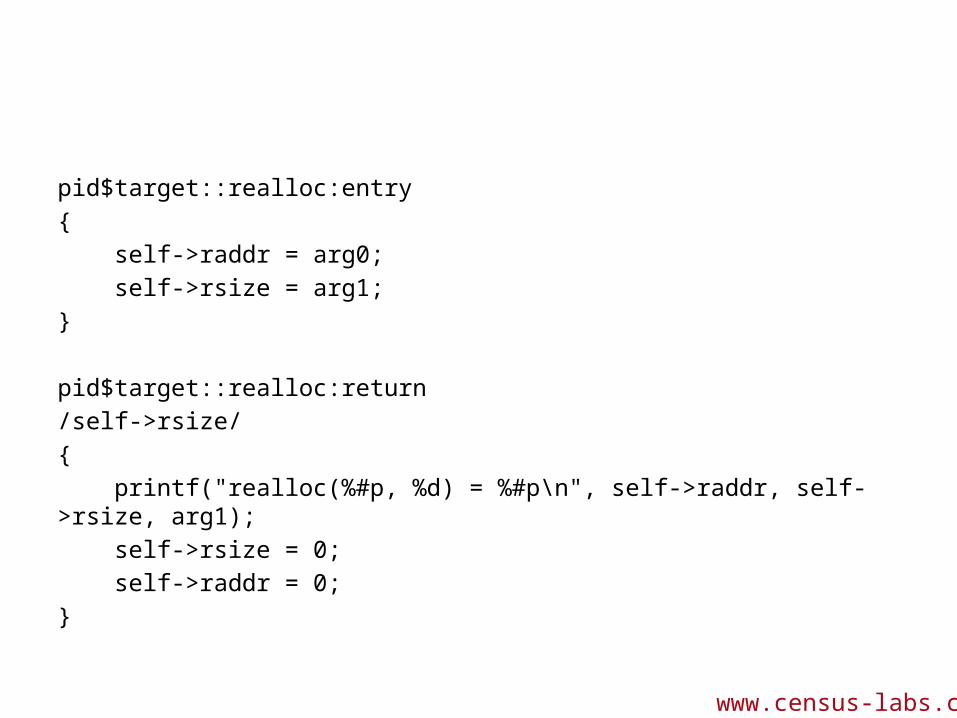
pid$target::realloc:entry{ self->raddr = arg0; self->rsize = arg1;}
pid$target::realloc:return/self->rsize/{ printf("realloc(%#p, %d) = %#p\n", self->raddr, self->rsize, arg1); self->rsize = 0; self->raddr = 0;}

www.census-labs.com
pid$target::reallocf:entry{ self->rfaddr = arg0; self->rfsize = arg1;}
pid$target::reallocf:return/self->rfsize/{ printf("reallocf(%#p, %d) = %#p\n", self->rfaddr, self->rfsize, arg1); self->rfaddr = 0; self->rfsize = 0;}

www.census-labs.com
pid$target::free:entry{ printf("free(%#p) = <void>\n", arg0);}
www.census-labs.com
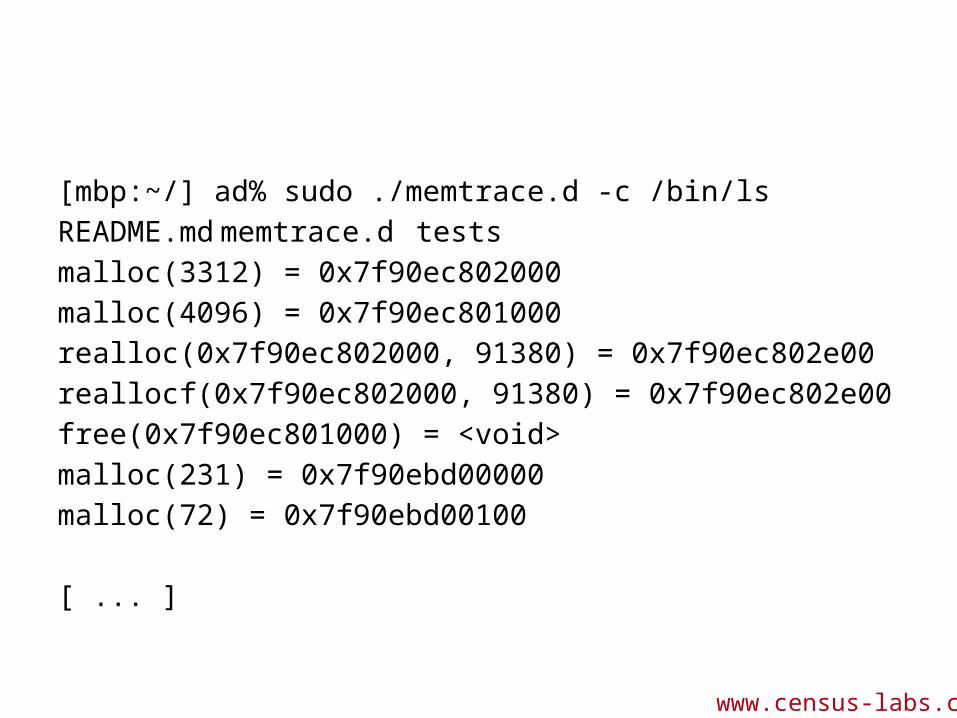
[mbp:~/] ad% sudo ./memtrace.d -c /bin/lsREADME.md memtrace.d testsmalloc(3312) = 0x7f90ec802000malloc(4096) = 0x7f90ec801000realloc(0x7f90ec802000, 91380) = 0x7f90ec802e00reallocf(0x7f90ec802000, 91380) = 0x7f90ec802e00free(0x7f90ec801000) = <void>malloc(231) = 0x7f90ebd00000malloc(72) = 0x7f90ebd00100
[ ... ]
www.census-labs.com

> Hit tracing
• Kinda like a code coverage but the end-goal is different
• Two modes of operation: – Shallow would mark functions within module– Deep would mark instructions within a
function
• Output is pre-processed and lands in IDA for graph colorization
• Similar to http://dvlabs.tippingpoint.com/blog/2008/07/17/mindshare-hit-tracing-in-windbg
> Future work
• More kernel work• More USDT work (V8?)• Python-based DTrace consumer
(a.k.a. Python bindings)
I’m open to ideas, don’t be shy and mail me.

> References
• http://dtrace.org/blogs/• https://wikis.oracle.com/display/DTrace/
Documentation• http://dtracebook.com• http://dtracehol.com• http://phrack.org/issues/63/3.html• „Dynamic Instrumentation of
Production Systems” Cantrill, Shapiro, Leventhal
• Apple TN2124, DTrace entry

Q & A


![EVPN Virtual Private Wire Service (VPWS) Single Homed · EVPN dtrace elem per-cont : 1280/65632 ( 1%) [ 20] Chunk EVPN dtrace stridx : 1194876/1194968 ( 99%) [ 1] EVPN dtrace stridx](https://static.fdocuments.us/doc/165x107/5b7ad8027f8b9a4c4a8b6bcd/evpn-virtual-private-wire-service-vpws-single-homed-evpn-dtrace-elem-per-cont.jpg)