Conference - Bankruptbankrupt.com/DI2013/1505Energy.pdf · Key Issues for the US Coal Industry •...
21
Andrews Kurth 1
Transcript of Conference - Bankruptbankrupt.com/DI2013/1505Energy.pdf · Key Issues for the US Coal Industry •...
Andrews Kurth1

2013 Distressed Investing Conference
andrewskurth.com
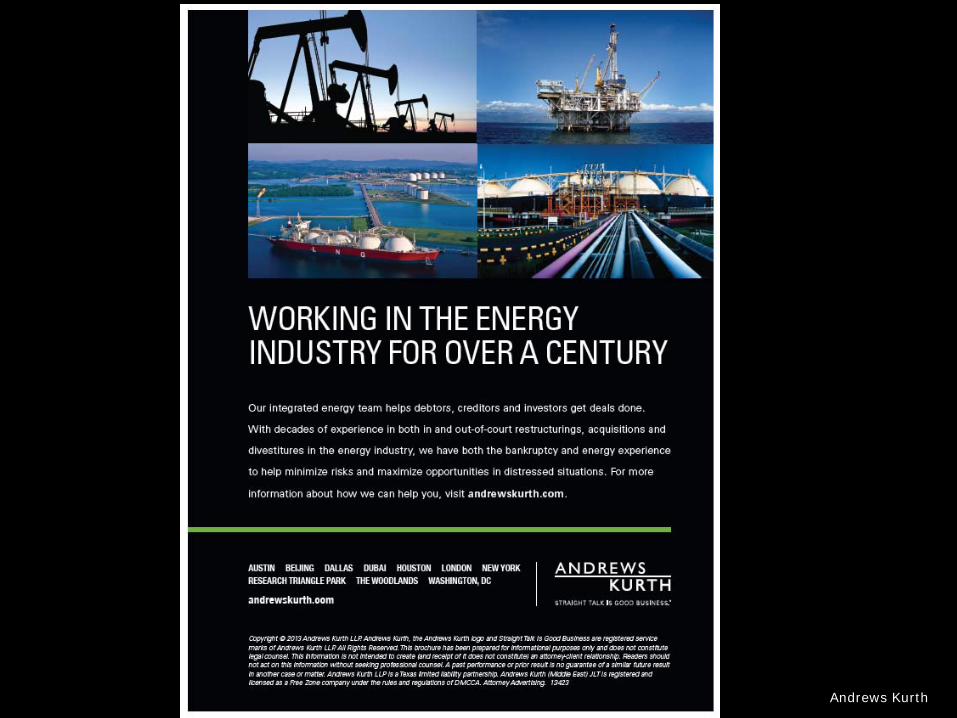
Key Issues for the US Coal Industry• Decline in demand by domestic power sector is permanent
• Competition of lower-cost natural gas combined cycle plants displaces some existing coal generation and ends outlook for new coal-fired plant development
• New EPA rules on existing coal-fired power plants require capital investment to keep operating, 36 GW of retirements announced 2013 – 2016
• MATS rule is the major cause of retirements; also regional haze rule and NSR lawsuits
• Future power demand likely to be 800 – 900 mm tpy, not +1.0 billion
• Export markets are uncertain and volatile
• Swing in currency exchange rates drives world prices in US dollars
• Met coal exports affected by growth in Australia, Mongolia and Mozambique
• Atlantic Basin is over-supplied with steam coal; need Pacific ports
• Supply rationalization is slow and painful
• Restructuring to smaller market takes time
• Cost of leaving business is high
• Excess supply has depressed pricing
3378625_13

Short-Term Issue: Power Sector Coal Stockpiles• Mild winter of ‘11-’12 caused huge jump in coal inventories
• 53 days of average burn in Aug 2011 soared to 88 days in May 2012• Added 64 mm tons to customer inventories
• Cuts in purchases and increased burn bring stocks down to 66 days in Aug 2013
• Positive sign for 2014 coal prices as purchases will increase to maintain stocks
3378625_14
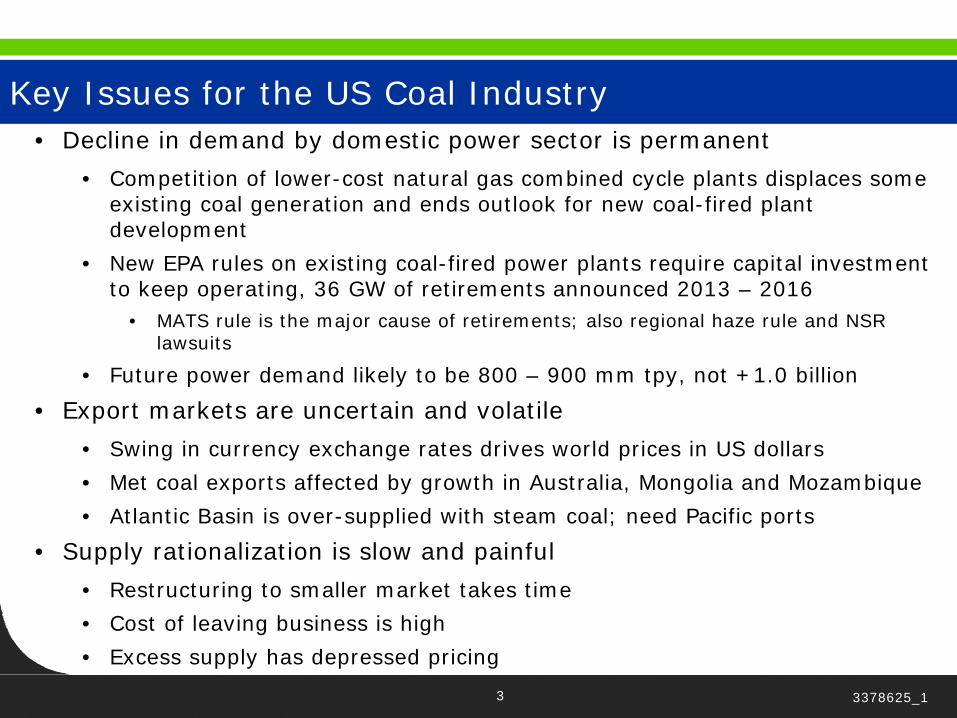
Central Appalachia Overview• Once-largest basin is facing severe decline
• Domestic power market loss to scrubbed high-sulfur coal and natural gas CCGT
• Export steam unlikely to be cost competitive in Atlantic Basin
• Metallurgical demand will largely be sustained, but under pressure in Asia
• Another round of massive mine closures is underway
(Million Tons) 2008 2009 2010 2011 2012 2013 2014 2015 2016CENTRAL APPALACHIATotal Production 233.4 194.6 184.2 182.7 147.2 130.6 118.3 97.6 90.5
Electric Power Receipts
150.7 130.0 111.4 99.2 61.3 45.5 44.4 31.1 25.7
Electric Burn 154.0 119.5 119.3 95.3 59.6 53.6 51.9 31.1 25.7Stockpile Change (3.3) 10.5 (7.9) 3.8 1.7 (8.1) (7.4) 0.0 0.0
Coke Ovens 17.3 11.7 15.9 16.2 15.0 15.1 15.2 15.3 15.2Commercial/Industri al
16.5 12.4 14.1 12.3 10.1 10.3 9.9 9.5 9.2
Domestic Receipts 184.6 154.1 141.4 127.7 86.4 71.0 69.5 55.9 50.1
Export Metallurgical 27.3 23.9 33.8 43.1 43.1 40.4 35.3 33.2 32.8Export Steam 5.6 5.4 3.3 8.8 16.4 18.5 13.5 8.5 7.6Total Exports 32.8 29.3 37.1 51.9 59.5 58.9 48.8 41.7 40.4
5 3378625_1
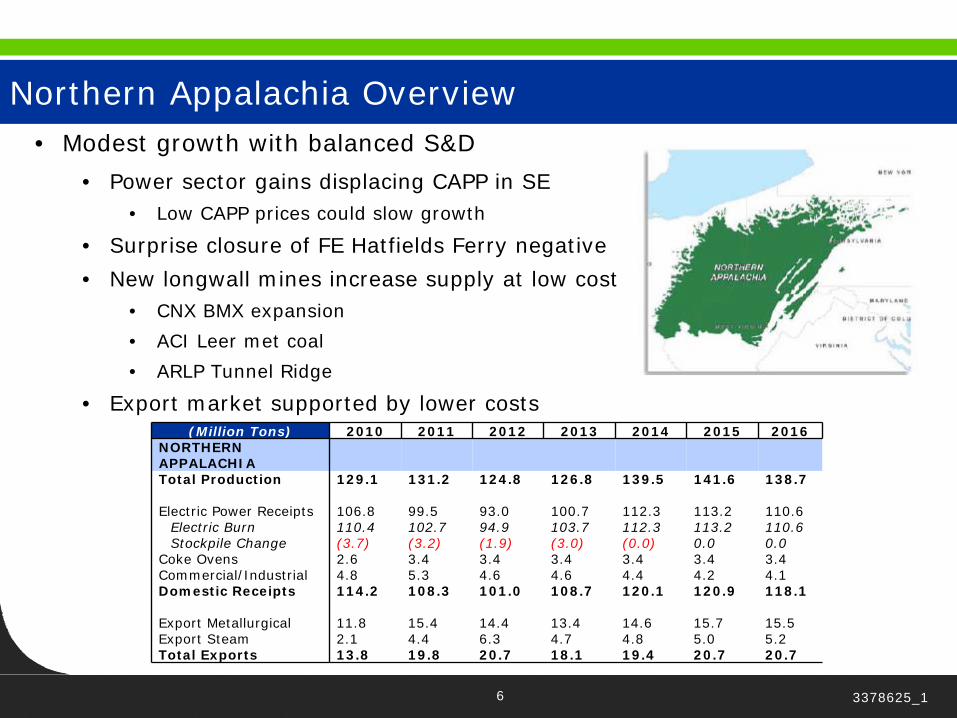
Northern Appalachia Overview• Modest growth with balanced S&D
• Power sector gains displacing CAPP in SE• Low CAPP prices could slow growth
• Surprise closure of FE Hatfields Ferry negative
• New longwall mines increase supply at low cost• CNX BMX expansion
• ACI Leer met coal
• ARLP Tunnel Ridge
• Export market supported by lower costs(Million Tons) 2010 2011 2012 2013 2014 2015 2016
NORTHERN APPALACHIATotal Production 129.1 131.2 124.8 126.8 139.5 141.6 138.7
Electric Power Receipts 106.8 99.5 93.0 100.7 112.3 113.2 110.6Electric Burn 110.4 102.7 94.9 103.7 112.3 113.2 110.6Stockpile Change (3.7) (3.2) (1.9) (3.0) (0.0) 0.0 0.0
Coke Ovens 2.6 3.4 3.4 3.4 3.4 3.4 3.4Commercial/Industrial 4.8 5.3 4.6 4.6 4.4 4.2 4.1Domestic Receipts 114.2 108.3 101.0 108.7 120.1 120.9 118.1
Export Metallurgical 11.8 15.4 14.4 13.4 14.6 15.7 15.5Export Steam 2.1 4.4 6.3 4.7 4.8 5.0 5.2Total Exports 13.8 19.8 20.7 18.1 19.4 20.7 20.7
6 3378625_1

Illinois Basin Overview• Robust growth in domestic power market
• Displacing CAPP in SE and PRB in Midwest
• Lower delivered price supports generation v gas
• New longwall mines increase supply at low cost• Foresight Sugar Camp B mine
• White Oak
• Export price discounted for high sulfur
• Lower cost access to exports through New Orleans
• Hope for growth to Asia through expanded Canal
7
(Million Tons) 2010 2011 2012 2013 2014 2015 2016ILLINOIS BASINTotal Production 105.1 115.8 126.9 135.0 138.3 142.7 145.9
Electric Power Receipts 95.9 100.1 102.1 114.0 119.7 124.5 126.6Electric Burn 97.2 101.6 100.4 113.3 122.6 124.5 126.6Stockpile Change (1.3) (1.6) 1.7 0.7 (2.8) 0.0 0.0
Coke Ovens 0.0 0.0 0.0 0.0 0.0 0.0 0.0Commercial/Industrial 8.3 8.2 6.8 6.7 6.4 6.1 5.9Domestic Receipts 104.2 108.3 108.9 120.6 126.1 130.7 132.5
Export Metallurgical 0.0 0.0 0.0 0.0 0.0 0.0 0.0Export Steam 6.4 9.8 15.3 12.3 12.2 12.0 13.4Total Exports 6.4 9.8 15.3 12.3 12.2 12.0 13.4
3378625_1
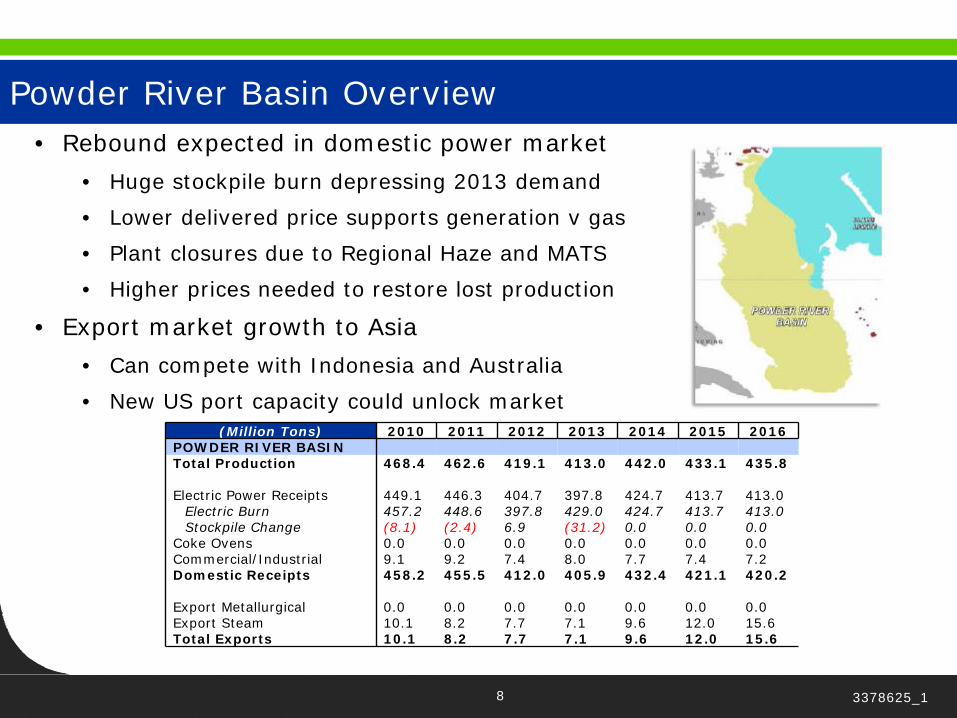
Powder River Basin Overview• Rebound expected in domestic power market
• Huge stockpile burn depressing 2013 demand
• Lower delivered price supports generation v gas
• Plant closures due to Regional Haze and MATS
• Higher prices needed to restore lost production
• Export market growth to Asia
• Can compete with Indonesia and Australia
• New US port capacity could unlock market(Million Tons) 2010 2011 2012 2013 2014 2015 2016
POWDER RIVER BASINTotal Production 468.4 462.6 419.1 413.0 442.0 433.1 435.8
Electric Power Receipts 449.1 446.3 404.7 397.8 424.7 413.7 413.0Electric Burn 457.2 448.6 397.8 429.0 424.7 413.7 413.0Stockpile Change (8.1) (2.4) 6.9 (31.2) 0.0 0.0 0.0
Coke Ovens 0.0 0.0 0.0 0.0 0.0 0.0 0.0Commercial/Industrial 9.1 9.2 7.4 8.0 7.7 7.4 7.2Domestic Receipts 458.2 455.5 412.0 405.9 432.4 421.1 420.2
Export Metallurgical 0.0 0.0 0.0 0.0 0.0 0.0 0.0Export Steam 10.1 8.2 7.7 7.1 9.6 12.0 15.6Total Exports 10.1 8.2 7.7 7.1 9.6 12.0 15.6
8 3378625_1
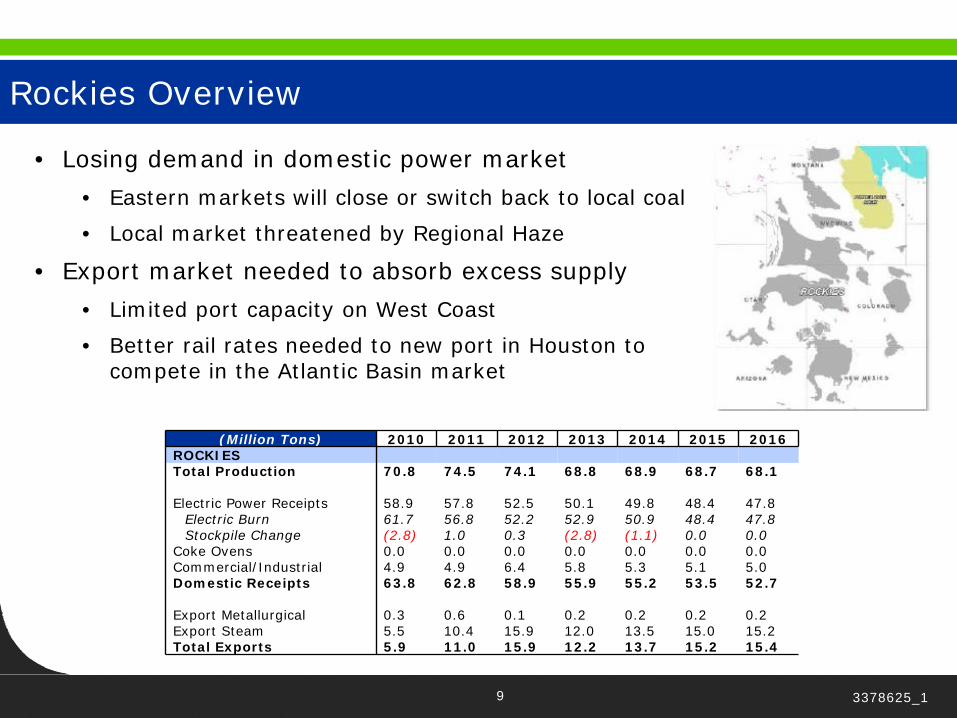
Rockies Overview
• Losing demand in domestic power market
• Eastern markets will close or switch back to local coal
• Local market threatened by Regional Haze
• Export market needed to absorb excess supply
• Limited port capacity on West Coast
• Better rail rates needed to new port in Houston to compete in the Atlantic Basin market
9
(Million Tons) 2010 2011 2012 2013 2014 2015 2016ROCKIESTotal Production 70.8 74.5 74.1 68.8 68.9 68.7 68.1
Electric Power Receipts 58.9 57.8 52.5 50.1 49.8 48.4 47.8Electric Burn 61.7 56.8 52.2 52.9 50.9 48.4 47.8Stockpile Change (2.8) 1.0 0.3 (2.8) (1.1) 0.0 0.0
Coke Ovens 0.0 0.0 0.0 0.0 0.0 0.0 0.0Commercial/Industrial 4.9 4.9 6.4 5.8 5.3 5.1 5.0Domestic Receipts 63.8 62.8 58.9 55.9 55.2 53.5 52.7
Export Metallurgical 0.3 0.6 0.1 0.2 0.2 0.2 0.2Export Steam 5.5 10.4 15.9 12.0 13.5 15.0 15.2Total Exports 5.9 11.0 15.9 12.2 13.7 15.2 15.4
3378625_1
10 3378625_1
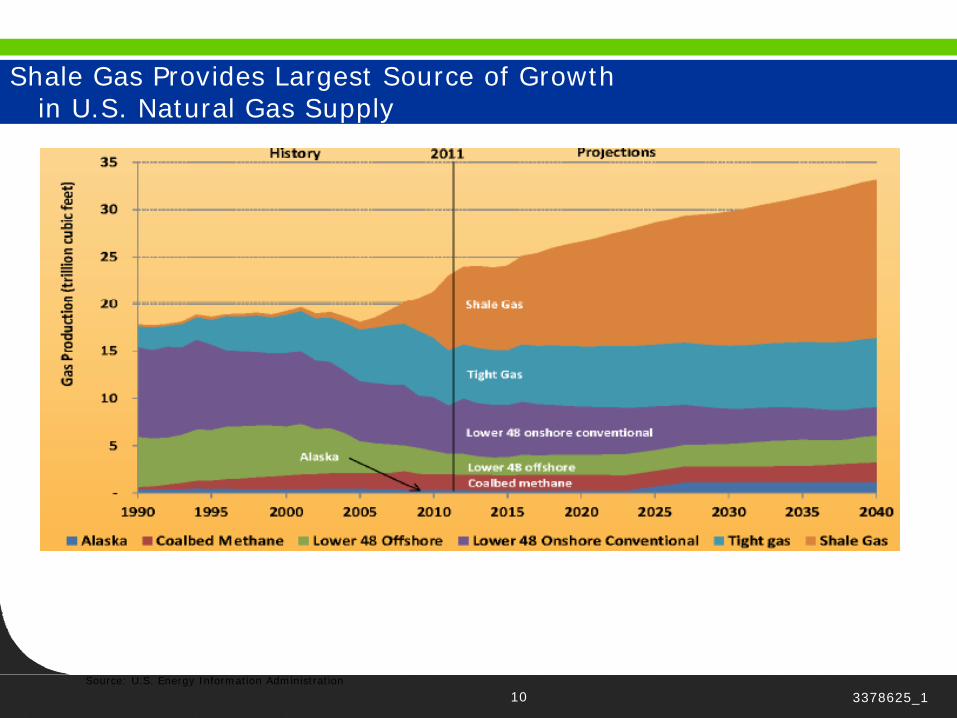
Shale Gas Provides Largest Source of Growth in U.S. Natural Gas Supply
Source: U.S. Energy Information Administration

11 3378625_1
U.S. Exports of Natural Gas Exceed Imports
Source: U.S. Energy Information Administration
12 3378625_1
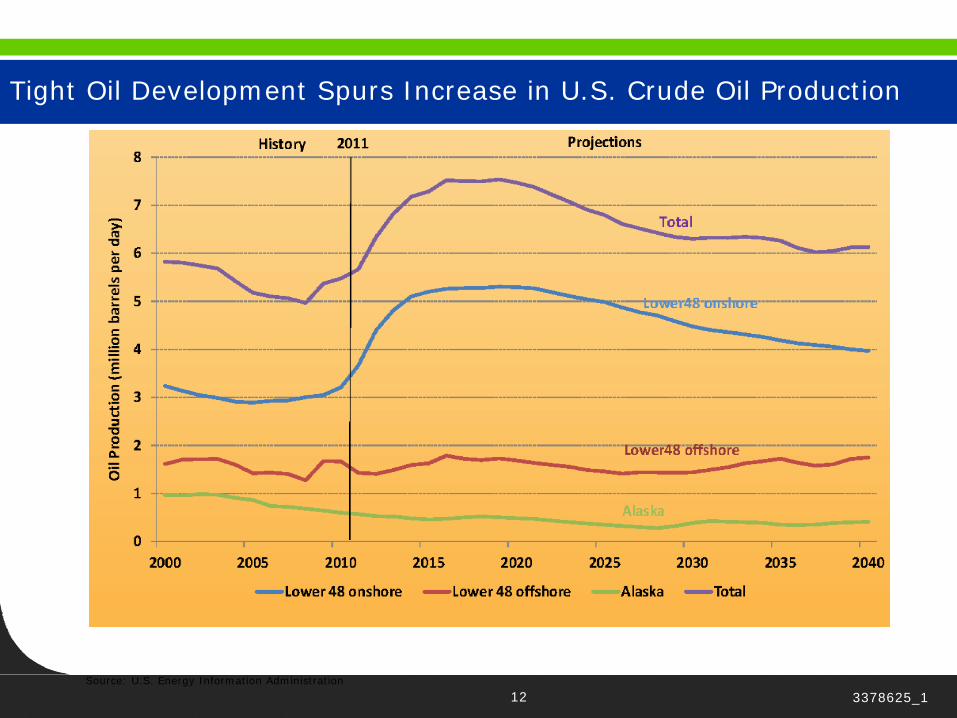
Tight Oil Development Spurs Increase in U.S. Crude Oil Production
Source: U.S. Energy Information Administration
13 3378625_1
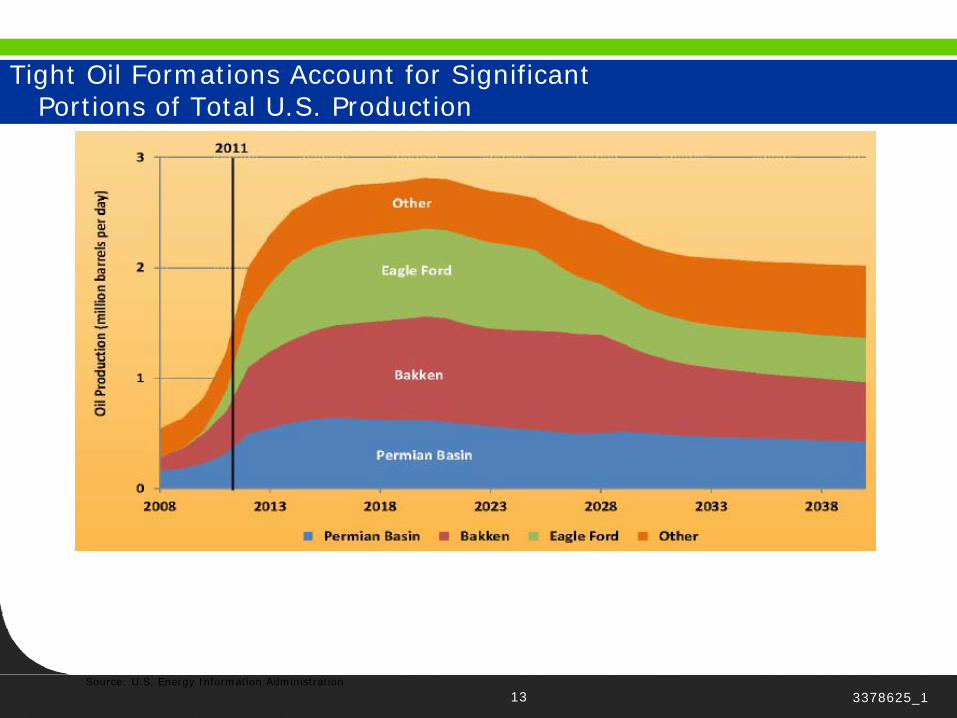
Tight Oil Formations Account for Significant Portions of Total U.S. Production
Source: U.S. Energy Information Administration
14 254889_1
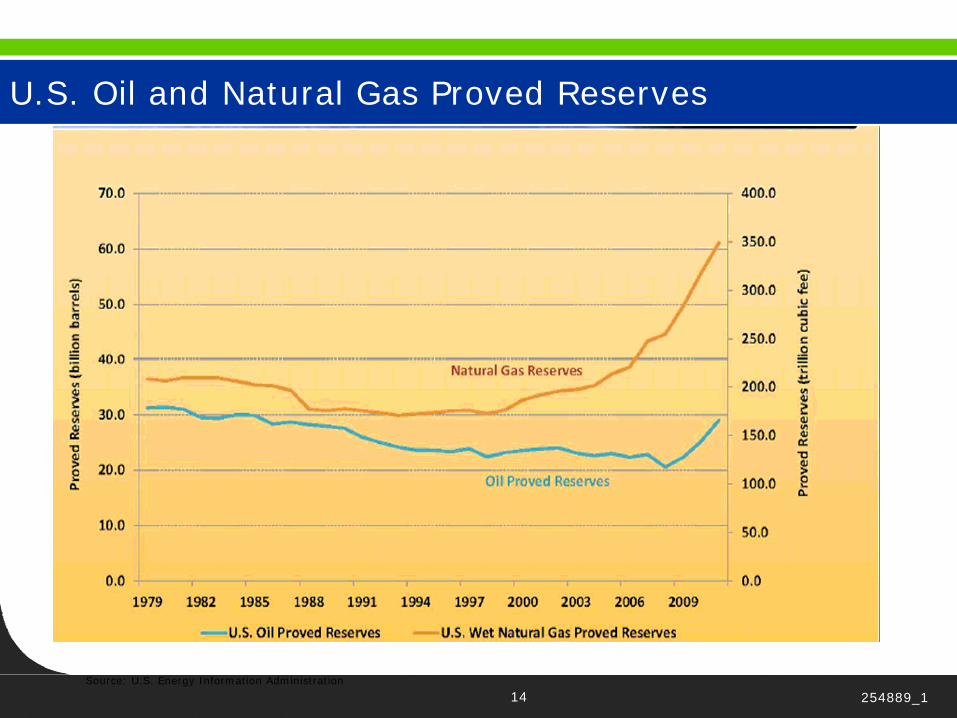
U.S. Oil and Natural Gas Proved Reserves
Source: U.S. Energy Information Administration
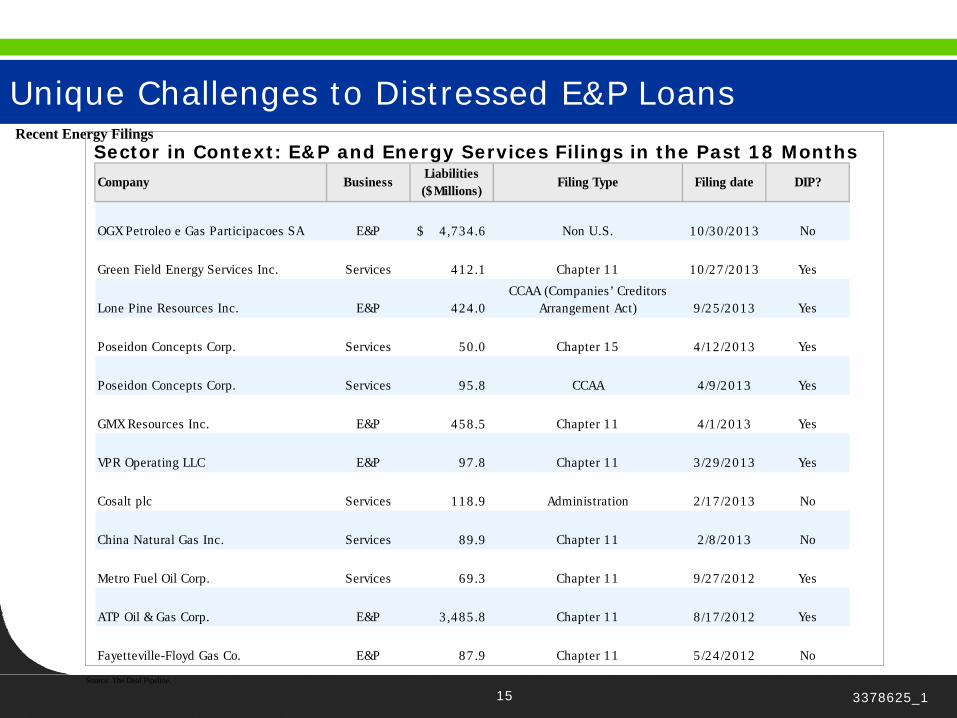
Unique Challenges to Distressed E&P Loans
Sector in Context: E&P and Energy Services Filings in the Past 18 MonthsRecent Energy Filings
Source: The Deal Pipeline.
Company Business Liabilities ($Millions)
Filing Type Filing date DIP?
OGX Petroleo e Gas Participacoes SA E&P 4,734 .6$ Non U.S. 10 /30 /2013 No
Green Field Energy Services Inc. Services 412 .1 Chapter 11 10 /27 /2013 Yes
Lone Pine Resources Inc. E&P 424 .0CCAA (Companies’ Creditors
Arrangement Act) 9 /25 /2013 Yes
Poseidon Concepts Corp. Services 50 .0 Chapter 15 4 /12 /2013 Yes
Poseidon Concepts Corp. Services 95 .8 CCAA 4/9 /2013 Yes
GMX Resources Inc. E&P 458 .5 Chapter 11 4 /1 /2013 Yes
VPR Operating LLC E&P 97.8 Chapter 11 3 /29 /2013 Yes
Cosalt plc Services 118 .9 Administration 2 /17 /2013 No
China Natural Gas Inc. Services 89 .9 Chapter 11 2 /8 /2013 No
Metro Fuel Oil Corp. Services 69 .3 Chapter 11 9 /27 /2012 Yes
ATP Oil & Gas Corp. E&P 3,485 .8 Chapter 11 8 /17 /2012 Yes
Fayetteville-Floyd Gas Co. E&P 87.9 Chapter 11 5 /24 /2012 No
15 3378625_1
Unique Challenges to Distressed E&P Loans
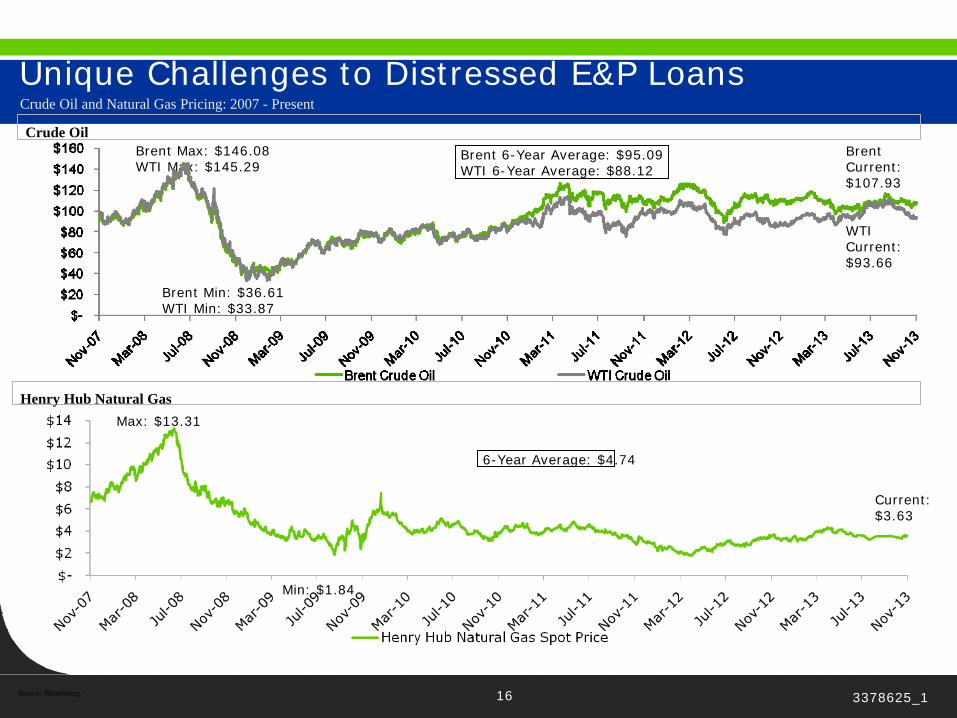
Crude Oil
Henry Hub Natural Gas
Source: Bloomberg.
Max: $13.31
Min: $1.84
6-Year Average: $4.74
Current: $3.63
Brent Max: $146.08WTI Max: $145.29
Brent 6-Year Average: $95.09WTI 6-Year Average: $88.12
Crude Oil and Natural Gas Pricing: 2007 - Present
Brent Current: $107.93
WTI Current: $93.66
Brent Min: $36.61WTI Min: $33.87
16 3378625_1

Unique Challenges to Distressed E&P Loans
Assessing Collateral Coverage Within the E&P Context – Is My Claim Really Senior?
ORRIs (overriding royalty interests) – Impact on Cash Flows and Collateral Position
NPIs (net profit interests) – Impact on Cash Flows
M&M Lien Claims – Impact on Collateral Position and Repayments
Asset Retirement Obligations / P&A liability claims – Impact on Repayments
Financial and Legal Analysis
17 3378625_1
Unique Challenges to Distressed E&P Loans
Assessing Collateral Coverage Within the E&P Context – Does Collateral Today Equal Collateral Tomorrow?
Impact of Production on Reserves - Daily Diminution to Collateral Value
Lease Expirations - Diminishing Acreage Coverage
Potential Loss of Leases – Risks to Future Production / Reserves
Bans on Fracking / Drilling – Elimination of Production / Reserves
Financial and Legal Analysis
18 3378625_1
Unique Challenges to Distressed E&P Loans
Assessing Collateral Coverage Within the E&P Context – Assessing Third Party / Operational Risk
Costs and Risks of Converting PUDs to PDP
Potential Challenges to Working with JV partners
Potential Perils of Acting as a Non-Operator
Reserves Without Infrastructure
Financial and Legal Analysis
19 3378625_1

Unique Challenges to Distressed E&P Loans
Issues with E&P Assets
Seismic Data
Transferability
Exclusivity
Leases –
Expiration dates
Landman and other contracts
ORRI’s
Participation interests
Back-in interest
Reversionary interests
Remarketing rights
Drilling obligations
What is HBP – definition of a unit
Are they in default of any JOA obligations and, if so, what are the ramifications
Defaulting partners increasing the cost of drilling (i.e., are you backstopping others)
Financial and Legal Analysis
20 3378625_1

Unique Challenges to Distressed E&P Loans
Relationship between the owner and the operator
Most common scenario, private equity hires a management team as operator
Separate entity or entity controlled by private equity
Do not want operator-type liability
If separate entity, will have separate books and records;
Need audit rights and an awareness of competing loyalties
Incorporation of an AMI
Ownership of leases/drilling prospects
Who owns the lease – the operator entity or the Newco [better be the latter]
Are there partners (other Joint Interest Owners?)
If so, then
How does funding work?
What happens if a JIO defaults – who picks up the funding?
What if a JIO opts out – how is the funding deficit allocated?
What does it take to remove the operator? Need to review the JOA carefully
Cash flow
Who receives the cash flow from the first purchaser
Often it is the “controlled” operator – a problem if you want to terminate the operator
What happens if the operator goes bankrupt?
Financial and Legal Analysis
21 3378625_1