August/03 TNE - Conference Call – 2Q03 0 Conference Call 2Q03.

Nokia Conference CallFirst Quarter 2010 Financial Results
April 22, 2010 15.00 Helsinki time 8.00 New York time
Olli-Pekka Kallasvuo CEO
Timo Ihamuotila CFO
Kristian Pullola Head of Treasury and Investor Relations
Disclaimer
It should be noted that certain statements herein which are not historical facts are forward-looking statements, including, without limitation, those regarding: A) the timing of the deliveries of our products and services and their combinations; B) our ability to develop, implement and commercialize new technologies, products and services and their combinations; C) expectations regarding market developments and structural changes; D) expectations and targets regarding our industry volumes, market share, prices, net sales and margins of products and services and their combinations; E) expectations and targets regarding our operational priorities and results of operations; F) the outcome of pending and threatened litigation; G) expectations regarding the successful completion of acquisitions or restructurings on a timely basis and our ability to achieve the financial and operational targets set in connection with any such acquisition or restructuring; and H) statements preceded by "believe," "expect," "anticipate," "foresee," "target," "estimate," "designed," "plans," "will" or similar expressions. These statements are based on management's best assumptions and beliefs in light of the information currently available to it. Because they involve risks and uncertainties, actual results may differ materially from the results that we currently expect. Factors that could cause these differences include, but are not limited to: 1) the competitiveness and quality of our portfolio of products and services and their combinations; 2) our ability to timely and successfully develop or otherwise acquire the appropriate technologies and commercialize them as new advanced products and services and their combinations, including our ability to attract application developers and content providers to develop applications and provide content for use in our devices; 3) our ability to effectively, timely and profitably adapt our business and operations to the requirements of the converged mobile device market and the services market; 4) the intensity of competition in the various markets where we do business and our ability to maintain or improve our market position or respond successfully to changes in the competitive environment; 5) the occurrence of any actual or even alleged defects or other quality, safety or security issues in our products and services and their combinations; 6) the development of the mobile and fixed communications industry and general economic conditions globally and regionally; 7) our ability to successfully manage costs; 8) exchange rate fluctuations, including, in particular, fluctuations between the euro, which is our reporting currency, and the US dollar, the Japanese yen and the Chinese yuan, as well as certain other currencies; 9) the success, financial condition and performance of our suppliers, collaboration partners and customers; 10) our ability to source sufficient amounts of fully functional components, sub-assemblies, software, applications and content without interruption and at acceptable prices and quality; 11) our success in collaboration arrangements with third parties relating to the development of new technologies, products and services, including applications and content; 12) our ability to manage efficiently our manufacturing and logistics, as well as to ensure the quality, safety, security and timely delivery of our products and services and their combinations; 13) our ability to manage our inventory and timely adapt our supply to meet changing demands for our products; 14) our ability to protect the complex technologies, which we or others develop or that we license, from claims that we have infringed third parties' intellectual property rights, as well as our unrestricted use on commercially acceptable terms of certain technologies in our products and services and their combinations; 15) our ability to protect numerous Nokia, NAVTEQ and Nokia Siemens Networks patented, standardized or proprietary technologies from third-party infringement or actions to invalidate the intellectual property rights of these technologies; 16) the impact of changes in government policies, trade policies, laws or regulations and economic or political turmoil in countries where our assets are located and we do business; 17) any disruption to information technology systems and networks that our operations rely on; 18) our ability to retain, motivate, develop and recruit appropriately skilled employees; 19) unfavorable outcome of litigations; 20) allegations of possible health risks from electromagnetic fields generated by base stations and mobile devices and lawsuits related to them, regardless of merit; 21) our ability to achieve targeted costs reductions and increase profitability in Nokia Siemens Networks and to effectively and timely execute related restructuring measures; 22) developments under large, multi-year contracts or in relation to major customers in the networks infrastructure and related services business; 23) the management of our customer financing exposure, particularly in the networks infrastructure and related services business; 24) whether ongoing or any additional governmental investigations into alleged violations of law by some former employees of Siemens AG ("Siemens") may involve and affect the carrier-related assets and employees transferred by Siemens to Nokia Siemens Networks; 25) any impairment of Nokia Siemens Networks customer relationships resulting from ongoing or any additional governmental investigations involving the Siemens carrier-related operations transferred to Nokia Siemens Networks; as well as the risk factors specified on pages 11-32 of Nokia's annual report Form 20-F for the year ended December 31, 2009 under Item 3D. "Risk Factors." Other unknown or unpredictable factors or underlying assumptions subsequently proving to be incorrect could cause actual results to differ materially from those in the forward-looking statements. Nokia does not undertake any obligation to publicly update or revise forward-looking statements, whether as a result of new information, future events or otherwise, except to the extent legally required.
2 © 2010 Nokia First Quarter 2010 Financial Results

3 © 2010 Nokia First Quarter 2010 Financial Results
Nokia results in line with the guidance for Q1
• Nokia continued to show solid smartphonemomentum in lower price points
• Despite challenges at the high end of our device portfolio, Nokia delivered results in line with our guidance
• Our high end portfolio renewal is linked to the key 2010 operational milestones:
• Expect to launch first Symbian^3 device in Q2 and ship it in Q3 2010
• Planned introduction of Symbian^4 based products shifted to 2011
• We continue to expect to achieve our product milestone for our first MeeGo device by the end of this year
Mobile Device Shipments
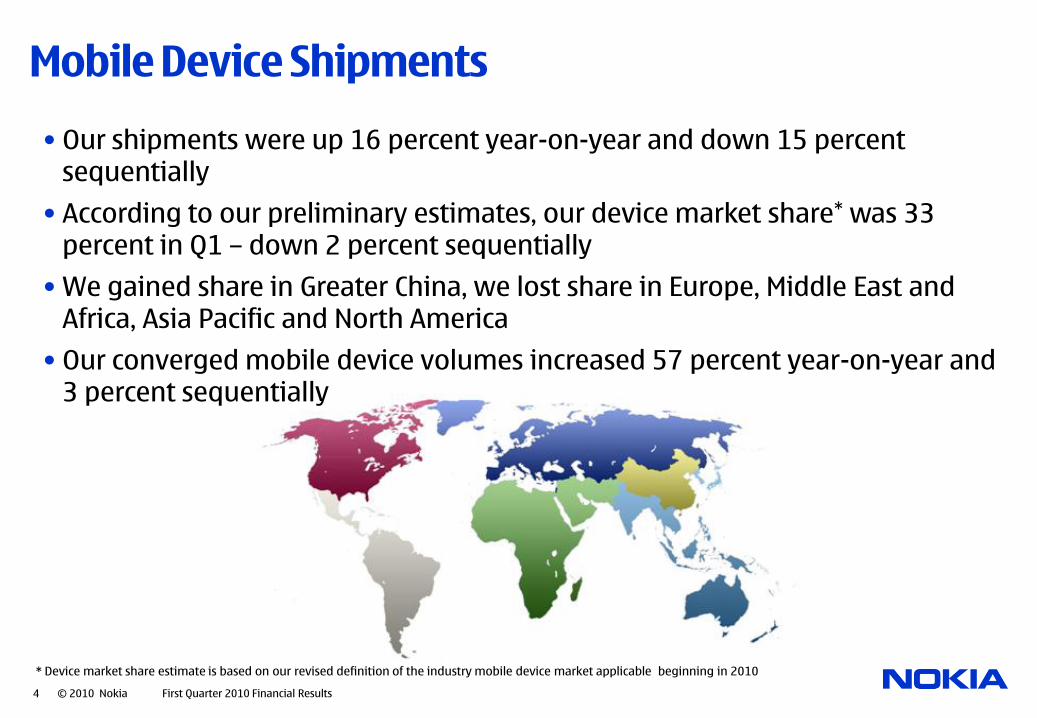
• Our shipments were up 16 percent year-on-year and down 15 percent sequentially
• According to our preliminary estimates, our device market share* was 33 percent in Q1 – down 2 percent sequentially
• We gained share in Greater China, we lost share in Europe, Middle East and Africa, Asia Pacific and North America
• Our converged mobile device volumes increased 57 percent year-on-year and 3 percent sequentially
4 © 2010 Nokia First Quarter 2010 Financial Results
* Device market share estimate is based on our revised definition of the industry mobile device market applicable beginning in 2010
5 © 2010 Nokia First Quarter 2010 Financial Results
Devices & Services in 1Q 2010: Highlights
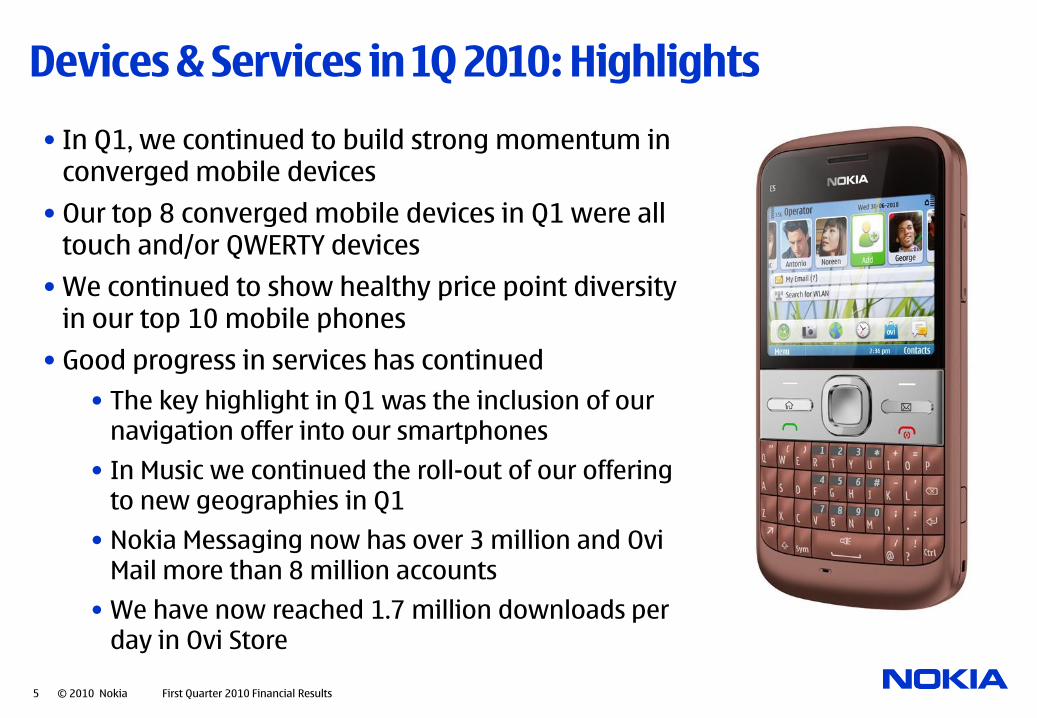
• In Q1, we continued to build strong momentum in converged mobile devices
• Our top 8 converged mobile devices in Q1 were all touch and/or QWERTY devices
• We continued to show healthy price point diversity in our top 10 mobile phones
• Good progress in services has continued
• The key highlight in Q1 was the inclusion of our navigation offer into our smartphones
• In Music we continued the roll-out of our offering to new geographies in Q1
• Nokia Messaging now has over 3 million and OviMail more than 8 million accounts
• We have now reached 1.7 million downloads per day in Ovi Store
Nokia Siemens Networks in 1Q 2010: Highlights
6 © 2010 Nokia First Quarter 2010 Financial Results
• NSN delivered positive operating profit on a non-IFRS basis in Q1
• NSN continues to generate momentum in key areas:
• 3 new LTE deals in Q1 lift NSN’s LTE references to 10 - the highest in the industry
• Good progress also in 3G - NSN is well-positioned for the rollout of 3G in India
• NSN signed 14 new Managed Services contracts in Q1
• Indications that NSN is stabilizing its business and is now building the foundations for future growth

Nokia Financial Highlights 1Q 2010
EUR (million)Devices &
ServicesNAVTEQ
Nokia
Siemens
Networks
Reported
Nokia
1Q10
Devices &
ServicesNAVTEQ
Nokia
Siemens
Networks
Non-IFRS
Nokia
1Q10
Net sales 6 663 189 2 718 9 522 6 663 189 2 718 9 522
YoY growth 8% 43% -9% 3% 8% 41% -9% 3%
Gross profit 2 156 160 782 3 078 2 156 160 853 3 149
Gross margin, % 32.4% 84.7% 28.8% 32.3% 32.4% 84.7% 31.4% 33.1%
R&D -724 -165 -544 -1 433 -722 -77 -481 -1 280
% of net sales 10.9% 87.3% 20.0% 15.0% 10.8% 40.7% 17.7% 13.4%
S&M -547 -57 -329 -934 -547 -27 -250 -825
% of net sales 8.2% 30.2% 12.1% 9.8% 8.2% 14.3% 9.2% 8.7%
AG&O -54 -15 -135 -223 -83 -15 -107 -224
% of net sales 0.8% 7.9% 5.0% 2.3% 1.2% 7.9% 3.9% 2.4%
Operating profit 831 -77 -226 488 804 41 15 820
Operating margin, % 12.5% -40.7% -8.3% 5.1% 12.1% 21.7% 0.6% 8.6%
Financial income and expenses -73 -73
Profit before tax 411 743
Profit attributable to equity holders of the parent 349 516
EPS, Basic (EUR) 0.09 0.14
EPS, Diluted (EUR) 0.09 0.14
7 © 2010 Nokia First Quarter 2010 Financial Results

Financial Position & Cash Flow Metrics in 1Q 2010
EUR (million) 1Q 2010 1Q 2009 YoY 4Q 2009 QoQ
Inventories 2 020 2 292 -12% 1 865 8%
Accounts Receivable 7 562 8 931 -15% 7 981 -5%
Accounts Payable 4 790 5 223 -8% 4 950 -3%
Operating Cash Flow 955 276 246% 1 534 -38%
Capital Expenditure 114 144 -21% 147 -22%
Depreciation 437 462 -5% 451 -3%
Cash and Other liquid assets 9 701 8 114 20% 8 873 9%
Gearing (Net-Debt ratio) -31% -14% -25%
Distributions 0 0 0
Dividends 0 0 0
Buybacks 0 0 0
8 © 2010 Nokia First Quarter 2010 Financial Results

2Q 2010 and 2010 Guidance
• Devices & Services net sales in 2Q 2010 expected to be between 6.7 and 7.2 billion Euros (new)
• Devices & Services non-IFRS operating margin expected to be in the range of 9% to 12% in Q2 2010 (new)
• Devices & Services non-IFRS OPEX target of approximately 5.7 billion for 2010 (confirmation)
• Devices & Services non-IFRS operating margin targeted to be in the range of 11% to 13% in 2010 (update)
• Nokia Siemens Networks’ net sales expected to be between 3.1 and 3.4 billion Euros in 2Q 2010 (new)
• Nokia Siemens Networks’ non-IFRS operating margin expected to be in the range of 0% to 3% in 2Q 2010 (new)
• Nokia Siemens Networks’ non-IFRS operating margin in targeted to be in the range of 0% to 2% in 2010 (confirmation)
• See total guidance in the press release issued today
Devices & Services
Nokia Siemens
Networks
9 © 2010 Nokia First Quarter 2010 Financial Results

Moving Forward
10 © 2010 Nokia First Quarter 2010 Financial Results
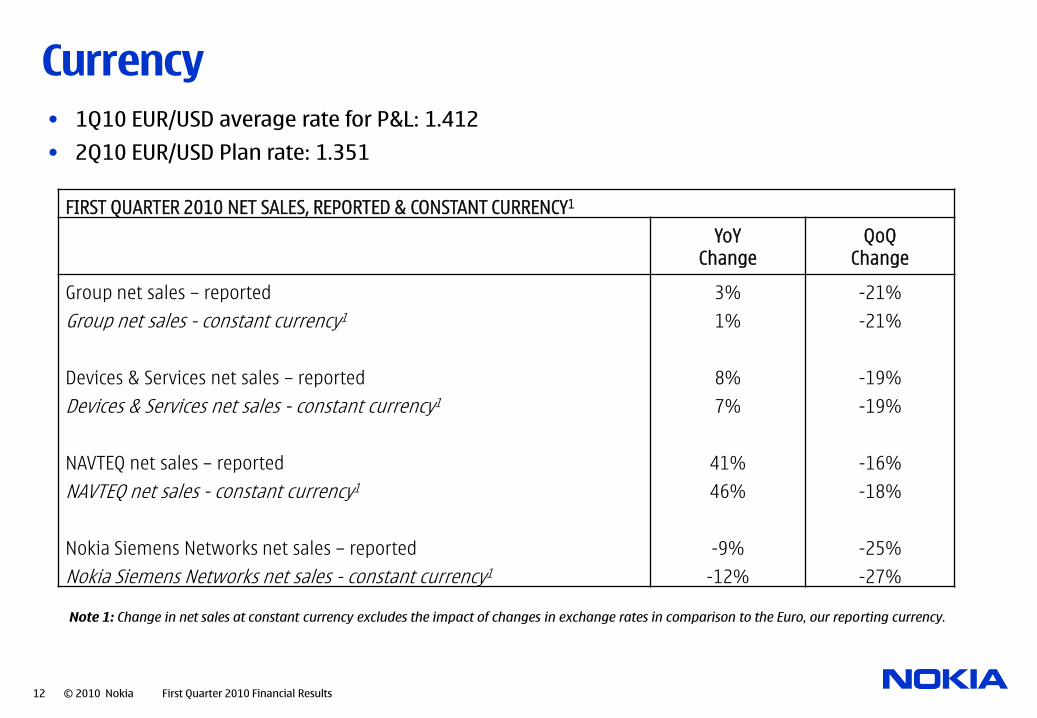
Currency• 1Q10 EUR/USD average rate for P&L: 1.412
• 2Q10 EUR/USD Plan rate: 1.351
Note 1: Change in net sales at constant currency excludes the impact of changes in exchange rates in comparison to the Euro, our reporting currency.
FIRST QUARTER 2010 NET SALES, REPORTED & CONSTANT CURRENCY1
YoYChange
QoQChange
Group net sales – reported 3% -21%
Group net sales - constant currency1 1% -21%
Devices & Services net sales – reported 8% -19%
Devices & Services net sales - constant currency1 7% -19%
NAVTEQ net sales – reported 41% -16%
NAVTEQ net sales - constant currency1 46% -18%
Nokia Siemens Networks net sales – reported -9% -25%
Nokia Siemens Networks net sales - constant currency1 -12% -27%
12 © 2010 Nokia First Quarter 2010 Financial Results