Conference Call – Q3/19 Results · Q3/19 Highlights • Strong organic sales growth across all...
50
Conference Call – Q3/19 Results Bad Homburg, 29 October 2019 Frankfurt stock exchange: FRE │ US ADR program: FSNUY │ www.fresenius.com/investors
Transcript of Conference Call – Q3/19 Results · Q3/19 Highlights • Strong organic sales growth across all...

Conference Call – Q3/19 Results
Bad Homburg, 29 October 2019
Frankfurt stock exchange: FRE │ US ADR program: FSNUY │ www.fresenius.com/investors

Safe Harbor Statement
This presentation contains forward-looking statements that are subject to various
risks and uncertainties. Future results could differ materially from those described
in these forward-looking statements due to certain factors, e.g. changes in
business, economic and competitive conditions, regulatory reforms, results of
clinical trials, foreign exchange rate fluctuations, uncertainties in litigation or
investigative proceedings, and the availability of financing. Fresenius does not
undertake any responsibility to update the forward-looking statements contained
in this presentation.
Q3/19 Results, 29 October 2019 © Fresenius SE & Co. KGaA Investor Relations 2

Q3/19 Highlights
• Strong organic sales growth across all business segments
• Growth investments proceeding according to plan
• Fresenius Kabi: excellent growth in Emerging Markets partially
offsets softer development in North America
• Fresenius Helios showing excellent organic sales growth
across all regions
• Fresenius Vamed: integration of post-acute care business from
Helios completed
• Fresenius Medical Care: record growth in home dialysis in
North America
• Group guidance confirmed
Q3/19 Results, 29 October 2019 © Fresenius SE & Co. KGaA Investor Relations 3

Fresenius Kabi: Update
North America
• Increased competition for certain molecules
• The opioid market has not recovered as anticipated
• 31 Kabi-marketed IV drugs currently designated in shortage (vs. 36 at Q2/19)
• Low to mid-single-digit price erosion in our base product portfolio
• Product launches: with 12 YTD, on track to meet expectation of 15+ for the FY
Q3/19 Results, 29 October 2019 © Fresenius SE & Co. KGaA Investor Relations 4
Transfusion Medicine and Cell
Therapies business
• Business remains important part ofFresenius Kabi
• Divisionalization paves the way for furtherprofitable growth going forward
Biosimilars
• Roll-out of Idacio® in additional4 European countries in Q3/19 (9 in total)

Fresenius Helios: Update
Helios Germany
Investment initiatives
• Employer of choice: Continued to attract meaningful number of nurses in Q3/19
• Vacant chief doctor positions now re-filled
• Good progress with transformation of MVZs (“outpatient centers”) within new business line Outpatient Services
DRG inflator
• Ongoing favorable reimbursement environment
• 2020 DRG inflator set at 3.66%
• Final price increase will be lower as it is subject to negotiations at the state level and individual hospital discounts
Q3/19 Results, 29 October 2019 © Fresenius SE & Co. KGaA Investor Relations 5
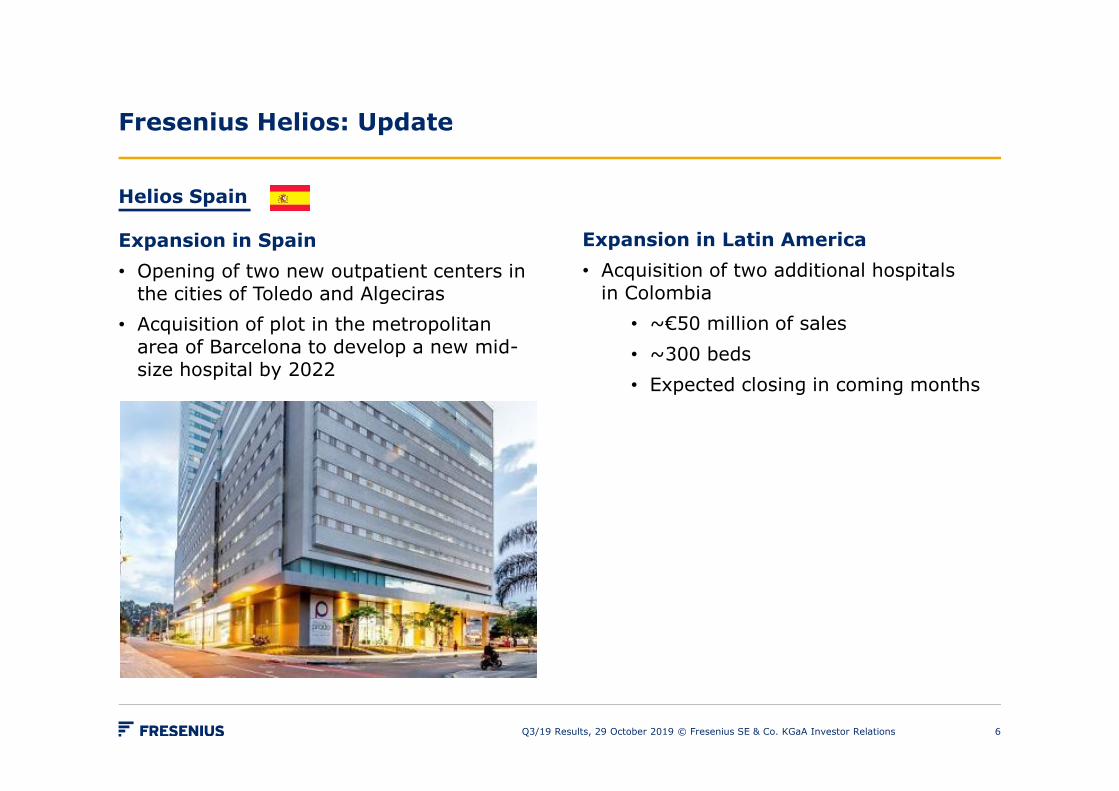
Fresenius Helios: Update
Helios Spain
Expansion in Spain
• Opening of two new outpatient centers in the cities of Toledo and Algeciras
• Acquisition of plot in the metropolitan area of Barcelona to develop a new mid-size hospital by 2022
Q3/19 Results, 29 October 2019 © Fresenius SE & Co. KGaA Investor Relations 6
Expansion in Latin America
• Acquisition of two additional hospitals in Colombia
• ~€50 million of sales
• ~300 beds
• Expected closing in coming months

Financial Review Q3/19
Q3/19 Results, 29 October 2019 © Fresenius SE & Co. KGaA Investor Relations 7

Fresenius Group: Q3/19 Key Financials
Q3/19 Results, 29 October 2019 © Fresenius SE & Co. KGaA Investor Relations
€m Q3/191 IFRS 16effect
specialitems
Q3/19 reported
Δ YoY cc1,2
Sales 8,877 -35 - 8,842 6%
EBIT 1,130 23 -24 1,129 -1%
Net interest -124 -47 -1 -172 15%
Income taxes -232 5 25 -202 -10%
Net income3 453 -8 -1 444 0%
Balance sheet total 61,092 5,667 - 66,759
Operating Cashflow 1,298 185 - 1,483
1 Before special items, adjusted for IFRS 16 effect2 On a comparable basis: Q3/18 adjusted for divestitures of Care Coordination activities at FMC, before special items3 Net income attributable to shareholders of Fresenius SE & Co. KGaA
For a detailed overview of special items and adjustments please see the reconciliation tables on slides 26-49.
8

1 On a comparable basis: Q3/18 adjusted for divestitures of Care Coordination activities at FMC; Q3/19 adjusted for IFRS 16 effect.
All figures before special itemsFor a detailed overview of special items and adjustments please see the reconciliation tables on slides 26-49.
Fresenius Group: Q3/19 Business Segment Growth
Organic sales growth1
Q3/19 Results, 29 October 2019 © Fresenius SE & Co. KGaA Investor Relations
EBIT growth (cc)1
+5%
+5%
+6%
+17%
-3%
+1%
-10%
+10%
+5% -1%
9

Fresenius Kabi: Q3/19 Regional Highlights (1/2)
Q3/19 Results, 29 October 2019 © Fresenius SE & Co. KGaA Investor Relations
North America
• -4% organic growth
• Increasingly intense competitive environment for certain molecules
• Further easing of shortage tailwinds
• FY/19 outlook change: Slight organic sales decline (before: Low single-digit organic sales growth)
Europe
• 4% organic growth
• Strong growth of enteral nutrition business
• Confirm FY/19 outlook: Low to mid-single-digit organic sales growth
10

Fresenius Kabi: Q3/19 Regional Highlights (2/2)
Emerging Markets
China:
• 18% organic sales growth
• Continued positive momentum
Asia-Pacific ex China:
• 19% organic sales growth
Latin America/Africa:
• 16% organic sales growth
Q3/19 Results, 29 October 2019 © Fresenius SE & Co. KGaA Investor Relations
Total Emerging Markets
Confirm FY/19 outlook: Clearly double-digit organic sales growth
11

Fresenius Kabi: Q3 & Q1-3/19 EBIT Growth
Q3/19 Results, 29 October 2019 © Fresenius SE & Co. KGaA Investor Relations
€m Q3/19 Δ YoY cc Q1-3/19 Δ YoY cc
North AmericaMargin
22536.3%
-8%-180 bps
70338.7%
-2%20 bps
EuropeMargin
7513.3%
-11%-230 bps
24114.1%
-6%-150 bps
Asia-Pacific/Latin America/AfricaMargin
135
23.4%
34%
330 bps
352
21.6%
24%
200 bps
Corporate and Corporate R&D -129 -3% -379 -2%
Total EBIT1
Margin1
30617.4%
1%-60 bps
91717.8%
4%20 bps
1 On a comparable basis: before special items and adjusted for IFRS 16 effects
Margin growth at actual ratesFor a detailed overview of special items and adjustments please see the reconciliation tables on slides 26-49.
12

1 Organic sales growth
Fresenius Helios: Q3/19 Highlights
Helios Germany
• Strong organic sales growth of 5%; positive admissions development
• Sales growth supported by reclassification of nursing staff funding from other income to sales (low double-digit € million amount)
• EBIT impacted by ongoing investments in measures to counter regulatory headwinds
Helios Spain
• Healthy organic sales growth of 9%; decline in admissions during hot summer months not as pronounced as in prior year
• EBIT development impacted by costs for temporary workers
Sales
€m
Q3/19 Results, 29 October 2019 © Fresenius SE & Co. KGaA Investor Relations
1,410 1,474
678 757
Q3/18 Q3/19
Helios SpainHelios Germany
+6%1
2,2302,088
13
4,531 4,465
2,231 2,425
Q1-3/18 Q1-3/19
+5%1
6,8906,762

Fresenius Helios: Q3 & Q1-3/19 Key Financials
Q3/19 Results, 29 October 2019 © Fresenius SE & Co. KGaA Investor Relations
€m Q3/19 Δ YoY Q1-3/19 Δ YoY
Total sales 2,230 7% 6,890 2%/5%1
Thereof Helios Germany 1,474 5% 4,465 -1%/4%1
Thereof Helios Spain 757 12% 2,425 9%
Total EBIT2
Margin
183
8.2%
-10%
-160 bps
723
10.5%
-7%/-5%1
-100 bps
Thereof Helios Germany
Margin
130
8.8%
-9%
-130 bps
433
9.7%
-11%/-9%1
-110 bps
Thereof Helios Spain
Margin
56
7.4%
-5%
-130 bps
300
12.4%
5%
-40 bps
Thereof Corporate -3 -- -10 --
1 Adjusted for the post-acute care business transferred to Fresenius Vamed as of July 1, 20182 Adjusted for IFRS 16 effect
14

Fresenius Vamed
1 Without German post-acute care business acquired from Fresenius Helios as of July 1, 2018
2 Adjusted for IFRS 16 effect 3 Project business only4 Versus December 31, 2018
• Strong Q3/19 with 17% organic sales growth
• Both, service business and project
business contributed to strong growth in
Q3/19
€m Q3/19 Δ YoY Q1-3/19 Δ YoY
Total sales
Thereof organic sales
562 18%
17%
1,469 48%
24%1
Service business 349 11% 1,025 60%
29%1
Project business 213 32% 444 26%
Total EBIT2 34 10% 65 33%
0%1
Order intake3 240 114% 738 30%
Order backlog3 2,711 12%4
Q3/19 Results, 29 October 2019 © Fresenius SE & Co. KGaA Investor Relations 15

Fresenius Group: Cash Flow
Operating CF1 Capex (net) Free Cash Flow1,2
€m Q3/19 LTM Margin Q3/19 LTM Margin Q3/19 LTM Margin
362 13.4% -179 -10.0% 183 3.4%
183 7.0% -90 -4.7% 93 2.3%3
27 3.2% -10 -1.6% 17 1.6%
Corporate/Other 11 n.a. -13 n.a. -2 n.a.
583 9.5%4 -292 -6.9% 291 2.6%4
1,298 10.4% -576 -6.6% 722 3.8%
1 Adjusted for IFRS 16 effect2 Before acquisitions and dividends3 Understated: 2.6% excluding €27 million of capex commitments from acquisitions 4 Margin incl. FMC dividend
Excl. FMC
Q3/19 Results, 29 October 2019 © Fresenius SE & Co. KGaA Investor Relations 16

€m (except otherwise stated)
FY/18 Base
Q1-3/19Actual1 FY/19e1
FY/191
New
Sales growth (org) 6,544 4% 3% - 6%
EBIT growth (cc) 1,1392 4% 3% - 6%
Sales growth (org) 8,993 5% 2% - 5%
EBIT growth 1,052 -7% -5% to -2%
Sales growth (org) 1,688 24% ~10%
EBIT growth 110 33% 15% - 20%
1 Excluding transaction-related expenses, revaluations of biosimilars contingent liabilities, adjusted for IFRS 16 effect2 Before special items
For a detailed overview of adjustments and special items please see the reconciliation tables on slides 26-49.
Fresenius Group: 2019 Financial Outlook by Business Segment
Q3/19 Results, 29 October 2019 © Fresenius SE & Co. KGaA Investor Relations 17

€m(except otherwise stated)
FY/18Base1
Q1-3/19Actual2 FY/19e2
FY/19e2
New
Sales growth
(cc)
33,009 6% 4% - 7%
Net income3
growth (cc)
1,872 0% ~0%
Fresenius Group: 2019 Financial Guidance
1 Before special items and after adjustments2 Excluding transaction-related expenses, revaluations of biosimilars contingent liabilities, gain related to divestitures of care coordination activities, expenses associated with the cost
optimization program at FMC, including operating results of NxStage, adjusted for IFRS 16 effect3 Net income attributable to shareholders of Fresenius SE & Co. KGaA
For a detailed overview of adjustments and special items please see the reconciliation tables on slides 26-49.
Q3/19 Results, 29 October 2019 © Fresenius SE & Co. KGaA Investor Relations 18
Attachments
Q3/19 Results, 29 October 2019 © Fresenius SE & Co. KGaA Investor Relations 19

Fresenius Group: Noncontrolling Interest
Q3/19 Results, 29 October 2019 © Fresenius SE & Co. KGaA Investor Relations
€m Q1-3/19 Q1-3/18
Earnings before tax and noncontrolling interest 2,943 2,877
Taxes -680 -629
Noncontrolling interest, thereof -865 -880
Fresenius Medical Care net income not attributable to
Fresenius SE & Co. KGaA (FY/18: ~69%)-629 -654
Noncontrolling interest holders in Fresenius Medical Care -177 -177
Noncontrolling interest holders in Fresenius Kabi (-€38 m),
Fresenius Helios (-€10 m), Fresenius Vamed’s 23% external
ownership (-€10 m) and due to Corporate (-€1 m)
-59 -49
Net income attributable to Fresenius SE & Co. KGaA 1,398 1,368
All figures before special itemsOn a comparable basis: adjusted for IFRS16 effect; Q1-3/18 adjusted for divestitures of Care Coordination activities at FMCFor a detailed overview of special items please see the reconciliation tables on slides 26-49.
20

Fresenius Group: Cash Flow
Q3/19 Results, 29 October 2019 © Fresenius SE & Co. KGaA Investor Relations
€m Q3/19 LTM Margin Δ YoY
Operating Cash Flow1 1,298 10.4% 0%
Capex (net) -576 -6.6% -10%
Free Cash Flow1
(before acquisitions and dividends)
722 3.8% -6%
Acquisitions (net) -104 -6.7% 78%
Dividends -71 -2.7% -20%
Free Cash Flow1
(after acquisitions and dividends)
547 -5.6% 138%
21
1 Adjusted for IFRS 16 effect

2.67
2.55 2.53
3.22
2.65
2.33
2.84
2.98
2.802.75
2.71
3.09
3.213.13
2,00
2,50
3,00
3,50
4,00
2011 2012 2013 2014 2015 2016 2017 Q1 Q2 Q3 Q4 Q1 Q2 Q3
Before special items; pro forma closed acquisitions/divestituresAt LTM average FX rates for both EBITDA and net debt
1 Pro forma excluding advances made for the acquisition of hospitals from Rhön-Klinikum AG2 Including acquisition of NxStage; adjusted for IFRS 16 effects3 Calculated at expected annual average exchange rates, for both net debt and EBITDA; including acquisition of NxStage;
without potential unannounced acquisitions; adjusted for IFRS 16 effects (comparable to updated guidance from May 2, 2019)
Fresenius Group: Leverage Ratio
Q3/19 Results, 29 October 2019 © Fresenius SE & Co. KGaA Investor Relations
Net Debt/EBITDA target 2019
Around the upper-end of self-imposed target
corridor of 2.5 – 3.0 x3
1
4.0
3.5
3.0
2.5
2018
2
2019
22
22

Fresenius Kabi: Organic Sales Growth by Regions
Q3/19 Results, 29 October 2019 © Fresenius SE & Co. KGaA Investor Relations 23
€m Q3/19Δ YoY
organic Q1-3/19Δ YoY
organic
North America 619 -4% 1,815 -3%
Europe 564 4% 1,709 3%
Asia-Pacific/Latin
America/Africa
578 17% 1,629 15%
Asia-Pacific 406 18% 1,121 15%
Latin America/Africa 172 16% 508 16%
Total sales 1,761 5% 5,153 4%

Fresenius Kabi: Organic Sales Growth by Product Segment
24Q3/19 Results, 29 October 2019 © Fresenius SE & Co. KGaA Investor Relations
€m Q3/19Δ YoY
organic Q1-3/19Δ YoY
organic
IV Drugs 746 -2% 2,202 -1%
Infusion Therapy 208 7% 621 3%
Clinical Nutrition 492 10% 1,416 9%
Medical Devices/
Transfusion Technology
315 14% 914 11%
Total sales 1,761 5% 5,153 4%

Fresenius Helios: Key Metrics
Q3/19 Results, 29 October 2019 © Fresenius SE & Co. KGaA Investor Relations
Q1-3/19 FY/18 Δ
No. of hospitals Helios Germany
- Acute care hospitals
86
83
86
83
0%
0%
No. of hospitals Helios Spain
(Hospitals)
50 47 6%
No. of beds Helios Germany
- Acute care hospitals
28,934
28,407
29,329
28,802
-1%
-1%
No. of beds Helios Spain
(Hospitals)
7,126 7,019 2%
Admissions Helios Germany
(acute care)
908,341 1,218,199
Admissions Helios Spain
(including outpatients)
10,476,730 13,318,066
25

Fresenius Group: Reconciliation
Q3/19 Results, 29 October 2019 © Fresenius SE & Co. KGaA Investor Relations
€m Q3/19 Q3/18 growthrate
growthrate (cc)
Sales reported 8,842 8,192 8% 6%
Divestitures of Care Coordination activities at FMC - -7
IFRS 16 effect 35 -
Sales on a comparable basis 8,877 8,185 8% 6%
EBIT reported (after special items) 1,129 1,041 8% 6%
Transaction costs Akorn 0 6
Bridge Financing costs Akorn - 0
Revaluations of biosimilars contingent liabilities 0 -
Gain related to divestitures of Care Coordination activities -3 -10
Transaction costs NxStage 2 -
Expenses associated with the cost optimization program at FMC 25 -
Impact of FCPA related charge - 75
EBIT (before special items) 1,153 1,112 4% 1%
Divestitures of Care Coordination activities at FMC - 0
IFRS 16 effect -23 -
EBIT on a comparable basis 1,130 1,112 2% -1%
26

Fresenius Group: Reconciliation
Q3/19 Results, 29 October 2019 © Fresenius SE & Co. KGaA Investor Relations
€m Q3/19 Q3/18 growthrate
growthrate (cc)
Net interest reported (after special items) -172 -146 -18% -15%
Bridge Financing costs Akorn - 5
Revaluations of biosimilars contingent liabilities 1 -
Net interest (before special items) -171 -141 -21% -18%
Divestitures of Care Coordination activities at FMC - 0
IFRS 16 effect 47 -
Net interest on a comparable basis -124 -141 12% 15%
27

Fresenius Group: Reconciliation
Q3/19 Results, 29 October 2019 © Fresenius SE & Co. KGaA Investor Relations
€m Q3/19 Q3/18 growthrate
growthrate (cc)
Income taxes reported (after special items) -202 -196 -3% -1%
Transaction costs Akorn 0 -1
Bridge Financing costs Akorn - -2
Revaluations of biosimilars contingent liabilities 0 -
Gain related to divestitures of Care Coordination activities -17 -7
Transaction costs NxStage -1 -
Expenses associated with the cost optimization program at FMC -7 -
Income taxes (before special items) -227 -206 -10% -7%
Divestitures of Care Coordination activities at FMC - -1
IFRS 16 effect -5 -
Income taxes on a comparable basis -232 -207 -12% -10%
Noncontrolling interest reported (after special items) -311 -280 -11% -7%
Gain related to divestitures of Care Coordination activities 14 12
Transaction costs NxStage 0 -
Expenses associated with the cost optimization program at FMC -13 -
Impact of FCPA related charge - -52
Noncontrolling interest (before special items) -310 -320 3% 7%
Divestitures of Care Coordination activities at FMC - 0
IFRS 16 effect -11 -
Noncontrolling interest on a comparable basis -321 -320 0% 3%
28

Fresenius Group: Reconciliation
Q3/19 Results, 29 October 2019 © Fresenius SE & Co. KGaA Investor Relations
€m Q3/19 Q3/18 growthrate
growthrate (cc)
Net income reported (after special items) 444 419 6% 4%
Transaction costs Akorn 0 5
Bridge Financing costs Akorn - 3
Revaluations of biosimilars contingent liabilities 1 -
Gain related to divestitures of Care Coordination activities -6 -5
Transaction costs NxStage 1 -
Expenses associated with the cost optimization program at FMC 5 -
Impact of FCPA related charge - 23
Net income (before special items) 445 445 0% -2%
Divestitures of Care Coordination activities at FMC - -1
IFRS 16 effect 8 -
Net income on a comparable basis 453 444 2% 0%
29

Fresenius Group: Reconciliation
Q3/19 Results, 29 October 2019 © Fresenius SE & Co. KGaA Investor Relations
€m Q1-3/19 Q1-3/18 growthrate
growthrate (cc)
Sales reported 26,098 24,695 6% 3%
Divestitures of Care Coordination activities at FMC - -516
IFRS 16 effect 75 -
Sales on a comparable basis 26,173 24,179 8% 6%
EBIT reported (after special items) 3,362 4,020 -16% -19%
Transaction costs Akorn 3 45
Bridge Financing costs Akorn - 1
Revaluations of biosimilars contingent liabilities -4 -
Gain related to divestitures of Care Coordination activities -14 -830
Transaction costs NxStage 22 -
Expenses associated with the cost optimization program at FMC 32 -
Impact of FCPA related charge - 75
EBIT (before special items) 3,401 3,311 3% 0%
Divestitures of Care Coordination activities at FMC - -14
IFRS 16 effect -79 -
EBIT on a comparable basis 3,322 3,297 1% -2%
30

Fresenius Group: Reconciliation
Q3/19 Results, 29 October 2019 © Fresenius SE & Co. KGaA Investor Relations
€m Q1-3/19 Q1-3/18 growthrate
growthrate (cc)
Net interest reported (after special items) -535 -453 -18% -15%
Bridge Financing costs Akorn - 12
Revaluations of biosimilars contingent liabilities 3 -
Net interest (before special items) -532 -441 -21% -17%
Divestitures of Care Coordination activities at FMC - 21
IFRS 16 effect 153 -
Net interest on a comparable basis -379 -420 10% 12%
31

Fresenius Group: Reconciliation
Q3/19 Results, 29 October 2019 © Fresenius SE & Co. KGaA Investor Relations
€m Q1-3/19 Q1-3/18 growthrate
growthrate (cc)
Income taxes reported (after special items) -632 -754 16% 19%
Transaction costs Akorn 0 -9
Bridge Financing costs Akorn - -4
Revaluations of biosimilars contingent liabilities 0 -
Gain related to divestitures of Care Coordination activities -15 140
Transaction costs NxStage -6 -
Expenses associated with the cost optimization program at FMC -9 -
Income taxes (before special items) -662 -627 -6% -2%
Divestitures of Care Coordination activities at FMC - -2
IFRS 16 effect -18 -
Income taxes on a comparable basis -680 -629 -8% -5%
Noncontrolling interest reported (after special items) -827 -1,302 36% 39%
Gain related to divestitures of Care Coordination activities 20 478
Transaction costs NxStage -11 -
Expenses associated with the cost optimization program at FMC -16 -
Impact of FCPA related charge - -52
Noncontrolling interest (before special items) -834 -876 5% 9%
Divestitures of Care Coordination activities at FMC - -4
IFRS 16 effect -31 -
Noncontrolling interest on a comparable basis -865 -880 2% 6%
32

Fresenius Group: Reconciliation
Q3/19 Results, 29 October 2019 © Fresenius SE & Co. KGaA Investor Relations
€m Q1-3/19 Q1-3/18 growthrate
growthrate (cc)
Net income reported (after special items) 1,368 1,511 -9% -12%
Transaction costs Akorn 3 36
Bridge Financing costs Akorn - 9
Revaluations of biosimilars contingent liabilities -1 -
Gain related to divestitures of Care Coordination activities -9 -212
Transaction costs NxStage 5 -
Expenses associated with the cost optimization program at FMC 7 -
Impact of FCPA related charge - 23
Net income (before special items) 1,373 1,367 0% -2%
Divestitures of Care Coordination activities at FMC - 1
IFRS 16 effect 25 -
Net income on a comparable basis 1,398 1,368 2% 0%
33

Reconciliation according to Fresenius Medical Care
Q3/19 Results, 29 October 2019 © Fresenius SE & Co. KGaA Investor Relations
€m Q3/19 Q3/18 growthrate
growthrate (cc)
Sales reported 4,419 4,058 9% 6%
Divestitures of Care Coordination activities - -7
IFRS 16 effect 35 -
NxStage operations -79 -
Sales adjusted 4,375 4,051 8% 5%
EBIT reported 595 527 13% 9%
Gain related to divestitures of Care Coordination activities -2 -10
Divestitures of Care Coordination activities - 0
IFRS 16 effect -21 -
NxStage operations 0 -
Transaction costs NxStage 2 -
Expenses associated with the cost optimization program 25 -
Impact of FCPA related charge - 75
EBIT adjusted 599 592 1% -3%
34

Reconciliation according to Fresenius Medical Care
Q3/19 Results, 29 October 2019 © Fresenius SE & Co. KGaA Investor Relations
€mQ3/19 Q3/18 growth
rategrowth
rate (cc)
Net income reported 333 285 17% 12%
Gain related to divestitures of Care Coordination activities -20 -17
Divestitures of Care Coordination activities - 0
IFRS 16 effect 16 -
NxStage operations 15 -
Transaction costs NxStage 1 -
Expenses associated with the cost optimization program 18 -
Impact of FCPA related charge - 75
Net income adjusted 363 343 6% 2%
35

Reconciliation according to Fresenius Medical Care
Q3/19 Results, 29 October 2019 © Fresenius SE & Co. KGaA Investor Relations
€m Q1-3/19 Q1-3/18 growthrate
growthrate (cc)
Sales reported 12,897 12,247 5% 1%
Divestitures of Care Coordination activities - -516
IFRS 16 effect 75 -
NxStage operations -188 -
Sales adjusted 12,784 11,731 9% 5%
EBIT reported 1,653 2,425 -32% -35%
Gain related to divestitures of Care Coordination activities -14 -830
Divestitures of Care Coordination activities - -14
IFRS 16 effect -68 -
NxStage operations 16 -
Transaction costs NxStage 22 -
Expenses associated with the cost optimization program 32 -
Impact of FCPA related charge - 75
EBIT adjusted 1,641 1,656 -1% -5%
36

Reconciliation according to Fresenius Medical Care
Q3/19 Results, 29 October 2019 © Fresenius SE & Co. KGaA Investor Relations
€m Q1-3/19 Q1-3/18 growthrate
growthrate (cc)
Net income reported 857 1,557 -45% -47%
Gain related to divestitures of Care Coordination activities -29 -690
Divestitures of Care Coordination activities - 4
IFRS 16 effect 45 -
NxStage operations 49 -
Transaction costs NxStage 16 -
Expenses associated with the cost optimization program 23 -
Impact of FCPA related charge - 75
Net income adjusted 961 946 2% -3%
37

Reconciliation Fresenius Medical Care
according to Fresenius Group
Q3/19 Results, 29 October 2019 © Fresenius SE & Co. KGaA Investor Relations
€m Q3/19 Q3/18 growthrate
growthrate (cc)
Sales reported 4,419 4,058 9% 6%
Divestitures of Care Coordination activities - -7
IFRS 16 effect 35 -
Sales on a comparable basis 4,454 4,051 10% 7%
EBIT reported (after special items) 595 527 13% 9%
Gain related to divestitures of Care Coordination activities -3 -10
Transaction costs NxStage 2 -
Expenses associated with the cost optimization program 25 -
Impact of FCPA related charge - 75
EBIT (before special items) 619 592 5% 1%
Divestitures of Care Coordination activities - 0
IFRS 16 effect -20 -
EBIT on a comparable basis 599 592 1% -3%
38

Reconciliation Fresenius Medical Care
according to Fresenius Group
Q3/19 Results, 29 October 2019 © Fresenius SE & Co. KGaA Investor Relations
€m Q3/19 Q3/18 growthrate
growthrate (cc)
Net income reported (after special items) 332 284 17% 12%
Gain related to divestitures of Care Coordination activities -20 -16
Transaction costs NxStage 1 -
Expenses associated with the cost optimization program 18 -
Impact of FCPA related charge - 75
Net income (before special items) 331 343 -3% -7%
Divestitures of Care Coordination activities - -1
IFRS 16 effect 17 -
Net income on a comparable basis 348 342 2% -2%
39

Reconciliation Fresenius Medical Care
according to Fresenius Group
Q3/19 Results, 29 October 2019 © Fresenius SE & Co. KGaA Investor Relations
€m Q1-3/19 Q1-3/18 growthrate
growthrate (cc)
Sales reported 12,897 12,247 5% 1%
Divestitures of Care Coordination activities - -516
IFRS 16 effect 75 -
Sales on a comparable basis 12,972 11,731 11% 7%
EBIT reported (after special items) 1,653 2,425 -32% -35%
Gain related to divestitures of Care Coordination activities -14 -830
Transaction costs NxStage 22 -
Expenses associated with the cost optimization program 32 -
Impact of FCPA related charge - 75
EBIT (before special items) 1,693 1,670 1% -3%
Divestitures of Care Coordination activities - -14
IFRS 16 effect -68 -
EBIT on a comparable basis 1,625 1,656 -2% -6%
40
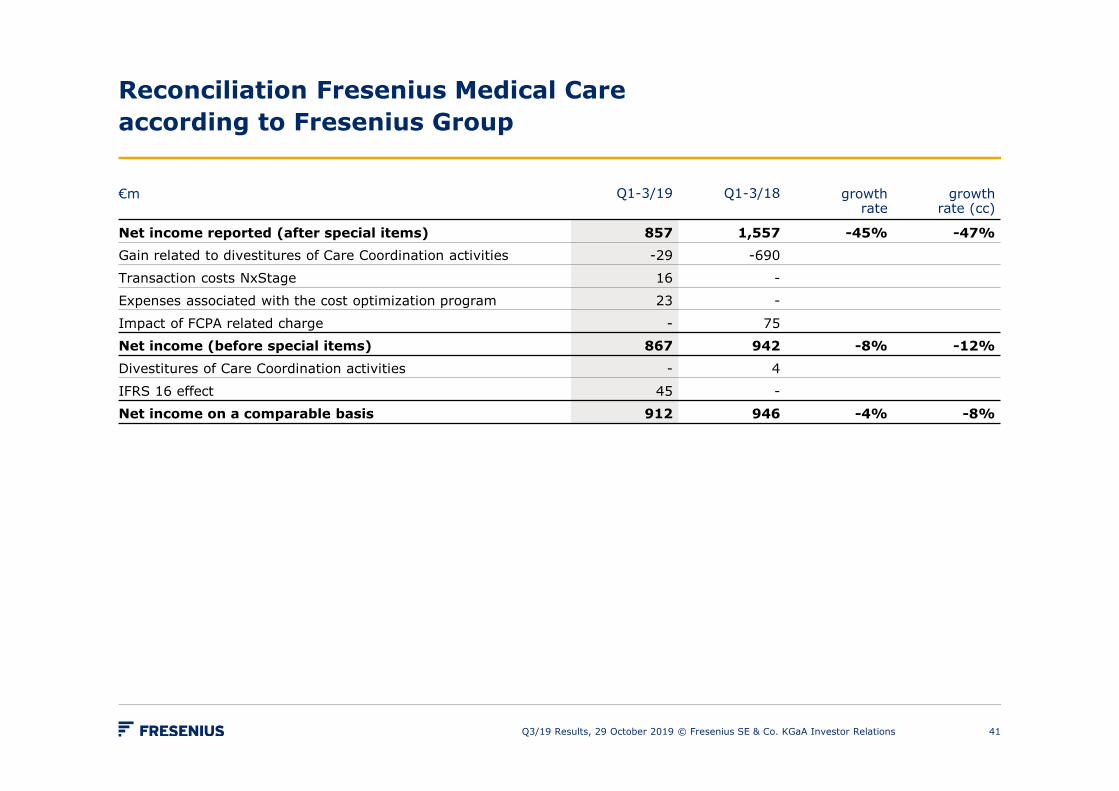
Reconciliation Fresenius Medical Care
according to Fresenius Group
Q3/19 Results, 29 October 2019 © Fresenius SE & Co. KGaA Investor Relations
€m Q1-3/19 Q1-3/18 growthrate
growthrate (cc)
Net income reported (after special items) 857 1,557 -45% -47%
Gain related to divestitures of Care Coordination activities -29 -690
Transaction costs NxStage 16 -
Expenses associated with the cost optimization program 23 -
Impact of FCPA related charge - 75
Net income (before special items) 867 942 -8% -12%
Divestitures of Care Coordination activities - 4
IFRS 16 effect 45 -
Net income on a comparable basis 912 946 -4% -8%
41

Reconciliation Fresenius Kabi
Q3/19 Results, 29 October 2019 © Fresenius SE & Co. KGaA Investor Relations
€m Q3/19 Q3/18 growthrate
growthrate (cc)
Sales reported 1,761 1,650 7% 5%
Transaction costs Akorn 0 6
Revaluations of biosimilars contingent liabilities 0 -
EBIT (before special items) 307 297 3% 1%
IFRS 16 effect -1 -
EBIT on a comparable basis 306 297 3% 1%
Transaction costs Akorn 0 5
Revaluations of biosimilars contingent liabilities 1 -
Net income (before special items) 203 199 2% -1%
IFRS 16 effect 1 -
Net income on a comparable basis 204 199 3% 0%
42

Reconciliation Fresenius Kabi
Q3/19 Results, 29 October 2019 © Fresenius SE & Co. KGaA Investor Relations
€m Q1-3/19 Q1-3/18 growthrate
growthrate (cc)
Sales reported 5,153 4,857 6% 5%
Transaction costs Akorn 3 45
Revaluations of biosimilars contingent liabilities -4 -
EBIT (before special items) 920 854 8% 4%
IFRS 16 effect -3 -
EBIT on a comparable basis 917 854 7% 4%
Transaction costs Akorn 3 36
Revaluations of biosimilars contingent liabilities -1 -
Net income (before special items) 614 554 11% 7%
IFRS 16 effect 4 -
Net income on a comparable basis 618 554 12% 8%
43

Reconciliation Fresenius Helios
Q3/19 Results, 29 October 2019 © Fresenius SE & Co. KGaA Investor Relations
€m Q3/19 Q3/18 growthrate
Sales reported 2,230 2,088 7%
German post-acute care business transferred from Fresenius Helios to Fresenius Vamed - 0
Sales adjusted for German post-acute care business 2,230 2,088 7%
EBIT reported 187 204 -8%
IFRS 16 effect -4 -
EBIT adjusted for IFRS 16 effect 183 204 -10%
German post-acute care business transferred from Fresenius Helios to Fresenius Vamed - 0
EBIT adjusted for IFRS 16 effect and German post-acute care business 183 204 -10%
44
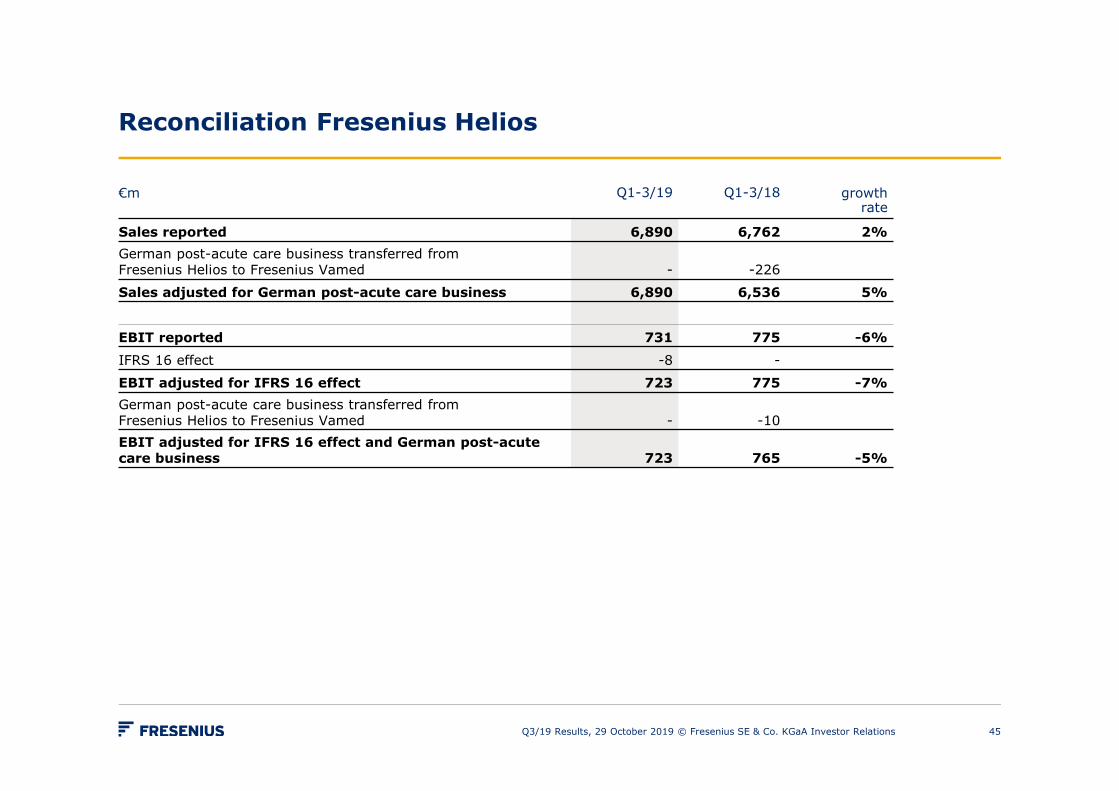
Reconciliation Fresenius Helios
Q3/19 Results, 29 October 2019 © Fresenius SE & Co. KGaA Investor Relations
€m Q1-3/19 Q1-3/18 growthrate
Sales reported 6,890 6,762 2%
German post-acute care business transferred from Fresenius Helios to Fresenius Vamed - -226
Sales adjusted for German post-acute care business 6,890 6,536 5%
EBIT reported 731 775 -6%
IFRS 16 effect -8 -
EBIT adjusted for IFRS 16 effect 723 775 -7%
German post-acute care business transferred from Fresenius Helios to Fresenius Vamed - -10
EBIT adjusted for IFRS 16 effect and German post-acute care business 723 765 -5%
45

Reconciliation Fresenius Vamed
Q3/19 Results, 29 October 2019 © Fresenius SE & Co. KGaA Investor Relations
€m Q3/19 Q3/18 growthrate
Sales reported 562 476 18%
German post-acute care business acquired from Fresenius Helios -121 -117
Sales adjusted for German post-acute care business 441 359 23%
EBIT reported 33 31 6%
IFRS 16 effect 1 -
EBIT adjusted for IFRS 16 effect 34 31 10%
German post-acute care business acquired from Fresenius Helios -15 -15
EBIT adjusted for IFRS 16 effect and German post-acute care business 19 16 19%
46

Reconciliation Fresenius Vamed
Q3/19 Results, 29 October 2019 © Fresenius SE & Co. KGaA Investor Relations
€m Q1-3/19 Q1-3/18 growthrate
Sales reported 1,469 991 48%
German post-acute care business acquired from Fresenius Helios -350 -117
Sales adjusted for German post-acute care business 1,119 874 28%
EBIT reported 67 49 37%
IFRS 16 effect -2 -
EBIT adjusted for IFRS 16 effect 65 49 33%
German post-acute care business acquired from Fresenius Helios -31 -15
EBIT adjusted for IFRS 16 effect and German post-acute care business 34 34 0%
47

IFRS 16 effect on Group P&L
Q3/19 Results, 29 October 2019 © Fresenius SE & Co. KGaA Investor Relations
€m
Q3/19 before
special items adjusted for
IFRS 16 effect IFRS 16 effect
Q3/19 before
special itemsaccording to
IFRS 16
Q1-3/19 before
special items adjusted for
IFRS 16 effect IFRS 16 effect
Q1-3/19 before
special itemsaccording to
IFRS 16
Sales 8,877 -35 8,842 26,173 -75 26,098
EBITDA 1,526 237 1,763 4,468 699 5,167
Depreciation and amortization -396 -214 -610 -1,146 -620 -1,766
EBIT 1,130 23 1,153 3,322 79 3,401
Net interest -124 -47 -171 -379 -153 -532
Income taxes -232 5 -227 -680 18 -662
Noncontrolling interest -321 11 -310 -865 31 -834
Net income1 453 -8 445 1,398 -25 1,373
48
1 Net income attributable to shareholders of Fresenius SE & Co. KGaA

IFRS 16 effect on Group Balance Sheet and Cash Flow
Q3/19 Results, 29 October 2019 © Fresenius SE & Co. KGaA Investor Relations
€m
Sep 30, 2019adjusted for
IFRS 16 effect IFRS 16 effect
Sep 30, 2019according to
IFRS 16
Right-of-use-assets 1901 5,667 5,857
Lease liabilities 4142 5,899 6,313
Equity 26,928 -232 26,696
Total assets 61,092 5,667 66,759
49
1 Reclassification from machinery, equipment and rental equipment under capital leases as of December 31, 20182 Reclassifications from capital lease obligations and other liabilities as of December 31, 2018
€m
Q3/19adjusted for
IFRS 16 effect IFRS 16 effect
Q3/19according to
IFRS 16
Q1-3/19adjusted for
IFRS 16 effect IFRS 16 effect
Q1-3/19according to
IFRS 16
Operating cash flow 1,298 185 1,483 2,439 538 2,977
Cash flow before acquisitions and dividends 722 185 907 850 538 1,388
Free cash flow 547 185 732 -2,172 538 -1,634
Cash provided by/used for financing activities -461 -185 -646 995 -538 457
Balance Sheet
Cash Flow

Financial Calendar / Contact
Financial Calendar
20 February 2020 Results FY/19
06 May 2020 Results Q1/20
20 May 2020 Annual General Meeting
30 July 2020 Results Q2/20
29 October 2020 Results Q3/20
Please note that these dates could be subject to change.
Contact
Investor Relations
Fresenius SE & Co. KGaA
phone: +49 6172 608-2485
e-mail: [email protected]
For further information and current news: www.fresenius.com
Follow us on Twitter www.twitter.com/fresenius_ir
and LinkedIn: www.linkedin.com/company/fresenius-investor-relations
Q3/19 Results, 29 October 2019 © Fresenius SE & Co. KGaA Investor Relations 50