CONΣERV IT 1
29
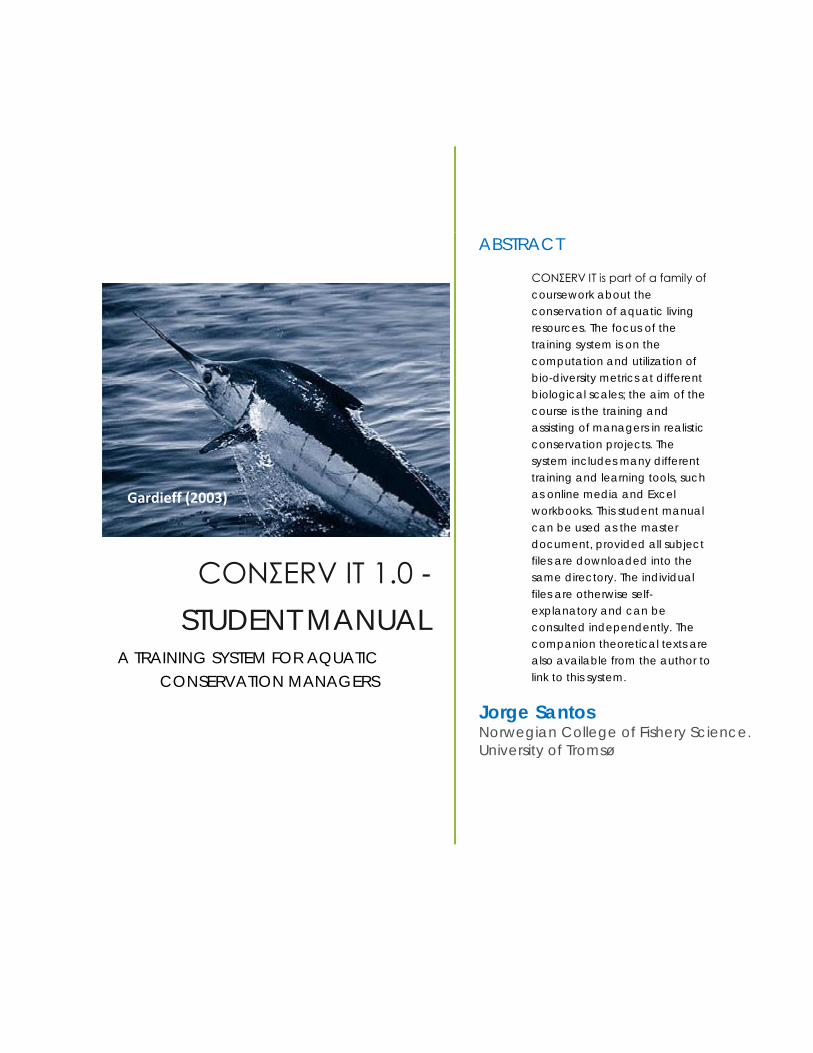
CONΣERV IT 1.0 - STUDENT MANUAL A TRAINING SYSTEM FOR AQUATIC CONSERVATION MANAGERS ABSTRACT CONΣERV IT is part of a family of coursework about the conservation of aquatic living resources. The focus of the training system is on the computation and utilization of bio-diversity metrics at different biological scales; the aim of the course is the training and assisting of managers in realistic conservation projects. The system includes many different training and learning tools, such as online media and Excel workbooks. This student manual can be used as the master document, provided all subject files are downloaded into the same directory. The individual files are otherwise self- explanatory and can be consulted independently. The companion theoretical texts are also available from the author to link to this system. Jorge Santos Norwegian College of Fishery Science. University of Tromsø Gardieff (2003)
Transcript of CONΣERV IT 1
CONΣERV IT 1.0 - STUDENT MANUAL
A TRAINING SYSTEM FOR AQUATIC CONSERVATION MANAGERS
ABSTRACT CONΣERV IT is part of a family of coursework about the conservation of aquatic living resources. The focus of the training system is on the computation and utilization of bio-diversity metrics at different biological scales; the aim of the course is the training and assisting of managers in realistic conservation projects. The system includes many different training and learning tools, such as online media and Excel workbooks. This student manual can be used as the master document, provided all subject files are downloaded into the same directory. The individual files are otherwise self-explanatory and can be consulted independently. The companion theoretical texts are also available from the author to link to this system.
Jorge Santos Norwegian College of Fishery Science. University of Tromsø
Gardieff (2003)

CONΣERV IT 1.0 – STUDENT MANUAL
Jorge Santos 1
Santos, J. 2015. CONΣERV IT 1.0 – Student Manual: A Training System for Aquatic Conservation Managers. Septentrio Educational 2015(2).
DOI: http://dx.doi.org/10.7557/se.2015.2
This work is licensed under a Creative Commons Attribution 4.0 International License.
CONΣERV IT 1.0 – STUDENT MANUAL
Jorge Santos 2
PREFACE
What part of nature do we want to keep around us in a close to wild state? In 2015, there are about seven billion people and as many answers to that question. Curiously, the specialists in the matter who state the problem in terms of conservation of biological diversity also see the issue from many different perspectives and scales. There are, therefore, many definitions of bio-diversity, diagnostics and prescriptions for conservation. Nevertheless, there are at least two aspects which these specialists generally agree upon that may be unfamiliar to the common layman. For biologists, the most important purpose of conservation may not lie in keeping living records of the past and present, but in the maintenance of evolutionary potential for the future; or, in other words, by keeping the potential for change from previous states. Secondly, in order to ensure replicability and objectivity, ecologists and conservation biologists often use mathematics to formulate and support their statements.
Managers are people who make important decisions in society. However, they often miss insight into the complex disciplines involved in the solution of specific problems in, for instance, conservation. One particular idea that many people, including managers, often embrace is the concept of species richness, because this is a simple and understandable metric of diversity. Unfortunately, “species” is seldom a good or objective goal of conservation. However, it is not unusual that managers have mathematical anxiety or lack the graphical or spatial capabilities to understand the properties of bio-diversity at other scales. Could it be that introducing different concepts of diversity at scales ranging from genes to oceanic ecosystems and in the form of simple exercises and management games can cure these fears and blockages?
Whilst my old professor of population genetics and dynamics, Campos Rosado, made great attempts to introduce the theoretical matter, it was not until I read a little book by Wilson & Bossert that I understood the simplicity of it. Other teachers in other subjects, like Per Grotnes and John Pope, kindly introduced me to the idea of learning serious matters with simple exercises, simulations and games. Along with the present text, I cite other important sources of inspiration in the course of the chapters’ progression.
CONΣERV IT 1.0 – STUDENT MANUAL
Jorge Santos 3
Table of Contents
Chapter 1 - Introduction .............................................................................................................. 4
Chapter 2 - Test yourself .............................................................................................................. 7
Chapter 3 – Excel basics .......................................................................................................... 10
Chapter 4 - Evolutionary forces at work in fish populations ................................................ 12
Chapter 5 – Population viability .............................................................................................. 18
Chapter 6 - Population Sub-Structure and Management .................................................. 20
Chapter 7 – Diversity: measurement and valuation ............................................................ 22
Chapter 8 – Conservation planning ....................................................................................... 24
9 - Bibliography .......................................................................................................................... 26
10 – Sources of images ............................................................................................................. 27
CONΣERV IT 1.0 – STUDENT MANUAL
Jorge Santos 4
Chapter 1 - Introduction
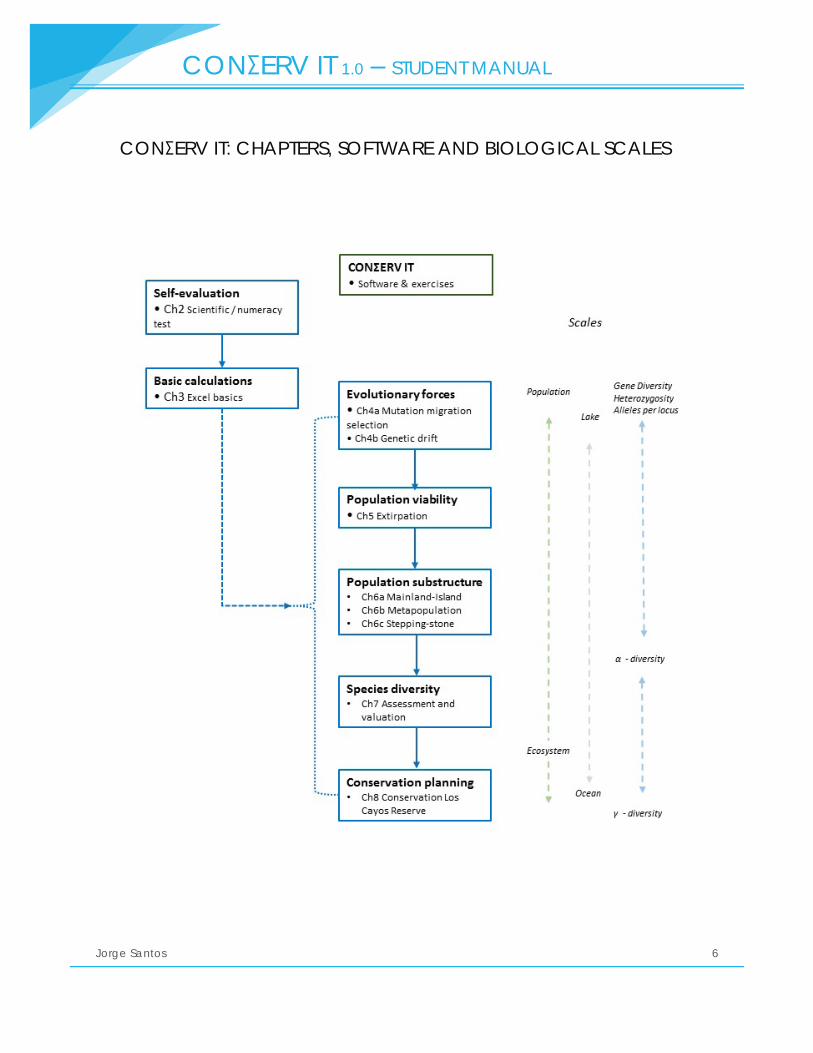
I developed much of the material in this training system between 1998 and 2005 in order to train students with diverse backgrounds (natural and social sciences) who attended a multi-disciplinary program on International Fishery Management. Conservation science was then a minor segment of an intermediary course on Fishery Ecology. Given the wide background of the students and the purpose of the program, this training course is eminently practical in nature. The course is issue-based and a problem-solving approach is normally followed.
Simulations and problem-solution often require intensive use of mathematics or computational tools. That is why this training system is predominantly based on quantitative worksheets and software. With time I learned that while some students were over-confident about their quantitative skills, many or most lacked those skills or were simply hesitant, and a few suffered from mathematical anxiety. To get an early assessment of the situation, I would expose the fresh students to a short pre-test (Chapter 2) and a basic course in Excel (Chapter 3). Spreadsheets have their limitations, but are low-threshold quantitative tools that are nearly free and available everywhere. These were definitively strong points with our batch of students that came from all over the world.
This master document introduces the different topics in different chapters (chapters 4-8). Each chapter provides a hyperlink to one or several workbooks that are self-explanatory. The master document also provides links to internet sites that have relevant theoretical information for the topic or to the lecture notes compiled by the author. In CONΣERV IT 1.0 these lecture notes are supplementary material available separately from the author. The only practical requirement in order for the master document to link properly to the dependent workbooks is that they are installed in the same directory. Workbooks can otherwise be utilized independently from the master document.
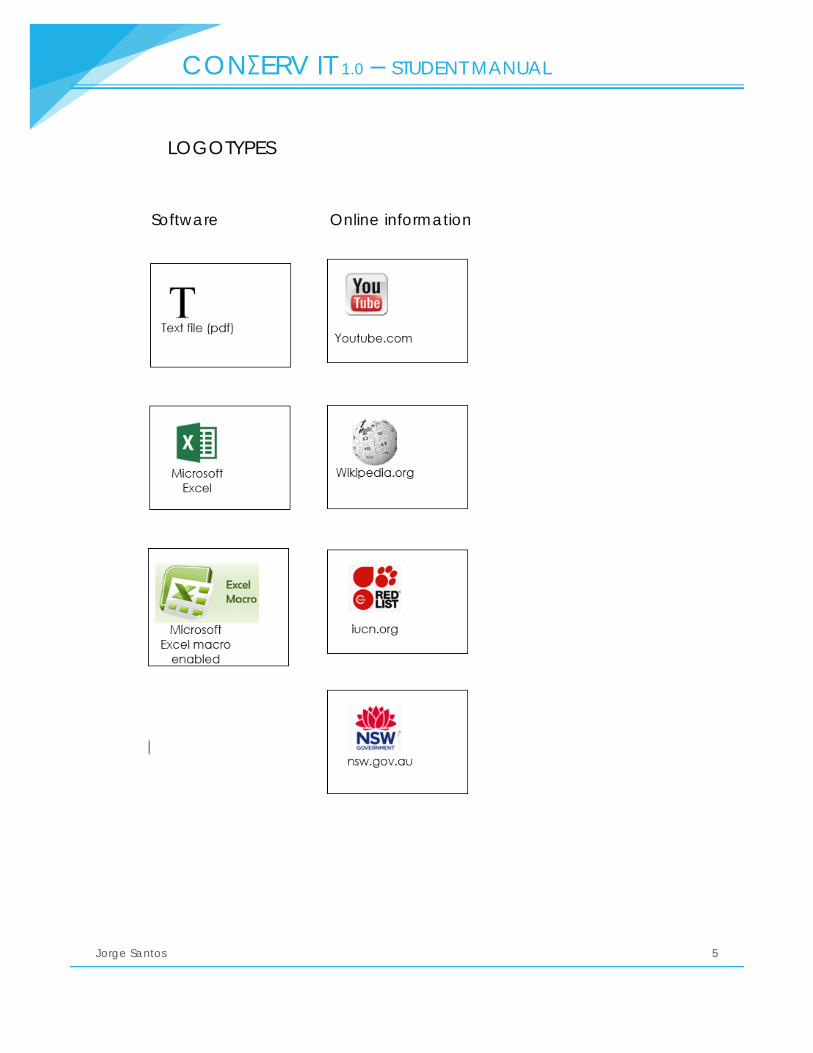
This document and the dependent workbooks were inspired by works from many other people. I will attempt to give a full reference list of the literature as well as of the photographic material, at the end of this master document. On the next page is shown a list of logotypes: these logotypes make it easier to identify the source or type of learning material used along the training system.
CONΣERV IT 1.0 – STUDENT MANUAL
Jorge Santos 5
LOGOTYPES
Software Online information
CONΣERV IT 1.0 – STUDENT MANUAL
Jorge Santos 6
CONΣERV IT: CHAPTERS, SOFTWARE AND BIOLOGICAL SCALES
CONΣERV IT 1.0 – STUDENT MANUAL
Jorge Santos 7
Chapter 2 - Test yourself
QUESTIONS ASKED
• Am I aware of the basics of scientific writing required to write an informative report?
• Do I remember the basics of mathematics? • How do I use statistics to plan and analyze my field or
experimental data?
BACKGROUND INFORMATION
• YouTube, by maverickjang: Learn how to write scientific papers in under 4 minutes
• YouTube, by thinkwell: Calculus I in 20 minutes • YouTube, by GCFLearnFree: Excel 2010: Charts
INSPIRATION
This is just a self-awareness exam that takes less than 10 minutes to answer. In its simplest and shortest form, which is the one presented here, it is a pen-and-paper test. The idea came during a discussion with my colleague Raul Primicério. We felt that some students were over-confident about their basic knowledge and skills before they started the introductory courses. This made our teaching task more difficult. Hopefully, this test will encourage students to review past knowledge at secondary school or college levels.
CONΣERV IT 1.0 – STUDENT MANUAL
Jorge Santos 8
THE ASSIGNMENT
Proficiency test This test is optional and anonymous. The purpose of the exercise is to assess the background of the
whole group of students. This will help us shape the contents of the introductory courses. Therefore,
we need honest answers, and it is acceptable to write “I don’t know”.
Question 1. Background.
Write shortly about your professional and academic background, including major subjects and
years of study at University level.
Question 2. Computers and information technology. (Subject dealt with in Bio-3551.)
Rate your knowledge as none (N), basic (B) or advanced (A) in the following areas. For each area
state also which software and tasks you are most familiar with.
Word processing -
Spreadsheet (computation, graphics) -
Programming language –
E-mail –
Internet browsing –
Reference or literature databases –
Question 3. Scientific writing. (Subjects dealt with in Bio-3552, Bio-3551 and other introductory
courses.)
a) Have you ever written a thesis or scientific paper? State how many.
b) When writing a species name, which of the following options seem to be in the proper format: HOMO
SAPIENS, Homo sapiens, homo sapiens, homo s., or homo-sapiens? How would you type it?
c) In 2001, Mary Smith, Liu Scott and Karim Wilson wrote an article with title “Growth of fishing nations”
which was published in pages 40-50 of the first volume of the scientific journal “Development Policy”.
If you are writing a scientific paper, how would you normally cite this work in a) the body text and b)
in the reference list?
d) Imagine that you have performed an observational study in a subject of your preference, and that
you are now going to write a 50-page thesis. What would be the major sections (chapters) of that
work, and what content would fit better in each of these sections? (For instance, a short description
of the major findings would be made in the Abstract or Summary section.) Maximum 100 words.

CONΣERV IT 1.0 – STUDENT MANUAL
Jorge Santos 9
Question 4. Mathematics and statistics. (Subjects dealt with in Bio-3551, Bio-3553, Bio-3555 and other
courses.)
a) Given the following four number series [2, 4, 6, 28] determine its arithmetic mean (average) as well as
the median.
b) Represent the series of numbers of the previous question in a pie-chart.
c) What is the solution of the following expression y=a.eb, given that a=5 and b=0?
d) You made an experiment with a group of 100 fast snails, and observed that on average they had
covered 5 m after one hour, 10 m after two hours, 15 m after three hours,…., and 50 m after ten
hours. How would you express relationship between the expected distance covered (d) and time (t)
for a single snail in a short mathematical notation? What are the units of the derivative of this
function?
e) During your field work you measured the Productivity ($/worker) of three types of enterprises, small,
medium and large. You noticed that there were large variations in productivity within each of these
groups. Which statistical analysis would you use to compare the group means? What would your null-
hypothesis (H0) be? What would be the sampling design of your next survey?
CONΣERV IT 1.0 – STUDENT MANUAL
Jorge Santos 10
Chapter 3 – Excel basics
QUESTIONS ASKED
• How to lose the fear of using a spreadsheet? • How to do basic repetitive calculations? • How to present figures and reports in scientific style? • How to efficiently select and summarize sub-groups of data?
BACKGROUND INFORMATION
• Wikipedia: Microsoft Excel • YouTube, by Motion Training: Excel Tutorial for Beginners
COVERAGE
• Filling and moving cells • Excel as calculator • In-built functions • Charts • Simple formulas and referencing cells • Database (filter) operations
INSPIRATION AND SOFTWARE
Although most students claim to be familiar Excel, it is often the case that they are not acquainted with many of its useful capabilities (and limitations) for reporting and research work. It was in this spirit that this short lab was developed. Hector Andrade, who was often the TA, helped. Many good books and internet sites have been written about Excel for different professional environments, i.a. research. The interested student will easily find them.
• Ch3 Excel basics JdS.xlsx
CONΣERV IT 1.0 – STUDENT MANUAL
Jorge Santos 11
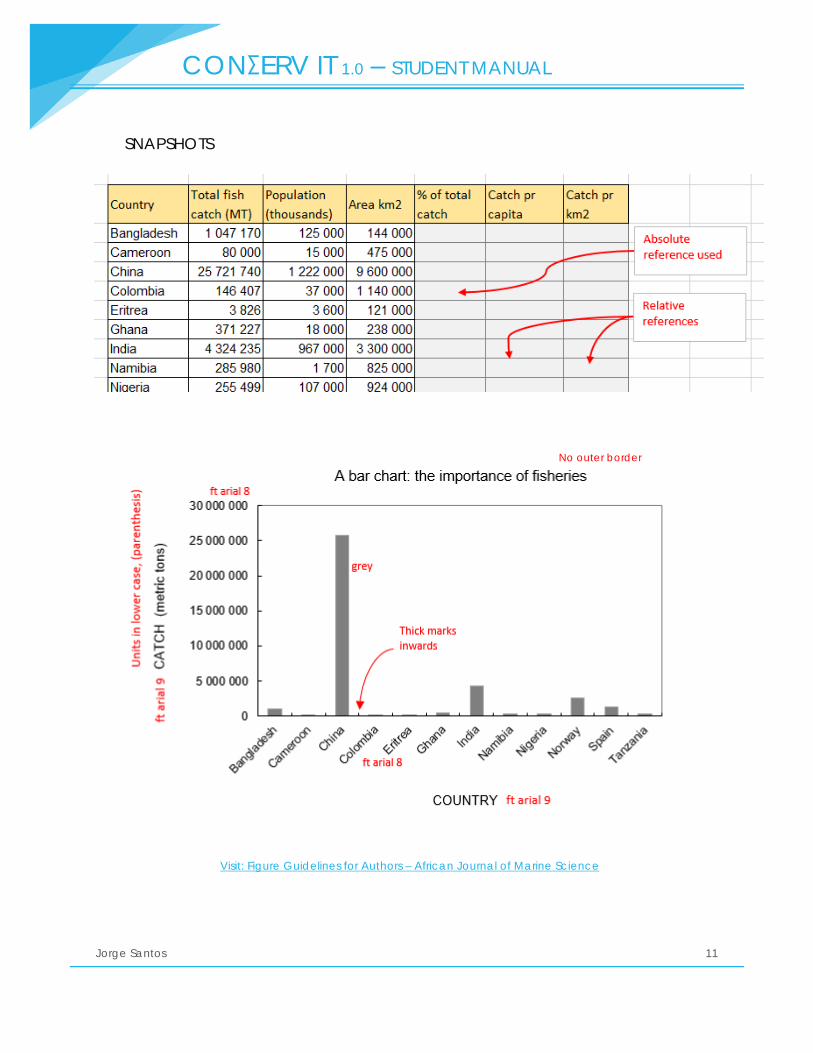
No outer border
SNAPSHOTS
Visit: Figure Guidelines for Authors – African Journal of Marine Science
CONΣERV IT 1.0 – STUDENT MANUAL
Jorge Santos 12
Chapter 4 - Evolutionary forces at work in fish populations
QUESTIONS ASKED
• How do escapees from aquaculture affect genetically salmon populations in rivers?
• What are the time-scales of change in the gene pool of fish? • Can we eradicate undesirable traits from fish stocks? • Are small populations more or less affected by immigration? • What genetic diversity can we expect from large stocks in the
sea? • How much, and how to avoid inbreeding in broodstocks used in
fish farming?
BACKGROUND INFORMATION
• Compendium: Santos (2015a) • Wikipedia: Population genetics • YouTube, by Kurz Gezagt: How evolution works
COVERAGE
• Mutation (one-way) • Migration (from mainland to lake) • Fitness and selection • Population bottlenecks • Genetic drift

CONΣERV IT 1.0 – STUDENT MANUAL
Jorge Santos 13
INSPIRATION AND SOFTWARE
Originally, part of this class was performed using the software p14 and p14b developed by Jarle Mork, at NTNU in Trondheim, in the early 1990s. It is difficult to run that software in today’s operative systems. I adapted those versions to Excel. One of the programmes includes deterministic models and the other is stochastic, to account for the effects of stock size and drift. The last software comes, thus, available as a macro version of an Excel workbook. It normally requires special enabling by the user.
• Ch4a Population genetics migration selection deterministic JdS.xlsx • Ch4b Population genetics drift stochastic macro JdS.xlsm
CONΣERV IT 1.0 – STUDENT MANUAL
Jorge Santos 14
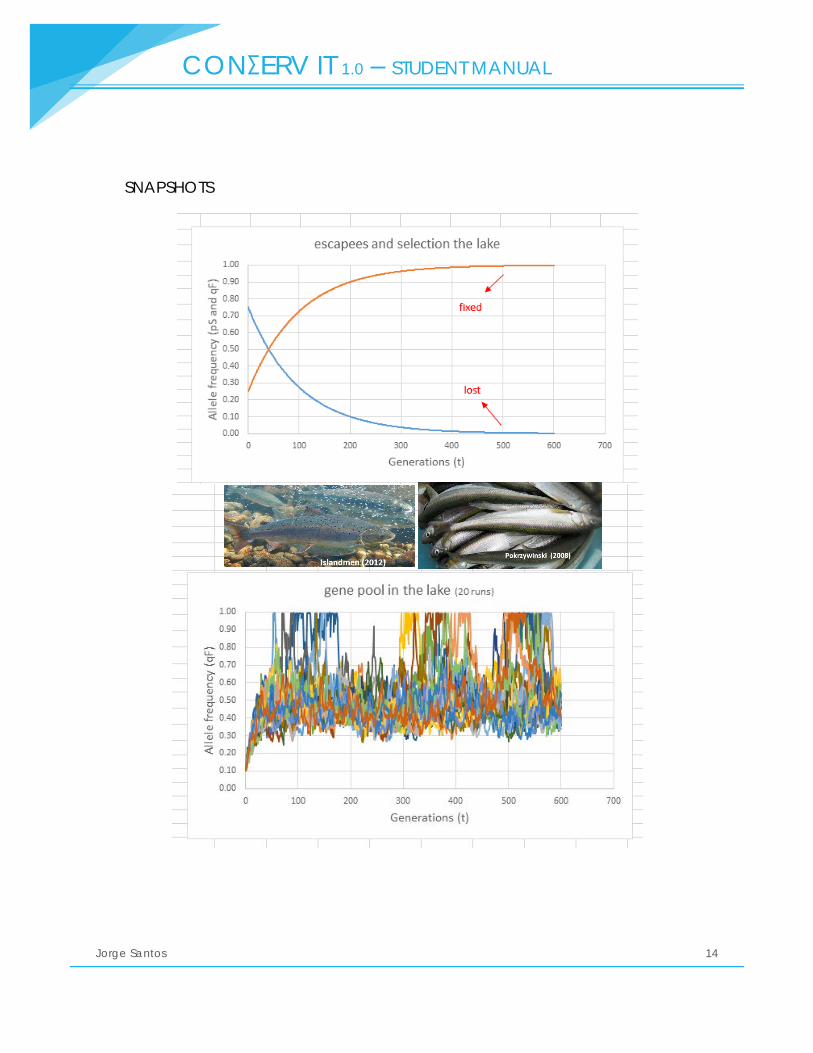
SNAPSHOTS
CONΣERV IT 1.0 – STUDENT MANUAL
Jorge Santos 15
THE ASSIGNMENT
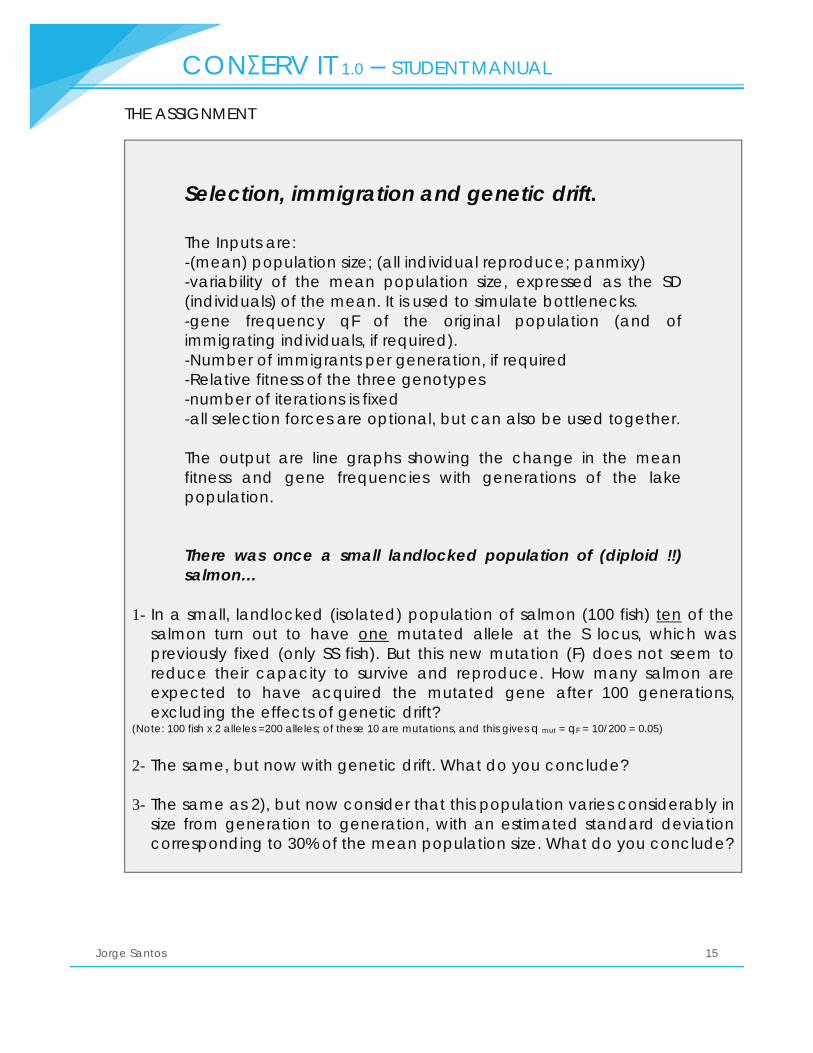
Selection, immigration and genetic drift. The Inputs are: -(mean) population size; (all individual reproduce; panmixy) -variability of the mean population size, expressed as the SD (individuals) of the mean. It is used to simulate bottlenecks. -gene frequency qF of the original population (and of immigrating individuals, if required). -Number of immigrants per generation, if required -Relative fitness of the three genotypes -number of iterations is fixed -all selection forces are optional, but can also be used together. The output are line graphs showing the change in the mean fitness and gene frequencies with generations of the lake population. There was once a small landlocked population of (diploid !!) salmon…
1- In a small, landlocked (isolated) population of salmon (100 fish) ten of the salmon turn out to have one mutated allele at the S locus, which was previously fixed (only SS fish). But this new mutation (F) does not seem to reduce their capacity to survive and reproduce. How many salmon are expected to have acquired the mutated gene after 100 generations, excluding the effects of genetic drift?
(Note: 100 fish x 2 alleles =200 alleles; of these 10 are mutations, and this gives q mut = qF = 10/200 = 0.05)
2- The same, but now with genetic drift. What do you conclude? 3- The same as 2), but now consider that this population varies considerably in
size from generation to generation, with an estimated standard deviation corresponding to 30% of the mean population size. What do you conclude?

CONΣERV IT 1.0 – STUDENT MANUAL
Jorge Santos 16
4- A new problem with a landlocked population. The lake owner, Mr. Killa, decides to get rid of the fish that shown the “FF syndrome”, because they are really ugly. “It may take me some years…but these f…f… will disappear!” He kills every parr (immature salmon) there is affected with this FF-syndrome. As the name says, the FF-syndrome is only visible in the homozygous state, and the fish that possess the F gene are as capable as any other. Besides, even if they are really ugly there is no uncommon sexual selection for them. On average, there are 4 FF fish for the 100 fish in the lake, and no genetic drift, nor bottlenecks in the population. How many years will have Mr. Killa to wait to get a lake clean of the F gene, taking into account that the reproductive age of these fish is 6 years.?
(Note: according to the Hardy-Weinberg law the phenotype FF corresponds to the genotype frequency q2. If FF=4 then qF=0.2. The selection pressure on this homozygote is 1, and its fitness is thereby 0. This problem resembles the eugenics dilemma.)
5- The fish that have a new mutation F (qF=0.05) in the homozygote state have
a slightly higher (5%) relative fitness than the heterozygotes, and 10% higher relative fitness than the SS homozygotes. The population is panmictic, N=100, and there is genetic drift and bottlenecks (20% SD of the mean N). What do you conclude?
…they built a channel down the lake, and now the farmed (diploid) salmon are invading it…. 6- Every generation one farmed salmon manages to pass the traps in the
channel that leads to the lake. The original gene frequency in the lake is qF=0.8 but the invading salmon does not have this allele F. How will the population look like many years from now with regard to this locus? (No genetic drift, nor bottlenecks in the population, and all genotypes have similar fitness.)
7- The thing is getting out of control! Every generation 20 farmed salmon (20%
of the population !!!) enter and reproduce in the lake. Invaders have a strange mating behaviour and only have a 50% chance of reproducing in relation to the wild variant. The hybrids only perform 25% worse than the wild salmon. How many years until the wild genotype is decimated? (Same parameters as in 6).)
(Note: here sexual selection is the type of selection acting on the fitness of the fish.)
8- The size of the local spawning population has considerably varied in the last
10 years: 100, 130, 150, 100, 80, 40, 100, 40, 100, 120. Calculate the effective population size (Ne) of the reproductive population. (Hint: calculate the
CONΣERV IT 1.0 – STUDENT MANUAL
Jorge Santos 17
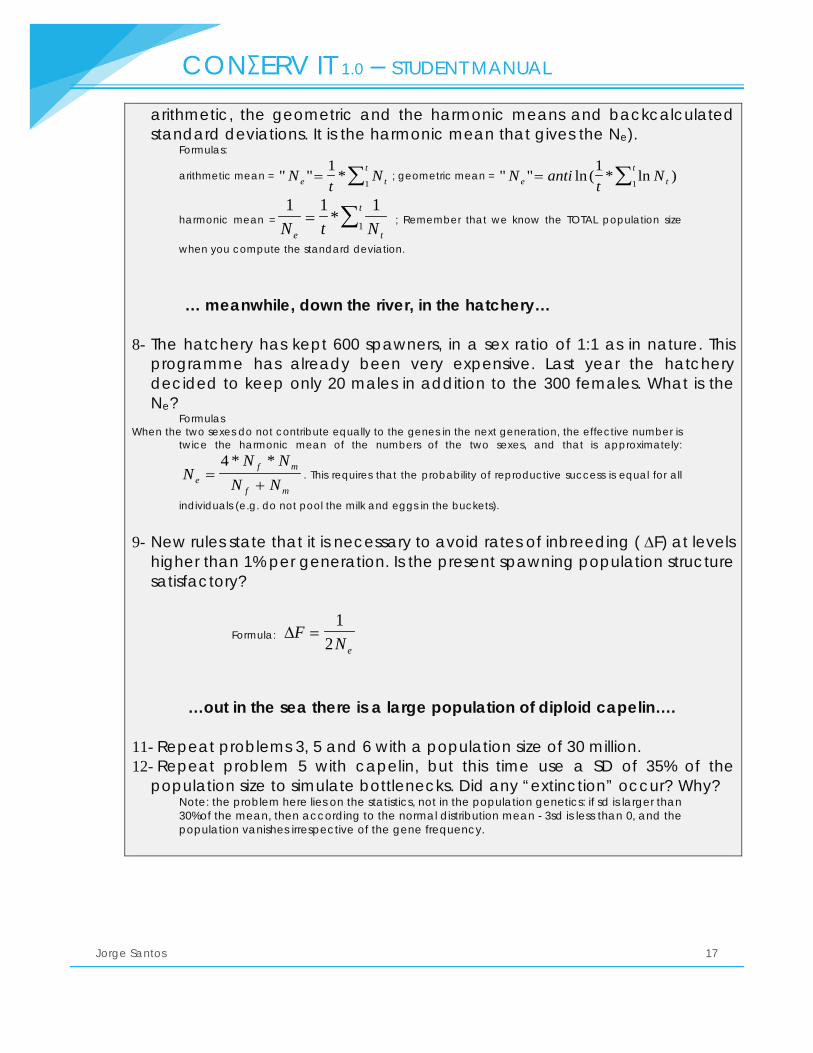
arithmetic, the geometric and the harmonic means and backcalculated standard deviations. It is the harmonic mean that gives the Ne).
Formulas: arithmetic mean = " " *N
tNe t
t= ∑1
1; geometric mean = " " ln ( * ln )N anti
tNe t
t= ∑1
1
harmonic mean =1 1 1
1N t Ne t
t= ∑* ; Remember that we know the TOTAL population size
when you compute the standard deviation.
… meanwhile, down the river, in the hatchery…
8- The hatchery has kept 600 spawners, in a sex ratio of 1:1 as in nature. This
programme has already been very expensive. Last year the hatchery decided to keep only 20 males in addition to the 300 females. What is the Ne?
Formulas When the two sexes do not contribute equally to the genes in the next generation, the effective number is
twice the harmonic mean of the numbers of the two sexes, and that is approximately:
NN N
N Nef m
f m=
+
4 * *. This requires that the probability of reproductive success is equal for all
individuals (e.g. do not pool the milk and eggs in the buckets).
9- New rules state that it is necessary to avoid rates of inbreeding ( ∆F) at levels
higher than 1% per generation. Is the present spawning population structure satisfactory?
Formula: ∆FNe
=1
2
…out in the sea there is a large population of diploid capelin….
11- Repeat problems 3, 5 and 6 with a population size of 30 million. 12- Repeat problem 5 with capelin, but this time use a SD of 35% of the
population size to simulate bottlenecks. Did any “extinction” occur? Why? Note: the problem here lies on the statistics, not in the population genetics: if sd is larger than 30%of the mean, then according to the normal distribution mean - 3sd is less than 0, and the population vanishes irrespective of the gene frequency.

CONΣERV IT 1.0 – STUDENT MANUAL
Jorge Santos 18
Chapter 5 – Population viability
QUESTIONS ASKED
• What is conservation biology? • Do fish populations get extinct or extirpated? • Is it bad that related populations rescue each other?
BACKGROUND INFORMATION
• Compendium: Santos (2015a) • Wikipedia: Conservation Biology, IUCN Red List • IUCN Red List Categories and Criteria 3.1 • YouTube: DNews, 3 extinct animals make a comeback • YouTube: RippleAfrica, Fish conservation in Lake Malawi
COVERAGE
• Concepts and categories of vulnerability • Examples of vulnerable fish populations • Estimation of the probability of extinction from sporadic sightings
INSPIRATION AND SOFTWARE
Some few species along the coasts, and particularly in estuaries and lakes, have their future threatened somehow. There is, however, a great confusion about what “threatened” means. The vocabulary and definitions used by IUCN are introduced. Interesting examples for calculation of the probability of extirpation of populations found in museums, or sporadically in the fishery by-catch, are worked with. The examples are inspired on the proposition made by Grogan & Boreman (1998). Considerations are made about the socio-economic contexts of fisheries and conservation initiatives.
• Ch5 Extirpation JdS.xlsx

CONΣERV IT 1.0 – STUDENT MANUAL
Jorge Santos 19
SNAPSHOTS
visit
CONΣERV IT 1.0 – STUDENT MANUAL
Jorge Santos 20
Chapter 6 - Population Sub-Structure and Management
QUESTIONS ASKED
• Does it matter how fish populations are divided spatially? • How do we deal with different spatial linkages, configurations and
populations sizes in fisheries management? • How much biomass or money do we lose by not fishing or by over-
fishing small and large mixed populations?
BACKGROUND INFORMATION
• Compendium: Santos (2015a) • Wikipedia: Insular biogeography, Metapopulation • YouTube: Robertandkylie, Bugger off with Metapopulation Theory • YouTube: scienceclassisgreat, Metapopulation
COVERAGE
• Colonization, depletion and rescue effects • Mainland-island structure (peripatry) • Mixed-stocks metapopulation structure (sympatry) • Stepping-stone structure (parapaty)
INSPIRATION AND SOFTWARE
Although the issue of mixed stocks and stock discrimination has long been discussed in fishery biology, the works of i.a. Wilson, MacArhtur and Levins were critical to bring ecology and genetics together and construct theories of biogeography. Here simple fishery dynamic models are applied to their ideas. Contains macros.
• Ch6a ConservArea I Mainland_Island whelk macro JdS.xlsm • Ch6b ConservArea II Metapopulation sardine macro JdS.xlsm • Ch6c ConservArea III Stepping-stone salmon macro JdS.xlsm
CONΣERV IT 1.0 – STUDENT MANUAL
Jorge Santos 21
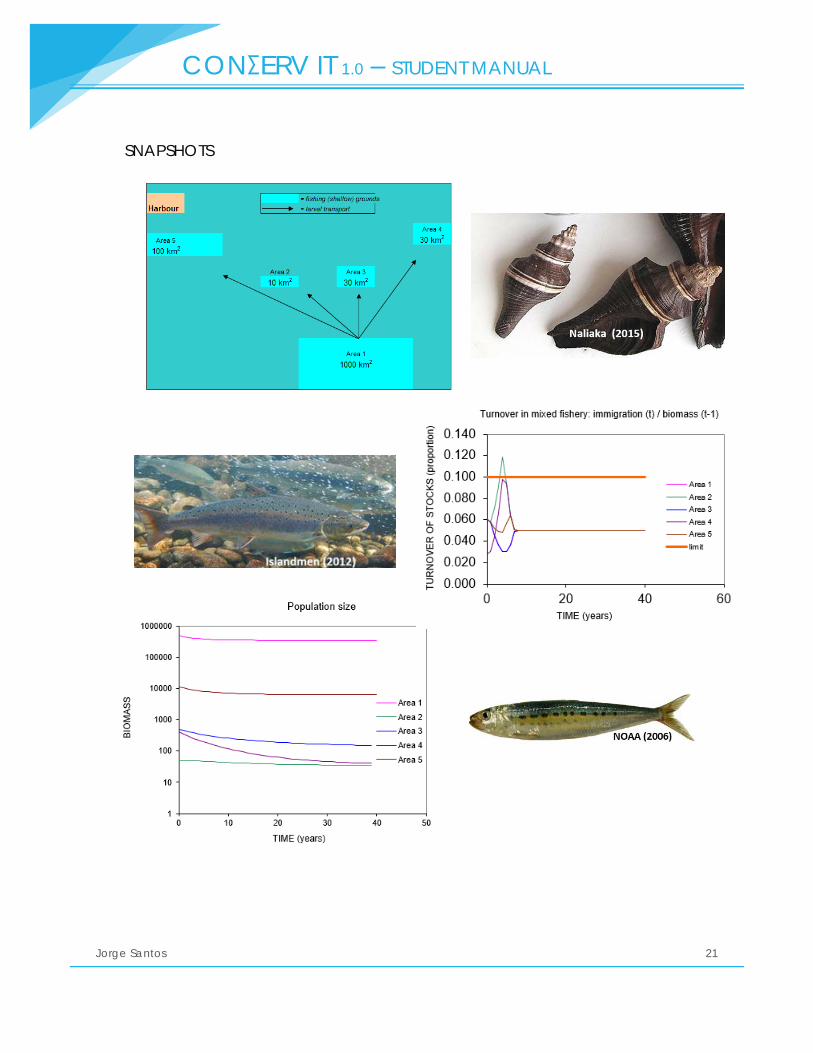
SNAPSHOTS
CONΣERV IT 1.0 – STUDENT MANUAL
Jorge Santos 22
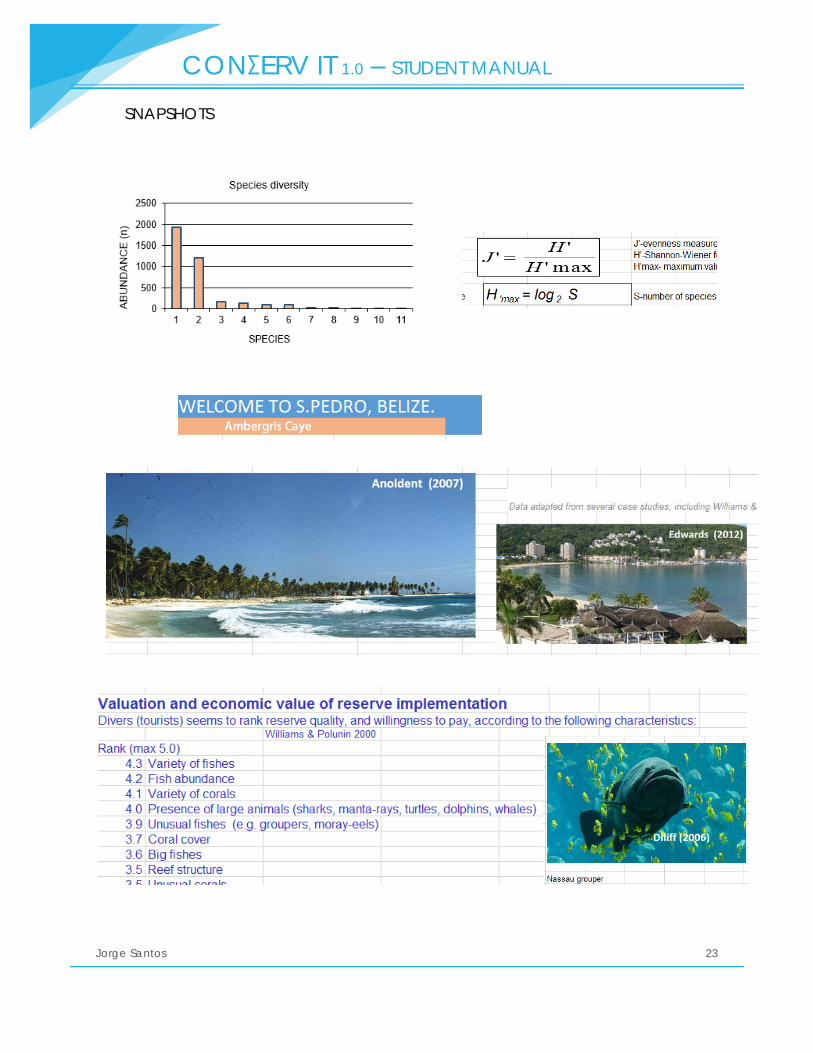
Chapter 7 – Diversity: measurement and valuation
QUESTIONS ASKED
• What do ecologists call diversity? • How can we measure changes in diversity in locally impacted
areas? • How can we valuate those changes by simple means?
BACKGROUND INFORMATION
• Compendium: Santos (2015b) • Wikipedia: Biodiversity, Species diversity • YouTube: CSIRO, What is biodiversity and why is it important? • YouTube: CCVEnvBio, Biodiversity: Richness, Evenness, and
Importance
COVERAGE
• Indices of species diversity: richness, heterogeneity, evenness • Measurement of species diversity change in impacted aquatic
ecosystem • Valuation of two states of an aquatic ecosystem using a
contingent valuation method
INSPIRATION AND SOFTWARE
The concept of species diversity has had the largest and longest tradition in ecology. Krebs’s book on experimental ecology is the definitive reference on sampling and data analysis of distribution and abundance, and easy reading. One of the methods used by bio-economists to value biodiversity and ecosystem services, the willingness to pay, is introduced.
• Ch7 Conservation and valuation of diversity Belize JdS.xlsx
CONΣERV IT 1.0 – STUDENT MANUAL
Jorge Santos 23
SNAPSHOTS

CONΣERV IT 1.0 – STUDENT MANUAL
Jorge Santos 24
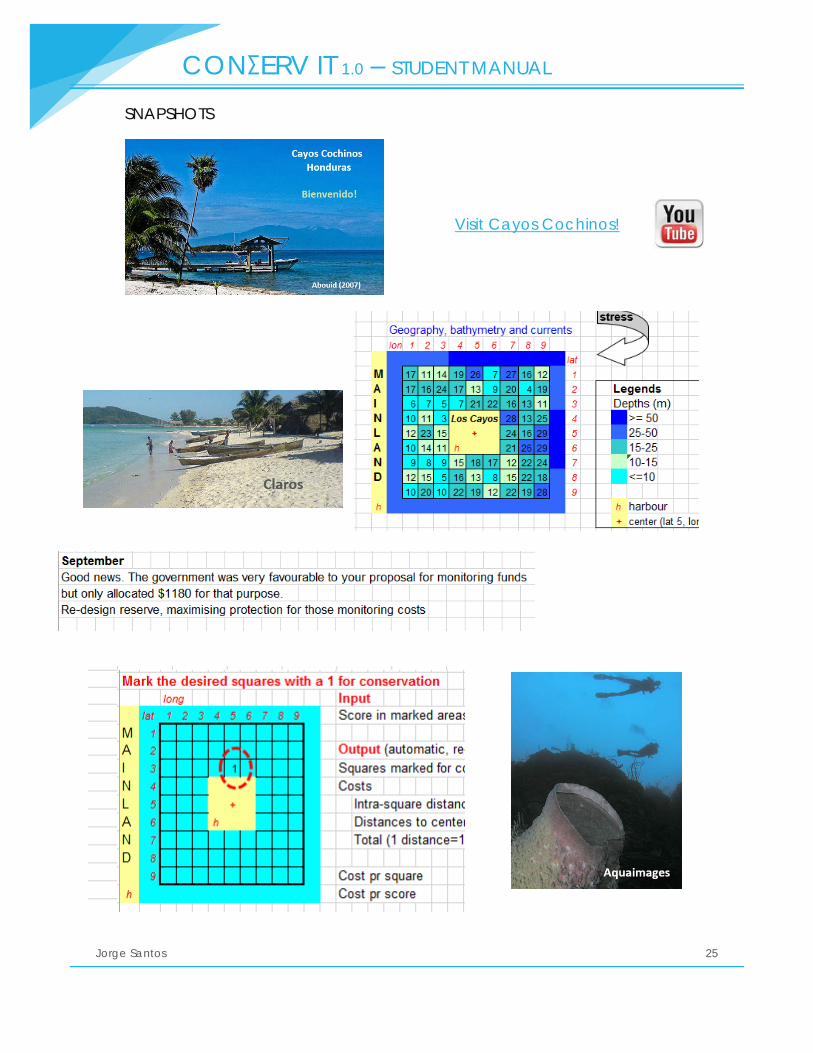
Chapter 8 – Conservation planning
QUESTIONS ASKED
• How do we express the suitability of habitat for different organisms and communities?
• How to make spatial planning of conservation networks that takes into account multiple ecological and social criteria?
• How to perform an economic analysis of the non-monetized conservation effects?
BACKGROUND INFORMATION
• Compendium: Santos (2015b) • Wikipedia: Reserve design, Marine Protected Area • YouTube: CSIRO, Multiple criteria decision making
COVERAGE
• Habitat suitability indices • Optimization of area utilization in socio-ecological networks;
minimum area and minimum conflict networks • Multiple criteria decision making • Cost-effectiveness analysis
INSPIRATION AND SOFTWARE
In 1990, Millsap et al performed a spatial analysis of the vulnerability of several taxa in Florida using very simple means. Even today, this is still a work of reference. In 2003, Williams et al developed this method, including socio-economic constraints and numerical optimization methods, and applied it to the enormous Guinean-Congolian forest. The present exercise, in its student version, requires manual optimization of the network, but facilitates the computation of suitability totals and costs.
• Ch8 Conservation Los Cayos Reserve short version JdS.xlsx
CONΣERV IT 1.0 – STUDENT MANUAL
Jorge Santos 25
SNAPSHOTS
Visit Cayos Cochinos!
CONΣERV IT 1.0 – STUDENT MANUAL
Jorge Santos 26
9 - Bibliography
Grogan, C. S., & Boreman, J. (1998). Estimating the probability that historical populations of fish species are extirpated. North American Journal of Fisheries Management, 18(3), 522-529. http://dx.doi.org/10.1577/1548-8675(1998)018%3C0522:ETPTHP%3E2.0.CO;2
Hartl, D. L., Clark, A. G., & Clark, A. G. (1997). Principles of population genetics (3rd ed.). Sunderland: Sinauer associates.
Krebs, C. J. (2008). The experimental analysis of distribution and abundance. Ecology. 6th edition. S. Francisco: Benjamin Cummings.
Levins, R. (1969). Some demographic and genetic consequences of environmental heterogeneity for biological control. Bulletin of the Entomological Society of America, 15(3), 237-240. http://dx.doi.org/10.1093/besa/15.3.237
MacArthur, R. H., & Wilson, E. O. (1967). The theory of island biogeography (Vol. 1). Princeton University Press.
Millsap, B. A., Gore, J. A., Runde, D. E., & Cerulean, S. I. (1990). Setting priorities for the conservation of fish and wildlife species in Florida. Wildlife Monographs, 3-57. http://www.jstor.org/stable/3830656
Santos, J. (2015a) Conservation Science 1 - Populations. Lecture compilation. Norwegian College of Fishery Sciences, University of Tromsø, Norway.
Santos, J. (2015b) Conservation Science 1 - Communities. Lecture compilation. Norwegian College of Fishery Sciences, University of Tromsø, Norway.
Williams, I. D., & Polunin, N. V. (2000). Differences between protected and unprotected reefs of the western Caribbean in attributes preferred by dive tourists. Environmental Conservation, 27(04), 382-391. http://dx.doi.org/10.1017/S0376892900000436
Williams, P. H., Moore, J. L., Toham, A. K., Brooks, T. M., Strand, H., D'amico, J., ... & Rahbek, C. (2003). Integrating biodiversity priorities with conflicting socio-economic values in the Guinean–Congolian forest region. Biodiversity & Conservation, 12(6), 1297-1320. http://dx.doi.org/10.1023/A:1023092100942
Wilson, E. O., & Bossert, W. H. (1971). A primer of Population Biology (Vol. 3, No. 4.2). Sunderland: Sinauer Associates.
CONΣERV IT 1.0 – STUDENT MANUAL
Jorge Santos 27
10 – Sources of images
Anoldent (2007) BZECAYE, Belize. Licensed under the Creative Commons Attribution-Share Alike 2.0 Generic license. https://commons.wikimedia.org/wiki/File:BZECAYE.jpg
Aquaimages (undated) Divers and a large Barrel Sponge, Roatan, Honduras. Licensed under the Creative Commons Attribution-Share Alike 2.5 Generic license. https://commons.wikimedia.org/wiki/File:Divers_and_a_large_Barrel_Sponge,_Roatan,_Honduras.jpg
Blackledge, A. (2011) Coral Reef, Belize 2. Licensed under the Creative Commons Attribution 2.0 Generic license. https://commons.wikimedia.org/wiki/File:Coral_Reef,_Belize_2.jpg
Charles & Clint (2005) Paracanthurus hepatus 1. Licensed under the Creative Commons Attribution-Share Alike 2.0 Generic license. https://commons.wikimedia.org/wiki/File:Paracanthurus_hepatus_1.jpg
Claros, E. (undated) Cayos cochinos (29). Public Domain. https://commons.wikimedia.org/wiki/File:Cayos_cochinos_(29).JPG
Cobb, J. N. (1900) Sturgeon fishery of Delaware River and Bay, Report of the United States Commissioner of Fisheries, 1899, Washington, DC: Government Printing Office. Public Domain. https://commons.wikimedia.org/wiki/File:FMIB_32667_Acipenser_Sturio_Linnaeus.jpeg
Diliff (2006) Georgia Aquarium - Giant Grouper edit. Licensed under the Creative Commons Attribution-Share Alike 3.0 Unported license. https://commons.wikimedia.org/wiki/File:Georgia_Aquarium_-_Giant_Grouper_edit.jpg
Edwards, P. (2012) Town of Ocho Rios. Licensed under the Creative Commons Attribution-Share Alike 3.0 Unported license. https://commons.wikimedia.org/wiki/File:Town_of_Ocho_Rios.JPG
Gardieff, S. (2003) "Atlantic blue marlin" by NOAA -. Atlantic Blue Marlin. Florida Museum of Natural History. Licensed under Public Domain via Wikimedia Commons https://commons.wikimedia.org/wiki/File:Atlantic_blue_marlin.jpg#/media/File:Atlantic_blue_marlin.jpg
Gratwicke, B. (2009) Sargassum triggerfish Xanthichthys ringens. Licensed under the Creative Commons Attribution-Share Alike 2.0 Generic license. https://commons.wikimedia.org/wiki/File:Sargassum_triggerfish_Xanthichthys_ringens.jpg
Islandmen (2012) Lachse im Aquarium des Norsk Villakssenter. Licensed under the Creative Commons Attribution 3.0 Unported license. https://commons.wikimedia.org/wiki/File:Villakssenter03.jpg
CONΣERV IT 1.0 – STUDENT MANUAL
Jorge Santos 28
Kubina, J. (2006) Carcharias taurus newport. Licensed under the Creative Commons Attribution-Share Alike 2.0 Generic license. https://commons.wikimedia.org/wiki/File:Carcharias_taurus_newport.jpg
Krimo18 (2014) Pelican Resting on a Boat. Licensed under the Creative Commons Attribution-Share Alike 4.0 International license. https://commons.wikimedia.org/wiki/File:Pelican_Resting_on_a_Boat.jpg
Naliaka, T. K. (2015) Whelk in West African Cuisine. Licensed under the Creative Commons Attribution-Share Alike 4.0 International license. https://commons.wikimedia.org/wiki/File:Edible_Mollusk_-_Whelk_in_West_African_Cuisine.jpg#file
Nikdahl (2009) GreenSeaTurtle-HolChanMarineReserve-Belize. Licensed under the Creative Commons Attribution-Share Alike 3.0 Unported license. https://commons.wikimedia.org/wiki/File:GreenSeaTurtle-HolChanMarineReserve-Belize.JPG#metadata
NOAA (2006) Sardine photo4 exp. U.S. National Oceanic and Atmospheric Administration. Public Domain. https://commons.wikimedia.org/wiki/File:Sardine_photo4_exp.jpg
NSW government (2013) Purple spotted gudgeon – Primefact. New South Wales Department of Primary Industries. http://www.dpi.nsw.gov.au/fisheries/species-protection/conservation/what-current/endangered-species/purple-spotted-gudgeon/purple-spotted-gudgeon
Pokrzyvinski, A. (2008) Fresh-caught smelt, Alaska. Licensed under the Creative Commons Attribution 2.0 Generic license. https://commons.wikimedia.org/wiki/File:Kuskokwim_Smelt.jpg
RioGTomlin (2010) Cayo Menor through forest. Licensed under the Creative Commons Attribution-Share Alike 3.0 Unported license. https://commons.wikimedia.org/wiki/File:Cayo_Menor_through_forest.jpg
Roatavani (2012) Chachauate 2012 WBT. Licensed under the Creative Commons Attribution-Share Alike 3.0 Unported license. https://commons.wikimedia.org/wiki/File:Chachauate_2012_WBT.jpg
Uxbona (2008) Maldives Parrotfish (Scaridae). Licensed under the Creative Commons Attribution-Share Alike 3.0 Unported license. https://commons.wikimedia.org/wiki/File:Maldives_Parrotfish_(Scaridae).jpg