CONE Midstream Quarterly Earnings Presentation - May 5, 2016
8
1Q 2016 Earnings May 5, 2016 CONE Midstream Partners LP
-
Upload
marcellus-drilling-news -
Category
News & Politics
-
view
136 -
download
0
Transcript of CONE Midstream Quarterly Earnings Presentation - May 5, 2016
1Q 2016 Earnings May 5, 2016
CONE Midstream Partners LP
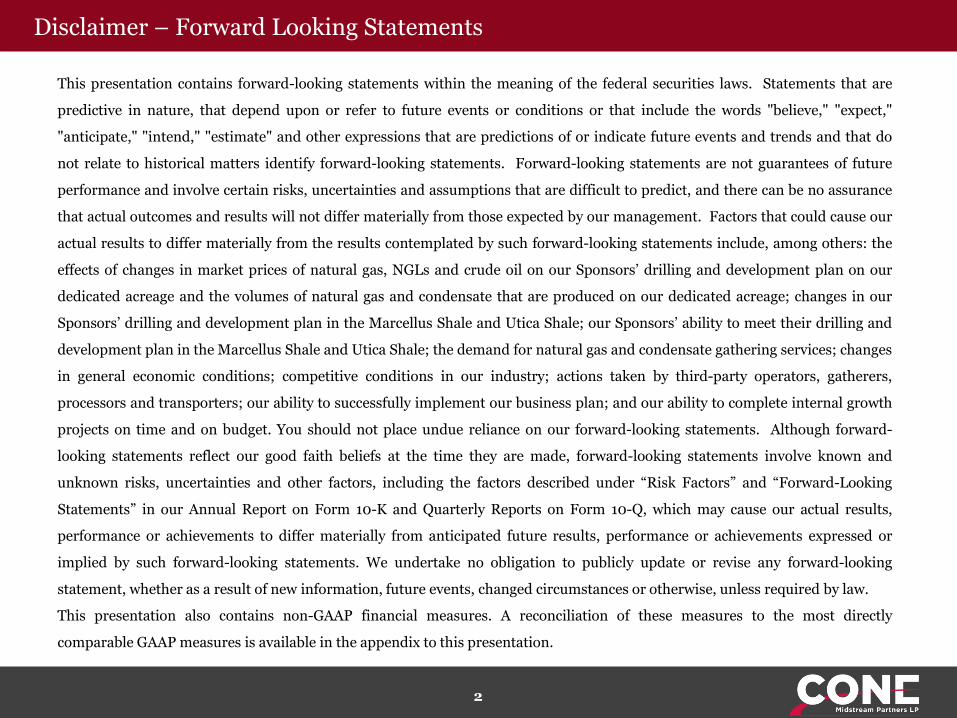
Disclaimer – Forward Looking Statements
2
This presentation contains forward-looking statements within the meaning of the federal securities laws. Statements that are
predictive in nature, that depend upon or refer to future events or conditions or that include the words "believe," "expect,"
"anticipate," "intend," "estimate" and other expressions that are predictions of or indicate future events and trends and that do
not relate to historical matters identify forward-looking statements. Forward-looking statements are not guarantees of future
performance and involve certain risks, uncertainties and assumptions that are difficult to predict, and there can be no assurance
that actual outcomes and results will not differ materially from those expected by our management. Factors that could cause our
actual results to differ materially from the results contemplated by such forward-looking statements include, among others: the
effects of changes in market prices of natural gas, NGLs and crude oil on our Sponsors’ drilling and development plan on our
dedicated acreage and the volumes of natural gas and condensate that are produced on our dedicated acreage; changes in our
Sponsors’ drilling and development plan in the Marcellus Shale and Utica Shale; our Sponsors’ ability to meet their drilling and
development plan in the Marcellus Shale and Utica Shale; the demand for natural gas and condensate gathering services; changes
in general economic conditions; competitive conditions in our industry; actions taken by third-party operators, gatherers,
processors and transporters; our ability to successfully implement our business plan; and our ability to complete internal growth
projects on time and on budget. You should not place undue reliance on our forward-looking statements. Although forward-
looking statements reflect our good faith beliefs at the time they are made, forward-looking statements involve known and
unknown risks, uncertainties and other factors, including the factors described under “Risk Factors” and “Forward-Looking
Statements” in our Annual Report on Form 10-K and Quarterly Reports on Form 10-Q, which may cause our actual results,
performance or achievements to differ materially from anticipated future results, performance or achievements expressed or
implied by such forward-looking statements. We undertake no obligation to publicly update or revise any forward-looking
statement, whether as a result of new information, future events, changed circumstances or otherwise, unless required by law.
This presentation also contains non-GAAP financial measures. A reconciliation of these measures to the most directly
comparable GAAP measures is available in the appendix to this presentation.
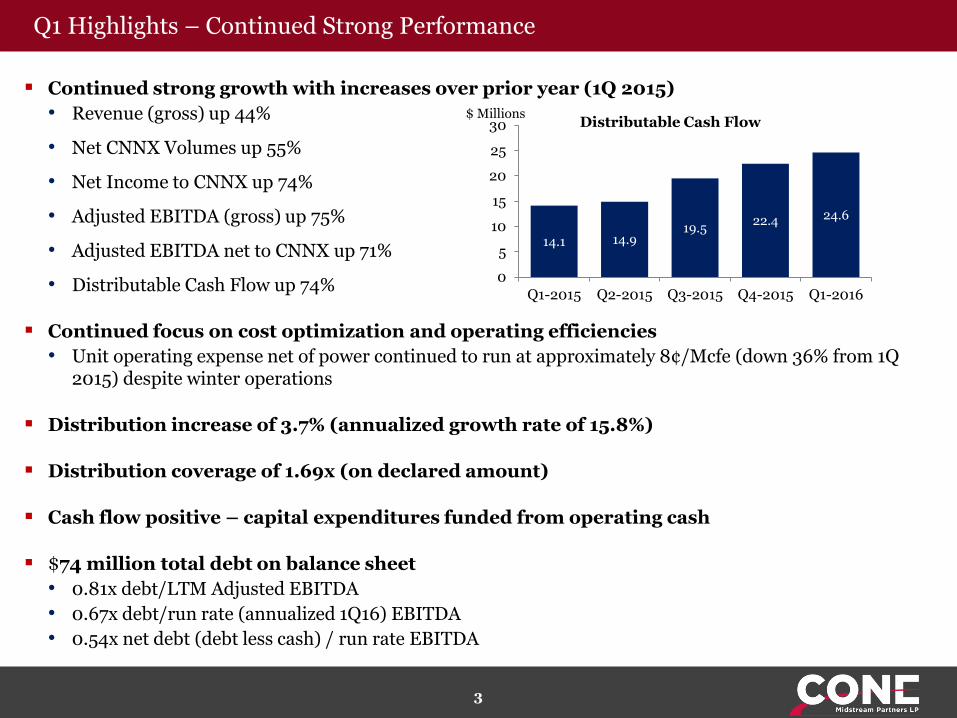
Continued strong growth with increases over prior year (1Q 2015)
• Revenue (gross) up 44%
• Net CNNX Volumes up 55%
• Net Income to CNNX up 74%
• Adjusted EBITDA (gross) up 75%
• Adjusted EBITDA net to CNNX up 71%
• Distributable Cash Flow up 74%
Continued focus on cost optimization and operating efficiencies
• Unit operating expense net of power continued to run at approximately 8¢/Mcfe (down 36% from 1Q 2015) despite winter operations
Distribution increase of 3.7% (annualized growth rate of 15.8%)
Distribution coverage of 1.69x (on declared amount)
Cash flow positive – capital expenditures funded from operating cash
$74 million total debt on balance sheet
• 0.81x debt/LTM Adjusted EBITDA
• 0.67x debt/run rate (annualized 1Q16) EBITDA
• 0.54x net debt (debt less cash) / run rate EBITDA
3
Q1 Highlights – Continued Strong Performance
14.1 14.9 19.5
22.4 24.6
0
5
10
15
20
25
30
Q1-2015 Q2-2015 Q3-2015 Q4-2015 Q1-2016
$ Millions Distributable Cash Flow
4
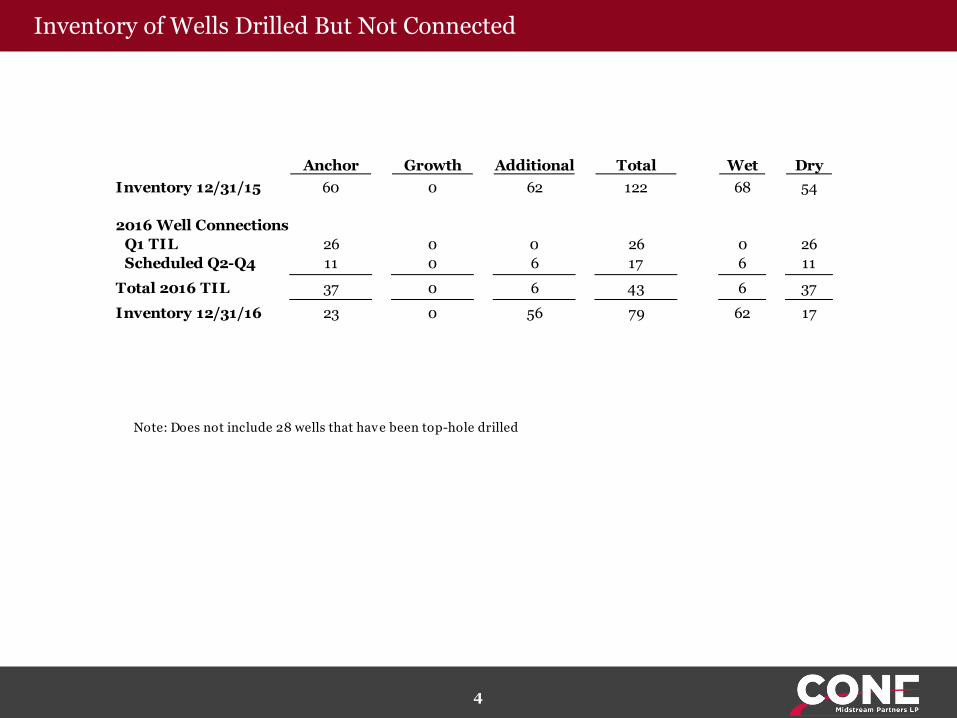
Inventory of Wells Drilled But Not Connected
Anchor Growth Additional Total Wet Dry
Inventory 12/31/15 60 0 62 122 68 54
2016 Well Connections
Q1 TIL 26 0 0 26 0 26
Scheduled Q2-Q4 11 0 6 17 6 11- - - - - -
Total 2016 TIL 37 0 6 43 6 37- - - - - -
Inventory 12/31/16 23 0 56 79 62 17
Note: Does not include 28 wells that have been top-hole drilled
5
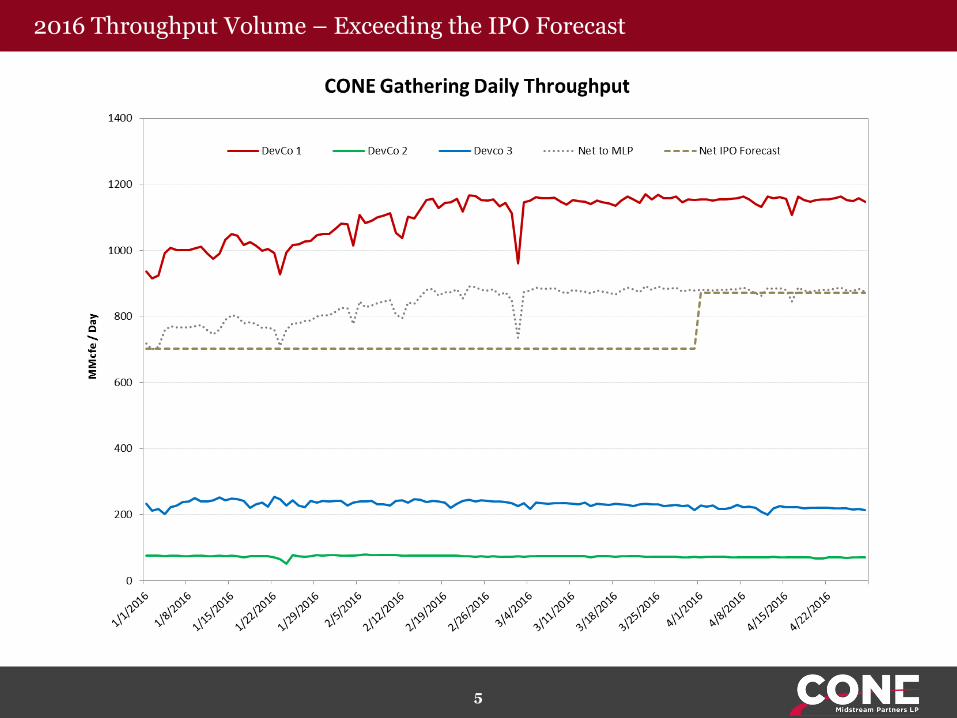
2016 Throughput Volume – Exceeding the IPO Forecast
6
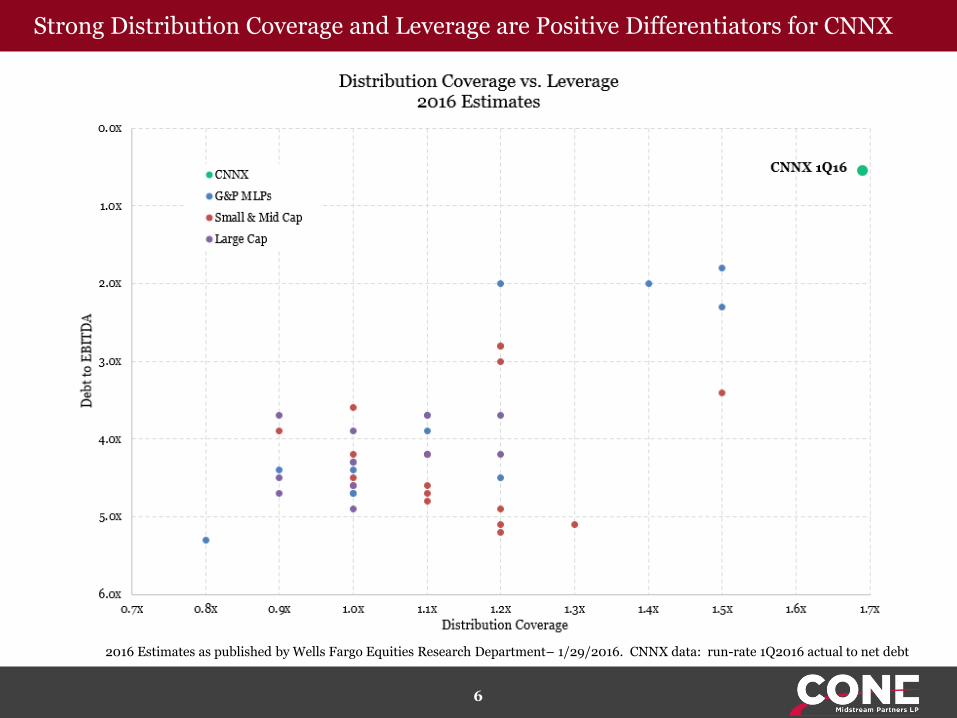
Strong Distribution Coverage and Leverage are Positive Differentiators for CNNX
2016 Estimates as published by Wells Fargo Equities Research Department– 1/29/2016. CNNX data: run-rate 1Q2016 actual to net debt
Appendix
8
Non-GAAP Financial Measures
Note: Totals may not foot due to rounding.
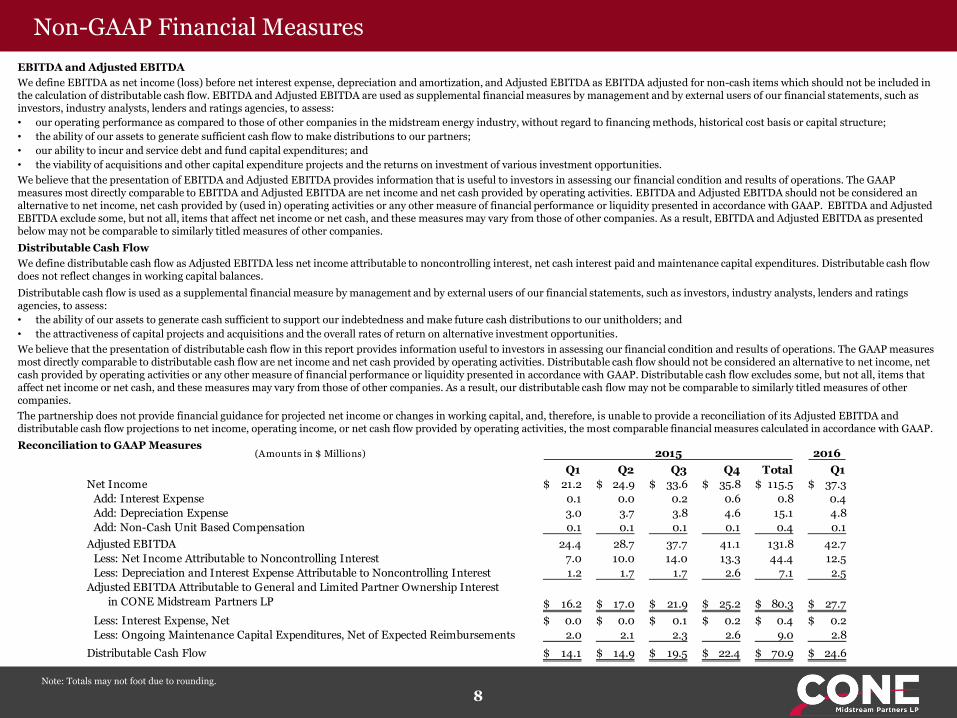
EBITDA and Adjusted EBITDA
We define EBITDA as net income (loss) before net interest expense, depreciation and amortization, and Adjusted EBITDA as EBITDA adjusted for non-cash items which should not be included in the calculation of distributable cash flow. EBITDA and Adjusted EBITDA are used as supplemental financial measures by management and by external users of our financial statements, such as investors, industry analysts, lenders and ratings agencies, to assess:
• our operating performance as compared to those of other companies in the midstream energy industry, without regard to financing methods, historical cost basis or capital structure;
• the ability of our assets to generate sufficient cash flow to make distributions to our partners;
• our ability to incur and service debt and fund capital expenditures; and
• the viability of acquisitions and other capital expenditure projects and the returns on investment of various investment opportunities.
We believe that the presentation of EBITDA and Adjusted EBITDA provides information that is useful to investors in assessing our financial condition and results of operations. The GAAP measures most directly comparable to EBITDA and Adjusted EBITDA are net income and net cash provided by operating activities. EBITDA and Adjusted EBITDA should not be considered an alternative to net income, net cash provided by (used in) operating activities or any other measure of financial performance or liquidity presented in accordance with GAAP. EBITDA and Adjusted EBITDA exclude some, but not all, items that affect net income or net cash, and these measures may vary from those of other companies. As a result, EBITDA and Adjusted EBITDA as presented below may not be comparable to similarly titled measures of other companies.
Distributable Cash Flow
We define distributable cash flow as Adjusted EBITDA less net income attributable to noncontrolling interest, net cash interest paid and maintenance capital expenditures. Distributable cash flow does not reflect changes in working capital balances.
Distributable cash flow is used as a supplemental financial measure by management and by external users of our financial statements, such as investors, industry analysts, lenders and ratings agencies, to assess:
• the ability of our assets to generate cash sufficient to support our indebtedness and make future cash distributions to our unitholders; and
• the attractiveness of capital projects and acquisitions and the overall rates of return on alternative investment opportunities.
We believe that the presentation of distributable cash flow in this report provides information useful to investors in assessing our financial condition and results of operations. The GAAP measures most directly comparable to distributable cash flow are net income and net cash provided by operating activities. Distributable cash flow should not be considered an alternative to net income, net cash provided by operating activities or any other measure of financial performance or liquidity presented in accordance with GAAP. Distributable cash flow excludes some, but not all, items that affect net income or net cash, and these measures may vary from those of other companies. As a result, our distributable cash flow may not be comparable to similarly titled measures of other companies.
The partnership does not provide financial guidance for projected net income or changes in working capital, and, therefore, is unable to provide a reconciliation of its Adjusted EBITDA and distributable cash flow projections to net income, operating income, or net cash flow provided by operating activities, the most comparable financial measures calculated in accordance with GAAP.
Reconciliation to GAAP Measures (Amounts in $ Millions) 2015 2016
Q1 Q2 Q3 Q4 Total Q1
Net Income 21.2$ 24.9$ 33.6$ 35.8$ 115.5$ 37.3$
Add: Interest Expense 0.1 0.0 0.2 0.6 0.8 0.4
Add: Depreciation Expense 3.0 3.7 3.8 4.6 15.1 4.8
Add: Non-Cash Unit Based Compensation 0.1 0.1 0.1 0.1 0.4 0.1
Adjusted EBITDA 24.4 28.7 37.7 41.1 131.8 42.7
Less: Net Income Attributable to Noncontrolling Interest 7.0 10.0 14.0 13.3 44.4 12.5
Less: Depreciation and Interest Expense Attributable to Noncontrolling Interest 1.2 1.7 1.7 2.6 7.1 2.5
Adjusted EBITDA Attributable to General and Limited Partner Ownership Interest
in CONE Midstream Partners LP 16.2$ 17.0$ 21.9$ 25.2$ 80.3$ 27.7$
Less: Interest Expense, Net 0.0$ 0.0$ 0.1$ 0.2$ 0.4$ 0.2$
Less: Ongoing Maintenance Capital Expenditures, Net of Expected Reimbursements 2.0 2.1 2.3 2.6 9.0 2.8
Distributable Cash Flow 14.1$ 14.9$ 19.5$ 22.4$ 70.9$ 24.6$