CONDOR PROJECT, ECUADORcanadianminingreport.com/company_resource/180710_NI43-101_Lu… · CONDOR...
131
CONDOR PROJECT, ECUADOR Amended and Restated NI 43-101 Technical Report Prepared for Lumina Gold Corp. 410 - 625 Howe Street Vancouver, British Columbia Canada V6C 2T6 Luminex Resources Corp. 410 - 625 Howe Street Vancouver, British Columbia Canada V6C 2T6 Authors and Qualified Persons Robert Sim, P.Geo. Bruce Davis, FAusIMM Effective Date May 14, 2018 Execution Date July 10, 2018
Transcript of CONDOR PROJECT, ECUADORcanadianminingreport.com/company_resource/180710_NI43-101_Lu… · CONDOR...

CONDOR PROJECT, ECUADOR
Amended and Restated NI 43-101 Technical Report
Prepared for
Lumina Gold Corp. 410 - 625 Howe Street Vancouver, British Columbia Canada V6C 2T6
Luminex Resources Corp. 410 - 625 Howe Street Vancouver, British Columbia Canada V6C 2T6
Authors and Qualified Persons Robert Sim, P.Geo. Bruce Davis, FAusIMM
Effective Date May 14, 2018
Execution Date July 10, 2018

Effective Date: May 14, 2018 TOC-i
Condor Project, Ecuador
NI 43-101 Technical Report
TABLE OF CONTENTS 1 SUMMARY ..................................................................................................................................... 1-1
2 INTRODUCTION ............................................................................................................................ 2-1
2.1 Abbreviations and Acronyms ........................................................................................... 2-2
3 RELIANCE ON OTHER EXPERTS ............................................................................................... 3-1
4 PROPERTY DESCRIPTION AND LOCATION .............................................................................. 4-1
4.1 Location ............................................................................................................................ 4-1
4.2 Land Tenure ..................................................................................................................... 4-1
4.3 Environmental Regulations and Permitting ...................................................................... 4-6
5 ACCESSIBILITY, CLIMATE, LOCAL RESOURCES, INFRASTRUCTURE & PHYSIOGRAPHY 5-1
5.1 Accessibility ...................................................................................................................... 5-1
5.2 Climate ............................................................................................................................. 5-2
5.3 Local Resources and Infrastructure ................................................................................. 5-2
5.4 Physiography ................................................................................................................... 5-4
6 HISTORY ....................................................................................................................................... 6-1
6.1 Historical Estimates.......................................................................................................... 6-3
6.1.1 Comments on Historical Estimates ...................................................................... 6-4
7 GEOLOGICAL SETTING AND MINERALIZATION ....................................................................... 7-1
7.1 Regional Geology............................................................................................................. 7-1
7.2 Local and Property Geology ............................................................................................ 7-3
7.2.1 Chinapintza Vein District ...................................................................................... 7-4
7.2.2 Condor Breccia Complex ..................................................................................... 7-4
7.2.3 Southern Porphyry Zone ...................................................................................... 7-4
7.3 Mineralization ................................................................................................................... 7-4
7.3.1 Chinapintza Vein District ...................................................................................... 7-4
7.3.2 Condor Breccia Complex ..................................................................................... 7-6
7.3.3 Southern Porphyry Zone .................................................................................... 7-15
8 DEPOSIT TYPES ........................................................................................................................... 8-1
9 EXPLORATION .............................................................................................................................. 9-1
9.1 Geochemistry ................................................................................................................... 9-1
9.2 Geophysics ...................................................................................................................... 9-8
10 DRILLING ..................................................................................................................................... 10-1
10.1 TVX Gold Inc. (1994–2000) ........................................................................................... 10-3
10.2 Goldmarca Ltd. (2004–2007) / Ecometals Ltd. (2007–2008)......................................... 10-3
10.3 Ecuador Gold and Copper Corp. (2012–2014) .............................................................. 10-3
10.4 Lumina Gold Corp. (2017–2018) ................................................................................... 10-3
10.5 Exploration Targets ........................................................................................................ 10-8
11 SAMPLE PREPARATION, ANALYSES AND SECURITY ........................................................... 11-1
11.1 TVX Gold Inc. (1994–2000) ........................................................................................... 11-1
11.2 Goldmarca Ltd. (2004–2007) / Ecometals Ltd. (2007–2008)......................................... 11-1
11.3 Ecuador Gold and Copper Corp. (2012–2014) .............................................................. 11-2

Effective Date: May 14, 2018 TOC-ii
Condor Project, Ecuador
NI 43-101 Technical Report
11.4 Lumina Gold Corp. (2017–2018) ................................................................................... 11-2
12 DATA VERIFICATION ................................................................................................................. 12-1
12.1 Database Validation ....................................................................................................... 12-1
12.1.1 Collar Coordinate Validation .............................................................................. 12-1
12.1.2 Downhole Survey Validation .............................................................................. 12-1
12.1.3 Assay Verification............................................................................................... 12-1
12.2 Geological Data Verification and Interpretation ............................................................. 12-1
12.3 QA/QC Protocol ............................................................................................................. 12-2
12.4 Assay Database Verification .......................................................................................... 12-2
12.5 Conclusion ..................................................................................................................... 12-3
13 MINERAL PROCESSING AND METALLURGICAL TESTING .................................................... 13-1
13.1 Condor Breccias ............................................................................................................. 13-1
13.2 Santa Barbara ................................................................................................................ 13-2
14 MINERAL RESOURCE ESTIMATE ............................................................................................. 14-1
14.1 Introduction .................................................................................................................... 14-1
14.2 Available Data ................................................................................................................ 14-1
14.3 Geological Model and Domains ..................................................................................... 14-8
14.4 Specific Gravity Data...................................................................................................... 14-9
14.5 Compositing ................................................................................................................. 14-10
14.6 Exploratory Data Analysis ............................................................................................ 14-10
14.6.1 Basic Statistics by Domain ............................................................................... 14-10
14.6.2 Contact Profiles ................................................................................................ 14-12
14.6.3 Conclusions and Modelling Implications .......................................................... 14-14
14.7 Evaluation of Outlier Grades ........................................................................................ 14-14
14.8 Variography .................................................................................................................. 14-15
14.9 Model Setup and Limits ............................................................................................... 14-18
14.10 Interpolation Parameters .............................................................................................. 14-19
14.11 Validation ..................................................................................................................... 14-20
14.11.1 Visual Inspection .......................................................................................... 14-20
14.11.2 Model Checks for Change of Support .......................................................... 14-21
14.11.3 Swath Plots (Drift Analysis) .......................................................................... 14-23
14.12 Resource Classification ............................................................................................... 14-25
14.13 Mineral Resources ....................................................................................................... 14-26
14.14 Sensitivity of Mineral Resources .................................................................................. 14-31
14.15 Summary and Conclusions .......................................................................................... 14-33
15 ADJACENT PROPERTIES .......................................................................................................... 15-1
16 OTHER RELEVANT DATA AND INFORMATION ....................................................................... 16-1
17 INTERPRETATION AND CONCLUSIONS .................................................................................. 17-1
18 RECOMMENDATIONS ................................................................................................................ 18-1
19 REFERENCES ............................................................................................................................. 19-1
20 DATE AND SIGNATURE PAGES ................................................................................................ 20-1
Effective Date: May 14, 2018 TOC-iii
Condor Project, Ecuador
NI 43-101 Technical Report
LIST OF FIGURES Figure 4-1: Location Map ........................................................................................................................... 4-1 Figure 4-2: Claim Map ................................................................................................................................ 4-5 Figure 5-1: Access to Condor Project ........................................................................................................ 5-1 Figure 5-2: Local Infrastructure .................................................................................................................. 5-3 Figure 7-1: Regional Geology Southern Ecuador ...................................................................................... 7-1 Figure 7-2: Local Geology Condor Project ................................................................................................. 7-3 Figure 7-3: Geology Chinapintza Vein District ........................................................................................... 7-5 Figure 7-4: Geology Condor Breccia Complex .......................................................................................... 7-6 Figure 7-5: Los Cuyes (Plan View) ............................................................................................................ 7-7 Figure 7-6: Los Cuyes (NE-SW Cross Section) ......................................................................................... 7-8 Figure 7-7: Soledad Zone (Plan View) ..................................................................................................... 7-10 Figure 7-8: Soledad (N-S Cross Section 769 450E) ................................................................................ 7-11 Figure 7-9: Enma (Plan View) .................................................................................................................. 7-13 Figure 7-10: Enma (E-W Section 95 5200N) ........................................................................................... 7-14 Figure 7-11: Santa Barbara (Plan View) .................................................................................................. 7-16 Figure 7-12: Santa Barbara (E-W Cross Section 954 4450N) ................................................................. 7-17 Figure 7-13: El Hito (Plan View) ............................................................................................................... 7-18 Figure 7-14: El Hito (E-W Cross Section 9544900N) .............................................................................. 7-19 Figure 9-1: Soil Geochemistry – Gold (Historical) ..................................................................................... 9-2 Figure 9-2: Soil Geochemistry – Copper (Historical) ................................................................................. 9-3 Figure 9-3: Soil Geochemistry – Molybdenum (Historical) ........................................................................ 9-4 Figure 9-4: Soil Geochemistry – Copper (Lumina) .................................................................................... 9-6 Figure 9-5: Soil Geochemistry – Gold (Lumina)......................................................................................... 9-7 Figure 9-6: IP Chargeability n=2 Condor Breccias .................................................................................... 9-9 Figure 9-7: IP Chargeability 200 m Santa Barbara .................................................................................. 9-10 Figure 10-1: Drill Collar Plan Map Condor Project ................................................................................... 10-2 Figure 10-2: Plan Map Santa Barbara ..................................................................................................... 10-5 Figure 10-3: Santa Barbara SE – SW-NE Cross Section ........................................................................ 10-6 Figure 10-4: Santa Barbara NE – SW-NE Cross Section ........................................................................ 10-7 Figure 10-5: Santa Barbara NW – SW-NE Cross Section ....................................................................... 10-8 Figure 14-1: Plan View of Drilling on the Condor Property ...................................................................... 14-2 Figure 14-2: Plan View of Gold Grades in Drilling in the Santa Barbara Deposit Area ........................... 14-4 Figure 14-3: Isometric View of Gold Grades in Drilling in the Santa Barbara Deposit Area .................... 14-4 Figure 14-4: Plan View of Gold Grades in Drilling in the Soledad, Los Cuyes, Enma and Chinapintza
Deposit Areas ........................................................................................................................................... 14-5 Figure 14-5: Isometric View of Gold Grades in Drilling in the Soledad, Los Cuyes, Enma and Chinapintza
Deposit Areas ........................................................................................................................................... 14-5 Figure 14-6: Gold Grade Shell Domain at Santa Barbara ....................................................................... 14-9 Figure 14-7: Gold Grade Shell Domains at Soledad, Los Cuyes and Enma ........................................... 14-9 Figure 14-8: Boxplots Comparing Sample Data Inside and Outside of the Grade Shell Domains ........ 14-12 Figure 14-9: Contact Profiles for Gold Inside vs. Outside Grade Shell Domains .................................. 14-13 Figure 14-10: Contact Profiles for Silver Inside vs. Outside Grade Shell Domains ............................... 14-13 Figure 14-11: Contact Profiles for Copper Inside vs. Outside Grade Shell Domains ............................ 14-14 Figure 14-12: Gold Grades in Model Blocks and Drill Holes at Santa Barbara and Soledad ................ 14-21 Figure 14-13: Gold Grades in Model Blocks and Drill Holes at Los Cuyes and Enma .......................... 14-21

Effective Date: May 14, 2018 TOC-iv
Condor Project, Ecuador
NI 43-101 Technical Report
Figure 14-14: Herco Grade/Tonnage Plots for Gold Models ................................................................. 14-22 Figure 14-15: Swath Plots of Gold OK and NN Models by Northing ..................................................... 14-24 Figure 14-16: Isometric View of Indicated and Inferred Mineral Resource at Santa Barbara ............... 14-29 Figure 14-17: Isometric View of Indicated and Inferred Mineral Resource at Santa Barbara ............... 14-29 Figure 14-18: Isometric View of Indicated and Inferred Mineral Resource at Soledad, Los Cuyes and
Enma ...................................................................................................................................................... 14-30 Figure 14-19: Isometric View of Indicated and Inferred Mineral Resource at Soledad, Los Cuyes and
Enma ...................................................................................................................................................... 14-30 Figure 15-1: Plan Map – Chinapintza Veins – Jerusalem Concession .................................................... 15-1
LIST OF TABLES Table 1.1: Estimate of Mineral Resources Condor Project ........................................................................ 1-7 Table 1.2: Phase one exploration budget .................................................................................................. 1-9 Table 1.3: Phase two exploration budget ................................................................................................... 1-9 Table 2.1: Abbreviations and Acronyms .................................................................................................... 2-2 Table 4.1: Lumina Corporate Structure Prior to Effective Date of the Arrangement ................................. 4-2 Table 4.2: Lumina and Luminex Corporate Structure after Effective Date of the Arrangement ................ 4-3 Table 4.3: Mining Concessions Condor Project ......................................................................................... 4-4 Table 6.1: History of Ownership ................................................................................................................. 6-1 Table 6.2: History of Exploration ................................................................................................................ 6-2 Table 6.3: Historical Estimates................................................................................................................... 6-4 Table 7.1: Regional Stratigraphy Zamora Cu-Au Belt ............................................................................... 7-2 Table 7.2: Mineralized Zones for Selected Los Cuyes Drill Holes shown in Figure 7-6 ............................ 7-9 Table 7.3: Mineralized Zones for Selected Soledad Drill Holes shown in Figure 7-8 .............................. 7-12 Table 7.4: Mineralized Zones for Selected Enma Drill Holes shown in Figure 7-10................................ 7-15 Table 9.1: Geophysical Surveys Condor Project ....................................................................................... 9-8 Table 9.2: Untested Exploration Targets Condor Project ........................................................................ 9-11 Table 10.1: Drilling by Company Condor Project ..................................................................................... 10-1 Table 10.2: Drilling by Area Condor Project ............................................................................................. 10-1 Table 10.3: Drill Collar Locations – Lumina 2017-2018 ........................................................................... 10-4 Table 13.1: Composites at Santa Barbara for Metallurgical Testing (2013) ............................................ 13-2 Table 14.1: Summary of Sample Data by Type and Deposit Area .......................................................... 14-3 Table 14.2: Summary of Basic Statistics of Sample Data in the Santa Barbara Deposit Area .............. 14-7 Table 14.3: Summary of Basic Statistics of Sample Data in the Soledad Deposit Area ........................ 14-7 Table 14.4: Summary of Basic Statistics of Sample Data in the Los Cuyes Deposit Area .................... 14-7 Table 14.5: Summary of Basic Statistics of Sample Data in the Enma Deposit Area ............................ 14-7 Table 14.6: Treatment of Outlier Sample Data ...................................................................................... 14-15 Table 14.7: Variogram Parameters – Santa Barbara ............................................................................ 14-16 Table 14.8: Variogram Parameters – Soledad....................................................................................... 14-17 Table 14.9: Variogram Parameters – Los Cuyes ................................................................................... 14-17 Table 14.10: Variogram Parameters – Enma ........................................................................................ 14-18 Table 14.11: Block Model Limits ............................................................................................................ 14-18 Table 14.12: Interpolation Parameters – Santa Barbara ....................................................................... 14-19 Table 14.13: Interpolation Parameters – Soledad ................................................................................. 14-19 Table 14.14: Interpolation Parameters – Los Cuyes ............................................................................. 14-20 Table 14.15: Interpolation Parameters – Enma ..................................................................................... 14-20 Table 14.16: Estimate of Mineral Resources ......................................................................................... 14-28

Effective Date: May 14, 2018 TOC-v
Condor Project, Ecuador
NI 43-101 Technical Report
Table 14.17: Sensitivity of Mineral Resource to Cut-off Grade (All Deposits Combined) ..................... 14-31 Table 14.18: Sensitivity of Mineral Resource to Cut-off Grade (Santa Barbara) ................................... 14-32 Table 14.19: Sensitivity of Mineral Resource to Cut-off Grade (Soledad, Los Cuyes, Enma) .............. 14-33 Table 15.1: Resources on the Jerusalem Concession ............................................................................ 15-2 Table 18.1: Phase one exploration budget .............................................................................................. 18-1 Table 18.2: Phase two exploration budget ............................................................................................... 18-1

Effective Date: May 14, 2018 1-1
Condor Project, Ecuador
NI 43-101 Technical Report
1 SUMMARY
This Technical Report provides an updated mineral resource estimate for the Condor
Project of Lumina Gold Corp. (Lumina) in Ecuador. This Report was prepared by Robert
Sim, P.Geo., and Bruce Davis, FAusIMM. Both are independent “qualified persons” (QPs)
as defined by Canadian Securities Administrators National Instrument 43-101 Standards of
Disclosure for Mineral Projects (NI 43-101) and as described in Section 28 (Date and
Signature Pages) of this Report.
Property Description and Location
The Condor Project is located in southeastern Ecuador (Figure 4-1), 40 km east of the town
of Zamora and 70 km east of the city of Loja. Access to the property is provided by paved
and gravel roads. The approximate centre of the property is located at 9548000 North and
769000 East (geographic projection: Provisional South American Datum 1956, UTM Zone
17S).
Ownership
The Project consists of nine contiguous mining concessions with a total area of 10,101.09
ha. Lumina owns 100% interest in all concessions except for Viche Conguime I, II, II, Hitobo
and Chinapintza where the Instituto de Seguridad Social de las Fuerzas Armadas (pension
fund for Ecuador’s armed forces personnel) (ISSFA) owns 10%. The Project was previously
owned by Ecuador Gold and Copper Corp. which was acquired by Lumina on November 1,
2016.
Lumina currently holds the Condor Project through its wholly-owned subsidiary, Luminex
Resources Corp. (“Luminex”). Lumina intends to spin out Luminex to its shareholders
through a plan of arrangement under section 288 of the Business Corporations Act (British
Columbia) (the “Arrangement”). Pursuant to the Arrangement, shareholders of Lumina will
receive common shares of Luminex in proportion to their shareholdings in Lumina, after
which time the Condor Project will be owned by Luminex as a separate entity from Lumina.
History
Gold has been identified in the area since pre-Columbian times, and informal miners have
been working in the area since 1984. Modern exploration of the Project area commenced in
1988 when the ISSFA/Prominex U.K. joint venture carried out stream sediment sampling
and geological mapping programs. This work discovered most of the mineralized prospects.
Prominex U.K. withdrew from the Project in 1991 and was replaced by TVX Gold Inc. (TVX)
in 1993. During the period from 1993 to 2000, an extensive surface exploration program
consisting of soil and rock sampling, trenching, IP, CSAMT and magnetic surveys was
completed on the Project. Drill programs (195 holes, 42,101.5 m) tested the Chinapintza,
Los Cuyes, San Jose, Soledad, Guayas and Enma epithermal gold showings and the Santa
Barbara and El Hito porphyry occurrences. In addition, TVX completed 1,081 m of

Effective Date: May 14, 2018 1-2
Condor Project, Ecuador
NI 43-101 Technical Report
underground development which explored the Chinapintza veins. In 2000, TVX withdrew
from the Project because it did not have the potential to meet TVX’s corporate objectives.
In 2002, Goldmarca Ltd. (Goldmarca) formed a joint venture with ISSFA and continued to
explore the Project. Between 2002 and 2008, Goldmarca completed geological mapping, IP
and magnetic surveys, and drilled the Los Cuyes, Soledad, Enma and San Jose gold zones
(154 holes; 33,322.9 m). In 2007, Goldmarca changed its name to Ecometals Ltd.
(Ecometals).
From April 2008 to November 2009, the Ecuadorian government imposed a country-wide
moratorium on exploration, so no work was completed on the property during that time.
In 2010, Ecometals sold its interest in the Project to Ecuador Capital, which was
subsequently renamed Ecuador Gold and Copper Corp. (EGX). During the period from
2012 to 2016, EGX completed geological mapping and rock sampling at Santa Barbara and
El Hito, and diamond drilling (37 holes; 22,051.7 m) at Los Cuyes, Soledad, El Hito and
Santa Barbara. In 2015, a preliminary economic assessment (PEA) was completed for the
Santa Barbara project (Short et al., 2015). On November 1, 2016 EGX was acquired by
Lumina.
From 2016 to the effective date of this Report, Lumina has completed additional geological
mapping, soil and rock sampling and IP surveys. Lumina also drilled 9 holes (1,907.4 m)
which tested soil and IP chargeability anomalies peripheral to the Santa Barbara zone.
Status of Exploration
The Condor Project is an exploration project which has seen extensive, historical
geochemical (streams, soils and rocks) and geophysical surveys. Drilling has identified
mineralized zones at Chinapintza, Los Cuyes, Soledad, Enma, Santa Barbara and El Hito.
Geology and Mineralization
The Condor Project is located in the Zamora Cu-Au belt which also hosts the Fruta del
Norte epithermal gold deposit and the Mirador, Mirador Norte, Panantza and San Carlos
porphyry copper deposits.
The dominant geological feature of this belt is the Zamora batholith, a 100 km wide, Middle
to Late Jurassic (153–169 Ma) calc-alkaline, I-type intrusion that is exposed along a 200 km
north-northeast trend. The batholith consists of equigranular, medium-grained granodiorite
and younger subvolcanic porphyritic (albite-hornblende-±quartz) intrusions of andesitic to
dacitic composition. These porphyritic intrusions form every 15 to 20 km along the axis of
the Zamora batholith and are commonly associated with copper and gold mineralization.
The Zamora batholith intrudes Jurassic volcano-sedimentary formations and is overlain by
sediments of the Early Cretaceous Hollin formation and rhyolitic to dacitic pyroclastic
volcanics and intrusions of the Early Cretaceous Chinapintza formation. Dominant north-
south-trending faults control the emplacement of the Zamora batholith, and a series of
younger northeast-, northwest- and east-northeast-trending structures control the
emplacement of younger intrusions.

Effective Date: May 14, 2018 1-3
Condor Project, Ecuador
NI 43-101 Technical Report
Low sulphidation epithermal gold occurrences associated with the Chinapintza formation
occur in the northern part of the Condor Project. This includes the Chinapintza vein system
which consists of a number of narrow (<0.3 to 2 m), northwest-trending, high-grade gold
veins. These veins are characterized by open-space fillings, exhibit colloform and drusy
textures, and are sulphide-rich. The dominant sulphides are pyrite, sphalerite and galena.
Gold occurs in its native form and associated with the alloy electrum. A series of gold-rich
breccias and diatremes is located immediately south of the Chinapintza vein system. The
main occurrences are Los Cuyes, Soledad and Enma. Higher gold grades in these zones
are associated with veins of massive sphalerite, pyrite and marcasite.
Porphyry-style mineralization occurs in the southern part of the Condor Project. This
includes the Santa Barbara Au-Cu and El Hito Cu-Mo deposits. At Santa Barbara,
mineralization is hosted in andesites and is associated with a stockwork of quartz veins and
potassic alteration consisting of secondary biotite and K-feldspar. Disseminated and vein-
hosted mineralization is dominated by pyrite with lesser chalcopyrite, sphalerite and
pyrrhotite. The mineralized zone has dimensions of 1.2 km north-south, 500 m east-west
and extends to a depth of at least 500 m.
The mineralization at El Hito is hosted within a quartz stockwork zone developed in a
dioritic phase of the Zamora batholith. Moderate to strong phyllic-argillic alteration
consisting of illite-sericite-pyrite and an early potassic phase consisting of fine-grained
secondary biotite and K-feldspar are present. Overall sulphide content is low (<5%), and
chalcopyrite is the dominant sulphide with lesser amounts of pyrite, molybdenite and
bornite. The mineralized zone is 2.5 km (north-south) by 1.0 km (east-west) and extends to
vertical depths of at least 600 m.
Sample Database and Validation
A review of the sample collection and analysis practices used during the various drilling
campaigns indicates that this work was conducted using generally accepted industry
procedures.
Portions of the data have been validated using several methods, including visual
observations and direct comparisons with assay certificates. Only the sampling programs
conducted by Goldmarca/Ecometals, EGX and Lumina were monitored using a QA/QC
program that is typically accepted in the industry. The data similarities between all the
drilling campaigns (location, style, and tenor) suggest that there is no reason to question
the results from the earlier drill programs. It is the QPs' opinion that the database is
sufficiently accurate and precise to generate a mineral resource estimate.
Metallurgy
There have been several metallurgical studies conducted on the various mineralized zones
of the Condor Project. In 1995, two composite samples from the San Jose epithermal gold
breccias were processed at CIMM in Santiago, Chile. Tests included: grinding studies,
column leach tests, direct cyanidation of the mineralized material, and flotation tests
followed by cyanidation of the concentrate. Preliminary Bond grinding indices ranged from

Effective Date: May 14, 2018 1-4
Condor Project, Ecuador
NI 43-101 Technical Report
11.0 to 11.5 kWh/sht. Column leach tests (similar to what would be seen in a heap leach
operation) on -½ and -¼ inch material produced gold recoveries of 65% to 69% and 72% to
79%, respectively. Higher recoveries are associated with the finer-sized particles. Direct
cyanidation of the mineralized material yielded gold recoveries ranging between 84% and
93%. A 20-minute flotation test provided a concentrate with 28 g/t Au and 45 g/t Ag.
Cyanidation of the concentrate without regrinding yielded high gold recoveries (93% to
97%).
In 2004, six composites for the Los Cuyes (four samples) and San Jose (two samples)
zones were tested for direct cyanidation. The samples were in contact with cyanide
solutions for 72 and 96 hours, respectively. Recoveries were very high, ranging from 82%
to 98% for gold and 74% to 95% for silver.
In 2006, a composite sample from the San Jose zone was tested at IML in Western
Australia. Whole mineralized material leach tests yielded gold recoveries ranging from 63%
to 73%. Higher gold recoveries (88% to 92%) were achieved using a combination of gravity
and flotation, regrind, and cyanide leaching.
In 2008, cyanide bottle roll tests were completed on 64 samples from various mineral
occurrences on the Condor Project. This work was completed by G&T Metallurgical
Services Ltd. in Kamloops, Canada. A summary of this work is as follows:
The low-grade samples (less than 0.3 g/t Au) leached very poorly. On average,
10% of the gold and 6% of the silver were recovered.
The medium-grade composites (0.3 to 1.0 g/t Au) yielded recoveries of 48% for
gold and 17% for silver.
For samples with greater than 1 g/t Au, the leach performance improved to 58%
for gold and 20% for silver.
Of the variables investigated, the gold grade had a marginal effect on leaching
performance. In general, the maximum gold recovery reached a plateau at 60%.
There are no correlations between gold leaching performance and sulphur-feed
grade.
In 2013, samples from the Santa Barbara deposit were tested at Phillips Enterprises LLC
(Phillips) in Golden, Colorado and Resource Development Inc. (RDi) in Denver, Colorado. A
summary of this work is as follows:
Bond mill grindability tests on composites 2 and 3 confirmed that the rock is hard
with ball mill work indices of 24.97 and 22.07 kWh/mt, respectively.
Carbon-in-leach processing will extract 85.4% of the gold.
Gold is not refractory and can be recovered by cyanidation without the need for
oxidation processes.
Consumption of lime and cyanide are relatively low.
Whole mineralized material cyanidation tests suggest that gold extraction is
sensitive to grind size: finer grinding yields higher recoveries. Gold extraction at

Effective Date: May 14, 2018 1-5
Condor Project, Ecuador
NI 43-101 Technical Report
48 hours is approximately 85% for all the composite samples. Silver content in
the mineralized material is low, and silver recoveries of approximately 20% can
be expected. Gold dissolves quickly with maximum extraction occurring between
12 and 24 hours’ residence time.
Sequential copper analyses by RDi indicated that 4.6% of the copper is acid
soluble (i.e., oxide), 4.0% of the copper is cyanide soluble (i.e., secondary), and
the remaining 91.4% is primarily chalcopyrite.
Rougher flotation tests produced a concentrate mass of 10.9% of the feed with
recoveries of 65.3% for gold, 80.6% for copper, and 70.7% for silver.
There are no deleterious elements present.
The proposed processing method for Santa Barbara includes a flotation circuit to produce a
copper concentrate with gold credits followed by a carbon-in-pulp circuit for the flotation
tailings to recover gold and silver. The loaded carbon would pass through an elution and
acid wash, and gold and silver would be recovered by electrowinning and subsequent
smelting to produce doré.
Based on the metallurgical work, overall recoveries for the Project are estimated to be 87%
for gold, 80% for copper and 60% for silver.
Mineral Resource Estimate
The mineral resource estimate was generated using drill hole and trench sample assay
results and the interpretation of geological models which relate to the spatial distribution of
gold, silver and copper. Interpolation characteristics were defined based on the geology,
drill hole spacing, and geostatistical analysis of the data. Estimations are made from 3D
block models based on geostatistical applications using commercial mine planning software
(MineSight™ v12.50).
Grade estimates were generated using ordinary kriging into a model with a nominal block
size of 10 × 10 × 10 m (L×W×H). Potentially anomalous outlier grades have been identified,
and their influences on the grade models are controlled during interpolation through the use
of top-cutting and outlier limitations. An average density of 2.65 t/m3 was used to calculate
resource tonnage at Los Cuyes, Soledad and Enma. Specific gravity data was available for
Santa Barbara. The average value was 2.73 t/m3, and a default value of 2.65 t/m3 was used
for all blocks without an actual value.
The results of the modelling process have been validated using a series of visual and
statistical methods. These validation results indicate that the estimated gold, silver and
copper in the models appear to be a valid representation of the underlying database.
The mineral resources for the Condor Project were classified in accordance with the CIM
Definition Standards for Mineral Resources and Mineral Reserves (May 2014). The
classification parameters are defined relative to the distance between gold sample data and
are intended to encompass zones of reasonably continuous mineralization that exhibit the
desired degree of confidence. Classification parameters are based primarily on the nature

Effective Date: May 14, 2018 1-6
Condor Project, Ecuador
NI 43-101 Technical Report
of the distribution of gold data because gold is the main contributor to the relative value of
these polymetallic deposits.
A drill hole spacing study was conducted for the Condor deposits that determines the
reliability of mineral resource estimates at various drill hole spacings. The results indicate
that at Santa Barbara, the tonnes and grade of volumes equivalent to annual production
(approximately 10M tonnes) can be estimated with ±15% uncertainty 90% of the time when
drill holes are spaced on a nominal 75 m grid pattern. At Soledad, Los Cuyes and Enma,
gold grades tend to be more variable, and, as a result, drill holes are required on a 50 m
grid pattern to provide annual estimates at ±15% uncertainty 90% of the time.
At Santa Barbara, mineral resources in the Indicated category are estimated using three or
more drill holes that are spaced at a maximum distance of 75 m. At Soledad, Los Cuyes
and Enma, mineral resources in the Indicated category are estimated using at least three
drill holes that are spaced at a maximum distance of 50 m. Mineral resources in the Inferred
category include model blocks that do not meet the criteria for Indicated class resources but
are within a maximum distance of 100 m from a drill hole at Santa Barbara, or within a
maximum distance of 75 m from a drill hole at Soledad, Los Cuyes and Enma.
The economic viability of the mineral resource was tested by constraining it within a floating
cone pit shell; the pit shell was generated using the following projected economic and
technical parameters:
Metal prices: gold $1,400/oz; silver $17.00/oz; copper $3.25/lb
Metallurgical recoveries: gold 87%; silver 60%; copper 80%
Pit slope: 45 degrees
Operating costs:
o Mining (open pit) $3.00/t.
o Processing $11.00/t.
o G&A $2.00/t.
Based on the metal prices and recoveries listed here, recoverable gold equivalent (AuEqR)
grades are calculated using the following formula:
AuEqR = (Au g/t∗0.87) + (Ag g/t∗0.60∗0.0122) + (Cu%∗0.80∗1.592)
The pit shell is generated using a floating cone algorithm based on the AuEqR block
grades. There are no adjustments for mining recoveries or dilution. This test indicates that
some of the deeper mineralization may not be economic due to the increased waste-
stripping requirements. It is important to recognize that these discussions of surface mining
parameters are used solely to test the “reasonable prospects for eventual economic
extraction”, and they do not represent an attempt to estimate mineral reserves. There are
no mineral reserves calculated for the Condor Project.
The estimate of mineral resources, contained within the $1,400/oz Au pit shell, is presented
in Table 1.1. Based on the assumed metal prices and operating costs and using a formula

Effective Date: May 14, 2018 1-7
Condor Project, Ecuador
NI 43-101 Technical Report
similar to the one shown here (but excluding the metallurgical recovery factors), the base
case cut-off grade for mineral resources is estimated to be 0.35 g/t gold equivalent (AuEq).
There are no known factors related to environmental, permitting, legal, title, taxation, socio-
economic, marketing, or political issues which could materially affect the mineral resource.
Mineral resources in the Inferred category have a lower level of confidence than that
applied to Indicated mineral resources, and, although there is sufficient evidence to imply
geologic grade and continuity, these characteristics cannot be verified based on the current
data.
It is reasonably expected that the majority of Inferred mineral resources could be upgraded
to Indicated mineral resources with continued exploration.
Table 1.1: Estimate of Mineral Resources Condor Project
Deposit Mtonnes
Average Grade Contained Metal
AuEq (g/t)
Au (g/t)
Ag (g/t)
Cu (%)
AuEq (Moz)
Au (Moz)
Ag (Moz)
Cu (Mlbs)
Indicated
Santa Barbara
13.3 0.78 0.63 0.7 0.09 0.33 0.27 0.28 27
Soledad 11.6 0.81 0.72 5.3 0.01 0.30 0.27 1.95 3
Los Cuyes 38.6 0.77 0.68 5.5 0.02 0.95 0.84 6.86 13
Enma 0.4 0.91 0.76 11.9 0.01 0.01 0.01 0.14 0
Total Indicated
63.8 0.78 0.68 4.5 0.03 1.60 1.39 9.23 43
Inferred
Santa Barbara
119.0 0.69 0.52 0.9 0.10 2.62 1.99 3.52 255
Soledad 2.8 0.59 0.54 3.1 0.01 0.05 0.05 0.27 1
Los Cuyes 22.7 0.73 0.65 5.7 0.01 0.53 0.48 4.12 4
Enma 0.0 1.26 1.12 10.4 0.01 0.00 0.00 0.01 0
Total Inferred
144.5 0.69 0.54 1.7 0.08 3.21 2.51 7.92 260
Note: Limited inside $1,400/oz Au pit shell. Base case cut-off is 0.35 g/t gold equivalent (AuEq). Mineral resources
are not mineral reserves because the economic viability has not been demonstrated.
At El Hito, the limited drilling (nine holes) is too widely spaced to support an estimate of
mineral resources. An exploration target has been estimated based on the assumption that
the mineralization is continuous between drill holes and extends to depths between 150 m
and 300 m below the surface. The El Hito exploration target is 150 to 250M tonnes with
0.25% to 0.35% Cu and 0.003% to 0.005% Mo. This exploration target is not a mineral

Effective Date: May 14, 2018 1-8
Condor Project, Ecuador
NI 43-101 Technical Report
resource estimate and is conceptual in nature. There has been insufficient exploration to
define a mineral resource, and it is uncertain whether further exploration will result in the
delineation of a mineral resource.
At Chinapintza, over 100 drill holes and numerous surface trenches have tested gold-
bearing quartz veins over a 1 km by 1 km area and to depths of 250 m below the surface.
There is insufficient geologic information to support an interpretation of the numerous gold-
bearing veins, and, as a result, an estimate of mineral resources is not currently feasible at
Chinapintza. An exploration target has been estimated based on the assumption that the
mineralization is continuous between drill holes. It consists of approximately 700k to
1,000k tonnes with 2 to 4 g/t Au which contains 50k to 130k ounces of gold. Only the
southern half of this zone occurs on the Condor Project. This exploration target is not a
mineral resource estimate and is only conceptual in nature. There has been insufficient
exploration to define a mineral resource, and it is uncertain whether further exploration will
result in the delineation of a mineral resource.
Conclusions
Based on the evaluation of the data available from the Condor Project, the authors of this
Report have drawn the following conclusions:
At the effective date of this Report (May 14, 2018), the Condor Project consists of
9 contiguous mining concessions totaling 10,101.09 ha. Lumina owns 100%
interest in all concessions except for Viche Conguime I, II, II, Hitobo and
Chinapintza where the Instituto de Seguridad Social de las Fuerzas Armadas
(ISSFA) owns 10%.
Low sulphidation epithermal gold mineralization in the northern part of the
Condor Project is associated with diatreme breccia pipes at Los Cuyes, Soledad
and Enma and narrow quartz-sulphide veins at Chinapintza.
The Santa Barbara Au-Cu and El Hito Cu-Mo porphyry deposits are associated
with dioritic intrusions in the southern part of the Condor Project.
Drilling of four deposits—Santa Barbara, Los Cuyes, Soledad and Enma—has
outlined a combined Indicated mineral resource estimate of 63.8M tonnes at 0.68
g/t Au, 4.5 g/t Ag and 0.03% Cu which contains 1.39M ounces of gold,
9.23M ounces of silver and 43M lbs of copper, and a combined Inferred mineral
resource estimate of 144.5M tonnes at 0.54 g/t Au, 1.7 g/t Ag and 0.08% Cu
which contains 2.51M ounces of gold, 7.92M ounces of silver and 260M lbs of
copper.
Preliminary metallurgical work indicates that the low sulphidation epithermal gold
deposits can be processed using gravity, flotation and cyanidation of the flotation
concentrates. The Santa Barbara mineralization can be processed using flotation
to produce a copper concentrate with gold credits and CIP processing to recover
additional gold from the flotation tailings.

Effective Date: May 14, 2018 1-9
Condor Project, Ecuador
NI 43-101 Technical Report
There are no known factors related to metallurgical, environmental, permitting,
legal, title, taxation, socio-economic, marketing or political issues which could
materially affect the mineral resource estimates or exploration data presented.
The primary risks at the Project are confined to metals prices and Ecuador’s
fiscal treatment of mining projects.
Recommendations
The following two phase work program is recommended for this project:
Phase 1: Conduct additional drilling to assess the soil and geophysical anomalies that
occur proximal to the Santa Barbara deposit. The estimated budget for this 4,500 m drill
program is $1.4 million.
Table 1.2: Phase one exploration budget
Phase 1
4,500m diamond drill program $1,400,000
Total $1,400,000
Phase 2: Contingent on the results from Phase 1, conduct additional geochemical and
geophysical surveys and drilling to assess the untested exploration targets on the
Condor Project. The estimated budget for the ground surveys and a 2,000 m drill
program is $0.9 million.
Table 1.3: Phase two exploration budget
Phase 2
Induced Polarisation survey $200,000
Surface soil and rock sampling program $100,000
2,000m diamond drill program $600,000
Total $900,000
Effective Date: May 14, 2018 1-1
Condor Project, Ecuador
NI 43-101 Technical Report
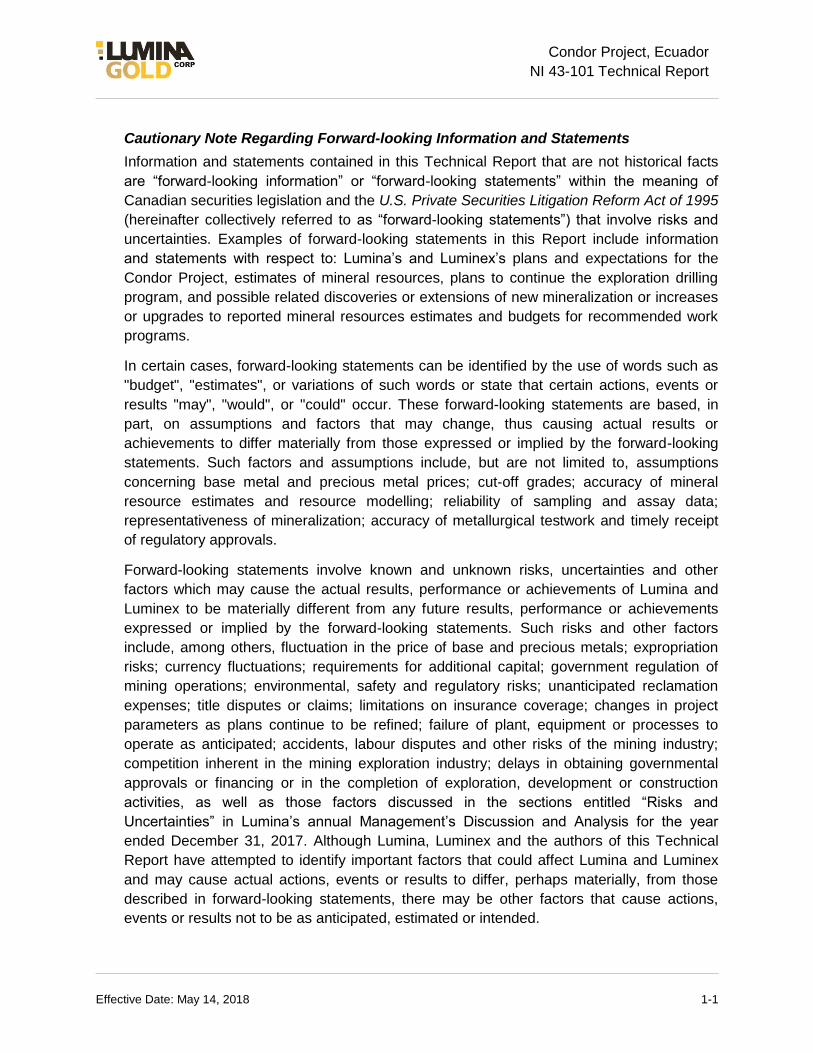
Cautionary Note Regarding Forward-looking Information and Statements
Information and statements contained in this Technical Report that are not historical facts
are “forward-looking information” or “forward-looking statements” within the meaning of
Canadian securities legislation and the U.S. Private Securities Litigation Reform Act of 1995
(hereinafter collectively referred to as “forward-looking statements”) that involve risks and
uncertainties. Examples of forward-looking statements in this Report include information
and statements with respect to: Lumina’s and Luminex’s plans and expectations for the
Condor Project, estimates of mineral resources, plans to continue the exploration drilling
program, and possible related discoveries or extensions of new mineralization or increases
or upgrades to reported mineral resources estimates and budgets for recommended work
programs.
In certain cases, forward-looking statements can be identified by the use of words such as
"budget", "estimates", or variations of such words or state that certain actions, events or
results "may", "would", or "could" occur. These forward-looking statements are based, in
part, on assumptions and factors that may change, thus causing actual results or
achievements to differ materially from those expressed or implied by the forward-looking
statements. Such factors and assumptions include, but are not limited to, assumptions
concerning base metal and precious metal prices; cut-off grades; accuracy of mineral
resource estimates and resource modelling; reliability of sampling and assay data;
representativeness of mineralization; accuracy of metallurgical testwork and timely receipt
of regulatory approvals.
Forward-looking statements involve known and unknown risks, uncertainties and other
factors which may cause the actual results, performance or achievements of Lumina and
Luminex to be materially different from any future results, performance or achievements
expressed or implied by the forward-looking statements. Such risks and other factors
include, among others, fluctuation in the price of base and precious metals; expropriation
risks; currency fluctuations; requirements for additional capital; government regulation of
mining operations; environmental, safety and regulatory risks; unanticipated reclamation
expenses; title disputes or claims; limitations on insurance coverage; changes in project
parameters as plans continue to be refined; failure of plant, equipment or processes to
operate as anticipated; accidents, labour disputes and other risks of the mining industry;
competition inherent in the mining exploration industry; delays in obtaining governmental
approvals or financing or in the completion of exploration, development or construction
activities, as well as those factors discussed in the sections entitled “Risks and
Uncertainties” in Lumina’s annual Management’s Discussion and Analysis for the year
ended December 31, 2017. Although Lumina, Luminex and the authors of this Technical
Report have attempted to identify important factors that could affect Lumina and Luminex
and may cause actual actions, events or results to differ, perhaps materially, from those
described in forward-looking statements, there may be other factors that cause actions,
events or results not to be as anticipated, estimated or intended.

Effective Date: May 14, 2018 1-2
Condor Project, Ecuador
NI 43-101 Technical Report
There can be no assurance that forward-looking statements will prove to be accurate, as
actual results and future events could differ materially from those anticipated in such
statements. Accordingly, readers should not place undue reliance on forward-looking
statements. The forward-looking statements in this Report are based on beliefs,
expectations and opinions as of the effective date of this Technical Report. Lumina,
Luminex and the authors of this Technical Report do not undertake any obligation to update
any forward-looking information and statements included herein, except in accordance with
applicable securities laws.

Effective Date: May 14, 2018 2-1
Condor Project, Ecuador
NI 43-101 Technical Report
2 INTRODUCTION
Lumina is a Vancouver, Canada-based precious and base metals exploration and
development company focused on gold and copper projects in Ecuador.
Lumina currently holds the Condor Project through its wholly-owned subsidiary, Luminex,
and is preparing this Technical Report in connection with a proposed spin-out transaction.
Lumina intends to spin out Luminex to its shareholders through the Arrangement, pursuant
to which, shareholders of Lumina will receive common shares of Luminex in proportion to
their shareholdings in Lumina, after which time the Condor Project will be owned by
Luminex as a separate entity from Lumina.
Lumina commissioned Robert Sim, P.Geo., of SIM Geological Inc. and Bruce Davis,
FAusIMM, of BD Resource Consulting Inc. to provide an updated mineral resource estimate
for the mineralized zones located on the Condor Project. Robert Sim and Bruce Davis are
both independent QPs of Lumina and Luminex and are responsible for the preparation of
this Technical Report, which has been prepared in accordance with NI 43-101 and Form
43-101F1 Technical Report (Form 43-101F1).
Robert Sim visited the project from November 29-30, 2017. He inspected drill core from
several drill holes at the camp/core storage facility and discussed exploration activities with
Lumina geologists. Several drill sites were visited at the Santa Barbara deposit. Bruce
Davis did not visit the property as it was not required for him to complete the scope of work
for which he was retained.
In preparing this Technical Report, the authors relied on geological reports, maps and
miscellaneous technical papers listed in Section 27 (References) of this Technical Report.
This Technical Report is based on information known to the authors as of May 14, 2018.
All measurement units used in this report are metric, and currency is expressed in
US dollars unless stated otherwise. The currency used in Ecuador is the US dollar.

Effective Date: May 14, 2018 2-2
Condor Project, Ecuador
NI 43-101 Technical Report
2.1 Abbreviations and Acronyms
Abbreviations and acronyms used throughout this report are shown in Table 2.1.
Table 2.1: Abbreviations and Acronyms
Description Abbreviation or Acronym
atomic absorption AA
Bestminers S.A. Bestminers
copper Cu
degrees centigrade o
C
carbon in pulp
CIP
CDN Resource Laboratories Ltd.
CDN
centimetre
cm
Centro de Investigation Minera y Metalurgica
CIMM
Condormining Corporation S.A.
Condormining
Corporacion FJTX Exploration S.A.
FJTX
controlled source audio magnetic telluric
CSAMT
digital elevation model DEM
drill core size (diameter 63.5 mm) HQ (HTW)
east E
Ecuador Gold and Copper Corp. EGX
Environmental Impact Assessment EIA
Environmental Management Plan PMA
exploratory data analysis EDA
feet ft
Fellow of the Australasian Institute of Mining and Metallurgy FAusIMM
general and administrative G&A
Global Positioning System GPS
gold Au
gold equivalent AuEq
gram g
grams per tonne g/t
hectare ha
Hubbard Perforaciones Cia. Ltda. Hubbard
Hydromet Technologies Ltd. Hydromet
joint venture JV
Independent Metallurgical Laboratories Pty Ltd IML
inductively coupled plasma ICP
inductively coupled plasma-emission spectroscopy ICP-ES
inductively coupled plasma-mass spectroscopy ICP-MS
induced polarization IP
Instituto de Seguridad Social de las Fuerzas Armadas ISSFA
International Electotechnical Commission IEC
International Organization for Standardization ISO
inverse distance weighted ID2
kilogram kg
kilometre km
kilowatt hour per metric tonne kWh/mt
kilowatt hour per short ton KWh/sht

Effective Date: May 14, 2018 2-3
Condor Project, Ecuador
NI 43-101 Technical Report
Description Abbreviation or Acronym
lead Pb
length x width x height L x W x H
Lumina Gold Corp. Lumina
metre m
million ounces Moz, M ounces
million pounds Mlbs
million tonnes Mt, Mtonnes
million years Ma
molybdenum Mo
National Instrument 43-101 NI 43-101
nearest neighbour NN
north N
northeast NE
northwest NW
drill core size (diameter 47.6 mm) NQ (NTW)
Odin Mining del Ecuador S.A. Odin
ordinary kriging OK
Ore Research & Exploration Pty Ltd Assay Standards OREAS
ounce oz
parts per million ppm
percent %
Phillips Enterprises LLC Phillips
pound lb
preliminary economic assessment PEA
Professional Geoscientist P.Geo.
Proyectmin S.A. Proyectmin
qualified person QP
quality assurance/quality control QA/QC
recoverable gold equivalent AuEqR
Resource Development Inc. RDi
rock quality designation RQD
selective mining unit SMU
SGS del Ecuador S.A. SGS
silver Ag
south S
southeast SE
southwest SW
specific gravity SG
thousand ounces koz
Thousand tonnes K tonnes
three-dimensional 3D
tonne t
tonnes per cubic metre t/m3
TVX Gold Inc. TVX
United States dollar $
Universal Transverse Mercator UTM
west W
zinc Zn

Effective Date: May 14, 2018 3-1
Condor Project, Ecuador
NI 43-101 Technical Report
3 RELIANCE ON OTHER EXPERTS
The report was prepared by Robert Sim, P.Geo., and Bruce Davis, FAusIMM. They are
qualified persons for the purposes of NI 43-101 and fulfill the requirements of an
“Independent Qualified Person”. The information, conclusions, and recommendations
contained herein are based on:
Mr. Sim’s field observations; and
data, reports and other information supplied by Lumina and other third parties.
For the purpose of disclosure relating to ownership data and information (mineral, surface
and access rights) in this report, the authors have relied exclusively on information provided
by Lumina. Lumina conducted a title search of the property on May 4, 2018 with Ecuador’s
Ministry of Mines and confirmed that all concessions are owned by Lumina and are in good
standing. The authors have not researched the property title or mineral rights for the
Condor Project and express no legal opinion as to the ownership status of the property.

Effective Date: May 14, 2018 4-1
Condor Project, Ecuador
NI 43-101 Technical Report
4 PROPERTY DESCRIPTION AND LOCATION
4.1 Location
The Condor Project is located in southeastern Ecuador (Figure 4-1), 40 km east of the town
of Zamora and 70 km east of the city of Loja. Access to the property is provided by paved
and gravel roads. The approximate centre of the property is located at 9548000 North and
769000 East (geographic projection: Provisional South American Datum 1956, UTM Zone
17S).
Figure 4-1: Location Map
Source: Lumina, 2018
4.2 Land Tenure
The Condor Project consists of nine contiguous mining concessions totalling 10,101.09 ha,
all of which are held by Lumina 100%, except for Viche Conguime I, II, III, Hitobo and
Chinapintza where ISSFA owns 10%.
Lumina currently holds the Condor Project through its wholly-owned subsidiary, Luminex.
Lumina intends to spin out Luminex to its shareholders through the Arrangement, pursuant

Effective Date: May 14, 2018 4-2
Condor Project, Ecuador
NI 43-101 Technical Report
to which, shareholders of Lumina will receive common shares of Luminex in proportion to
their shareholdings in Lumina, after which time the Condor Project will be owned by
Luminex as a separate entity from Lumina.
Set out below in Table 4.1 is the corporate structure of Lumina immediately prior to the
effective date of the Arrangement:
Table 4.1: Lumina Corporate Structure Prior to Effective Date of the Arrangement

Effective Date: May 14, 2018 4-3
Condor Project, Ecuador
NI 43-101 Technical Report
Set out below in Table 4.2 is the corporate structure of Lumina and Luminex immediately after
the effective date of the Arrangement:
Table 4.2: Lumina and Luminex Corporate Structure after Effective Date of the Arrangement
The concessions are described in Table 4.3 and shown in Figure 4-1.

Effective Date: May 14, 2018 4-4
Condor Project, Ecuador
NI 43-101 Technical Report
Table 4.3: Mining Concessions Condor Project
File Number
Concession Name
Owner Lumina´s
Ownership Percentage
Date of Registration
(dd/mm/yyyy)
Area (ha)
Phase Date of
Expiration* (dd/mm/yyyy)
2024 Viche Conguime I Condormining 90%** 23/04/2010 1,930.57 Small Mining 4/08/2031
2024A Viche Conguime II Condormining 90%** 22/04/2010 2,410 Small Mining 3/08/2021
500802 Viche Conguime III Condormining 90%** 22/04/2010 2,501 Small Mining 27/03/2033
500115 Hitobo Condormining 90%** 27/04/2010 58.5 Small Mining 14/09/2031
500135 FJTX FJTX 100% 27/04/2010 960 Small Mining 14/09/2031
500245 FADGOY FJTX 100% 27/04/2012 199 Small Mining 22/08/2031
2024.1 Chinapintza Bestminers 90%** 29/01/2014 210.02 Small Mining 31/08/2031
50000497 Escondida FJTX 100% 4/01/2017 1,204 Early Exploration 4/01/2042
50000655 Santa Elena Proyectmin 100% 23/12/2016 628 Early Exploration 23/12/2041
* the mining concessions can be renewed for 25-year periods, as many times as needed.
**The Army´s participation in the original Condormining concessions began with an association contract with TVX in
December 1993. Since then, multiple companies have partnered with ISSFA under the same participation structure.

Effective Date: May 14, 2018 4-5
Condor Project, Ecuador
NI 43-101 Technical Report
The Viche Conguime I, II, III, Hitobo, FJTX and FADGOY concessions formed the original
property. The Chinapintza concession was originally part of Viche Conguime I but was optioned
to Bestminers S.A. in 2014. It covers the portion of the Chinapintza vein system that is on the
Condor Project. The Escondida and Santa Elena concessions were acquired through the
Ecuadorian government’s tender process in 2016 and 2017.
Figure 4-2: Claim Map
Note: Lumina mining concessions are shaded in blue
Source: Lumina, 2018
The maintenance of each mining concession requires an annual payment that is due before
the 31st of March each year. For 2018, this amounted to $81,511.35 for the nine mining
concessions. These fees have been paid, and all concessions are in good standing.
Lumina owns surface rights for approximately 700 ha scattered throughout the mining
concessions and over the mineralized zones. The remaining land belongs to the State and
the Shuar indigenous community. Lumina is actively communicating with the Shuar
community and has been granted permission to access and explore the ground owned by

Effective Date: May 14, 2018 4-6
Condor Project, Ecuador
NI 43-101 Technical Report
them. In parts of the Los Cuyes deposit, Lumina has been granted mining easements to
access the area and conduct exploration work.
ISSFA has a 10% net profit interest in four of the nine claims that make up the Project.
ISSFA is not required to contribute towards the advancement or construction of a mining
operation on these claims; however, Lumina can recoup all of its historical accumulated
expenses out of production profits prior to granting a dividend to ISSFA.
All mine production is subject to royalty payments made to the Ecuadorean government.
Relevant royalties are as follows:
gold and silver: a minimum of 5% of the gross value of bullion produced.
copper, lead, zinc: a minimum of 5% of the gross value of the metal produced.
Small-scale mining by artisanal miners is occurring in the northern part of the Condor
Project. In the past, there have been peaceful demonstrations to vocalize grievances with
local officials. Lumina’s community relations team is actively communicating with the
artisanal miners and local communities.
The authors are not aware of other significant risks or factors that may affect access, title or
the right or ability to perform work on the Condor Project.
4.3 Environmental Regulations and Permitting
The Condor Project holds all the environmental regulatory permits required by law and is in
compliance with its obligations under the Ecuadorian Constitution and Environmental
Management Law. On July 1, 2011, Lumina was granted an environmental licence for
advanced exploration for metallic minerals on the Condor Project concessions. This licence
is based on and supported by the Environmental Impact Assessment (EIA) and the
Environmental Management Plan (PMA). Documentation demonstrating compliance with
PMA must be filed biannually with the Ministry of the Environment. Lumina is up to date on
its filings.
Lumina has regularly submitted the corresponding environmental audits for the Condor
Project as per Article 53 of the Environmental Regulatory Code. Recent audits have been
reviewed and approved by the Ministry of Environment. In addition to the EIA and PMA,
Lumina also filed an application for industrial and domestic water use for exploratory
activities, and the Water Authority has provided a licence for such use.
There are two other permits required to continue exploration activities: the “Certificate of
Intersection” for the “National System for Protected Areas, Protective Forests and Forest
Heritage” and the “Labour Hygiene, Health and Safety Regulations”. Both permits are in
good standing. With respect to the first permit, the Condor Project is not located within any
national forests, protected areas or national parks, and, with respect to the other permit,
Lumina has obtained updated permits for the Project and is in compliance with regulations
for health, safety and hygiene administered by the Labour Ministry.

Effective Date: May 14, 2018 4-7
Condor Project, Ecuador
NI 43-101 Technical Report
The nine mining concessions associated with the Condor Project comply with all
Ecuadorian environmental laws and regulations. Lumina has also implemented an effective
monitoring system that detects unauthorized mining activity on its concessions. This has
resulted in the filing of criminal actions and administrative protective measures, and all have
been resolved in Lumina’s favour. Lumina has no material environmental liabilities as a
consequence of these unauthorized mining activities.
Lumina has the necessary permits to conduct its drill programs. Baseline environmental
studies are ongoing, and discussions have been initiated with the local communities and
government agencies.

Effective Date: May 14, 2018 5-1
Condor Project, Ecuador
NI 43-101 Technical Report
5 ACCESSIBILITY, CLIMATE, LOCAL RESOURCES,
INFRASTRUCTURE & PHYSIOGRAPHY
5.1 Accessibility
The Condor Project is located in Zamora-Chinchipe province of southeastern Ecuador. The
largest regional centre is the city of Loja. Access to the project is provided by paved and
gravel roads (Figure 5-1). Distance by road from Loja to Zamora is 50 km and then a further
73 km from Zamora to the property. Travel time from Loja to the property is typically three
to four hours. A number of secondary dirt roads provide four-wheel drive access to various
parts of the property and surrounding areas. Some of these roads may be inaccessible
during the rainy season (January to May).
Figure 5-1: Access to Condor Project
Note: Condor Project is outlined in blue.
Source: Lumina, 2018

Effective Date: May 14, 2018 5-2
Condor Project, Ecuador
NI 43-101 Technical Report
5.2 Climate
The climate is cool tropical. The average daily temperature varies from 18°C to 29°C, and
the average annual rainfall ranges from two to four metres. There is a distinct rainy season
lasting from January to May, but exploration is possible all year round.
5.3 Local Resources and Infrastructure
The city of Loja (population ~180,000) is the largest regional centre. It can provide basic
goods and services for the early stages of exploration and mining. There are regular daily
flights from Quito which arrive at the Catamayo airport, 20 km west of Loja. Skilled and
unskilled labour can be found in Loja, Zamora and small villages near the project.
The Mirador field camp and core-logging/storage facility are located in the northern part of
the property near the Los Cuyes deposit (Figure 5-2). Power at the camp is supplied from
the national grid. Internet and phone service to the camp are provided by satellite. The
company also maintains a field house near the Santa Barbara deposit.
The Nangaritza, Yapi, Pachikutza and Conguime rivers and numerous small streams on the
Project can provide water for any mining, processing or other requirements (Figure 5-2).

Effective Date: May 14, 2018 5-3
Condor Project, Ecuador
NI 43-101 Technical Report
Figure 5-2: Local Infrastructure
Note: Condor Project is outlined in blue; roads – olive coloured lines
Source: Lumina, 2018

Effective Date: May 14, 2018 5-4
Condor Project, Ecuador
NI 43-101 Technical Report
5.4 Physiography
The Condor Project is located on the western flank of the Cordillera del Condor, the crest of
which defines the Ecuador-Peru border. Elevations range between 850 m and 1,800 m
above sea level. The topography is very rugged, and slopes are steep. The mountains are
covered with dense vegetation, typical of tropical rainforests.

Effective Date: May 14, 2018 6-1
Condor Project, Ecuador
NI 43-101 Technical Report
6 HISTORY
Gold has been identified in the area since pre-Columbian times, and informal miners have
been working in the area since 1984. Modern exploration has occurred since 1988.
The history of claim ownership is described in Table 6.1.
Table 6.1: History of Ownership
Year Company Description
1988 ISSFA / Prominex U.K. ISSFA / Prominex U.K. acquired property
based on results of regional surveys.
1991 Prominex U.K. Prominex U.K. withdrew from the Project.
1993–1997 TVX (Condormining) / ISSFA TVX acquired the Project.
2000 TVX / ISSFA TVX withdrew from the Project.
December, 2002 Hydromet / ISSFA
Hydromet formed a JV with DINE which included the Viche Conguime I, II, III and
Hitobo concessions. Hydromet purchased a 100% interest in the FJTX concession.
June, 2003 Hydromet / ISSFA Hydromet acquired 70% interest in the
Condor Project and was renamed Goldmarca in 2004.
May, 2007 Goldmarca / ISSFA
Goldmarca increased its interest to 90% and obtained a right-of-first refusal on the
remaining 10%. Condormining Corp. S.A. was formed to hold the Condor concessions. Goldmarca changed name to Ecometals.
December, 2010 Ecometals / Ecuador Capital Ecometals sold its 90% interest to Ecuador
Capital for $7.7 million.
July, 2012 Ecuador Capital /EGX
Ecuador Capital completed a reverse takeover of EGX (formerly Enterprise Capital Corp.). EGX purchased FADGOY concession
for $300,000.
November 1, 2016 Lumina / EGX Lumina acquired EGX.
Previous exploration on the Condor Project is summarized in Table 6.2. The historical
exploration of the property is discussed in greater detail in Ronning (2003), Maynard et al.
(2013, 2014) and Short et al. (2015).
Results from the drill programs are provided in Section 10 (Drilling) of this Report. There
has been no commercial mineral production from the Condor Project, but artisanal miners
have been extracting gold from the Chinapintza veins since the 1980’s. This activity is
presently continuing but there are no production records.

Effective Date: May 14, 2018 6-2
Condor Project, Ecuador
NI 43-101 Technical Report
Table 6.2: History of Exploration
Year Company Description
1988–1991 ISSFA / Prominex U.K
(Pachicutza CEM)
Regional stream sediment sampling and geological mapping programs; most of the mineralized prospects are
discovered
1993–1998 TVX (Condor Mining) /
ISSFA / Chulapas Mining
Soil and rock sampling, geophysics, drill access roads and trails, diamond drilling (172 holes; 36,617.1 m),
underground development (1,081 m) and sampling on Chinapintza epithermal veins; Los Cuyes, San Jose, Soledad, Guayas and Enma breccia pipes; and Santa Barbara and El
Hito porphyries
1994–1998 TVX / ISSFA / Chulapas Work at Chinapintza is discontinued, while exploration
continued at Santa Barbara and El Hito (soil, rocks, stream sampling, IP survey, trenching)
1999–2000 TVX / Valerie Gold Drilling at Santa Barbara (19 holes; 4,296.1 m) and
El Hito (4 holes; 1,188.3 m)
2000 TVX TVX withdraws from JV
2002–2004 Hydromet Hydromet acquires control of the Project and resamples
drill holes and trenches; Hydromet is renamed Goldmarca in 2004
2004–2007 Goldmarca
Reconnaissance mapping, IP and magnetic surveys are completed at the Los Cuyes, Soledad, San Jose, Guayas and
Enma breccia pipes; a magnetic survey is completed at Santa Barbara; drilling continues on the Project (124 holes;
21,612.2 m), Goldmarca renamed Ecometals in 2007
2007–2008 Ecometals Drilling at Chinapintza, Los Cuyes, Soledad and Santa
Barbara (30 holes; 11,710.7 m)
2008–2009 Ecometals The Government of Ecuador imposed a moratorium on
exploration; accordingly, no work was completed on the Project.
2009–2011 Ecometals No work was completed on the Project
2012–2016 EGX
Geological mapping and rock sampling was done at Santa Barbara and El Hito; drilling completed at Los Cuyes,
Soledad, El Hito and Santa Barbara (37 holes; 22,051.7 m) PEA on Santa Barbara in 2015
2016–2018 Lumina Geological mapping, soil, rock sampling and drilling was
done in the Santa Barbara area (9 holes; 1,907.4 m)

Effective Date: May 14, 2018 6-3
Condor Project, Ecuador
NI 43-101 Technical Report
The surface surveys described in Table 6.2 outlined several geochemical and geophysical
anomalies associated with the mineral occurrences. These anomalies, which are shown in
Section 9 (Exploration), were subsequently drilled, and, since 1999, several mineral
resource estimates have been made for the mineralized zones on the Condor Project.
(Easdon & Ovieda, 2004; Maynard et al., 2013, 2014). The most recent estimate by EGX
(Maynard et al., 2014) has not been completed to NI 43-101 standards. A discussion of
historical estimates and a detailed comparison of the historical estimate and the current
mineral resource estimates presented in this Report is provided in Section 14.15.
6.1 Historical Estimates
Historical estimates for the Condor Project were calculated by Al Maynard & Associates
(Maynard) and initially presented in a technical report (effective date March 24, 2014). The
historical estimate for the Santa Barbara deposit was restated in a more recent PEA
technical report, dated May 19, 2015, authored by GBM (Note: The May 2015 PEA does
not include historical estimates for the Soledad, Los Cuyes and Enma deposits).
Disclosure of the historical estimates is relevant for providing context for the current mineral
resource estimate. The QPs have not done sufficient work to classify the historical
estimates as current mineral resources or mineral reserves and are not treating them as
current “mineral resources” under NI 43-101.

Effective Date: May 14, 2018 6-4
Condor Project, Ecuador
NI 43-101 Technical Report
Table 6.3: Historical Estimates
Deposit Mtonnes
Average Grade Contained Metal
Au (g/t)
Ag (g/t)
Cu (%)
Au (Moz)
Ag (Moz)
Cu (Mlbs)
Indicated
Santa Barbara 364.6 0.51 0.9 0.1 5.98 10.08 800
Soledad 34.9 0.63 7.2 n/a 0.71 8.09 n/a
Los Cuyes 46.8 0.82 6.2 n/a 1.23 9.31 n/a
Enma 1 2.88 32.8 n/a 0.09 1.06 n/a
Total Indicated 447.3 0.55 2.0 n/a 8.01 28.55 800
Inferred
Santa Barbara 177.6 0.40 0.8 0.1 2.30 4.63 400
Soledad 20 0.50 6.9 n/a 0.30 4.50 n/a
Total Inferred 197.6 0.40 1.4 n/a 2.60 9.13 400
Notes: Cut-off is 0.25 g/t Au. Mineral resources are not constrained within pit shells.
Sources: Santa Barbara May 2015 PEA by GBM, originally presented in the March 2014 report by Al Maynard &
Associates. Mineral resources at Soledad, Los Cuyes and Enma are presented in the March 2014 report by Al
Maynard & Associates.
6.1.1 Comments on Historical Estimates
Prospects for Economic Viability
As required under NI 43-101, economic viability has not been tested in the GBM/Maynard
historical estimates. Although both use a cut-off grade that reflects the costs associated
with open pit mining methods, they do not constrain the mineral resources within a pit shell
or to depths below surface that reflect extraction by open pit mining methods. As a result,
they report mineral inventories, not estimates of mineral resources, which is not permitted
under NI 43-101.
The GBM 2015 PEA technical report (Short et al., 2015) includes a section on Mining
Methods describing “material planned for processing”, which is a historical estimate
combining “indicated” plus “inferred” materials that have been subjected to projected
technical and economic parameters based on open pit mining methods (but does not
include mining losses or dilution), which is also not permitted under NI 43-101.
The historical estimate was presented by GBM in the 2015 PEA technical report as follows:
98.8Mt @ 0.72 g/t Au; 0.96 g/t Ag; 0.11% Cu; 2,272koz Au; 3,036koz Ag; 233Mlbs Cu
(Note: The cut-off grade used to calculate “material planned for processing” is not stated in
the GBM report).

Effective Date: May 14, 2018 6-5
Condor Project, Ecuador
NI 43-101 Technical Report
Although this is not an estimate of mineral resources, it roughly compares to the current
Santa Barbara mineral resource estimate shown in Table 14.16, but with lower tonnage,
higher grades, and similar volumes of contained metal. The QPs believe that the “material
planned for processing” amount provides a more appropriate comparison to the current
Lumina Indicated and Inferred resource estimate than the historical estimates provided in
Table 14.20.
In the March 2014 technical report, regarding the historical estimate at Soledad, Maynard
states “this mineralization would be mined in bulk from open pits and or using bulk
underground methods”, but (again) they do not constrain the historical estimate within pit
shells. If they assumed a “bulk underground method”, this would not likely be feasible
based on a base case cut-off grade of 0.25 g/t Au, as used by GBM/Maynard.
Classification
At Santa Barbara, GBM/Maynard state that “the variability of sample pairs within the
mineralized zone and within 100 m of a drill intersection is sufficiently low, along with
confidence in the geologic interpretation and understanding of the controls on the
mineralization, to justify categorizing and resource blocks within 100 m of a drill intersection
as Indicated and between 100 m and 200 m as Inferred”. Both the 2014 and 2015 reports
include variograms to support these assumptions which show that the maximum range of
continuity of sample data is 100 m (similar to the results obtained in this study). This means
that there is no relationship between sample data spaced beyond 100 m, and, therefore,
the historical estimates that exceed this distance cannot be relied on. Similarly,
GBM/Maynard’s parameters for historical estimates, within 100 m of a drill hole, are
considered to be optimistic based on the variogram ranges. One would expect this distance
to be somewhat less than the maximum range on the variogram in order to demonstrate
confidence in the historical estimate. Finally, Maynard classifies historical estimates about
single drill holes, which, by definition, do not exhibit the continuity of mineralization required
for mineral resources in this category.
At Los Cuyes and Enma, GBM/Maynard assume all historical estimates within a maximum
distance of 200 m from a drill hole are included in the Indicated category. This distance, and
its use in the classification of Indicated-class resources, is not supported by the continuity
exhibited in the underlying sample data. At Soledad, “indicated” historical estimates are
located within a maximum distance of 50 m from a drill hole, and “inferred” historical
estimates are located within a maximum distance of 100 m from a drill hole. These
parameters are supported by the sample data and are similar to those used in the mineral
resources presented in this report.
Estimation Approach
GBM used an ID3 method to estimate grade in all models. This approach does not often
incorporate an appropriate amount of smoothing (averaging) of samples in the block grade
estimate, resulting in higher-grade mineral resource estimates with fewer tonnes.

Effective Date: May 14, 2018 6-6
Condor Project, Ecuador
NI 43-101 Technical Report
Disclosure of the current mineral resource estimate for the Project is set out in Section
14.13 of this report.
A qualified person has not done sufficient work to classify the historical estimates as current
mineral resources or mineral reserves, and Lumina is not treating the historical estimates
as current mineral resources or mineral reserves.

Effective Date: May 14, 2018 7-1
Condor Project, Ecuador
NI 43-101 Technical Report
7 GEOLOGICAL SETTING AND MINERALIZATION
7.1 Regional Geology
The Condor Project is located in the Zamora Cu-Au belt (Drobe et al., 2013) which also
hosts the Fruta del Norte epithermal gold deposit and the Mirador, San Carlos and
Panantza porphyry copper deposits. The regional geology of this belt is shown in
Figure 7-1.
Figure 7-1: Regional Geology Southern Ecuador
Source: Drobe et al., 2013.

Effective Date: May 14, 2018 7-2
Condor Project, Ecuador
NI 43-101 Technical Report
The regional stratigraphy of the Zamora Cu-Au belt is provided in Table 7.1.
Table 7.1: Regional Stratigraphy Zamora Cu-Au Belt
Formation Age Description
Intrusives Late Cretaceous Diorite / granodiorite and associated volcanics
Chinapintza Lower Cretaceous Rhyolite / dacite volcanics and intrusions
Napo Lower Cretaceous Sandstones, black shales, limestones
Hollin Lower Cretaceous Conglomerate, quartzite, shale
Unconformity
Misahualli Late Jurassic Andesite volcanics; arc dominated
Chapiza Late Jurassic Redbed sandstones, turbidites, shales; continental
shelf
Zamora Batholith Middle Jurassic Granodiorite / diorite intrusive
Santiago Late Triassic to Lower
Jurassic Calc-alkaline volcanics of Piuntza unit overlain by
marine shales and limestones
Source: Drobe et al., 2013; Easdon & Oviedo, 2004
The dominant geological feature of the Zamora Cu-Au belt is the Zamora batholith, a Middle
to Late Jurassic (153–169 Ma; Drobe et al., 2013) calc-alkaline, I-type intrusion that is
interpreted as a remnant of a volcanic arc formed along an Andean-type continental margin.
This intrusion is exposed along a 200 km north-northeast trend and is 100 km wide. The
batholith consists of equigranular, medium-grained granodiorite and younger subvolcanic
porphyritic (albite-hornblende-±quartz) intrusions of andesitic to dacitic composition. These
porphyritic intrusions form every 15 to 20 km along the north-northeast axis of the Zamora
batholith and are commonly associated with copper and gold mineralization. The Condor
Project occurs at the eastern edge of the batholith.
The Zamora batholith intruded the late Triassic to lower Jurassic Santiago formation
sediments and volcanics. These older rocks are preserved as down-faulted blocks or as
roof pendants within the Zamora batholith. Late Jurassic Chapiza formation sediments and
Misahualli volcanics are both intruded by and unconformably overlie the Zamora batholith.
Lower Cretaceous quartzites of the Hollin formation and sandstones, mudstones and
limestones of the Napo formation cover portions of the eroded Jurassic volcano-
sedimentary sequence and the Zamora Batholith (Hedenquist, 2007; Drobe et al., 2013).
This entire sequence is overlain by rhyolitic to dacitic pyroclastic volcanics of the lower
Cretaceous Chinapintza formation. Upper Cretaceous acid to intermediate stocks and dikes
occur along regional structures.
The dominant regional structures include north-south-trending faults which control the
emplacement of the older intrusives (i.e., Zamora batholith) and a series of younger

Effective Date: May 14, 2018 7-3
Condor Project, Ecuador
NI 43-101 Technical Report
northeast-, northwest- and east-northeast-trending structures which control the
emplacement of younger intrusives.
7.2 Local and Property Geology
The local geology of the property is shown in Figure 7-2. There are three distinct
mineralized zones on the Condor Project: the Chinapintza vein district, the Condor
epithermal gold breccia complex, and the southern porphyry zone.
Figure 7-2: Local Geology Condor Project
Note: Condor Project is outlined in blue.
Source: Lumina, 2018

Effective Date: May 14, 2018 7-4
Condor Project, Ecuador
NI 43-101 Technical Report
7.2.1 Chinapintza Vein District
The Chinapintza veins occur in the northern part of the Condor Project. A series of north-
northwest-trending, intermediate sulphidation, narrow, high-grade gold veins are hosted in
the Chinapintza porphyry. The veins are exposed on the Condor Project but extend onto
the adjacent Jerusalem concession. TVX did extensive drilling followed by underground
development and exploration of these veins in the 1990s. Artisanal miners continue to
exploit these veins. This report does not provide a mineral resource estimate for this area
because it is felt that there is insufficient geologic information to support an interpretation of
the mineralized zone.
7.2.2 Condor Breccia Complex
The Condor breccia complex is located immediately south of the Chinapintza veins. The
area is underlain by lower Cretaceous rhyodacite to dacite intrusions and volcanics of the
Chinapintza formation and the Zamora batholith. A number of diatreme breccias are
associated with these young intrusions. They can be grouped into three main zones: Los
Cuyes, Soledad, and Enma. Gold mineralization is associated with sphalerite-pyrite veins
which commonly occur in the breccias.
7.2.3 Southern Porphyry Zone
The southern porphyry zone is located 7.5 km south of the Condor breccia complex. The
area is underlain by andesitic volcanics of the Misahualli formation, the Zamora batholith
and sediments of the Hollin formation. The Santa Barbara Au-Cu and El Hito Cu-Mo
porphyries are located here.
7.3 Mineralization
7.3.1 Chinapintza Vein District
The Chinapintza area is underlain by intrusive and volcanic rocks of the Chinapintza and
Chapiza formations (Figure 7-3).

Effective Date: May 14, 2018 7-5
Condor Project, Ecuador
NI 43-101 Technical Report
Figure 7-3: Geology Chinapintza Vein District
Source: Lumina, 2018
The Chinapintza veins are hosted within the lower Cretaceous Chinapintza porphyry which
consists of andesite, dacite and rhyodacite porphyries intersected by numerous dikes of
similar composition. The Chinapintza veins occur within a broad area of phyllic and argillic
alteration which is surrounded by a halo of propylitic alteration.
Epithermal gold veins have a north-northwest trend and have been exposed over a 1 km
strike length. The width of the mineralized zone is approximately 650 m. The veins are
steeply dipping to the southwest or northeast. As elevation increases, the veins split into
stockwork and breccia zones. The veins are characterized by open space fillings and
exhibit common colloform and drusy textures. Widths vary from < 30 cm to 2 m. They
consist of interbanded and intergrown sulphides, carbonates, quartz and clay minerals.
Gold occurs both in its native form and as electrum. Sulphides and other metal-bearing
minerals include pyrite, sphalerite, galena, arsenopyrite, pyrrhotite, chalcopyrite, bornite,
tennantite-tetrahedrite, pyromorphite, anglesite, covellite, chalcocite and malachite.

Effective Date: May 14, 2018 7-6
Condor Project, Ecuador
NI 43-101 Technical Report
7.3.2 Condor Breccia Complex
The Condor breccia complex is located immediately south of the Chinapintza vein system.
It is underlain by a volcanic-subvolcanic rhyolitic-dacitic eruptive centre and diatreme
complex. There are three main epithermal gold occurrences: Los Cuyes, Soledad and
Enma (Figure 7-4).
Figure 7-4: Geology Condor Breccia Complex
Source: Lumina, 2018
Los Cuyes
Detailed mapping of the Los Cuyes zone was completed by Pratt (2017), and his work is
summarized here.
The Los Cuyes mineralization is hosted in an oval-shaped diatreme which consists of an
outer shell of discordant, polymictic hydrothermal breccia and internal fill comprised of well-
sorted, bedded rhyolitic lapilli tuffs, breccias and volcanic sandstones. Dacite and rhyolite
dikes are intruded as ring dikes at the margin of the diatreme. Alteration within the diatreme
is primarily sericite/illite with carbonate locally. The most intense alteration occurs at the
margin of the diatreme, implying focused hydrothermal fluid flow.

Effective Date: May 14, 2018 7-7
Condor Project, Ecuador
NI 43-101 Technical Report
There is a low level of background gold throughout the entire diatreme associated with
disseminations of pyrite and sphalerite. Higher gold values are associated with veins of
massive sphalerite, pyrite and marcasite with minor quartz, galena and rhodochrosite.
Lithological contacts, such as dikes and the outer breccia shell of the diatreme, are more
favourable areas for veining. Mineralization and alteration at Los Cuyes post-dates all the
rock types in the Los Cuyes area, even the Hollin sediments. This suggests that
mineralization is post-lower Cretaceous.
The mineralized zone has dimensions of 450 m northeast-southwest, 300 m northwest-
southeast and extends to depths of at least 350 m. The overall form is that of an inverted
cone that plunges approximately 50o to the southeast. Figure 7-5 is a plan view of the
mineralization, and Figure 7-6 is a northeast-southwest oriented vertical cross section
viewing towards the northwest.
Figure 7-5: Los Cuyes (Plan View)
Source: Lumina, 2018

Effective Date: May 14, 2018 7-8
Condor Project, Ecuador
NI 43-101 Technical Report
Figure 7-6: Los Cuyes (NE-SW Cross Section)
Source: Lumina, 2018
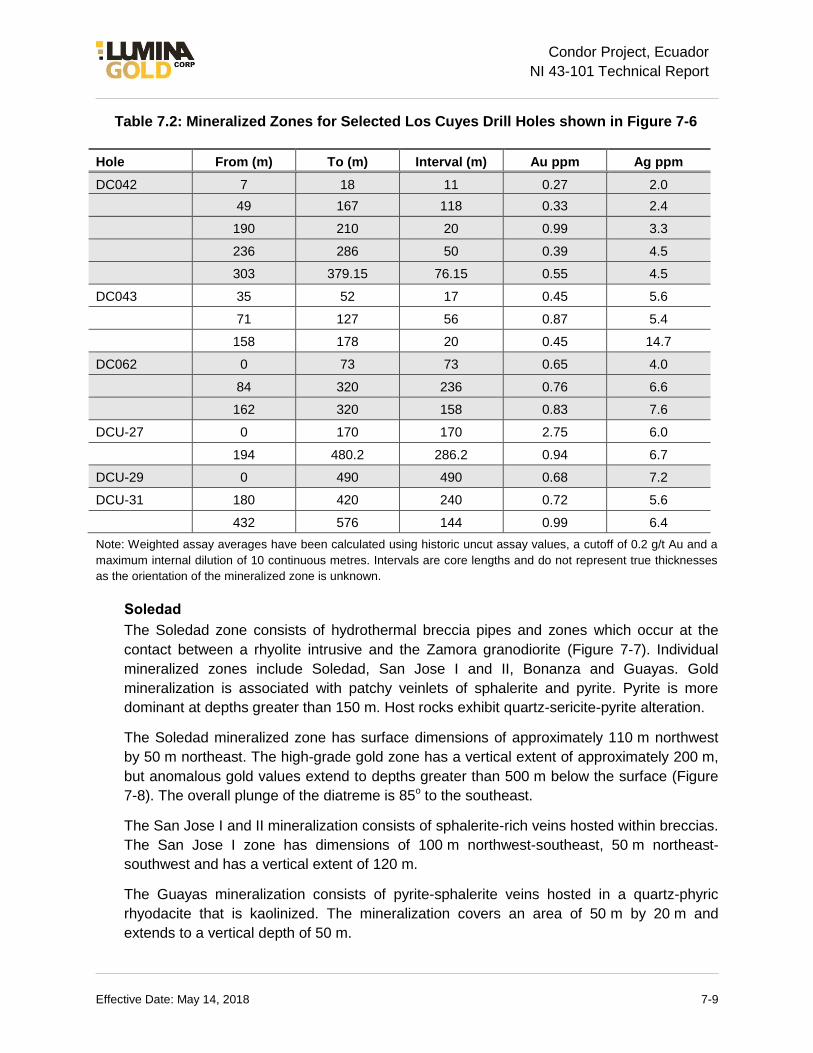
Effective Date: May 14, 2018 7-9
Condor Project, Ecuador
NI 43-101 Technical Report
Table 7.2: Mineralized Zones for Selected Los Cuyes Drill Holes shown in Figure 7-6
Hole From (m) To (m) Interval (m) Au ppm Ag ppm
DC042 7 18 11 0.27 2.0
49 167 118 0.33 2.4
190 210 20 0.99 3.3
236 286 50 0.39 4.5
303 379.15 76.15 0.55 4.5
DC043 35 52 17 0.45 5.6
71 127 56 0.87 5.4
158 178 20 0.45 14.7
DC062 0 73 73 0.65 4.0
84 320 236 0.76 6.6
162 320 158 0.83 7.6
DCU-27 0 170 170 2.75 6.0
194 480.2 286.2 0.94 6.7
DCU-29 0 490 490 0.68 7.2
DCU-31 180 420 240 0.72 5.6
432 576 144 0.99 6.4
Note: Weighted assay averages have been calculated using historic uncut assay values, a cutoff of 0.2 g/t Au and a
maximum internal dilution of 10 continuous metres. Intervals are core lengths and do not represent true thicknesses
as the orientation of the mineralized zone is unknown.
Soledad
The Soledad zone consists of hydrothermal breccia pipes and zones which occur at the
contact between a rhyolite intrusive and the Zamora granodiorite (Figure 7-7). Individual
mineralized zones include Soledad, San Jose I and II, Bonanza and Guayas. Gold
mineralization is associated with patchy veinlets of sphalerite and pyrite. Pyrite is more
dominant at depths greater than 150 m. Host rocks exhibit quartz-sericite-pyrite alteration.
The Soledad mineralized zone has surface dimensions of approximately 110 m northwest
by 50 m northeast. The high-grade gold zone has a vertical extent of approximately 200 m,
but anomalous gold values extend to depths greater than 500 m below the surface (Figure
7-8). The overall plunge of the diatreme is 85o to the southeast.
The San Jose I and II mineralization consists of sphalerite-rich veins hosted within breccias.
The San Jose I zone has dimensions of 100 m northwest-southeast, 50 m northeast-
southwest and has a vertical extent of 120 m.
The Guayas mineralization consists of pyrite-sphalerite veins hosted in a quartz-phyric
rhyodacite that is kaolinized. The mineralization covers an area of 50 m by 20 m and
extends to a vertical depth of 50 m.

Effective Date: May 14, 2018 7-10
Condor Project, Ecuador
NI 43-101 Technical Report
Figure 7-7 is a plan view of the Soledad zone, and Figure 7-8 is a north-south vertical cross
section viewing towards the west.
Figure 7-7: Soledad Zone (Plan View)
Source: Lumina, 2018

Effective Date: May 14, 2018 7-11
Condor Project, Ecuador
NI 43-101 Technical Report
Figure 7-8: Soledad (N-S Cross Section 769 450E)
Source: Lumina, 2018

Effective Date: May 14, 2018 7-12
Condor Project, Ecuador
NI 43-101 Technical Report
Table 7.3: Mineralized Zones for Selected Soledad Drill Holes shown in Figure 7-8
Hole From (m) To (m) Interval (m) Au ppm Ag ppm
DD080 1.22 127 125.78 0.98 5.9
DSO-01 0 270 270 1.42 11.8
DSO-04 0 308 308 1.23 7.9
DSO-06 0 210 210 0.99 14.2
222 252 30 0.30 5.5
262 302 40 0.30 7.8
366 398 32 0.22 11.9
494 542 48 0.26 36.3
DSO-07 0 152 152 0.69 7.2
192 210 18 0.36 3.9
400 474 74 0.71 7.6
DSO-08 0 88 88 0.95 7.7
116 200 84 0.30 2.7
466 574 108 0.66 8.1
DCO-12 0 160 160 1.08 4.8
Note: Weighted assay averages have been calculated using historic uncut assay values, a cutoff of 0.2 g/t Au and a maximum internal dilution of 10 continuous metres. Intervals are core lengths and do not represent true thicknesses as the orientation of the mineralized zone is unknown.
Enma
The Enma zone is hosted in a west-northwest-trending rhyolitic breccia that occurs at the
contact between andesite lapilli tuffs and the Zamora batholith. The zone has dimensions of
200 m west-northwest, is approximately a width of 10 m wide and has a vertical extent of
350 m (Maynard et al., 2011). Alteration is primarily chlorite with minor quartz-sericite ±
alunite-kaolinite. Gold is associated with pyrite-sphalerite-quartz veins. At depths greater
than 200 m, gold-poor, pyrite-pyrrhotite ± chalcopyrite veins are more dominant.
Figure 7-9 is a plan view of the Enma zone, and Figure 7-10 is an east-west vertical cross
section viewing towards the north.

Effective Date: May 14, 2018 7-13
Condor Project, Ecuador
NI 43-101 Technical Report
Figure 7-9: Enma (Plan View)
Source: Lumina, 2018

Effective Date: May 14, 2018 7-14
Condor Project, Ecuador
NI 43-101 Technical Report
Figure 7-10: Enma (E-W Section 95 5200N)
Source: Lumina, 2018

Effective Date: May 14, 2018 7-15
Condor Project, Ecuador
NI 43-101 Technical Report
Table 7.4: Mineralized Zones for Selected Enma Drill Holes shown in Figure 7-10
Hole From (m) To (m) Interval (m) Au ppm Ag ppm
DEN-30 10 28 18 0.35 3.2
64 204 140 1.62 27.8
DEN-34 8 28 20 0.28 3.3
52 94 42 0.28 6.6
106 234 128 3.23 25.8
306 324 18 0.37 6.4
DEN-37 8 20 12 0.33 4.7
34 44 10 0.39 11.8
100 132 32 0.41 6.4
158 174 16 0.59 25.9
190 230 40 0.64 14.5
Note: Weighted assay averages have been calculated using historic uncut assay values, a cutoff of 0.2 g/t Au and a
maximum internal dilution of 10 continuous metres. Intervals are core lengths and do not represent true thicknesses
as the orientation of the mineralized zone is unknown.
7.3.3 Southern Porphyry Zone
The southern porphyry zone, which hosts the Santa Barbara and El Hito deposits, is
underlain by volcanics of the Misahualli formation and intruded by the Zamora batholith. All
these sequences are unconformably overlain by sandstones, conglomerates and quartzites
of the Hollin formation (Figure 7-11).
Santa Barbara
Gold-copper mineralization at Santa Barbara is hosted in andesites of the Misahualli
formation. These volcanics have been intruded by narrow feldspar porphyry diorite dikes
which may represent apophyses of a deeper porphyry intrusion. The northern part of the
mineralized zone occurs near the contact between the volcanics and a hornblende
porphyritic diorite. Mineralization is associated with a stockwork of quartz veins and
potassic alteration consisting of fine-grained secondary biotite and K-feldspar. Propylitic
alteration characterized by chlorite-epidote-actinolite occurs as a halo around the potassic
alteration. Disseminated and vein-hosted mineralization is dominated by pyrite with lesser
chalcopyrite, sphalerite and pyrrhotite. The mineralized zone defined to date has
dimensions of 1.2 km north-south, 500 m east-west and extends to a depth of at least
500 m (Figures 7-11 and 7-12).

Effective Date: May 14, 2018 7-16
Condor Project, Ecuador
NI 43-101 Technical Report
Figure 7-11: Santa Barbara (Plan View)
Source: Lumina, 2018

Effective Date: May 14, 2018 7-17
Condor Project, Ecuador
NI 43-101 Technical Report
Figure 7-12: Santa Barbara (E-W Cross Section 954 4450N)
Note: Weighted assay averages have been calculated using historic uncut assay values, a cutoff of 0.2 g/t Au and a
maximum internal dilution of 10 continuous metres. Intervals are core lengths and do not represent true thicknesses
as the orientation of the mineralized zone is unknown.
Source: Lumina, 2018
El Hito
The mineralization at El Hito is hosted within a quartz stockwork zone developed within a
dioritic phase of the Zamora batholith. Moderate to strong phyllic-argillic alteration
consisting of illite-sericite-pyrite and an early potassic phase consisting of fine-grained
secondary biotite and K-feldspar are present. The alteration appears to be more intense in
the south. Overall sulphide content is low (<5%); chalcopyrite is the dominant sulphide with
lesser amounts of pyrite, molybdenite and bornite. Drilling, trenching and surface mapping
have defined mineralization over 2.5 km (north-south) by 1.0 km (east-west) and to vertical
depths of at least 600 m.

Effective Date: May 14, 2018 7-18
Condor Project, Ecuador
NI 43-101 Technical Report
A plan view of the drilling, geology and surface geochemistry is provided in Figure 7-13.
Figure 7-14 is an east-west vertical cross section viewing towards the north.
Figure 7-13: El Hito (Plan View)
Source: Lumina, 2018

Effective Date: May 14, 2018 7-19
Condor Project, Ecuador
NI 43-101 Technical Report
Figure 7-14: El Hito (E-W Cross Section 9544900N)
Note: Weighted assay averages have been calculated using historic uncut assay values, a cutoff of 0.15%
Cu and a maximum internal dilution of 10 continuous metres. Intervals are core lengths and do not
represent true thicknesses as the orientation of the mineralized zone is unknown.
Source: Lumina, 2018

Effective Date: May 14, 2018 8-1
Condor Project, Ecuador
NI 43-101 Technical Report
8 DEPOSIT TYPES
The Chinapintza veins and Condor breccia mineralization are low sulphidation epithermal
gold systems. Examples of this type of epithermal gold deposit include McLaughlin
(California), Hishikari (Japan), Waihi (New Zealand) and parts of Porgera (Papua New
Guinea). Characteristics of low sulphidation epithermal deposits (Sillitoe, 1993; White and
Hedenquist, 1995) include the following:
They principally occur in convergent tectonic settings.
They form at shallow depths (surface to < 2 km) from near neutral pH, sulphur-
poor, reduced fluids. The hydrothermal fluid is dominated by meteoric water.
Fluid over-pressuring triggered by the hydrothermal system creates structural
permeability (veins, stockworks, breccia, diatremes, etc.) for the mineralized
fluids. Boiling induced by brecciation is a likely gold-precipitating mechanism.
Three sub-types have been identified: sulphide-poor deposits associated with
rhyolites; sulphide (and base-metal-rich) deposits associated with andesites and
rhyodacites, and sulphide-poor deposits associated with alkali rocks.
Alteration zones for low sulphidation deposits consist of sericite, illite and
smectite. They are commonly restricted and visually subtle.
Open-space quartz veins are dominant and commonly display crustiform,
colloform, bladed, cockade and carbonate-replacement textures.
Carbonate veins are ubiquitous. Adularia, barite and/or fluorite are present
locally.
Sulphide content varies between 1% to 20% but is typically <5%. Pyrite is the
dominant sulphide, but sphalerite, galena, tetrahedrite and arsenopyrite are
common. Copper content is low and occurs mainly as chalcopyrite.
Vein stockwork mineralized material is common; disseminated and replacement
mineralized material is minor.
Low sulphidation gold systems have anomalously high gold, silver, arsenic,
antimony, mercury, zinc, lead, selenium, potassium, silver-gold and anomalously
low copper, tellurium, and selenium.
The Santa Barbara and El Hito deposits are porphyry gold-copper and copper-molybdenum
deposits, respectively. Mineralization is similar to typical Andean porphyry deposits (Lowell
and Guilbert, 1970; Panteleyev, 1995). Common features of a porphyry deposit include the
following:
Large zones (>10 km2) of hydrothermally altered rocks that commonly grade from
a central potassic core to peripheral phyllic-, argillic-, and propylitic-altered zones.
Generally low-grade mineralization consisting of disseminated, fracture, veinlet,
and quartz stockwork-controlled sulphide mineralization. Deposit boundaries are
determined by economic factors that outline the mineralized zones.

Effective Date: May 14, 2018 8-2
Condor Project, Ecuador
NI 43-101 Technical Report
Mineralization commonly zoned with a chalcopyrite-bornite-molybdenite core and
peripheral chalcopyrite-pyrite and pyrite. Enrichment of primary copper
mineralization by late-stage hypogene, high-sulphidation events can sometimes
occur.
Important geological controls on porphyry mineralization that include igneous
contacts, cupolas, and the uppermost, bifurcating parts of stocks and dike
swarms. Intrusive and hydrothermal breccias and zones of intensely developed
fracturing, due to coincident or intersecting multiple mineralized fracture sets
coincide commonly with the highest metal concentrations.
Modification by surface oxidation in weathered environments (e.g., Escondida).
Low-pH meteoric waters generated by the oxidation of iron sulphides leach
copper from hypogene copper sulphides, and oxidized copper minerals, such as
malachite, chrysocolla, and brochantite, and re-deposit copper as secondary
chalcocite and covellite immediately below the water table in flat tabular zones of
supergene enrichment. The process results in a copper-poor leach cap lying
above a relatively thin but high-grade zone of supergene enrichment that caps a
thicker zone of moderate-grade, primary hypogene mineralization.

Effective Date: May 14, 2018 9-1
Condor Project, Ecuador
NI 43-101 Technical Report
9 EXPLORATION
The Condor Project has seen extensive geological, geochemical and geophysical work
since 1993. Details of previous work are provided in previous NI 43-101 technical reports
(Easdon & Ovieda, 2004; Maynard et al., 2013 and 2014). A summary of the significant
results of this work is provided here.
9.1 Geochemistry
The property has seen extensive historical geochemical surveys (streams, soils, rocks).
Well-defined gold-copper soil anomalies are associated with Santa Barbara. El Hito has a
Cu-Mo soil anomaly (Figures 9-1, 9-2, 9-3). Other mineralized showings on the property
also have somewhat less extensive anomalous gold and copper soil values.
In addition to the soil surveys, an extensive amount of trenching (703 trenches / 14,650 m)
and channel sampling was completed by previous operators, primarily in the vicinity of the
Condor breccia pipes.

Effective Date: May 14, 2018 9-2
Condor Project, Ecuador
NI 43-101 Technical Report
Figure 9-1: Soil Geochemistry – Gold (Historical)
Note: Condor Project is outlined in blue; showings with mineral resources (this report) – red stars
Source: Lumina, 2018

Effective Date: May 14, 2018 9-3
Condor Project, Ecuador
NI 43-101 Technical Report
Figure 9-2: Soil Geochemistry – Copper (Historical)
Note: Condor Project is outlined in blue; showings with mineral resources (this report) – red stars
Source: Lumina, 2018

Effective Date: May 14, 2018 9-4
Condor Project, Ecuador
NI 43-101 Technical Report
Figure 9-3: Soil Geochemistry – Molybdenum (Historical)
Note: Condor Project is outlined in blue; showings with mineral resources (this report) – red stars
Source: Lumina, 2018

Effective Date: May 14, 2018 9-5
Condor Project, Ecuador
NI 43-101 Technical Report
In 2017, Lumina carried out soil surveys at Santa Barbara, Prometedor, Camp Zone,
Wanwintza Bajo and Wanwintza Alto. Details of the sampling in these areas are as follows:
Santa Barbara – lines at 260 m intervals, samples every 50 m; locally infill at
25 m.
Prometedor – lines at 300 to 400 m intervals, samples every 50 m.
Camp Zone – lines at 100 m intervals, samples every 25 m.
Wanwintza Bajo – lines at 260 m intervals, samples every 50 m.
Wanwintza Alto – samples every 50 m along ridge
At each sample site, an auger was used to collect approximately 500 g of the B soil horizon.
Sample depths ranged between 0.5 and 1 m. The sample was placed in a plastic or mesh
bag along with a sample tag. The samples were shipped to MS Analytical’s preparation lab
in Cuenca, Ecuador where they were dried and sieved and then sent to MS Analytical’s lab
in Vancouver, Canada. A 20 g sample was digested in aqua regia and analyzed for 39
elements using by an ICP-MS method. Copper and gold results for the soil sampling are
shown in Figures 9-4 and 9-5.
Infill sampling and duplication of parts of the historical sampling at Santa Barbara confirmed
the copper and gold soil anomalies which suggests that the Lumina sampling is
representative. There are no known factors which could have resulted in a sampling bias.

Effective Date: May 14, 2018 9-6
Condor Project, Ecuador
NI 43-101 Technical Report
Figure 9-4: Soil Geochemistry – Copper (Lumina)
Note: Condor Project is outlined in blue; showings with mineral resources (this report) – red stars
Source: Lumina, 2018

Effective Date: May 14, 2018 9-7
Condor Project, Ecuador
NI 43-101 Technical Report
Figure 9-5: Soil Geochemistry – Gold (Lumina)
Note: Condor Project is outlined in blue; showings with mineral resources (this report) – red stars
Source: Lumina, 2018

Effective Date: May 14, 2018 9-8
Condor Project, Ecuador
NI 43-101 Technical Report
Lumina’s sampling at Santa Barbara confirmed and expanded the previous copper-gold
anomaly. Elevated copper soil values now cover an area of 5.7 km (north-south) by 3.5 km
(east-west). The Prometedor copper-gold anomaly has been extended to the north-
northwest and now covers an area of 3 km (north-south) by 1.5 km (east-west). In addition,
a 300 m by 200 m gold soil anomaly is associated with the Camp Zone.
9.2 Geophysics
Geophysical surveys on the Condor Project are summarized in Table 9.1. The magnetic
surveys did not provide much useful data. The CSAMT surveys located areas of low
resistivity which correlate with the sulphide-rich Chinapintza veins (McMullan, 2007).
Table 9.1: Geophysical Surveys Condor Project
Year Company Type of Survey Kilometres Area Covered
1995 Zonge CSAMT 8.0 Chinapintza
1995 Zonge CSAMT 2 test lines Los Cuyes
1999 Geodatos Magnetics / IP 17.6 Santa Barbara
2006 Goldmarca (Geofisica
Consultores S.A.C.) IP 46.0 Condor Breccias
2006 Geofisica Consultores
S.A.C. Magnetics 51.9 Condor Breccias
2007 Geofisica Consultores
S.A.C. Magnetics / IP 24.2 Santa Barbara
2017 Lumina (Arce Geofisicos) Magnetics / IP 28.95 Santa Barbara
In 2006, a pole-dipole IP survey with an “a” spacing of 100 m was completed on northwest-
trending lines spaced at 100 or 200 m intervals over the Condor breccias (Figure 9-6). Only
the Enma breccia zone has high-chargeability values which reflect the sulphide
mineralization. The high-chargeability zones peripheral to the other breccia zones are
untested.

Effective Date: May 14, 2018 9-9
Condor Project, Ecuador
NI 43-101 Technical Report
Figure 9-6: IP Chargeability n=2 Condor Breccias
Source: Lumina, 2018; Geofisica Consultores, 2007
In 2007, a pole-dipole IP survey with an “a” spacing of 50 m was completed on northeast-
trending lines spaced at 200 m over the central part of the Santa Barbara zone (Figure 9-7).
In 2017, Lumina completed additional IP and ground magnetic surveys in the Santa
Barbara area (Arce, 2018). The surveys were conducted on northeast-trending lines spaced
at 250 m and covered soil geochemical anomalies located peripheral to the Santa Barbara
zone. The survey was conducted by Arce Geofisicos who used a pole-dipole array with an
“a” spacing of 50 m. Readings were recorded to n=10. The data from this survey was
merged and levelled with data from the 2007 IP survey. Figure 9-7 shows the IP
chargeability at a depth of 200 m. An IP chargeability high located immediately east of the
Santa Barbara Au-Cu zone may be due to the pyritic halo of the porphyry system. The IP

Effective Date: May 14, 2018 9-10
Condor Project, Ecuador
NI 43-101 Technical Report
anomaly in the western part of the survey area is associated with limestones and may be
related to skarn mineralization.
Figure 9-7: IP Chargeability 200 m Santa Barbara
Drill holes – blue dots
Source: Arce, 2018; Lumina, 2018

Effective Date: May 14, 2018 9-11
Condor Project, Ecuador
NI 43-101 Technical Report
Additional exploration targets are described in Table 9.2.
Table 9.2: Untested Exploration Targets Condor Project
Target Geochemistry Geology
Prometedor Anomalous gold ± silver and copper:
soils, rocks
Volcanics, Zamora batholith, porphyry intrusions, porphyry-type target
Wanwintza Alto Anomalous gold:
silts, soils Mesothermal quartz veins in
diorite
Wanwintza Bajo Anomalous gold: silts, soils, rocks
Andesites, diorite; similar to Santa Barbara
Camp Zone Anomalous gold: soils Rhyolite; similar style to
Condor breccias
Santa Barbara (east and west of known zone)
Anomalous gold and copper: soils, rocks
Andesites, sediments, diorite; porphyry-type
target

Effective Date: May 14, 2018 10-1
Condor Project, Ecuador
NI 43-101 Technical Report
10 DRILLING
There has been an extensive amount of drilling conducted on the Condor Project since
1994. This work is summarized in Tables 10.1 and 10.2.
Table 10.1: Drilling by Company Condor Project
Company Years # of Drill Holes Meterage
TVX 1994–2000 195 42,101.5
Goldmarca 2004–2007 124 21,612.2
Ecometals 2008 30 11,710.7
EGX 2012–2013 37 22,051.7
Lumina 2017–2018 9 1,907.4
TOTAL 395 99,383.5
Table 10.2: Drilling by Area Condor Project
Mineralization Type Prospect # of Drill Holes Meterage
Breccia Los Cuyes 78 21,725.2
Breccia Soledad 124 19,683.5
Breccia Enma 47 8,335.1
Breccia Others 5 1,681.1
Veins Chinapintza 76 21,245.5
Porphyry Cu El Hito 9 4,686.5
Porphyry Au-Cu Santa Barbara 56 22,026.6
TOTAL 395 99,383.5
Initial drilling was carried out by TVX between 1994 and 2000. Most of this work tested the
Chinapintza veins (75 holes; 20,488.9 m), but it also drilled a number of holes on the
Condor breccias (97 holes; 16,128.1 m), Santa Barbara (19 holes; 4,296.1 m) and El Hito
(4 holes; 1,188.3 m).
From 2004 to 2007, Goldmarca tested the Condor breccia pipes (124 holes; 21,612.2 m).
In 2008, Ecometals tested the Condor breccias (29 holes; 11,110.7 m) and Santa Barbara
(1 hole; 600 m).

Effective Date: May 14, 2018 10-2
Condor Project, Ecuador
NI 43-101 Technical Report
In 2012 and 2013, EGX tested the Chinapintza veins (1 hole; 756.6 m), the Los Cuyes and
Soledad breccias (4 holes; 2,573.8 m), Santa Barbara (27 holes; 15.223.2 m) and El Hito (5
holes; 3,498.2 m).
In 2017–2018, Lumina completed nine holes (1,907.4 m) testing geochemical and IP
anomalies peripheral to the Santa Barbara zone.
All drill core from the Condor Project is stored in a dry, secure building at Lumina’s Mirador
field camp.
Drilling completed on the project is shown in Figure 10-1. All holes were initially located
using a handheld Garmin GPS unit, and approximately one third of the holes have been
surveyed using a total station GPS.
Figure 10-1: Drill Collar Plan Map Condor Project
Source: Lumina, 2018

Effective Date: May 14, 2018 10-3
Condor Project, Ecuador
NI 43-101 Technical Report
For representative examples of drill sections for Los Cuyes, Soledad and Enma, refer to
Section 7 – Geological Setting and Mineralization.
10.1 TVX Gold Inc. (1994–2000)
TVX carried out several drill programs on the Condor Project between 1994 and 2000. It
used man-portable drills that produced HQ or NQ core. Downhole surveys were completed,
but the specific method is unknown, except at Santa Barbara where a Pajari instrument was
used. Most of the collars are marked with a concrete pad.
10.2 Goldmarca Ltd. (2004–2007) / Ecometals Ltd. (2007–2008)
Goldmarca and Ecometals carried out several drill programs between 2004 and 2008. One
hole was drilled at Santa Barbara in 2008 but the remaining 153 drill holes tested the
Condor Breccias (Los Cuyes, Soledad, Enma, Guayas, San Jose). All holes were drilled
using HQ size core, reducing to NQ as needed. Holes were located using a handheld GPS.
Downhole surveys were completed for 33 of the drill holes using a FLEXIT instrument which
takes readings at 3 or 6 m intervals.
Core recoveries were generally > 90% (Hughes, 2008).
10.3 Ecuador Gold and Copper Corp. (2012–2014)
EGX completed three phases of drilling from August 2012 until January 2014 (Maynard et
al., 2014) (37 holes; 22,051.7 m). Two contractors were used for this drilling: Roman Drilling
Corp. S.A. and Hubbard Perforaciones Cia., Ltda. (Hubbard), both based in Cuenca,
Ecuador. All holes were drilled using HTW (HQ) size core, reducing to NTW (NQ) as
needed. The Hubbard drills are worker-portable and similar to Hydracore 4,000 rigs. Holes
were located using a handheld Garmin GPS. Once a hole is completed, the hole location is
marked with a cement monument displaying the hole number, azimuth and dip.
A Reflex EZ-SHOT™ was used to provide downhole orientation data at 50 m intervals.
Core recoveries averaged approximately 93%.
One hole (756.6 m) tested the Chinapintza veins; one hole (638.5 m) tested the Los Cuyes
zone; three holes (1,935.3 m) tested the Soledad zone; 5 holes (3,498.2 m) tested the El
Hito porphyry target; and 27 holes (15,223.2 m) tested the Santa Barbara porphyry zone
and associated targets.
10.4 Lumina Gold Corp. (2017–2018)
In 2017–2018, Lumina used Hubbard to complete 9 HTW (HQ) drill holes (1,907.4 m) in the
Santa Barbara area. A Hydracore 2000 drill was used, and the drill was moved using a
small tractor. Holes were located using a handheld Garmin GPS.
A Reflex EZ-SHOT™ was used to provide downhole orientation data at 50 m intervals.
Core recoveries for the 2017–2018 drill program averaged just over 91%.

Effective Date: May 14, 2018 10-4
Condor Project, Ecuador
NI 43-101 Technical Report
Three targets peripheral to the main Santa Barbara mineralization were tested: Santa
Barbara NW, NE, and SE. Drill collar locations, orientations and depths are given in Table
10-3.
Table 10.3: Drill Collar Locations – Lumina 2017-2018
Hole East PSAD56 North PSAD56 Elevation Azimuth Dip Depth
DSB-45 765323 9545546 962 225 -45 116.8
DSB-46 765324 9545547 962 225 -70 100.6
DSB-47 765441 9545676 962 225 -45 158.5
DSB-48 765526 9545773 928 225 -50 270
DSB-49 765574 9545842 921 225 -60 335.3
DSB-50 766276 9544673 1095 45 -45 301.7
DSB-51 766278 9544675 1095 225 -45 277.1
DSB-52 766392 9544791 1168 225 -45 155.4
DSB-53 767156 9545263 1170 45 -45 192
Figure 10-2 is a plan map of the Santa Barbara zone showing IP chargeability at a depth of
200 m, Lumina and historical drilling, and gold soil anomalies.

Effective Date: May 14, 2018 10-5
Condor Project, Ecuador
NI 43-101 Technical Report
Figure 10-2: Plan Map Santa Barbara
Note: Traces of Vertical Cross Sections – Blue Lines
Source: Lumina, 2018
Two drill holes at Santa Barbara SE discovered porphyry gold-copper mineralization hosted
in andesite and an associated diorite intrusion (Lumina, May 14, 2018):
DSB-50: 60.00–122.00 m: 0.31 g/t Au, 0.13% Cu over 62.00 m
146.0–192.00 m: 0.51 g/t Au, 0.16% Cu over 46.00 m
262.00–301.75 m: 0.36 g/t Au, 0.17% Cu over 39.75 m
DSB-52: 102.00–155.45 m: 0.34 g/t Au, 0.11% Cu over 53.45 m
The mineralized intervals are core lengths and not true thicknesses of the zone. Additional
drilling is required to determine the extent and true orientation of the mineralization.
Figure 10-3 is a southwest-northeast oriented, vertical cross section showing the
relationship of the mineralization in the Lumina drill holes to the Santa Barbara zone.

Effective Date: May 14, 2018 10-6
Condor Project, Ecuador
NI 43-101 Technical Report
Figure 10-3: Santa Barbara SE – SW-NE Cross Section
Source: Lumina, 2018
Hole DSB-53 tested a gold soil anomaly and weak IP chargeability anomaly at Santa
Barbara NE. It intersected anomalous gold values near the collar (Lumina, May 14, 2018):
DSB-53: 36.00–48.00 m: 0.34 g/t Au, 0.03% Cu over 12.00 m
The mineralized interval is a core length and does not represent the true thickness of the
zone. Additional drilling is required to determine the extent and true orientation of the
mineralization.
Figure 10-4 is a southwest-northeast oriented, vertical cross section for hole DSB-53.

Effective Date: May 14, 2018 10-7
Condor Project, Ecuador
NI 43-101 Technical Report
Figure 10-4: Santa Barbara NE – SW-NE Cross Section
Source: Lumina, 2018
Drill holes DSB-45, 46, 47, 48 and 49 tested a gold soil anomaly at Santa Barbara NW. No
significant zones of gold mineralization were intersected.
Figure 10-5 is a southwest-northeast oriented, vertical cross section for Santa Barbara NW.

Effective Date: May 14, 2018 10-8
Condor Project, Ecuador
NI 43-101 Technical Report
Figure 10-5: Santa Barbara NW – SW-NE Cross Section
Source: Lumina, 2018
In the authors’ opinion, the core handling, logging, sampling and core storage protocols in
place on the Condor Project meet or exceed common industry standards, and the authors
are not aware of any drilling, sampling or recovery factors that could materially impact the
accuracy and reliability of these results.
10.5 Exploration Targets
El Hito
Currently there are nine drill holes that test the El Hito deposit over an area measuring
roughly 800 m north-south by 400 m west-east and to depths of over 800 m below surface.
The information is considered insufficient to support estimates of mineral resources due to
the following reasons:
1. limited drilling is available (9 holes) to provide confidence in a mineral resource
estimate.

Effective Date: May 14, 2018 10-9
Condor Project, Ecuador
NI 43-101 Technical Report
2. drill holes are widely spaced, exceeding 200 m spacing in some areas.
3. drilling does not define the limits of mineralization (the deposit remains “open” in
almost all directions).
An exploration target has been estimated based on the assumption that the mineralization
is continuous between drill holes and extends to a depth of between 150 m and 300 m
below surface. An average rock density of 2.65 t/m3 is derived from an average of 261 SG
measurements taken from samples at El Hito.
An exploration target at El Hito consists of approximately:
150–250M tonnes, 0.25–0.35% Cu, 0.003–0.005% Mo
This exploration target is not a mineral resource estimate and its potential quantity and
grade is conceptual in nature. There has been insufficient exploration to define a mineral
resource and it is uncertain whether further exploration will result in the delineation of a
mineral resource.
Chinapintza
There are over 100 drill holes plus numerous surface-trench samples that test the
Chinapintza deposit. There is insufficient geologic information to support an interpretation of
the mineralization, and, as a result, an estimate of mineral resources is not currently
feasible at Chinapintza.
Drilling at Chinapintza occurs over an area measuring roughly 1 x 1 km to depths of about
250 m below surface.
An exploration target at Chinapintza consists of approximately:
700–1,000k tonnes, 2–4 g/t Au, 50–130k ounces contained gold
This exploration target is not a mineral resource estimate and its potential quantity and
grade is conceptual in nature. There has been insufficient exploration to define a mineral
resource and it is uncertain whether further exploration will result in the delineation of a
mineral resource.

Effective Date: May 14, 2018 11-1
Condor Project, Ecuador
NI 43-101 Technical Report
11 SAMPLE PREPARATION, ANALYSES AND SECURITY
11.1 TVX Gold Inc. (1994–2000)
There is no detailed description of TVX’s sampling procedures or security measures for its
drill programs on the Condor Project. Ronning (2003) had access to the TVX files, and brief
descriptions of the sampling is included in his report. He stated that in 1995, TVX
contracted two sampling consultants to review its procedures (Pitard and Magri, 1995), and
it concluded that the sampling was done properly and that the results were generally
reliable.
The first eight holes on the Chinapintza veins were continuously sampled at 1 m intervals,
but, in subsequent holes, only potentially mineralized core was sampled. These samples
have variable lengths, sometimes less than 10 cm. At the Enma, Los Cuyes, San Jose and
Soledad breccias, the entire hole was sampled with sample intervals ranging from 1 to
2.5 m. Core was cut in half using a diamond saw. One half was sent for analysis, and the
other half was returned to the core box.
TVX sent its samples to Bondar Clegg or SGS in Ecuador for sample preparation. One
hundred grams of pulverized material was sent for analysis to its laboratories in Canada.
From 1994 until 1996, a 30 g sample was analyzed for gold using a fire assay with an
atomic absorption finish. In February 1996, the sample size was increased to 50 g. In 1999,
TVX used ALS Chemex to analyze the drill samples from Santa Barbara. Gold was
analyzed by fire assaying a 30 g sample. Copper and 33 other elements were analyzed
using ICP (Easdon & Ovieda, 2004).
In 2003–2004, Goldmarca reassayed 1,219 samples of TVX core from Los Cuyes, San
Jose and Santa Barbara and analyzed for gold using a screen fire assay method on a 50 g
sample. There is good correlation with the original assay results (Easdon & Oviedo, 2004).
11.2 Goldmarca Ltd. (2004–2007) / Ecometals Ltd. (2007–2008)
During the Goldmarca/Ecometals drill programs, the entire hole was sampled at 2 m
intervals using a diamond saw. Half the core was put into a marked sample bag which was
sealed with tape and put into a rice bag. The other half of the core was returned to the core
box and stored in the warehouse facility. Samples were taken by truck to Loja and then
shipped to the ALS Chemex preparation lab in Quito or Acme’s preparation lab in Cuenca.
When broken sample bags arrived at the lab, the sample was taken out of the process
stream, Goldmarca was notified, and the sample was retaken. Goldmarca inserted blanks
and certified standards into the sample stream as part of its QA/QC program.
The Acme samples were shipped to Vancouver for analysis. Gold and silver were analyzed
by fire assay with an ICP finish on a 30 g sample. Zinc, copper and lead were analyzed
using AA.

Effective Date: May 14, 2018 11-2
Condor Project, Ecuador
NI 43-101 Technical Report
In 2008, Ecometals completed a QA/QC report on the 2004–2008 sampling from the
various drill and trenching programs (Toledo & Toledo, 2008; Maynard et al., 2011).
11.3 Ecuador Gold and Copper Corp. (2012–2014)
The following procedures were in place for EGX’s 2012–2014 drill programs on the Condor
Project. The drillers put core into core boxes, and intervals were marked with wooden
blocks and permanent markers. The boxes were covered and secured with tape before
being transported by EGX employees from the drill to EGX’s secure core-logging facility
located at its Mirador field camp.
At the core facility, the core boxes were marked with intervals and hole numbers. Core was
cleaned and then photographed in two box sets. It was then examined by EGX geologists
and technicians who prepare geotechnical (RQD, recovery, hardness, fracture density) and
geological logs. Specific gravity measurements were taken every 10 to 15 m.
Sample intervals were determined by the geologist. The core was sampled at regular 1, 2
or 2.5 m intervals. The core was cut in half using a diamond saw. Half of the core was put in
a labelled plastic sample bag along with a numbered sample tag, and the bag was secured
with a tamper-proof zip tie. The other half was returned to the core box and stored in a
secure warehouse adjacent to the logging facility. Individual samples were packaged into
large containers or sealed poly woven bags and transported by EGX employees or a
bonded courier to Acme Lab’s sample preparation facility in Cuenca, Ecuador.
At the preparation lab, each sample was crushed so that >80% passed through a 10 mesh
screen. A 250 g split was pulverized so that >85% passes a 200 mesh screen. This was
then shipped to Acme Lab in Santiago, Chile for analysis. All samples were analyzed for
gold using a fire assay technique with an AA finish on a 30 g sample. Any sample with > 10
g/t Au was reassayed using a gravimetric method. Samples were analyzed for silver and
copper by ICP-ES after a four-acid digestion.
Three types of control samples were inserted after every 20 samples as part of the QA/QC
procedure. These include: certified reference standards from CDN Resource Laboratories
Ltd. (CDN) or OREAS, a blank (OREAS), and a quarter core duplicate sample.
11.4 Lumina Gold Corp. (2017–2018)
The core handling and sample procedures described here were used for Lumina’s 2017–
2018 drill program. The drillers place the HQ drill core in plastic boxes (four rows; total of
approximately 2.5 m per box). Wooden tags, marked with the downhole depth, are placed
in the box. Lids are placed on the box and taped shut. The core is then transported to the
nearest road and trucked to Lumina’s core facility at the Mirador exploration camp. Upon
receipt, Lumina field assistants check the depth and record the "FROM_TO" intervals on
the outside of the box. Photos are taken of both dry and wet core. Lumina geologists then
examine the core and prepare geotechnical and geological logs. The geotechnical log
includes: RQD, core recovery, fracture and vein quantity, and vein angles. Point-load and
density measurements are taken at 10 m intervals.

Effective Date: May 14, 2018 11-3
Condor Project, Ecuador
NI 43-101 Technical Report
For the 2017–2018 drill program, every 10th density sample is shipped to MS Analytical in
Vancouver for a second density measurement using paraffin-coated samples. This
information is entered directly into an Excel® spreadsheet for each hole.
At the Mirador exploration camp, core is cut in half using a diamond saw. For each 2 m
sample, half the core is put into a plastic bag, and the other half is returned to the core box
and stored on site. Bar-coded sample tags are included in each sample bag, and a
duplicate sample tag is stapled into the core box. Certified reference standards purchased
from CDN are inserted into the sample stream at the Mirador camp. Sample bags are
secured with a tamper-proof plastic zip tie and put into larger mesh sacks which are also
tied with a numbered, tamper-proof nylon tie.
Drill core samples from the 2017–2018 drill program were assayed by MS Analytical in
Vancouver, Canada. Sample shipments were picked up from the Mirador exploration camp
by a representative from Lac y Asociados Cia. Ltda. (MS Analytical’s preparation lab in
Cuenca, Ecuador) and delivered directly to its lab in Cuenca. The secure tamper-proof
plastic tag is checked against a list e-mailed to the lab. (Note: No irregularities were
detected in any sample shipments.) The samples are then crushed and pulverized.
For each sample, approximately 250 g of pulverized material is separated by riffle splitter
placed in a paper craft bag and shipped to MS Analytical in Vancouver for analysis.
Certified reference standards were delivered to MS Analytical and inserted into each
sample batch. All samples are analyzed for gold using a fire assay technique on a 30 g
charge. In addition, a 34-element ICP analysis was completed using a four-acid digestion.
QA/QC samples are inserted after every six core samples. These include three certified
standards (high, medium and low gold grades), a blank, and a coarse duplicate.
During the 2017–2018 drill program, 1,116 samples were analyzed: 55 were blanks, 55
were certified reference standards, 56 were coarse duplicates, and the remaining 950
samples were drill core.
Remaining reject and pulp material from the 2017–2018 drill program has been returned to
Lumina and is stored in a secure building located at the Mirador exploration camp.
In the authors’ opinion, the analytical procedures used for all the drill programs completed
on the Condor Project are appropriate and consistent with common industry practices. The
laboratories are recognized, accredited commercial assayers which are independent from
Lumina and previous operators. Lumina analysed their samples at MS Analytical which has
ISO/IEC 17025:2005 accreditation. EGX and Goldmarca/Ecometals used Acme Labs in
Santiago, Chile which had ISO 9001:2000 accreditation at the time the work was done. TVX
used Bondar Clegg (now ALS Chemex) which has ISO/IEC 17025:2017 accreditation and
SGS Canada which has ISO/IEC 17025 and ISO 9000 accreditation.
The sampling has been carried out by trained technical staff under the supervision of a QP
and in a manner that meets or exceeds common industry standards. Samples are properly
identified and transported in a secure manner from site to the lab.

Effective Date: May 14, 2018 12-1
Condor Project, Ecuador
NI 43-101 Technical Report
12 DATA VERIFICATION
12.1 Database Validation
12.1.1 Collar Coordinate Validation
The locations of approximately one third of the drill hole collars were validated using a total
station GPS. There were no significant differences found between these results and the
original surveyed locations. The surveyed collar locations correlate well with the digital
elevation model (DEM).
12.1.2 Downhole Survey Validation
The downhole survey data were validated by identifying any large discrepancies between
sequential dip and azimuth readings. No significant discrepancies were found.
12.1.3 Assay Verification
All the collars, surveys, geology and assays were exported from Excel® files into MineSight®
software. No identical sample identifications exist; all FROM_TO data are either zero or a
positive value; and no interval exceeds the total depth of its hole.
To validate the data, the following checks were confirmed:
The maximum depth of samples was checked against the depth of the hole.
The less-than-the-detection-limit values were converted into a positive number
equal to one-half the detection limit.
All gold values greater than 0.1 g/t from each drill hole were checked against the
original assay certificate.
The core recovery for the 2017–2018 drill program averaged just over 91%. Core
recoveries for previous drill programs were also >90%. There is no indication that grade is
related to core recovery.
12.2 Geological Data Verification and Interpretation
Several geological variables were captured during core logging. The geological data were
verified by confirming that the geological designations were correct in each sample interval.
This process included the following:
Examine FROM_TO intervals for gaps, overlaps and duplicated intervals.
Look for collar and sample identification mismatches.
Verify correct geological codes.
A geological legend was provided, and it was used to compare the values logged in the
database. The geological model was found to be reasonable and adequate for use.

Effective Date: May 14, 2018 12-2
Condor Project, Ecuador
NI 43-101 Technical Report
12.3 QA/QC Protocol
A comprehensive review of QA/QC from drilling and trench sampling programs prior to
2014 is provided in Maynard et al., (2011, 2014) and Hastings (2013). The reviews
indicated that no QA/QC data were available for the TVX drilling; however, there was very
little of that drilling in the deposits that are the subject of this report. Lumina completed a
resampling of the TVX holes from Los Cuyes as described below. Drill programs from
2004–2007 had a higher failure rate for gold in certified reference standards than would
normally be acceptable; however, duplicate samples validated original assays. The failure
rate for the 2007–2008 program was also higher than acceptable, but failures were
eventually identified as improperly labelled samples. Quality control failures for programs
from 2012–2015 were addressed with programs of remedial assay analysis. Quality control
issues with drill programs carried out by previous operators have been adequately
addressed.
In 2016, Lumina did selective resampling of EGX holes from Santa Barbara and TVX holes
from Los Cuyes. This included 15 core samples from Los Cuyes and 20 core samples, 20
pulps and 19 coarse rejects from Santa Barbara. Samples were evenly divided between
high (> 1 g/t), medium (0.5–1.0 g/t) and low (0.2–0.5 g/t) gold grades. Gold assays for this
resampling validated original assay results.
For the Lumina drill program, a review of the QA/QC protocols was conducted prior to
drilling and formalized in a detailed QA/QC manual developed by Lumina. Each drilling
phase was reviewed by a QP who was on site during the drill program. The procedures for
core processing and the insertion of blanks and standards were examined. The QA/QC
program was conducted in accordance with industry best practices as described in Section
11 (Sample Preparation, Analyses and Security) of this Technical Report.
During the 2017–2018 drill program, 1,116 samples were analyzed: 55 were blanks, 55
were certified reference material, 56 were coarse duplicates and the remaining 950
samples were drill core. After each batch of analytical results came in, the QA/QC samples
were reviewed by a Lumina geologist. Lumina’s QA/QC consultant also reviewed the data
on a regular basis.
Lumina’s QA/QC consultant confirmed that the results from the 2017 drill program are
acceptable.
12.4 Assay Database Verification
Sixteen drill holes scattered over the four deposits were selected at random. The sample
assay values in the selected holes were checked against original assay certificates. The
review confirmed the electronic database contains correct information and can be used for
mineral resource estimation.

Effective Date: May 14, 2018 12-3
Condor Project, Ecuador
NI 43-101 Technical Report
12.5 Conclusion
In the authors’ opinion, the database management, validation and assay QA/QC protocols
are consistent with common industry practices. Therefore, the database is acceptable for
use in this Report.

Effective Date: May 14, 2018 13-1
Condor Project, Ecuador
NI 43-101 Technical Report
13 MINERAL PROCESSING AND METALLURGICAL TESTING
There have been several metallurgical studies of the various mineralized zones on the
Condor Project. The test samples referenced are representative of the various types and
styles of mineralization and the mineral deposits as a whole. The following is a summary of
work completed on the Condor breccias and the Santa Barbara zone.
13.1 Condor Breccias
In 1995, two composite samples of mineralization from the San Jose deposit were
processed at CIMM in Santiago, Chile (CIMM, 1995):
SJ-1A – 180 kg, 4.6 g/t Au, 9 g/t Ag, 0.86% Zn
SJ-1B – 170 kg, 1.4 g/t Au, 9 g/t Ag, 0.39% Zn
Tests included: grinding studies, column leach tests, direct cyanidation of the mineralized
material and flotation tests followed by cyanidation of the concentrate. A summary of this
work is as follows:
The column cyanide leach tests on -½ inch and -¼ inch material produced gold
recoveries of 65% to 69% and 72% to 79%, respectively. Silver recoveries were
lower, ranging between 15% and 47%. Metal extraction may be improved by
using a finer mineralized material particle size.
Direct cyanidation of mineralized material was tested using -100 mesh and -200
mesh particle sizes. Recoveries ranged between 84% and 91% for sample SJ-1A
and 93% for sample SJ-1B.
A 20-minute flotation test provided a concentrate with 45 g/t Ag and 28 g/t Au
(with recoveries of 15.4% in weight and 92.7% in gold) for sample SJ-1A, and 70
g/t Ag and 17 g/t Au (with recoveries of 5.6% in weight and 92.4% in gold) for
sample SJ-1B. Cyanidation of the concentrate without regrinding yielded high
gold recoveries (93% to 95% for SJ-1A and 93% to 97% for SJ-1B). This
produced an overall gold recovery that ranged from 86% to 88% for SJ-1A and
89% to 90% for SJ-1B.
Preliminary bond grinding indices were 11.0 kWh/sht for SJ-1A and 11.5 kWh/sht
for SJ-1B.
In 2004, six composites, comprising material from the Los Cuyes (four samples) and San
Jose (two samples) zones, were tested for direct cyanidation (Laudauro, 2004). The
samples were in contact with cyanide solutions for 72 and 96 hours. Recoveries were very
high, ranging from 82% to 98% for Au and 74% to 95% for Ag.
In 2006, a composite sample from the San Jose zone was tested at IML in Western
Australia. Whole mineralized material leach tests yielded gold recoveries ranging from 63%
to 73%. Higher gold recoveries (88% to 92%) were achieved using a combination of gravity
and flotation, regrind and cyanide leaching.

Effective Date: May 14, 2018 13-2
Condor Project, Ecuador
NI 43-101 Technical Report
In 2008, cyanide bottle roll tests were completed on 64 samples from various mineral
occurrences on the Condor Project. This work was completed at G&T Metallurgical
Services Ltd. in Kamloops, Canada (Maynard et al., 2014; Short et al., 2015). A summary of
this work is as follows:
The low-grade samples (less than 0.3 g/t Au) leached very poorly. On average,
10% of the gold and 6% of the silver were recovered.
The medium grade composites (0.3 to 1.0 g/t Au) yielded recoveries of 48% for
gold and 17% for silver.
For samples with greater than 1 g/t Au, the leach performance improved to 58%
for gold and 20% for silver.
Of the variables investigated, the gold grade had a marginal effect on leaching
performance. In general, the maximum gold recovery reached a plateau at 60%.
There were no correlations between gold leaching performance and sulphur-feed
grade.
13.2 Santa Barbara
In 2013, samples from the Santa Barbara deposit were sent to Phillips Enterprises LLC in
Golden, Colorado, USA for metallurgical testing (Phillips, 2013; Short et al., 2015). Seven
drill holes, which are spatially distributed throughout the deposit, were used to make four
composites (Table 13.1): a low, medium and high-grade sample of andesite and a low-
grade sample of the diorite porphyry.
Table 13.1: Composites at Santa Barbara for Metallurgical Testing (2013)
Composite # Weight
(kg) Rock Type
Au (g/t)
Ag (g/t)
Cu (%)
1 47.8 Andesite 1.1 2 0.136
2 30.6 Andesite 0.7 2 0.128
3 47.4 Andesite 0.4 2 0.104
4 16.7 Diorite porphyry 0.3 <1 0.074
These composites were used for grinding, mineralogy, cyanidation and flotation tests.
Diagnostic leach testwork and additional flotation and leaching of flotation concentrate and
tailings was completed at Resource Development Inc. (RDi) in Denver, Colorado (Randall,
2013 and 2014). QEMSCAN® mineral studies were conducted at Colorado School of Mines
in Golden, Colorado. A summary of the results of this work is as follows:
Bond mill grindability tests on composites 2 and 3 confirm that the rock is hard
with ball mill work indices of 24.97 and 22.07 kWh/mt, respectively.
Carbon-in-leach processing will extract 85.4% of the gold.
Gold is not refractory and can be recovered by cyanidation without the need for
oxidation processes.

Effective Date: May 14, 2018 13-3
Condor Project, Ecuador
NI 43-101 Technical Report
Consumption of lime and cyanide are relatively low.
Whole mineralized material cyanidation tests suggest that gold extraction is
sensitive to grind size: finer grinding provides higher recoveries. Gold extraction
at 48 hours is approximately 85% for all the composites. Silver content of the
mineralized material is low, and silver recoveries of approximately 20% can be
expected. Gold dissolves quickly with maximum extraction occurring between 12
and 24 hours’ residence time.
Sequential copper analyses by RDi indicates that 4.6% of the copper is acid
soluble (i.e., oxide), 4.0% of the copper is cyanide soluble (i.e., secondary), and
the remaining 91.4% is primarily chalcopyrite.
Rougher flotation tests produce a concentrate mass of 10.9% of the feed with
recoveries of 65.3% for gold, 80.6% for copper, and 70.7% for silver.
There are no deleterious elements present.
The proposed processing method includes a flotation circuit to produce a copper
concentrate with gold credits followed by a carbon-in-pulp circuit for the flotation tailings to
recover gold and silver. The loaded carbon would pass through an elution and acid wash,
and gold and silver would be recovered by electrowinning and, subsequently, smelted to
produce doré.
Based on the metallurgical work, overall recoveries for the Project are estimated to be 87%
for gold, 80% for copper and 60% for silver.

Effective Date: May 14, 2018 14-1
Condor Project, Ecuador
NI 43-101 Technical Report
14 MINERAL RESOURCE ESTIMATE
14.1 Introduction
The mineral resource estimate was prepared under the direction of Robert Sim, P.Geo.,
with the assistance of Bruce Davis, PhD, FAusIMM. Mr. Sim is the independent QP within
the meaning of NI 43-101 for the purposes of mineral resource estimates contained in this
Report. This section of the Report describes the mineral resource estimation methodology
and summarizes the key assumptions considered by the QP to prepare the resource
models for gold, silver and copper at the Santa Barbara, Soledad, Los Cuyes, and Enma
deposits located on the Condor Project.
In the opinion of the QP, the mineral resource evaluation reported herein is a reasonable
representation of the mineralization found at the Condor Project at the current level of
sampling. The mineral resource has been estimated in conformity with generally accepted
CIM Estimation of Mineral Resource and Mineral Reserves Best Practices Guidelines
(November 23, 2003) and is reported in accordance with NI 43-101. Mineral resources are
not mineral reserves, and they do not have demonstrated economic viability.
Historical estimates for the Santa Barbara deposit are described in a PEA technical report
(effective date May 19, 2015) prepared for EGX by GBM Minerals Engineering Consultants
Limited (GBM).
Historical estimates for the Soledad, Los Cuyes and Enma deposits are described in a
technical report (effective date July 23, 2013) prepared for EGX by Al Maynard &
Associates.
Estimations are made from 3D block models based on geostatistical applications using
commercial mine planning software (MineSight™ v12.50). The project limits are based in
the UTM coordinate system (PSAD56 Zone17S) using a nominal block size measuring 10 x
10 x 10 m. Drill holes penetrate the sub-vertical-trending deposits at a variety of orientations
to depths approaching 800 m below surface. The mineral resource estimates were
generated using drill hole sample assay results and the interpretation of geological models
which relates to the spatial distribution of gold, silver and copper. Interpolation
characteristics were defined based on the geology, drill hole spacing, and geostatistical
analysis of the data. The mineral resources were classified according to their proximity to
the sample data locations and are reported, as required by NI 43-101, according to the CIM
Definition Standards for Mineral Resources and Mineral Reserves (May 2014).
This report includes estimates for mineral resources. No mineral reserves were prepared or
reported.
14.2 Available Data
Lumina provided the drill hole sample data for the Condor Project on April 5, 2018. This
comprised a series of Excel® (spreadsheet) files containing collar locations, downhole
survey results and geologic information. The distribution of sample data for the various

Effective Date: May 14, 2018 14-2
Condor Project, Ecuador
NI 43-101 Technical Report
deposits is shown in plan view in Figure 14-1. This Report contains estimates of mineral
resources for four deposits: Santa Barbara, to the south; and Soledad, Los Cuyes and
Enma to the north.
Chinapintza comprises a series of narrow gold-bearing veins, and, currently, there is
insufficient information available to correlate the numerous mineralized veins, and, as a
result, the current data does not support an estimate of mineral resources for the
Chinapintza deposit.
Figure 14-1: Plan View of Drilling on the Condor Property
Source: SIM Geological Inc., 2018

Effective Date: May 14, 2018 14-3
Condor Project, Ecuador
NI 43-101 Technical Report
The sample database includes a series of chip/channel samples from trenches collected
over the Soledad, Los Cuyes, and Enma deposits. Studies show that the trench samples
are similar to proximal drill hole samples, and, as a result, the trench sample data have
been retained for use in the estimate of mineral resources in these deposits. The summary
of available sample data in each of the deposit areas is summarized in Table 14.1.
Table 14.1: Summary of Sample Data by Type and Deposit Area
Deposit # Drill Holes
Total Length of Drilling
(m)
Total Length of Gold
Samples in Drilling
(m)
# Trenches
Total Length of Trenches
(m)
Total Length of
Gold Samples in Trenches
Santa Barbara 56 22,027 21,604 0 0 0
Soledad 124 19,684 19,291 140 6,511 6,404
Los Cuyes 78 21,527 21,188 294 5,088 5,038
Enma 47 8,335 8,293 110 1,896 1,859
Note: Original sample data weighted by sample length.
Most of the drilling on the property was conducted by TVX and EGX as described in Section
10 (Drilling). In 2017, Lumina drilled nine exploration holes that tested soil and IP
chargeability anomalies peripheral to the Santa Barbara deposit.
Figures 14-2 and 14-3 show the plan and isometric views, respectively, of the gold grades
in drilling in the Santa Barbara deposit area.
Figures 14-4 and 14-5 show the plan and isometric views, respectively, of the gold grades
in drilling in the Soledad, Los Cuyes, Enma and Chinapintza deposit areas.

Effective Date: May 14, 2018 14-4
Condor Project, Ecuador
NI 43-101 Technical Report
Figure 14-2: Plan View of Gold Grades in Drilling in the Santa Barbara Deposit Area
Source: SIM Geological Inc., 2018
Figure 14-3: Isometric View of Gold Grades in Drilling in the Santa Barbara Deposit Area
Source: SIM Geological Inc., 2018

Effective Date: May 14, 2018 14-5
Condor Project, Ecuador
NI 43-101 Technical Report
Figure 14-4: Plan View of Gold Grades in Drilling in the Soledad, Los Cuyes, Enma and Chinapintza Deposit Areas
Source: SIM Geological Inc., 2018
Figure 14-5: Isometric View of Gold Grades in Drilling in the Soledad, Los Cuyes, Enma and Chinapintza Deposit Areas
Source: SIM Geological Inc., 2018

Effective Date: May 14, 2018 14-6
Condor Project, Ecuador
NI 43-101 Technical Report
The basic statistical properties of the sample database in each of the deposit areas are
shown in Tables 14.2 to 14.5. Most of the samples were analyzed for a variety of elements
(as part of a multi-element package) and the data for elements of interest (i.e., gold, silver
and copper) were extracted and imported into MineSight™ for resource modelling.
Essentially, all core intervals have been sampled and analyzed. Missing sample data
generally represent short intervals of overburden or (rare) abandoned drill holes. In some
rare instances, there are some drill holes that have not been analyzed for specific elements
like copper. There have been no modifications to the database to account for missing data.
Note: Sampling at the Chinapintza deposit is much more selective; only about 25% of the
core intervals have been sampled and analyzed.

Effective Date: May 14, 2018 14-7
Condor Project, Ecuador
NI 43-101 Technical Report
Table 14.2: Summary of Basic Statistics of Sample Data in the Santa Barbara Deposit Area
Element # of
Samples Total Sample
Length (m) Min Max Mean Std. Dev.
Gold (g/t) 21,146 21,604 0.003 6.825 0.280 0.4004
Silver (g/t) 21,146 21,604 0.1 125.6 0.75 2.512
Copper (%) 21,146 21,604 0 0.69 0.07 0.058
Note: Original sample data weighted by sample length.
Table 14.3: Summary of Basic Statistics of Sample Data in the Soledad Deposit Area
Element # of
Samples Total Sample
Length (m) Min Max Mean Std. Dev.
Gold (g/t) 13,572 25,695 0.003 25.17 0.482 1.198
Silver (g/t) 13,514 25,460 0.1 200 4.1 6.85
Copper (%) 12,906 23,960 0 2 0.01 0.036
Note: Original sample data weighted by sample length.
Table 14.4: Summary of Basic Statistics of Sample Data in the Los Cuyes Deposit Area
Element # of
Samples Total Sample
Length (m) Min Max Mean Std. Dev.
Gold (g/t) 15,702 26,226 0 109.19 0.508 1.9972
Silver (g/t) 15,648 26,097 0 1,024.1 4.8 15.16
Copper (%) 15,109 24,725 0 3.2 0.01 0.029
Note: Original sample data weighted by sample length.
Table 14.5: Summary of Basic Statistics of Sample Data in the Enma Deposit Area
Element # of
Samples Total Sample
Length (m) Min Max Mean Std. Dev.
Gold (g/t) 5,269 10,151 0.003 256.66 0.4533 4.945
Silver (g/t) 5,269 10,151 0.1 1,799.00 7.57 35.44
Copper (%) 3,213 5,838 0 2.35 0.018 0.058
Note: Original sample data weighted by sample length.

Effective Date: May 14, 2018 14-8
Condor Project, Ecuador
NI 43-101 Technical Report
Other data used in the determination of mineral resource estimates:
Specific gravity (SG) data are only available for drill holes in the Santa Barbara
area.
Topographic data were provided in the form of 3D contour lines on 10 m (vertical)
intervals as shown in Figures 14-1 through 14-5. This information was used to
generate a 3D digital terrain surface over the property. The topographic surface
correlates well with the drill hole collar locations and the surface-trench sample
data.
Geologic information derived from observations during core logging provide
lithology code designations for the various rock units present on the property.
Interpreted 3D domains for lithologic units in the Santa Barbara, Soledad and Los
Cuyes deposit areas that were produced by EGX.
A report titled Geological Mapping Program, Los Cuyes, Zamora-Chinchipe,
Ecuador by Warren Pratt, Specialized Geological Mapping Ltd. (February 2017).
The PEA technical report by GBM (effective date May 19, 2015) (Short et al.,
2015) includes a mineral resource estimate for the Santa Barbara deposit only
(originally produced in March 2014).
Technical reports by Al Maynard & Associates (effective date March 24, 2014)
include mineral resource estimates for the Santa Barbara, Soledad, Los Cuyes
and Enma deposits.
14.3 Geological Model and Domains
As described in Sections 7 (Geological Setting and Mineralization) and 8 (Deposit Types),
the Condor mineral deposits result from processes associated with the emplacement of
intrusive volcanic rocks. Santa Barbara is interpreted to be a porphyry-type deposit and
mineralization at Soledad, Los Cuyes and Enma is related to a series of diatreme intrusions
and associated breccias. As stated previously, the data package includes 3D domains
representing some of the lithologic units in the Santa Barbara, Soledad and Los Cuyes
deposit areas (no interpreted domains were provided for the Enma deposit). Also available
is geologic information, derived from observations during core logging, that provide lithology
code designations of the various rock units present on the property.
There is no indication of any significant overburden at the Soledad, Los Cuyes and Enma
deposits. Overburden has been intersected in only several drill holes in the Santa Barbara
area, and, when encountered, it is generally less than 2 to 3 m thick. As a result, no
adjustments were made to account for overburden in any of the mineral resource models.
Other than some thin surficial oxidation where sulphides occur at surface, there are no
indications of significant oxidation of the rocks on the Condor property.
A series of grade shell domains have been interpreted for each deposit area that
encompass zones where there is continuous mineralization above a threshold grade of

Effective Date: May 14, 2018 14-9
Condor Project, Ecuador
NI 43-101 Technical Report
0.1 g/t Au. These domains were manually interpreted and are influenced by available
lithology domains as well as probability grade shells that represent areas where there is a
>50% probability that the grade will be above 0.1 g/t Au. The shape and extent of the grade
shell domains are shown in Figures 14-6 and 14-7.
Figure 14-6: Gold Grade Shell Domain at Santa Barbara
Source: SIM Geological Inc., 2018
Figure 14-7: Gold Grade Shell Domains at Soledad, Los Cuyes and Enma
Source: SIM Geological Inc., 2018
14.4 Specific Gravity Data
SG data are only available for the Santa Barbara area. SG measurements are determined
using the water immersion method (weight in air versus weight in water). There are 1,459
individual measurements of SG ranging from 1.31 to 5.37, with an average of 2.66.
Typically, SG measurements were conducted on samples spaced at 10 m intervals down
each drill hole. The distribution of SG data appears to be potentially suspect; there are a
string of holes (DSP-23 through DSP-30) that have numerous SG values less than 2.0.

Effective Date: May 14, 2018 14-10
Condor Project, Ecuador
NI 43-101 Technical Report
Currently, it is not known what caused these low SG values, but, since they occur in a string
of holes, it suggests there was a “problem” with the measurement process during this
portion of the drilling. Any SG data that were less than 2.0 or greater than 3.4 were not
used in the estimate of mineral resources at Santa Barbara.
14.5 Compositing
Compositing the drill hole samples helps standardize the database for further statistical
evaluation. This step eliminates any effect that inconsistent sample lengths might have on
the data.
To retain the original characteristics of the underlying data, a composite length was
selected that reflects the average original sample length. The generation of longer
composites can result in some degree of smoothing which could mask certain features of
the data. At Soledad, Los Cuyes and Enma, the average sample length is 1.8 m with 40%
of samples measuring 1 m long, and 48% of samples measuring exactly 2 m long. At Santa
Barbara, sample intervals are more variable and are generally taken over shorter intervals.
The overall average sample length is only 1.1 m, but about 18% of samples are exactly 2 m
long. A composite length of 2 m was selected for all deposits.
Drill hole composites are length-weighted and were generated down-the-hole; this means
that composites begin at the top of each hole and are generated at 2 m intervals down the
length of the hole.
14.6 Exploratory Data Analysis
Exploratory data analysis (EDA) involves the statistical summarization of the database to
better understand the characteristics of the data that may control grade. One of the main
purposes of this exercise is to determine if there is evidence of spatial distinctions in grade
which may require the separation and isolation of domains during interpolation. The
application of separate domains prevents unwanted mixing of data during interpolation,
and, therefore, the resulting grade model will better reflect the unique properties of the
deposit. However, applying domain boundaries in areas where the data are not statistically
unique may impose a bias in the distribution of grades in the model.
A domain boundary, which segregates the data during interpolation, is typically applied if
the average grade in one domain is significantly different from that of another domain. A
boundary may also be applied if there is evidence that a significant change in the grade
distribution has occurred across the contact.
14.6.1 Basic Statistics by Domain
Initially, the basic statistics for the distribution of gold, silver and copper were evaluated
using the logged lithology code data (where available). The results show that mineralization
occurs, to some degree, in essentially all rock types. Following this, the interpreted 3D
lithology domains were used to back-code composited sample data, and the statistical
evaluations of these domains also show that mineralization tends to occur, to some degree,
in all rock types. These results suggest that, although the mineralization in these deposits is
Effective Date: May 14, 2018 14-11
Condor Project, Ecuador
NI 43-101 Technical Report
associated with the emplacement of volcanic intrusions, the mineralization is present in
both the intrusive rocks and, to some degree, in the surrounding host rocks.
The boxplots in Figure 14-8 show the distributions of gold, silver and copper inside and
outside of the interpreted grade shell domains. The differences in the gold distributions
inside versus outside are quite apparent, with low gold grades present outside of the
domains. Silver grades generally differ inside versus outside, but appreciable silver remains
outside of the domains, especially at Enma and Santa Barbara. Copper grades are
generally quite low but tend to be slightly higher inside the grade shell domains.

Effective Date: May 14, 2018 14-12
Condor Project, Ecuador
NI 43-101 Technical Report
Figure 14-8: Boxplots Comparing Sample Data Inside and Outside of the Grade Shell Domains
Source: SIM Geological Inc., 2018
14.6.2 Contact Profiles
Contact profiles evaluate the nature of grade trends between two domains: they graphically
display the average grades at increasing distances from the contact boundary. Those
contact profiles that show a marked difference in grade across a domain boundary indicate

Effective Date: May 14, 2018 14-13
Condor Project, Ecuador
NI 43-101 Technical Report
that the two datasets should be isolated during interpolation. Conversely, if a more gradual
change in grade occurs across a contact, the introduction of a hard boundary (e.g.,
segregation during interpolation) may result in a much different trend in the grade model; in
this case, the change in grade between domains in the model is often more abrupt than the
trends seen in the raw data. Finally, a flat contact profile indicates no grade changes across
the boundary; in the case, hard or soft domain boundaries will produce similar results in the
model.
A series of contact profiles were generated to evaluate the nature of gold, silver and copper
across the grade shell domain boundaries. Figure 14-9 shows that while the gold grade
tends to somewhat transition across the boundary, the average grades are significantly
different between the inside and outside. Therefore, due to the extremely low average
grade outside the boundary, a hard boundary of distinct contact should be applied.
Figure 14-9: Contact Profiles for Gold Inside vs. Outside Grade Shell Domains
Source: SIM Geological Inc., 2018
The change in silver grades across the grade shell domains is less apparent at the grade
shell contacts as shown in Figure 14-10. Marginal increases for the average grades inside
the shells are seen at Santa Barbara, Soledad and Enma, but there is no change in silver
grade across the domain contact at Los Cuyes.
Figure 14-10: Contact Profiles for Silver Inside vs. Outside Grade Shell Domains
Source: SIM Geological Inc., 2018

Effective Date: May 14, 2018 14-14
Condor Project, Ecuador
NI 43-101 Technical Report
The contact profiles for copper, shown in Figure 14-11, are an indication of the generally
low copper grades in these deposits, especially at Soledad, Los Cuyes and Enma, where
there is no change in grade evident across the grade shell domain contacts. There is,
however, a minor jump in copper grades across the contact at Santa Barbara.
Figure 14-11: Contact Profiles for Copper Inside vs. Outside Grade Shell Domains
Source: SIM Geological Inc., 2018
14.6.3 Conclusions and Modelling Implications
The results of the EDA indicate that the gold grades within the interpreted grade shell
domains are significantly different than those in the surrounding area, and that these
domains should be treated as distinct or hard boundary domains during block grade
estimations, eliminating the mixing of sample data during block grade interpolation. The
silver and copper grades are generally quite low, but the distributions tend to show higher
grades are more likely to occur inside the shells. A similar hard boundary approach to the
grade shell domains is, therefore, applied during the estimation of these secondary metals
in the mineral resource models.
14.7 Evaluation of Outlier Grades
Histograms and probability plots for the distribution of gold, silver and copper were
reviewed to identify the presence of anomalous outlier grades in the composited (2 m)
database. Following a review of the physical location of potentially erratic samples in
relation to the surrounding sample data, it was decided that these would be controlled
during block grade interpolations using a combination of traditional top-cutting and the
application of outlier limitations.
An outlier limitation controls the distance of influence of samples above a defined grade
threshold. During grade interpolations, samples above the outlier thresholds are limited to a
maximum distance-of-influence of 50 m at Santa Barbara and 15 m at Soledad, Los Cuyes
and Enma. It should be noted that essentially all potentially anomalous samples occur
inside of the grade shell domains. There is only limited sample data outside of the grade
shell domains, and, what is present tends to be very low grade. The grade thresholds for
gold, silver and copper, and the resulting effects on the models, are shown in Table 14.6.

Effective Date: May 14, 2018 14-15
Condor Project, Ecuador
NI 43-101 Technical Report
Table 14.6: Treatment of Outlier Sample Data
Element Deposit Maximum Top-cut
Limit Outlier Limit
Metal Lost (%)
Gold (g/t)
Santa Barbara 6.825 - 2.7 2
Soledad 21.290 - 9 2
Los Cuyes 69.540 - 20 9
Enma 256.660 30 15 20
Silver (g/t)
Santa Barbara 125.6 - 20 14
Soledad 200.0 - 70 3
Los Cuyes 595.0 250 150 7
Enma 1799.0 300 150 7
Copper (%)
Santa Barbara 0.69 - 0.3 2
Soledad 1.04 - 0.5 4
Los Cuyes 1.35 - 0.2 2
Enma 2.35 1 0.3 13
Note: 2 m composited drill hole data.
Higher losses of contained metal due to the treatment of outlier samples are the result of
skewed data distributions and the increased spacing of drill holes.
14.8 Variography
The degree of spatial variability in a mineral deposit depends on both the distance and
direction between points of comparison. Typically, the variability between samples
increases as the distance between those samples increases. If the degree of variability is
related to the direction of comparison, then the deposit is said to exhibit anisotropic
tendencies which can be summarized with the search ellipse. The semi-variogram is a
common function used to measure the spatial variability within a deposit.
The components of the variogram include the nugget, the sill and the range. Often samples
compared over very short distances, even samples compared from the same location, show
some degree of variability. As a result, the curve of the variogram often begins at some
point on the y-axis above the origin: this point is called the nugget. The nugget is a measure
of not only the natural variability of the data over very short distances but also a measure of
the variability which can be introduced due to errors during sample collection, preparation,
and the assay process.
The amount of variability between samples typically increases as the distance between the
samples increases. Eventually, the degree of variability between samples reaches a
constant, maximum value: this is called the sill, and the distance between samples at which
this occurs is called the range.

Effective Date: May 14, 2018 14-16
Condor Project, Ecuador
NI 43-101 Technical Report
In this report, the spatial evaluation of the data was conducted using a correlogram rather
than the traditional variogram. The correlogram is normalized to the variance of the data
and is less sensitive to outlier values, generally giving better results.
Variograms were generated using the commercial software package Sage 2001©
developed by Isaaks & Co. Multidirectional variograms were generated from the
distributions of gold, silver and copper located inside the grade shell domains. Note: The
same variograms are used to estimate grades both inside and outside of the grade shell
domains. The results are summarized in Tables 14.7 through 14.10.
Table 14.7: Variogram Parameters – Santa Barbara
Element Nugget Sill 1 Sill 2 1st Structure 2nd Structure
Range (ft)
Azimuth (°)
Dip Range
(ft) Azimuth
(°) Dip
Gold
0.387 0.130 0.482 79 3 7 296 65 -65
Spherical 38 115 72 162 13 16
15 271 17 103 108 19
Silver
0.269 0.552 0.180 148 105 -35 485 265 -6
Spherical 77 336 -42 66 177 18
6 37 28 64 338 71
Copper
0.200 0.459 0.341 45 336 0 1141 276 63
Spherical 29 246 89 222 18 6
27 66 1 123 111 27
Note: Correlograms conducted on 2 m composite sample data.

Effective Date: May 14, 2018 14-17
Condor Project, Ecuador
NI 43-101 Technical Report
Table 14.8: Variogram Parameters – Soledad
Element Nugget Sill 1 Sill 2 1st Structure 2nd Structure
Range (ft) Azimuth
(º) Dip Range (ft)
Azimuth (º)
Dip
Gold
0.350 0.464 0.187 91 125 -64 574 36 89
Spherical 36 33 -1 83 69 -1
14 302 -26 35 339 0
Silver
0.350 0.337 0.313 84 264 50 397 16 84
Spherical 29 111 37 40 169 5
20 11 14 24 79 -3
Copper
0.350 0.406 0.244 16 54 0 213 265 72
Spherical 15 33 -90 114 82 18
13 144 0 38 172 1
Note: Correlograms conducted on 2 m composite sample data.
Table 14.9: Variogram Parameters – Los Cuyes
Element Nugget Sill 1 Sill 2 1st Structure 2nd Structure
Range (ft)
Azimuth (º)
Dip Range
(ft) Azimuth
(º) Dip
Gold
0.450 0.442 0.108 25 6 -10 156 288 60
Spherical 20 99 -20 108 172 14
8 71 67 33 75 26
Silver
0.260 0.638 0.102 47 31 0 162 309 34
Spherical 9 301 -43 84 195 32
5 301 47 44 74 40
Copper
0.300 0.514 0.186 21 31 -0 317 48 31
Spherical 7 316 56 225 128 -17
7 116 32 159 193 54
Note: Correlograms conducted on 2 m composite sample data.

Effective Date: May 14, 2018 14-18
Condor Project, Ecuador
NI 43-101 Technical Report
Table 14.10: Variogram Parameters – Enma
Element Nugget Sill 1 Sill 2 1st Structure 2nd Structure
Range (ft)
Azimuth (°)
Dip Range
(ft) Azimuth
(°) Dip
Gold
0.329 0.563 0.109 28 5 48 50 64 34
Spherical 18 317 -31 14 226 54
2 244 25 12 328 9
Silver
0.300 0.581 0.119 46 26 55 233 174 53
Spherical 7 146 20 42 54 20
6 67 -28 32 132 -29
Copper
0.107 0.682 0.212 51 86 -15 107 95 35
Spherical 15 2 21 10 281 54
4 142 64 9 7 -3
Note: Correlograms conducted on 2 m composite sample data.
14.9 Model Setup and Limits
Two separate block models were initialized in MineSight™, and the models extents and
dimensions are defined in Table 14.11. The block model limits are represented by the
purple rectangle in Figure 14-1. The selection of a nominal block size measuring 10 m x 10
m x 10 m is considered appropriate with respect to the current drill hole spacing as well as
the selective mining unit (SMU) size typical of an operation of this type and scale.
Table 14.11: Block Model Limits
Direction Minimum Maximum Block Size (m) # of
Blocks
Santa Barbara
X (east) 764200 766800 10 260
Y (north) 9543300 9546000 10 270
Z (elevation) 150 1300 10 115
Soledad, Los Cuyes, Enma
X (east) 768500 770900 10 240
Y (north) 9550900 9554400 10 350
Z (elevation) 800 2000 10 120

Effective Date: May 14, 2018 14-19
Condor Project, Ecuador
NI 43-101 Technical Report
Blocks in the model were coded on a majority basis with the grade shell domains. During
this stage, blocks along a domain boundary are coded if more than 50% of the block occurs
within the boundaries of that domain.
The proportions of blocks that occur below the topographic surface are also calculated and
stored in the model as individual percentage items. These values are used as weighting
factors to determine the in-situ mineral resources for the deposit.
14.10 Interpolation Parameters
The block model grades for gold, silver and copper were estimated using ordinary kriging
(OK). The results of the OK estimation were compared with the Hermitian Polynomial
Change of Support model (also referred to as the Discrete Gaussian Correction). This
method is described in more detail in Section 14.11.
The OK models were generated with a relatively limited number samples to match the
change of support or Herco (Hermitian Correction) grade distribution. This approach
reduces the amount of smoothing or averaging in the model, and, while there may be some
uncertainty on a localized scale, this approach produces reliable estimates of the
recoverable grade and tonnage for the overall deposit.
The estimation parameters for the elements in the mineral resource block model are shown
in Tables 14.12 through 14.15. All grade estimations use length-weighted composite drill
hole sample data.
Table 14.12: Interpolation Parameters – Santa Barbara
Element Search Ellipse
Range (m) # of
Composites Other X Y Z Min/block Max/block Max/hole
Gold 500 500 200 5 28 7 1 DH per octant
Silver 500 500 200 5 21 7 1 DH per octant
Copper 500 500 200 5 28 7 1 DH per octant
Note: Ellipse orientation with long axis N-S and W-E and vertical short axis.
Table 14.13: Interpolation Parameters – Soledad
Element Search Ellipse
Range (m) # of
Composites Other X Y Z Min/block Max/block Max/hole
Gold 75 75 200 7 21 7 1 DH per octant
Silver 75 75 200 8 28 7 1 DH per octant
Copper 75 75 200 8 28 7 1 DH per octant
Note: Ellipse orientation with long axis in the vertical direction.

Effective Date: May 14, 2018 14-20
Condor Project, Ecuador
NI 43-101 Technical Report
Table 14.14: Interpolation Parameters – Los Cuyes
Element Search Ellipse
Range (m) # of
Composites Other X Y Z Min/block Max/block Max/hole
Gold 75 75 200 7 28 7 1 DH per octant
Silver 75 75 200 8 28 7 1 DH per octant
Copper 75 75 200 8 28 7 1 DH per octant
Note: Ellipse orientation with long axis in the vertical direction.
Table 14.15: Interpolation Parameters – Enma
Element Search Ellipse
Range (m) # of
Composites Other X Y Z Min/block Max/block Max/hole
Gold 75 75 200 7 18 6 1 DH per octant
Silver 75 75 200 8 28 7 1 DH per octant
Copper 75 75 200 8 21 7 1 DH per octant
Note: Ellipse orientation with long axis in the vertical direction.
SG data are only available for drill holes in the Santa Barbara area. As stated previously,
the SG data may be suspect or corrupted in a string of holes where numerous SG values
are less than 2. As a result, only SG values ranging from 2.0 to 3.4 were used in the Santa
Barbara mineral resource model. An inverse distance weighted (ID2) estimate of SG was
made into blocks using a search range of 250 m. The average SG of all estimated blocks
following ID2 interpolation is 2.73. As a conservative approach, a default SG of 2.65 was
assigned to all blocks in the Santa Barbara model without estimated SG values (outside of
the 250 m search range). A default SG of 2.65 was used to calculate tonnage in the
Soledad, Los Cuyes and Enma deposits.
14.11 Validation
The results of the modelling process were validated using several methods. These include
a thorough visual review of the model grades in relation to the underlying drill hole sample
grades, comparisons with the change of support model, comparisons with other estimation
methods, and grade distribution comparisons using swath plots.
14.11.1 Visual Inspection
A detailed visual inspection of the block model was conducted in both section and plan to
ensure the desired results following interpolation. This includes confirmation of the proper
coding of blocks within the grade shell domains. The estimated gold, silver and copper in
the models appear to be a valid representation of the underlying drill hole sample data.
Examples of the gold models are shown in Figures 14-12 and 14-13.

Effective Date: May 14, 2018 14-21
Condor Project, Ecuador
NI 43-101 Technical Report
Figure 14-12: Gold Grades in Model Blocks and Drill Holes at Santa Barbara and Soledad
Source: SIM Geological Inc., 2018
Figure 14-13: Gold Grades in Model Blocks and Drill Holes at Los Cuyes and Enma
Source: SIM Geological Inc., 2018
14.11.2 Model Checks for Change of Support
The relative degree of smoothing in the block model estimates were evaluated using the
Discrete Gaussian of Hermitian Polynomial Change of Support method (described by
Journel and Huijbregts, Mining Geostatistics, 1978). With this method, the distribution of the
hypothetical block grades can be directly compared to the estimated (OK) model through
the use of pseudo-grade/tonnage curves. Adjustments are made to the block model
interpolation parameters until an acceptable match is made with the Herco (Hermitian
correction) distribution. In general, the estimated model should be slightly higher in tonnage
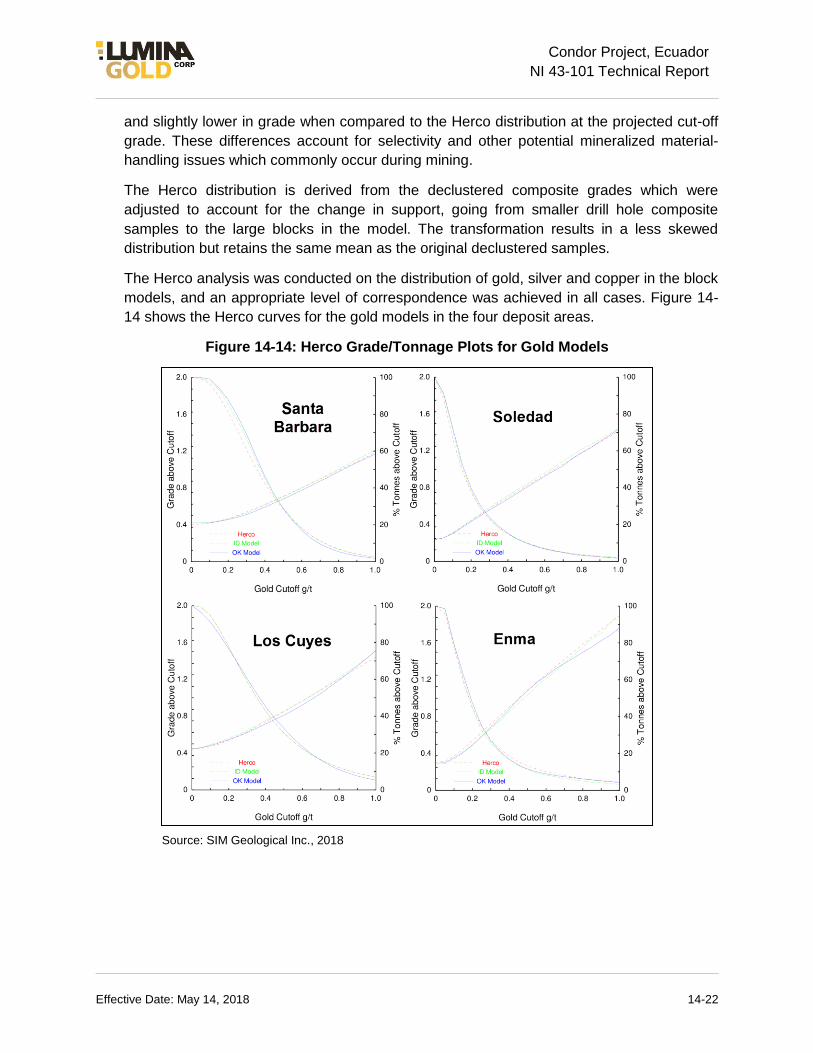
Effective Date: May 14, 2018 14-22
Condor Project, Ecuador
NI 43-101 Technical Report
and slightly lower in grade when compared to the Herco distribution at the projected cut-off
grade. These differences account for selectivity and other potential mineralized material-
handling issues which commonly occur during mining.
The Herco distribution is derived from the declustered composite grades which were
adjusted to account for the change in support, going from smaller drill hole composite
samples to the large blocks in the model. The transformation results in a less skewed
distribution but retains the same mean as the original declustered samples.
The Herco analysis was conducted on the distribution of gold, silver and copper in the block
models, and an appropriate level of correspondence was achieved in all cases. Figure 14-
14 shows the Herco curves for the gold models in the four deposit areas.
Figure 14-14: Herco Grade/Tonnage Plots for Gold Models
Source: SIM Geological Inc., 2018

Effective Date: May 14, 2018 14-23
Condor Project, Ecuador
NI 43-101 Technical Report
14.11.3 Swath Plots (Drift Analysis)
A swath plot is a graphical display of the grade distribution derived from a series of bands,
or swaths, generated in several directions through the deposit. Grade variations from the
OK model are compared using the swath plot to the distribution derived from the
declustered (NN) grade model.
On a local scale, the NN model does not provide reliable estimations of grade, but, on a
much larger scale, it represents an unbiased estimation of the grade distribution based on
the underlying data. Therefore, if the OK model is unbiased, the grade trends may show
local fluctuations on a swath plot, but the overall trend should be similar to the NN
distribution of grade.
Swath plots were generated in three orthogonal directions for all metals in all deposit areas.
Examples showing gold models in west-east-oriented swaths from each of the deposits are
shown in Figure 14-15.
There is good correspondence between the models in most areas. The degree of
smoothing in the OK model is evident in the peaks and valleys shown in the swath plots.
Areas where there are large differences between the models tend to be the result of “edge”
effects, where there is less available data to support a comparison.

Effective Date: May 14, 2018 14-24
Condor Project, Ecuador
NI 43-101 Technical Report
Figure 14-15: Swath Plots of Gold OK and NN Models by Northing
Source: SIM Geological Inc., 2018

Effective Date: May 14, 2018 14-25
Condor Project, Ecuador
NI 43-101 Technical Report
14.12 Resource Classification
The mineral resources for the Condor Project were classified in accordance with the CIM
Definition Standards for Mineral Resources and Mineral Reserves (May 2014). The
classification parameters are defined relative to the distance between gold sample data and
are intended to encompass zones of reasonably continuous mineralization that exhibit the
desired degree of confidence. These parameters are based on visual observations and
statistical studies. Classification parameters are based primarily on the nature of the
distribution of gold data because gold is the main contributor to the relative value of this
polymetallic deposit.
A drill hole spacing study was conducted for the Condor deposits that determines the
reliability of mineral resource estimates at varying drill hole spacings. The results indicate
that at Santa Barbara, the tonnes and grade of volumes equivalent to annual production
(approximately 10M tonnes) can be estimated with ±15% uncertainty 90% of the time when
drill holes are spaced on a nominal 75 m grid pattern. At Soledad, Los Cuyes and Enma,
gold grades tend to be more variable, and, as a result, drill holes are required on a 50 m
grid pattern to provide annual estimates at ±15% uncertainty 90% of the time. These results
are consistent with the special continuity shown by indicator variograms built about the
projected cut-off grade for these deposits.
The criteria used to define mineral resources in the Indicated and Inferred categories in the
various deposit areas is shown here. At this stage of project evaluation, the data only
support mineral resources in these categories. There are no mineral resources included in
the Measured category. As stated previously, the nature of gold mineralization differs
somewhat between the Santa Barbara deposit and the other three deposits located to the
north, and, as a result, there are differences in the classification criteria between these
areas.
Indicated Resources
At Santa Barbara, mineral resources in the Indicated category are estimated using three or
more drill holes that are spaced at a maximum distance of 75 m. At Soledad, Los Cuyes
and Enma, mineral resources in the Indicated category are estimated using at least three
drill holes that are spaced at a maximum distance of 50 m.
The spacing distances are intended to define contiguous volumes and allow for some
irregularities due to actual drill hole placement. Some manual smoothing of these criteria is
conducted that includes areas where the drill hole spacing locally exceeds the desired grid
spacing but still retains continuity of mineralization, or, conversely, excludes areas where
the mineralization does not exhibit the required degree of continuity. This process results in
a series of 3D domains that are used to assign resource classification codes into model
blocks.

Effective Date: May 14, 2018 14-26
Condor Project, Ecuador
NI 43-101 Technical Report
Inferred Resources
Mineral resources in this category include model blocks that do not meet the criteria for
Indicated class resources but are within a maximum distance of 100 m from a drill hole at
Santa Barbara, or within a maximum distance of 75 m from a drill hole at Soledad, Los
Cuyes and Enma.
It is expected that a majority of mineral resources in the Inferred category will be upgraded
to the Indicated (or Measured) category as a result of additional exploration.
14.13 Mineral Resources
CIM Definition Standards for Mineral Resources and Mineral Reserves (May 2014) define a
mineral resource as:
“[A] concentration or occurrence of solid material of economic interest, in or on the Earth’s
crust in such form, grade or quality and quantity, that there are reasonable prospects for
eventual economic extraction. The location, quantity, grade or quality, continuity and other
geological characteristics of a Mineral Resource are known, estimated or interpreted from
specific geological evidence and knowledge, including sampling.”
The “reasonable prospects for eventual economic extraction” requirement generally implies
that quantity and grade estimates meet certain economic thresholds and that mineral
resources are reported at an appropriate cut-off grade considering account extraction
scenarios and processing recovery. The economic viability of the mineral resource was
tested by constraining it within a floating cone pit shell, and the pit shell was generated
using the following projected economic and technical parameters:
Mining Cost $3/t
Process $11/t
G&A $2/t
Gold Price $1,400/oz
Silver Price $17/oz
Copper Price $3.25/lb
Gold Process Recovery 87%
Silver Process Recovery 60%
Copper Process Recovery 80%
Pit Slope 45 degrees
Based on the metal prices and recoveries listed here, recoverable gold equivalent (AuEqR)
grades are calculated using the following formula:
AuEqR = (Au g/t*0.87) + (Ag g/t*0.60*0.0122) + (Cu%*0.80*1.592)
The pit shell is generated using a floating cone algorithm based on the AuEqR block
grades. There are no adjustments for mining recoveries or dilution. This test indicates that
some of the deeper mineralization may not be economic due to the increased waste-
stripping requirements. It is important to recognize that these discussions of surface mining

Effective Date: May 14, 2018 14-27
Condor Project, Ecuador
NI 43-101 Technical Report
parameters are used solely to test the “reasonable prospects for eventual economic
extraction,” and they do not represent an attempt to estimate mineral reserves. There are
no mineral reserves calculated for the Condor Project. These preliminary evaluations are
used to prepare a Mineral Resource Statement and to select appropriate reporting
assumptions.
The estimate of mineral resources, contained within the resource limiting pit shell, is shown
in Table 14.16. Based on the metal prices and operating costs previously listed and a
formula that is similar to the one shown here (but excluding the metallurgical recovery
factors), the base case cut-off grade for mineral resources is estimated to be 0.35 g/t gold
equivalent (AuEq).
The distribution of the base case mineral resource within the $1,400/oz Au pit shell is
shown from a series of isometric viewpoints for Santa Barbara in Figures 14-16 and 14-17
and for Soledad, Los Cuyes and Enma in Figures 14-18 and 14-19. Note that in all deposit
areas, mineralization estimated in the block models continues for hundreds of metres below
the resource limiting pit shells suggesting there may be an upside to the mineral resources
as a result of increased metal prices and/or reduced operating costs.
There are no known factors related to environmental, permitting, legal, title, taxation, socio-
economic, marketing, or political issues which could materially affect the mineral resource.
Mineral resources in the Inferred category have a lower level of confidence than that
applied to Indicated mineral resources, and, although there is sufficient evidence to imply
geologic grade and continuity, these characteristics cannot be verified based on the current
data.
It is reasonably expected that the majority of Inferred mineral resources could be upgraded
to Indicated mineral resources with continued exploration.

Effective Date: May 14, 2018 14-28
Condor Project, Ecuador
NI 43-101 Technical Report
Table 14.16: Estimate of Mineral Resources
Deposit Mtonnes
Average Grade Contained Metal
AuEq (g/t)
Au (g/t)
Ag (g/t)
Cu (%)
AuEq (Moz)
Au (Moz)
Ag (Moz)
Cu (Mlbs)
Indicated
Santa Barbara
13.3 0.78 0.63 0.7 0.09 0.33 0.27 0.28 27
Soledad 11.6 0.81 0.72 5.3 0.01 0.30 0.27 1.95 3
Los Cuyes 38.6 0.77 0.68 5.5 0.02 0.95 0.84 6.86 13
Enma 0.4 0.91 0.76 11.9 0.01 0.01 0.01 0.14 0
Total Indicated
63.8 0.78 0.68 4.5 0.03 1.60 1.39 9.23 43
Inferred
Santa Barbara
119.0 0.69 0.52 0.9 0.10 2.62 1.99 3.52 255
Soledad 2.8 0.59 0.54 3.1 0.01 0.05 0.05 0.27 1
Los Cuyes 22.7 0.73 0.65 5.7 0.01 0.53 0.48 4.12 4
Enma 0.0 1.26 1.12 10.4 0.01 0.00 0.00 0.01 0
Total Inferred
144.5 0.69 0.54 1.7 0.08 3.21 2.51 7.92 260
Notes: Limited inside $1,400/oz Au pit shells. Base case cut-off is 0.35 g/t gold equivalent (AuEq). Mineral resources
are not mineral reserves because the economic viability has not been demonstrated.

Effective Date: May 14, 2018 14-29
Condor Project, Ecuador
NI 43-101 Technical Report
Figure 14-16: Isometric View of Indicated and Inferred Mineral Resource at Santa Barbara
Source: SIM Geological Inc., 2018
Figure 14-17: Isometric View of Indicated and Inferred Mineral Resource at Santa Barbara
Source: SIM Geological Inc., 2018

Effective Date: May 14, 2018 14-30
Condor Project, Ecuador
NI 43-101 Technical Report
Figure 14-18: Isometric View of Indicated and Inferred Mineral Resource at Soledad, Los Cuyes and Enma
Source: SIM Geological Inc., 2018
Figure 14-19: Isometric View of Indicated and Inferred Mineral Resource at Soledad, Los Cuyes and Enma
Source: SIM Geological Inc., 2018

Effective Date: May 14, 2018 14-31
Condor Project, Ecuador
NI 43-101 Technical Report
14.14 Sensitivity of Mineral Resources
The sensitivity of mineral resources, contained within the $1,400/oz Au pit shell, is
demonstrated by listing mineral resources at a series of cut-off thresholds as shown in
Table 14.17 for all combined deposits, Table 14.18 for Santa Barbara, and Table 14.19 for
Soledad, Los Cuyes and Enma deposits.
Table 14.17: Sensitivity of Mineral Resource to Cut-off Grade (All Deposits Combined)
Cut-off (AuEq g/t)
Mtonnes
Average Grade Contained Metal
AuEq (g/t)
Au (g/t)
Ag (g/t)
Cu (%)
AuEq (Moz)
Au (Moz)
Ag (Moz)
Cu (Mlbs)
Indicated
0.2 83.9 0.66 0.57 4.0 0.03 1.77 1.53 10.79 49
0.25 76.8 0.70 0.60 4.2 0.03 1.72 1.49 10.32 47
0.3 70.2 0.74 0.64 4.3 0.03 1.66 1.44 9.77 46
0.35 63.8 0.78 0.67 4.5 0.03 1.60 1.39 9.23 43
0.4 57.6 0.82 0.71 4.7 0.03 1.52 1.32 8.63 40
0.45 51.6 0.87 0.76 4.8 0.03 1.44 1.26 7.96 38
0.5 46.3 0.91 0.80 4.9 0.03 1.36 1.19 7.31 35
0.55 41.1 0.96 0.84 5.0 0.04 1.27 1.11 6.64 33
0.6 36.4 1.01 0.89 5.2 0.04 1.18 1.04 6.03 30
Inferred
0.2 178.4 0.61 0.47 1.8 0.07 3.50 2.72 10.08 284
0.25 163.7 0.64 0.50 1.7 0.08 3.39 2.65 9.09 276
0.3 153.9 0.67 0.52 1.7 0.08 3.31 2.58 8.50 270
0.35 144.5 0.69 0.54 1.7 0.08 3.21 2.51 7.92 260
0.4 132.2 0.72 0.57 1.7 0.08 3.06 2.40 7.29 248
0.45 118.6 0.75 0.59 1.8 0.09 2.88 2.27 6.69 228
0.5 106.2 0.79 0.62 1.8 0.09 2.69 2.13 6.11 209
0.55 93.0 0.82 0.66 1.9 0.09 2.46 1.96 5.54 188
0.6 78.6 0.87 0.70 1.9 0.09 2.20 1.76 4.84 163
Notes: Limited inside $1,400/oz Au pit shells. Base case cut-off is 0.35 g/t gold equivalent (AuEq). Mineral resources
are not mineral reserves because the economic viability has not been demonstrated.

Effective Date: May 14, 2018 14-32
Condor Project, Ecuador
NI 43-101 Technical Report
Table 14.18: Sensitivity of Mineral Resource to Cut-off Grade (Santa Barbara)
Cut-off (AuEq g/t)
Mtonnes
Average Grade Contained Metal
AuEq (g/t)
Au (g/t)
Ag (g/t)
Cu (%)
AuEq (Moz)
Au (Moz)
Ag (Moz)
Cu (Mlbs)
Indicated
0.2 17.1 0.67 0.53 0.6 0.08 0.37 0.29 0.32 31
0.25 15.7 0.71 0.56 0.6 0.09 0.36 0.28 0.31 30
0.3 14.5 0.74 0.59 0.6 0.09 0.35 0.28 0.29 28
0.35 13.3 0.78 0.62 0.7 0.09 0.33 0.27 0.28 27
0.4 12.3 0.81 0.65 0.7 0.09 0.32 0.26 0.26 25
0.45 11.4 0.84 0.68 0.7 0.10 0.31 0.25 0.25 24
0.5 10.6 0.87 0.71 0.7 0.10 0.30 0.24 0.24 23
0.55 9.9 0.89 0.73 0.7 0.10 0.28 0.23 0.22 21
0.6 9.1 0.92 0.76 0.7 0.10 0.27 0.22 0.21 20
Inferred
0.2 138.4 0.63 0.47 0.9 0.09 2.79 2.10 4.00 278
0.25 130.3 0.65 0.49 0.9 0.09 2.73 2.06 3.77 270
0.3 124.8 0.67 0.51 0.9 0.10 2.68 2.03 3.65 264
0.35 119.0 0.69 0.52 0.9 0.10 2.62 1.99 3.52 255
0.4 110.1 0.71 0.54 0.9 0.10 2.51 1.91 3.33 243
0.45 99.5 0.74 0.57 1.0 0.10 2.37 1.81 3.07 224
0.5 89.3 0.77 0.59 1.0 0.10 2.21 1.70 2.81 205
0.55 78.2 0.81 0.62 1.0 0.11 2.03 1.57 2.54 184
0.6 66.0 0.85 0.66 1.0 0.11 1.80 1.40 2.21 160
Notes: Limited inside $1,400/oz Au pit shells. Base case cut-off is 0.35 g/t gold equivalent. Mineral resources are not
mineral reserves because the economic viability has not been demonstrated.

Effective Date: May 14, 2018 14-33
Condor Project, Ecuador
NI 43-101 Technical Report
Table 14.19: Sensitivity of Mineral Resource to Cut-off Grade (Soledad, Los Cuyes, Enma)
Cut-off (AuEq g/t)
Mtonnes
Average Grade Contained Metal
AuEq (g/t)
Au (g/t)
Ag (g/t)
Cu (%)
AuEq (Moz)
Au (Moz)
Ag (Moz)
Cu (Mlbs)
Indicated
0.2 66.9 0.65 0.58 4.9 0.01 1.41 1.24 10.47 18
0.25 61.2 0.69 0.61 5.1 0.01 1.37 1.20 10.01 18
0.3 55.7 0.74 0.65 5.3 0.01 1.32 1.16 9.48 17
0.35 50.6 0.78 0.69 5.5 0.01 1.26 1.12 8.96 16
0.4 45.3 0.82 0.73 5.7 0.02 1.20 1.07 8.37 15
0.45 40.2 0.87 0.78 6.0 0.02 1.13 1.01 7.71 14
0.5 35.6 0.93 0.83 6.2 0.02 1.06 0.95 7.08 13
0.55 31.2 0.98 0.88 6.4 0.02 0.99 0.88 6.42 12
0.6 27.3 1.04 0.93 6.6 0.02 0.92 0.82 5.83 10
Inferred
0.2 40.0 0.55 0.49 4.7 0.01 0.71 0.63 6.08 6
0.25 33.4 0.62 0.55 5.0 0.01 0.66 0.59 5.31 6
0.3 29.1 0.67 0.59 5.2 0.01 0.63 0.56 4.85 6
0.35 25.5 0.72 0.64 5.4 0.01 0.59 0.52 4.40 5
0.4 22.1 0.77 0.69 5.6 0.01 0.55 0.49 3.96 5
0.45 19.1 0.82 0.74 5.9 0.01 0.51 0.45 3.62 5
0.5 16.9 0.87 0.78 6.1 0.01 0.47 0.43 3.30 4
0.55 14.8 0.92 0.83 6.3 0.01 0.44 0.39 3.00 4
0.6 12.6 0.98 0.88 6.5 0.01 0.40 0.36 2.63 3
Notes: Limited inside $1,400/oz Au pit shells. Base case cut-off is 0.35 g/t gold equivalent. Mineral resources are not
mineral reserves because the economic viability has not been demonstrated.
14.15 Summary and Conclusions
Based on the current level of exploration, the Condor property hosts four deposits that
contain a combined Indicated mineral resource comprising 64M tonnes at 0.68 g/t Au and
4.5 g/t Ag for 1.4M ounces of contained gold and 9M ounces of contained silver and
Inferred mineral resources of 145M tonnes at 0.54 g/t Au and 1.7 g/t Ag for an additional
2.5M ounces of contained gold and 7.9M ounces of contained silver.
All deposits remain “open” for expansion at depth. Santa Barbara also remains open to the
southeast and possibly to the north.

Effective Date: May 14, 2018 14-34
Condor Project, Ecuador
NI 43-101 Technical Report
Exploration targets exist at El Hito and Chinapintza. Further exploration is required to define
mineral resources for these deposit areas.

Effective Date: May 14, 2018 15-1
Condor Project, Ecuador
NI 43-101 Technical Report
15 ADJACENT PROPERTIES
The Chinapintza epithermal gold veins extend to the northwest onto the adjacent Jerusalem
concession (Figure 23-1).
Figure 15-1: Plan Map – Chinapintza Veins – Jerusalem Concession
Source: Ronning, 2003; Lumina, 2018
TVX did an extensive amount of exploration work on this claim, including diamond drilling
(35 holes; 9,338.1 m), trenching and underground development and sampling. In 1996, it
calculated a historical mineral resource for this zone of 535,828 tonnes grading 12.5 g/t Au,
66.4 g/t Ag, 0.07% Cu, 0.76% Pb, 3.57% Zn (Ronning, 2003). This historical mineral
resource estimate is detailed in the NI 43-101 Technical Report entitled “Review of the
Jerusalem Project, Ecuador” with an effective date of May 30, 2003 and is available on
SEDAR.
In 2004, Maynard (2004) provided an updated historical mineral resource estimate for the
veins on the Jerusalem concession (Table 23.1). This historical mineral resource estimate
is detailed in the NI 43-101 Technical Report entitled “Independent Geological Evaluation,

Effective Date: May 14, 2018 15-2
Condor Project, Ecuador
NI 43-101 Technical Report
Jerusalem Project, Zamora Chinchipe, Ecuador for Dynasty Metals & Mining Inc.” with an
effective date of October 29, 2004 and is available on SEDAR. The QPs have been unable
to verify this mineral resource estimate and it is not necessarily indicative of mineralization
on the Condor Project.
Table 15.1: Resources on the Jerusalem Concession
Category Tonnes Au
(g/t) Ag
(g/t) Cu
(ppm) Pb
(ppm) Zn
(ppm)
Measured 298,900 13.9 102 576 563 26,859
Indicated 722,500 12.8 98 360 3,560 17,660
Inferred 1,785,200 11.6 103 424 3,887 18,397
Source: Maynard, 2004
The authors of this report have not completed sufficient work to verify the historical mineral
resource on the Jerusalem concession and this information is not necessarily indicative of
mineralization on the Condor Project. The authors feel there is insufficient geologic
information available to confidently interpret the shape and location of the gold-bearing
veins at Chinapintza, and, as a result, an estimate of mineral resources is not currently
feasible.
There are several other gold showings in the vicinity of the Condor project, but none have
any published mineral resources.

Effective Date: May 14, 2018 16-1
Condor Project, Ecuador
NI 43-101 Technical Report
16 OTHER RELEVANT DATA AND INFORMATION
There is no other relevant data or information.

Effective Date: May 14, 2018 17-1
Condor Project, Ecuador
NI 43-101 Technical Report
17 INTERPRETATION AND CONCLUSIONS
Based on the evaluation of the data available from the Condor Project, the authors of this
Report have drawn the following conclusions:
At the effective date of this Report (May 14, 2018), the Condor Project consists of
9 contiguous mining concessions totaling 10,101.09 ha. Lumina owns 100%
interest in all concessions except for Viche Conguime I, II, II, Hitobo and
Chinapintza where the Instituto de Seguridad Social de las Fuerzas Armadas
(ISSFA) owns 10%.
Low sulphidation epithermal gold mineralization in the northern part of the
Condor Project is associated with diatreme breccia pipes at Los Cuyes, Soledad
and Enma, and narrow quartz-sulphide veins at Chinapintza.
The Santa Barbara Au-Cu and El Hito Cu-Mo porphyry deposits are associated
with dioritic intrusions in the southern part of the Condor Project.
Drilling of four deposits—Santa Barbara, Los Cuyes, Soledad and Enma—has
outlined a combined Indicated mineral resource estimate of 63.8M tonnes at
0.68 g/t Au, 4.5 g/t Ag and 0.03% Cu which contains 1.39M ounces of gold,
9.23M ounces of silver and 43M lbs of copper, and a combined Inferred mineral
resource estimate of 144.5M tonnes at 0.54 g/t Au,1.7 g/t Ag and 0.08% Cu
which contains 2.51M ounces of gold, 7.92M ounces of silver and 260M lbs of
copper.
Preliminary metallurgical work indicates that the low sulphidation epithermal gold
deposits can be processed using gravity, flotation and cyanidation of the flotation
concentrates. The Santa Barbara mineralization can be processed using flotation
to produce a copper concentrate with gold credits and CIP processing to recover
additional gold from the flotation tailings.
There are no known factors related to metallurgical, environmental, permitting,
legal, title, taxation, socio-economic, marketing or political issues which could
materially affect the mineral resource estimates or exploration data presented.
The primary risks at the Project are confined to metals prices and Ecuador’s
fiscal treatment of mining projects.

Effective Date: May 14, 2018 18-1
Condor Project, Ecuador
NI 43-101 Technical Report
18 RECOMMENDATIONS
The following two phase work program is recommended for this project:
Phase 1: Conduct additional drilling to assess the soil and geophysical anomalies that
occur proximal to the Santa Barbara deposit. The estimated budget for this 4,500 m drill
program is $1.4 million.
Table 18.1: Phase one exploration budget
Phase 1
4,500m diamond drill program $1,400,000
Total $1,400,000
Phase 2: Contingent on the results from Phase 1, conduct additional geochemical and
geophysical surveys and drilling to assess the untested exploration targets on the
Condor Project. The estimated budget for the ground surveys and a 2,000 m drill
program is $0.9 million.
Table 18.2: Phase two exploration budget
Phase 2
Induced Polarisation survey $200,000
Surface soil and rock sampling program $100,000
2,000m diamond drill program $600,000
Total $900,000

Effective Date: May 14, 2018 19-1
Condor Project, Ecuador
NI 43-101 Technical Report
19 REFERENCES
Arce, J.R. 2018. Santa Barbara, Zamora, Ecuador, Ground magnetometry and Induced
polarization surveys. Internal document, 11p.
CIMM, 1995. Metallurgical laboratory testwork on the San Jose gold ores. Internal report
for Condor Mining S.A, 82p.
Drobe, J.L. Stein, D. Gabites, J. 2013. Geology, Mineralization and Geochronological
Constraints of the Mirador Cu-Au Porphyry District, Southeast Ecuador. Economic
Geology, v. 108, pp. 11 – 35.
Easdon, M., Oviedo, L. 2004. NI 43-101 Technical report on the Condor Project,
southeastern Ecuador. 131p.
Geofisica Consultores, 2007. Reporte Geofisico Polarizacion Inducida, Resistividad,
Magnetometria, Proyecto Condor for Goldmarca Limited, internal report, 48p.
Hastings, M. 2013. SRK Review of Drilling, QA/QC and Database. Internal report. 22p.
Hedenquist, J.W. 2007. Mineralization aspects of the Pachicutza epithermal and Santa
Barbara porphyry prospects, Condor project, Zamora Chinchipe Province, southeastern
Ecuador. Internal report for Goldmarca Ltd., 24p.
Hughes, T.N.J. 2008. Technical report on the Condor Gold Project for Ecometals Ltd.
Internal report. 90p.
IML, 2006. San Jose Evaluation testwork – Condor Gold Project for Goldmarca Limited.
Internal report. 66p.
Journel and Huijbregts, 1978. Mining Geostatistics, London: Academic Press.
Lumina, 2018. Internal figures.
Lumina, 14 May 2018, press release, 6p.
Laudauro, A. 2004. Breccias – San Jose, Ecuador, Direct Cyanidation Metallurgical
Testwork for Goldmarca Mining Peru S.A. Internal report. 19p.
Lowell, J. D. and Guilbert, J.M. 1970. Lateral and vertical alteration-mineralization zoning
in porphyry ore deposits. Economic Geology vol. 65, pp 373-408.Lumina, 2018. Internal
company documents.
Maynard, A.J. 2004. NI 43-101 Technical Report, Independent Geological Evaluation,
Jerusalem Project, Zamora Chinchipe, Ecuador for Dynasty Metals & Mining Inc. 34p.
Maynard, A., Jones, P.A. 2011. NI 43-101 Technical Report (revised) on the Condor
Gold Project located in Zamora, Ecuador. 124p.
Maynard, A., Jones, P.A, and Suda, B. 28 August 2013. NI 43-101 Technical Report on
the Condor Gold and Copper Project located in Zamora, Ecuador. 121p.

Effective Date: May 14, 2018 19-2
Condor Project, Ecuador
NI 43-101 Technical Report
Maynard, A., Jones, P.A. 8 May 2014. NI 43-101 Technical Report on the Condor Gold
and Copper Project located in Zamora, Ecuador. 130p.
McMullan, S.R. 2007. Notes on Geophysical Surveys – Chinapintza, Los Cuyes, San
Jose for Goldmarca Ltd. Internal document. 14p.
Panteleyev, A. 1995. Porphyry Cu+/-Mo+/-Au, in Selected British Columbia Mineral
Deposit Profiles, Volume 1 - Metallics and Coal. Lefebure, D.V. and Ray, G.E., Editors.
British Columbia Ministry of Energy of Employment and Investment.
Phillips, R.J. 2013. Metallurgical testing of Santa Barbara ore deposit samples. Phillips
Enterprises LLC report for Ecuador Gold and Copper Corp. Internal document. 81p.
Pitard, F. Magri, E. 1995. Estudio de Heterogeneidad. Internal report for Condor Mining.
Pratt, W.T. 2017. Geological mapping program, Los Cuyes, Zamora-Chinchipe, Ecuador.
Internal document. 61p.
Randall, T. 2013. Results of diagnostic leaching on a sample from the Santa Barbara
project. RDi report for Ecuador Gold and Copper Corp. Internal document. 8p.
Randall, T, Malhotra, D. 2014. Metallurgical testing of Santa Barbara deposit ore
samples. RDi report for Ecuador Gold and Copper Corp. Internal document. 51p.
Ronning, P., 30 May 2003. Review of the Jerusalem Project, Ecuador. 108p.
Short, M., Maynard, A.J., Jones, P.A., 19 May 2015. NI 43-101 Technical Report –
Preliminary Economic Assessment of the Santa Barbara Gold and Copper Project in
Zamora, Ecuador. GBM Minerals Engineering Consultants. 188p.
Sillitoe, R.H. 1993. Epithermal models: Genetic types, geometric controls and shallow
features in Geological Association of Canada, Special Paper 40, p. 403-417.
SIM Geological, 2018. Internal figures.
Toledo, F., Toledo, X. 2008. Condor Gold QA/QC. Internal report for Ecometals Ltd. 89p.
White, N.C., Hedenquist, J.W., 1995. Epithermal Gold Deposits: Styles, Characteristics
and Exploration. SEG Newsletter, vol. 23, pp 1, 9-13.

Effective Date: May 14, 2018 20-1
Condor Project, Ecuador
NI 43-101 Technical Report
20 DATE AND SIGNATURE PAGES
CERTIFICATE OF QUALIFIED PERSON
Bruce M. Davis, FAusIMM, BD Resource Consulting, Inc.
I, Bruce M. Davis, FAusIMM, do hereby certify that:
1. I am an independent consultant of BD Resource Consulting Inc., and have an address at 4253 Cheyenne Drive, Larkspur, Colorado USA 80118.
2. I graduated from the University of Wyoming with a Doctor of Philosophy (Geostatistics) in 1978.
3. I am a Fellow of the Australasian Institute of Mining and Metallurgy, Number 211185.
4. I have practiced my profession continuously for 38 years and have been involved in mineral
resource and reserve estimations and feasibility studies on numerous underground and open pit
base metal and gold deposits in Canada, the United States, Central and South America, Europe,
Asia, Africa and Australia.
5. I have read the definition of “qualified person” set out in National Instrument 43-101 Standards of
Disclosure for Mineral Projects (“NI 43-101”) and certify that by reason of my education, affiliation
with a professional association (as defined in NI 43-101) and past relevant work experience, I
fulfill the requirements to be a “qualified person” for the purposes of NI 43-101.
6. I am responsible for the preparation of Sections 11 and 12 and portions of Sections 1, 2, 3, 14,
17, 18, 19 and 20 of the technical report titled Condor Project, Ecuador Amended and Restated
NI 43-101 Technical Report, with an effective date of May 14, 2018, and an execution date of July
10, 2018 (the “Technical Report”).
7. I have not visited the Condor Project.
8. I am independent of Lumina Gold Corp., Luminex Resources Corp. and the Condor Project
applying all the tests in Section 1.5 of NI 43-101.
9. I have had no prior involvement with the property that is the subject of the Technical Report. I
have read NI 43-101, Form 43-101F1 Technical Report (“Form 43-101F1”) and the Technical
Report and confirm the portions of the Technical Report for which I am responsible have been
prepared in compliance with NI 43-101 and Form 43-101F1.
10. As of the effective date of the Technical Report, to the best of my knowledge, information and
belief, the Technical Report contains all scientific and technical information that is required to be
disclosed to make the Technical Report not misleading.
Dated this 10th day of July, 2018.
“original signed and sealed”
_____________________________________
Bruce M. Davis, FAusIMM

Effective Date: May 14, 2018 20-2
Condor Project, Ecuador
NI 43-101 Technical Report
CERTIFICATE OF QUALIFIED PERSON
Robert Sim, P.Geo., SIM Geological Inc.
I, Robert Sim, P.Geo., do hereby certify that:
1. I am an independent consultant of: SIM Geological Inc. and have an address at 508–1950
Robson Street, Vancouver, British Columbia, Canada V6E 1E8.
2. I graduated from Lakehead University with an Honours Bachelor of Science (Geology) in 1984.
3. I am a member, in good standing, of Engineers and Geoscientists British Columbia, Licence
Number 24076.
4. I have practiced my profession continuously for 34 years and have been involved in mineral
exploration, mine site geology and operations, mineral resource and reserve estimations and
feasibility studies on numerous underground and open pit base metal and gold deposits in
Canada, the United States, Central and South America, Europe, Asia, Africa and Australia.
5. I have read the definition of “qualified person” set out in National Instrument 43-101 Standards of
Disclosure for Mineral Projects (“NI 43-101”) and certify that by reason of my education, affiliation
with a professional association (as defined in NI 43-101) and past relevant work experience, I
fulfill the requirements to be a “qualified person” for the purposes of NI 43-101.
6. I am responsible for the preparation of Sections 4, 5, 6, 7, 8, 9, 10, 13, 14, 15, 16 and portions of
sections 1, 2, 3, 17, 18, 19 and 20 of the technical report titled Condor Project, Ecuador Amended
and Restated NI 43-101 Technical Report, with an effective date of May 14, 2018, and an
execution date of July 10, 2018 (the “Technical Report”).
7. I visited the Condor Project from November 29-30, 2017.
8. I am independent of Lumina Gold Corp., Luminex Resources Corp. and the Condor Project
applying all the tests in Section 1.5 of NI 43-101.
9. I have had no prior involvement with the property that is the subject of the Technical Report. I
have read NI 43-101, Form 43-101F1 Technical Report (“Form 43-101F1”) and the Technical
Report and confirm the portions of the Technical Report for which I am responsible have been
prepared in compliance with NI 43-101 and Form 43-101F1.
10. As of the effective date of the Technical Report, to the best of my knowledge, information and
belief, the Technical Report contains all scientific and technical information that is required to be
disclosed to make the Technical Report not misleading.
Dated this 10th day of July, 2018.
“original signed and sealed”
_____________________________________
Robert Sim, P.Geo.