Condo Market Report woNewHomes V2 - TRREB
9
$610,044 $616,771 Fourth Quarter 2020 Fourth Quarter 2019 Condo Market Report TRREB Member Inquiries: (416) 443-8158 Media/Public Inquiries: (416) 443-8152 TRREB Releases Q4 2020 Condo Market Statistics TORONTO, ONTARIO, January 27, 2021 – Fourth quarter 2020 condominium apartment sales reported by Greater Toronto Area REALTORS® totalled 6,469 – up 20.7 per cent compared to 5,358 in Q4 2019. The number of new listings in Q4 2020 amounted to 12,298 – a 91.9 per cent increase over Q4 2019. Active listings totalling 4,294 at the end of Q4 were more than double that reported at the end of Q4 2019. “While the prominent storyline has been the strong increase in condo listings over the last 12 months, it is important to point out that the demand for condominium apartments has remained very strong, with sales up substantially compared to 2019. The increase in supply, largely attributed to investor selling as both the traditional and short-term rental markets softened along with the looming possibility of a City of Toronto vacancy tax, resulted in much more choice and bargaining power for buyers and a moderate decline in average selling prices,” said Lisa Patel, Toronto Regional Real Estate Board (TRREB) President. The overall GTA average condominium apartment selling price was down by 1.1 per cent year over year in the fourth quarter to $610,044. The average selling price in Toronto, at $644,516, was down by 2.4 per cent over the same period. Year-over-year price declines were especially evident for smaller units in the City, where investor-driven supply increases were strong. “TRREB will be releasing its Market Year in Review and 2021 Outlook report at the beginning of February. With this said, we expect the demand for condo apartments to remain strong this year. Once global vaccine uptake is substantial, the exact timing for which remains uncertain, expect a resurgence in immigration and non-permanent migration into the GTA. This will provide continued support for both ownership and rental demand beyond 2021,” said Jason Mercer, TRREB’s Chief Market Analyst. TRREB MLS® Average Condo Apartment Price Economic Indicators Condominium Apartment Market Summary Sources and Notes: i - Statistics Canada, Quarter-over-quarter growth, annualized ii - Statistics Canada, Year-over-year growth for the most recently reported month iii - Bank of Canada, Rate from most recent Bank of Canada announcement iv - Bank of Canada, rates for most recently completed month 6,469 5,358 Fourth Quarter 2020 Fourth Quarter 2019 Real GDP Growth Q3 2020 40.6% Toronto Employment Growth December 2020 -2.3% Toronto Unemployment Rate December 2020 -- 10.7% Inflation (Yr./Yr. CPI Growth) December 2020 0.7% Bank of Canada Overnight Rate December 2020 -- 0.3% Prime Rate December 2020 -- 2.5% 2020 2019 Sales Average Price Sales Average Price Total TRREB Halton Region Peel Region City of Toronto York Region Durham Region Other Areas 6,469 $610,044 5,358 $616,771 316 $597,305 238 $541,312 810 $510,447 666 $500,327 4,355 $644,516 3,817 $660,518 764 $573,118 490 $539,034 179 $438,386 116 $391,087 45 $465,873 31 $384,385 Fourth Quarter 2020 Fourth Quarter 2020 Total TRREB MLS® Condo Apartment Sales Year-Over-Year Summary 1,6 1,6 1,6 2020 2019 % Chg. Sales New Listings Active Listings Average Price Average DOM 6,469 5,358 20.7% 12,298 6,407 91.9% 4,294 1,660 158.7% $610,044 $616,771 -1.1% 26 22 18.2% Active listings refer to last month of quarter. i Mortgage Rates December 2020 3.09% 3.49% 4.79% 1 Year 3 Year 5 Year -- -- 1,6
Transcript of Condo Market Report woNewHomes V2 - TRREB

$610,044 $616,771
Fourth Quarter 2020 Fourth Quarter 2019
Condo Market Report TRREB Member Inquiries:
(416) 443-8158Media/Public Inquiries:
(416) 443-8152
TRREB Releases Q4 2020 Condo Market StatisticsTORONTO, ONTARIO, January 27, 2021 – Fourth quarter 2020 condominium apartment sales reported by Greater Toronto Area REALTORS® totalled 6,469 – up 20.7 per cent compared to 5,358 in Q4 2019. The number of new listings in Q4 2020 amounted to 12,298 – a 91.9 per cent increase over Q4 2019. Active listings totalling 4,294 at the end of Q4 were more than double that reported at the end of Q4 2019.
“While the prominent storyline has been the strong increase in condo listings over the last 12 months, it is important to point out that the demand for condominium apartments has remained very strong, with sales up substantially compared to 2019. The increase in supply, largely attributed to investor selling as both the traditional and short-term rental markets softened along with the looming possibility of a City of Toronto vacancy tax, resulted in much more choice and bargaining power for buyers and a moderate decline in average selling prices,” said Lisa Patel, Toronto Regional Real Estate Board (TRREB) President.
The overall GTA average condominium apartment selling price was down by 1.1 per cent year over year in the fourth quarter to $610,044. The average selling price in Toronto, at $644,516, was down by 2.4 per cent over the same period. Year-over-year price declines were especially evident for smaller units in the City, where investor-driven supply increases were strong.
“TRREB will be releasing its Market Year in Review and 2021 Outlook report at the beginning of February. With this said, we expect the demand for condo apartments to remain strong this year. Once global vaccine uptake is substantial, the exact timing for which remains uncertain, expect a resurgence in immigration and non-permanent migration into the GTA. This will provide continued support for both ownership and rental demand beyond 2021,” said Jason Mercer, TRREB’s Chief Market Analyst.
TRREB MLS® AverageCondo Apartment Price
Economic Indicators
Condominium Apartment Market SummarySources and Notes:
i - Statistics Canada, Quarter-over-quartergrowth, annualizedii - Statistics Canada, Year-over-yeargrowth for the most recently reportedmonthiii - Bank of Canada, Rate from most recentBank of Canada announcementiv - Bank of Canada, rates for most recentlycompleted month
6,4695,358
Fourth Quarter 2020 Fourth Quarter 2019
Real GDP GrowthQ3 2020 40.6%
Toronto Employment GrowthDecember 2020 -2.3%
Toronto Unemployment RateDecember 2020 -- 10.7%
Inflation (Yr./Yr. CPI Growth)December 2020 0.7%
Bank of Canada OvernightRateDecember 2020 -- 0.3%
Prime RateDecember 2020 -- 2.5%
2020 2019Sales Average Price Sales Average Price
Total TRREB
Halton Region
Peel Region
City of Toronto
York Region
Durham Region
Other Areas
6,469 $610,044 5,358 $616,771
316 $597,305 238 $541,312
810 $510,447 666 $500,327
4,355 $644,516 3,817 $660,518
764 $573,118 490 $539,034
179 $438,386 116 $391,087
45 $465,873 31 $384,385
Fourth Quarter 2020
Fourth Quarter 2020Total TRREB MLS®
Condo Apartment Sales
Year-Over-Year Summary
1,6
1,6
1,62020 2019 % Chg.
SalesNew ListingsActive ListingsAverage PriceAverage DOM
6,469 5,358 20.7%12,298 6,407 91.9%4,294 1,660 158.7%
$610,044 $616,771 -1.1%26 22 18.2%
Active listings refer to last month of quarter.i
Mortgage Rates December 20201 Year3 Year5 Year
3.09%3.49%4.79%
1 Year3 Year5 Year
--
-- 1,6

Toronto Regional Real Estate Board
Condo Market Report, Fourth Quarter 2020
SUMMARY OF CONDOMINIUM APARTMENT TRANSACTIONSFOURTH QUARTER 2020
ALL TRREB AREAS
2
Sales Dollar Volume Average Price Median Price New Listings Active Listings Avg. SP / LP Avg. DOMTRREB TotalHalton Region
BurlingtonHalton HillsMiltonOakville
Peel RegionBramptonMississaugaCaledon
City of TorontoToronto WestToronto CentralToronto East
York RegionAuroraE. GwillimburyGeorginaKingMarkhamNewmarketRichmond HillVaughanWhitchurch-Stouffville
Durham RegionAjaxBrockClaringtonOshawaPickeringScugogUxbridgeWhitby
Dufferin CountyOrangeville
Simcoe CountyAdjala-TosorontioBradford WestGwillimburyEssaInnisfilNew Tecumseth
6,469 $3,946,375,362 $610,044 $545,000 12,298 4,294 99% 26316 $188,748,286 $597,305 $509,950 437 146 98% 26147 $80,615,438 $548,404 $480,000 190 64 98% 26
6 $2,752,300 $458,717 $457,500 6 3 98% 2141 $21,271,500 $518,817 $522,000 52 8 100% 23
122 $84,109,048 $689,418 $533,750 189 71 98% 27810 $413,461,893 $510,447 $495,000 1,520 467 98% 25150 $69,244,790 $461,632 $455,000 267 67 99% 22659 $343,557,103 $521,331 $505,000 1,250 398 98% 25
1 $660,000 $660,000 $660,000 3 2 100% 74,355 $2,806,867,518 $644,516 $570,500 8,784 3,120 99% 26
926 $528,066,451 $570,266 $530,000 1,704 516 99% 242,778 $1,947,562,637 $701,066 $610,000 6,069 2,313 98% 28
651 $331,238,430 $508,815 $475,000 1,011 291 100% 21764 $437,862,222 $573,118 $538,400 1,298 496 99% 2824 $12,884,400 $536,850 $510,000 35 16 98% 361 $385,000 $385,000 $385,000 0 0 100% 71 $302,000 $302,000 $302,000 4 3 104% 87 $4,206,000 $600,857 $535,000 6 4 96% 48
273 $159,739,140 $585,125 $549,000 426 151 99% 2818 $9,180,350 $510,019 $490,000 20 1 99% 16
190 $99,877,616 $525,672 $515,000 324 103 99% 27230 $138,623,916 $602,713 $570,000 455 207 98% 2920 $12,663,800 $633,190 $585,950 28 11 98% 38
179 $78,471,155 $438,386 $429,000 210 49 100% 2029 $12,273,401 $423,221 $421,500 31 3 100% 210 - - - 0 0 - -
35 $14,749,380 $421,411 $400,500 40 5 101% 1336 $11,105,399 $308,483 $325,000 64 30 102% 2947 $24,133,175 $513,472 $468,975 39 7 99% 250 - - - 0 0 - -1 $485,000 $485,000 $485,000 1 1 100% 11
31 $15,724,800 $507,252 $499,000 35 3 102% 138 $3,330,000 $416,250 $376,500 3 1 99% 328 $3,330,000 $416,250 $376,500 3 1 99% 32
37 $17,634,288 $476,602 $480,000 46 15 98% 260 - - - 0 0 - -4 $1,558,900 $389,725 $389,950 3 0 98% 260 - - - 0 0 - -
22 $10,846,388 $493,018 $490,000 29 10 99% 2711 $5,229,000 $475,364 $495,000 14 5 98% 27
1 1 1 1 2 3 4 5
Toronto Regional Real Estate Board
SUMMARY OF CONDOMINIUM APARTMENT TRANSACTIONSFOURTH QUARTER 2020
CITY OF TORONTO
3
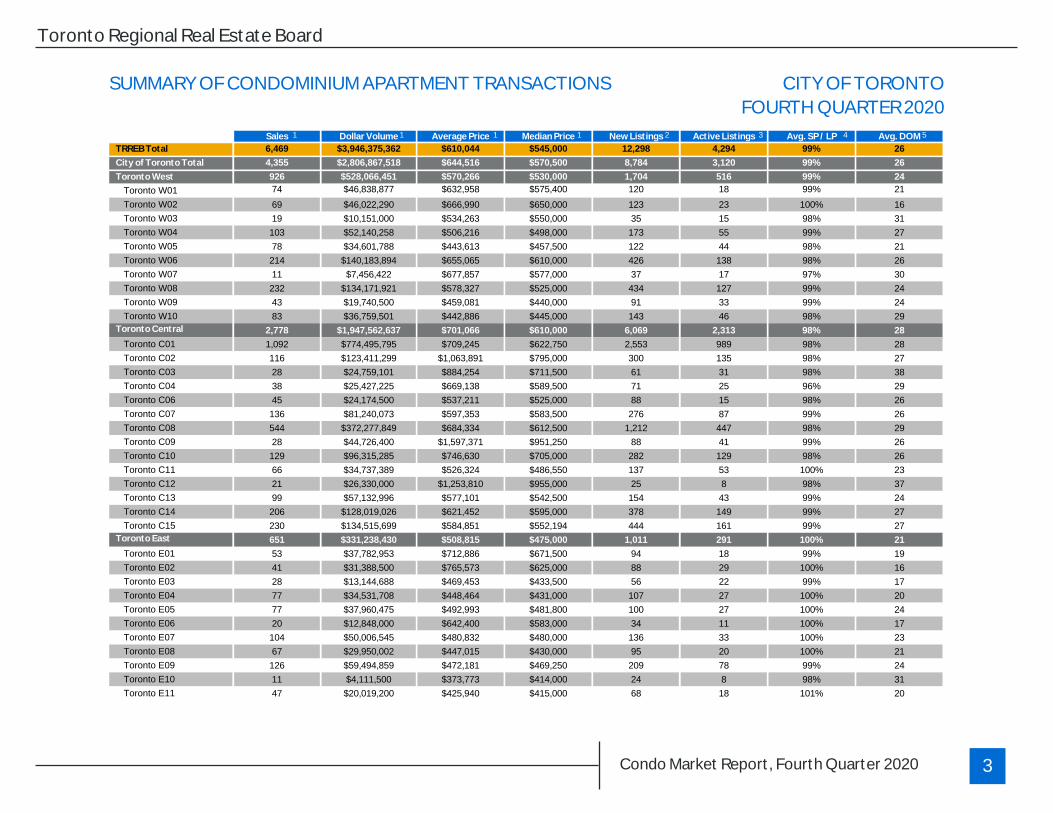
Sales Dollar Volume Average Price Median Price New Listings Active Listings Avg. SP / LP Avg. DOMTRREB TotalCity of Toronto TotalToronto West
Toronto W01Toronto W02Toronto W03Toronto W04Toronto W05Toronto W06Toronto W07Toronto W08Toronto W09Toronto W10
Toronto CentralToronto C01Toronto C02Toronto C03Toronto C04Toronto C06Toronto C07Toronto C08Toronto C09Toronto C10Toronto C11Toronto C12Toronto C13Toronto C14Toronto C15
Toronto EastToronto E01Toronto E02Toronto E03Toronto E04Toronto E05Toronto E06Toronto E07Toronto E08Toronto E09Toronto E10Toronto E11
6,469 $3,946,375,362 $610,044 $545,000 12,298 4,294 99% 264,355 $2,806,867,518 $644,516 $570,500 8,784 3,120 99% 26
926 $528,066,451 $570,266 $530,000 1,704 516 99% 2474 $46,838,877 $632,958 $575,400 120 18 99% 2169 $46,022,290 $666,990 $650,000 123 23 100% 1619 $10,151,000 $534,263 $550,000 35 15 98% 31
103 $52,140,258 $506,216 $498,000 173 55 99% 2778 $34,601,788 $443,613 $457,500 122 44 98% 21
214 $140,183,894 $655,065 $610,000 426 138 98% 2611 $7,456,422 $677,857 $577,000 37 17 97% 30
232 $134,171,921 $578,327 $525,000 434 127 99% 2443 $19,740,500 $459,081 $440,000 91 33 99% 2483 $36,759,501 $442,886 $445,000 143 46 98% 29
2,778 $1,947,562,637 $701,066 $610,000 6,069 2,313 98% 281,092 $774,495,795 $709,245 $622,750 2,553 989 98% 28
116 $123,411,299 $1,063,891 $795,000 300 135 98% 2728 $24,759,101 $884,254 $711,500 61 31 98% 3838 $25,427,225 $669,138 $589,500 71 25 96% 2945 $24,174,500 $537,211 $525,000 88 15 98% 26
136 $81,240,073 $597,353 $583,500 276 87 99% 26544 $372,277,849 $684,334 $612,500 1,212 447 98% 2928 $44,726,400 $1,597,371 $951,250 88 41 99% 26
129 $96,315,285 $746,630 $705,000 282 129 98% 2666 $34,737,389 $526,324 $486,550 137 53 100% 2321 $26,330,000 $1,253,810 $955,000 25 8 98% 3799 $57,132,996 $577,101 $542,500 154 43 99% 24
206 $128,019,026 $621,452 $595,000 378 149 99% 27230 $134,515,699 $584,851 $552,194 444 161 99% 27651 $331,238,430 $508,815 $475,000 1,011 291 100% 2153 $37,782,953 $712,886 $671,500 94 18 99% 1941 $31,388,500 $765,573 $625,000 88 29 100% 1628 $13,144,688 $469,453 $433,500 56 22 99% 1777 $34,531,708 $448,464 $431,000 107 27 100% 2077 $37,960,475 $492,993 $481,800 100 27 100% 2420 $12,848,000 $642,400 $583,000 34 11 100% 17
104 $50,006,545 $480,832 $480,000 136 33 100% 2367 $29,950,002 $447,015 $430,000 95 20 100% 21
126 $59,494,859 $472,181 $469,250 209 78 99% 2411 $4,111,500 $373,773 $414,000 24 8 98% 3147 $20,019,200 $425,940 $415,000 68 18 101% 20
Condo Market Report, Fourth Quarter 2020
1 1 1 1 2 3 4 5

Toronto Regional Real Estate BoardCondominium Apartment Market Summary
4
Condo Apartment Sales by Price Range (All Areas)
Source: Toronto Regional Real Estate Board
Source: Toronto Regional Real Estate Board
Condo Apartment Price by Bedroom (All Areas)
68%
13%
12%
3% 5%
68%
13%
12%
3% 5%
City of TorontoPeel RegionYork RegionDurham RegionHalton Region
2%
21%
25%31%
14%
7% 2%
21%
25%31%
14%
7%
BachelorOne BedroomOne Bedroom + DenTwo BedroomTwo Bedroom + DenThree Bedroom
0 500 1,000 1,500 2,000 2,500
0-199,999200K-299,999300K-399,999400K-499,999500K-599,999600K-699,999700K-799,999800K-899,999900K-999,999
1,000,000+
Sellin
g Pric
e Ran
ge
Number of Sales
$0$50,000
$100,000$150,000$200,000$250,000$300,000$350,000$400,000$450,000$500,000$550,000$600,000$650,000$700,000$750,000$800,000
Bachelor One Bedroom One Bedroom+ Den
Two Bedroom Two Bedroom+ Den
ThreeBedroom
Total
Average Selling Price Median Selling Price
Source: Toronto Regional Real Estate Board
Source: Toronto Regional Real Estate Board
Share of Total Condo Apartment Sales By TRREB Area
Share of Total Condo Apartment Sales By Bedroom Type (All Areas)
Condo Market Report, Fourth Quarter 2020
1
0 200 400 600
0-199,999200K-299,999300K-399,999400K-499,999500K-599,999600K-699,999700K-799,999800K-899,999900K-999,999
1,000,000+
Sellin
g Pric
e Ran
ge
Number of Sales
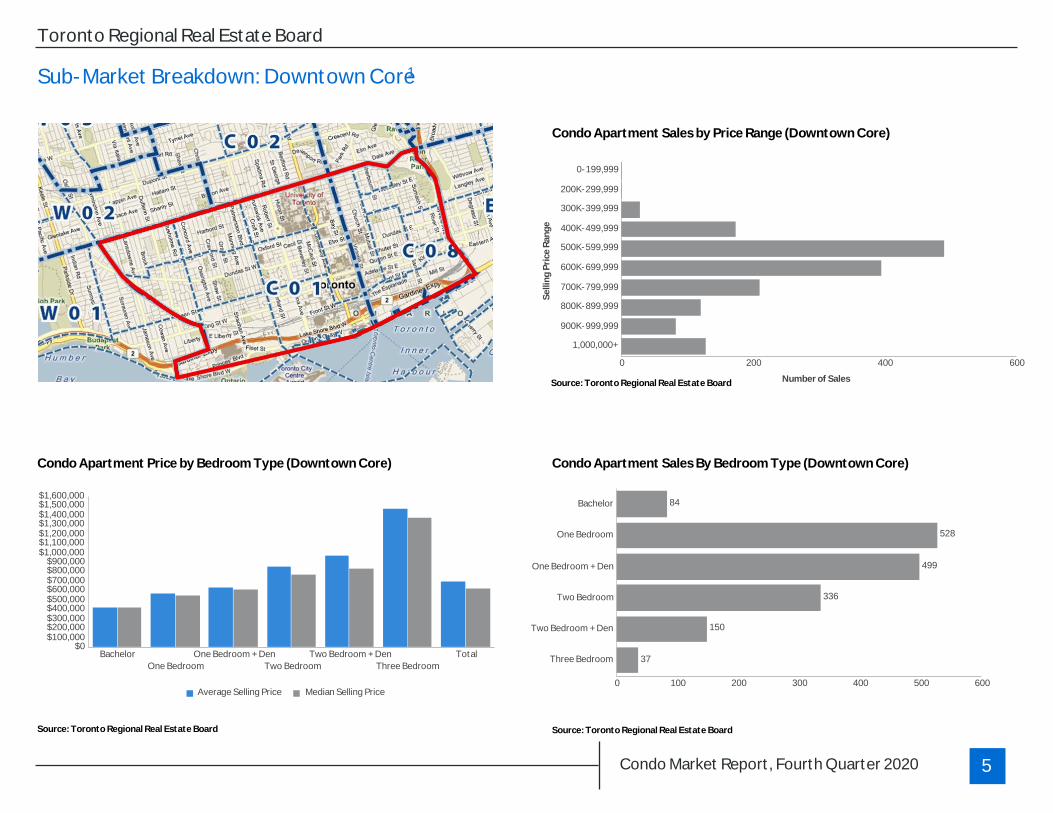
Toronto Regional Real Estate BoardSub-Market Breakdown: Downtown Core
5
Condo Apartment Sales by Price Range (Downtown Core)
Source: Toronto Regional Real Estate Board
Condo Apartment Price by Bedroom Type (Downtown Core)
Source: Toronto Regional Real Estate Board
Source: Toronto Regional Real Estate Board
Condo Apartment Sales By Bedroom Type (Downtown Core)
$0$100,000$200,000$300,000$400,000$500,000$600,000$700,000$800,000$900,000
$1,000,000$1,100,000$1,200,000$1,300,000$1,400,000$1,500,000$1,600,000
BachelorOne Bedroom
One Bedroom + DenTwo Bedroom
Two Bedroom + DenThree Bedroom
Total
Average Selling Price Median Selling Price0 100 200 300 400 500 600
84
528
499
336
150
37
Bachelor
One Bedroom
One Bedroom + Den
Two Bedroom
Two Bedroom + Den
Three Bedroom
Condo Market Report, Fourth Quarter 2020
1

Toronto Regional Real Estate BoardSub-Market Breakdown: North York City Centre
6
Condo Apartment Sales by Price Range (North York City Centre)
Source: Toronto Regional Real Estate Board
Condo Apartment Price by Bedroom Type (North York City Centre)
Source: Toronto Regional Real Estate Board
Source: Toronto Regional Real Estate Board
Condo Apartment Sales By Bedroom Type (North York City Centre)
0 50 100 150
0
78
66
106
71
21
Bachelor
One Bedroom
One Bedroom + Den
Two Bedroom
Two Bedroom + Den
Three Bedroom$0
$50,000$100,000$150,000$200,000$250,000$300,000$350,000$400,000$450,000$500,000$550,000$600,000$650,000$700,000$750,000$800,000
One Bedroom One Bedroom +Den
Two Bedroom Two Bedroom +Den
Three Bedroom Total
Average Selling Price Median Selling Price
Condo Market Report, Fourth Quarter 2020
0 40 80 120 160
0-199,999200K-299,999300K-399,999400K-499,999500K-599,999600K-699,999700K-799,999800K-899,999900K-999,999
1,000,000+
Sellin
g Pric
e Ran
ge
Number of Sales
1
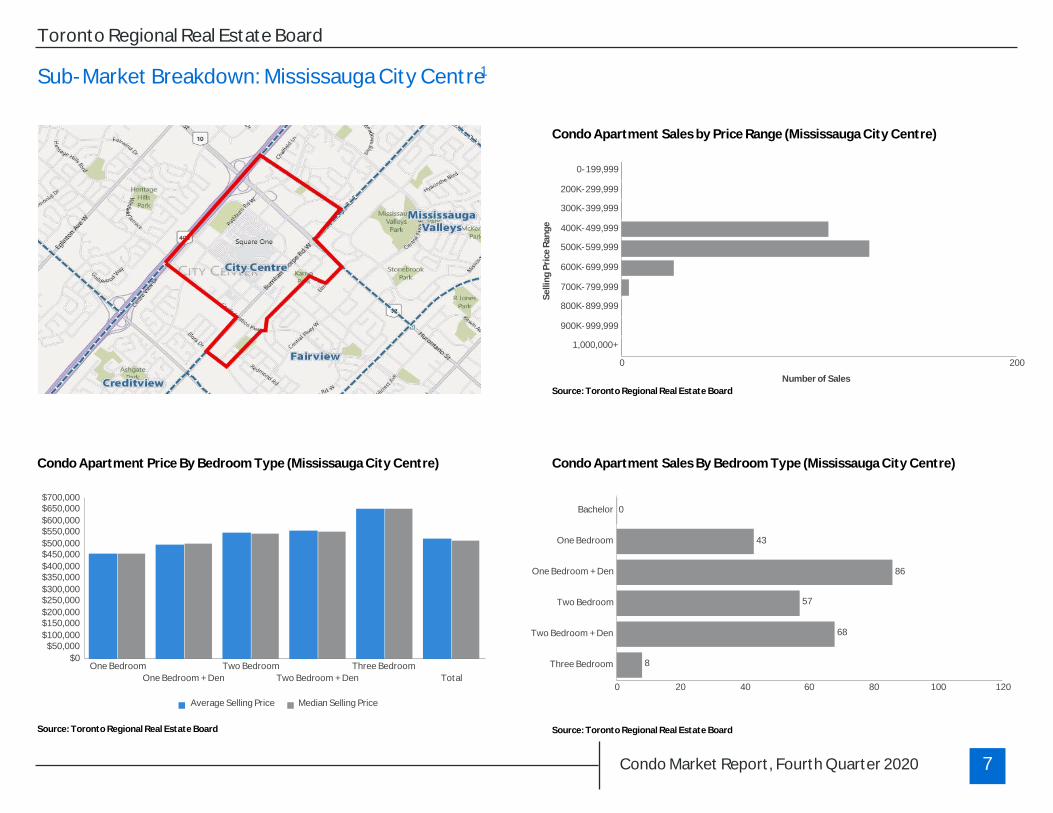
Toronto Regional Real Estate BoardSub-Market Breakdown: Mississauga City Centre
7
Condo Apartment Sales by Price Range (Mississauga City Centre)
Source: Toronto Regional Real Estate Board
Condo Apartment Price By Bedroom Type (Mississauga City Centre)
Source: Toronto Regional Real Estate Board
Source: Toronto Regional Real Estate Board
Condo Apartment Sales By Bedroom Type (Mississauga City Centre)
0 20 40 60 80 100 120
0
43
86
57
68
8
Bachelor
One Bedroom
One Bedroom + Den
Two Bedroom
Two Bedroom + Den
Three Bedroom$0$50,000
$100,000$150,000$200,000$250,000$300,000$350,000$400,000$450,000$500,000$550,000$600,000$650,000$700,000
One BedroomOne Bedroom + Den
Two BedroomTwo Bedroom + Den
Three BedroomTotal
Average Selling Price Median Selling Price
Condo Market Report, Fourth Quarter 2020
0 200
0-199,999200K-299,999300K-399,999400K-499,999500K-599,999600K-699,999700K-799,999800K-899,999900K-999,999
1,000,000+
Sellin
g Pric
e Ran
ge
Number of Sales
1

Toronto Regional Real Estate BoardRental Market Summary
8
Q4 Condo Rental Market Statistics
Source: Toronto Regional Real Estate Board
Number of Units Rented
Source: Toronto Regional Real Estate Board
Average One-Bedroom Rents
Number of Units Listed
Source: Toronto Regional Real Estate Board
• Greater Toronto Area REALTORS® reported 12,584 condominiumapartment rentals through TRREB’s MLS® System during the fourth quarterof 2020. This represented an increase of 86.3 per cent compared to 6,756rentals in Q4 2019.
• The number of condominium apartments listed for rent during Q4 2020 wasup by 131.6 per cent compared to Q4 2019.
• The average one-bedroom condominium apartment rent was down by 16.5per cent year over year in Q4 2020 to $1,845 compared to $2,209 in Q42019. The average two-bedroom condominium apartment rent was downby 14.5 per cent over the same time period to $2,453 compared to $2,868.
$0
$400
$800
$1,200
$1,600
$2,000
$2,400
Total TREB Downtown Core North York City Centre Mississauga City Centre
20202019
Q4 2020 vs. Q4 2019
Q4 2020 vs. Q4 2019 Q4 2020 vs. Q4 2019
0
20,000
Downtown Core North York City Centre Mississauga City Centre
20202019
0500
1,0001,5002,0002,5003,0003,5004,0004,5005,0005,5006,000
Downtown Core North York City Centre Mississauga City Centre
20202019
Condo Market Report, Fourth Quarter 2020

Toronto Regional Real Estate BoardShare of GTA CondoApartments In Rental
NOTES1 - Sales, dollar volume, average sale prices and median sale prices are based on firm transactions entered into the TorontoMLS systembetween the first and last day of the quarter being reported.2 - New listings entered into the TorontoMLS system between the first and last day of the quarter being reported.3 - Active listings as of the end of the last day of the quarter being reported.4 - Ratio of the average selling price to the average listing price for firm transactions entered into the TorontoMLS system between thefirst and last day of the quarter being reported.5 - Average number of days on the market for firm transactions entered into the TorontoMLS system between the first and last day of thequarter beingreported.6 - Past monthly and year-to-date figures are revised monthly.
9
Source: CMHC, Rental Market Report
Source: CMHC, Rental Market Report
24.0%28.4%
36.1%
29.0%
20.3%
Halton Peel Toronto York Durham
0.4% 0.4%
0.9%
0.3%0.4%
Halton Peel Toronto York Durham
GTA Condo ApartmentVacancy Rate
Condo Market Report, Fourth Quarter 2020 Copyright® 2021 Toronto Regional Real Estate Board