CONDITIONS & RESOURCES Chapter 3: Organismal Ecology.
61
CONDITIONS & RESOURCES Chapter 3: Organismal Ecology
-
Upload
stephanie-reed -
Category
Documents
-
view
230 -
download
0
Transcript of CONDITIONS & RESOURCES Chapter 3: Organismal Ecology.
CONDITIONS & RESOURCES
Chapter 3: Organismal Ecology
Environmental Factors Factors which vary in space and time, and
to which organisms are differentially responsive

Conditions (abiotic factors) Physicochemical features of the environment that
may be altered by the activities of living organisms, but not consumed Temperature Relative humidity pH Salinity Current velocity Soil structure Pollutant concentration
Resources Quantities of something that can reduced by the
activities of a living organism during its growth and development
Made less available or unavailable to other organisms Solar radiation Inorganic materials - CO2, water, oxygen, mineral
nutrients (macro-, micronutrients) Food Space
Effects of conditions For each species, there is some
level/concentration/intensity of a factor at which it does best - its optimum for that factor
Optimum conditions result in individuals with the highest fitness
Higher or lower levels of a factor result in reduced fitness or non-survival
Example of a condition Temperature - one of the most important
factors because of its influence on metabolism
Temperature Homeotherms - maintain constant body
temp. as environmental temp. varies Poikilotherms - body temp. varies with
environmental temp. Endotherms - regulate body temp. by
internal heat production Ectotherms - depend on external heat
sources
Endotherms Regulate body temperature by internal heat
production (birds, mammals) Regulators - 35-40°C Constancy of performance over wide range of
temperatures Large expenditure of energy to maintain internal
heat (large food requirements) (cost) At higher temps., they alter insulation, shunt blood
flow to surface, pant, seek out cool habitats
Ectotherms Depend on external heat sources Conformers Can moderate or modify heat exchange with
environment by: Developing various body coverings (reflective) Simple or complex behaviors Complex physiological process (bee shivering)
Body temp. still varies with environment because… Regulatory powers limited (esp. plants) Dependent on external source of heat (not
always available) Costs associated with temp. regulation
(energy, predator exposure) - benefits must outway costs
Ectotherms Changes in body temperature result in
changes in rates at which physiological processes occur
Temperature coefficient = Q10
Q10 rule For every 10°C increase in temperature, a
reaction rate (e.g., metabolism, development) increases two times Q10 = 2
May be higher or lower in some organisms for some reactions
Other effects of temperature on ectotherms Can become acclimatized to different temperature
regimes Some physiological processes adjust over time to
different temperatures
Temperature may serve as stimulus to begin some process Initiate development in some plants Diapause
Other effects of temperature on ectotherms High temperatures can…
Inactivate/denature enzymes Greatly increase energy expenditures Dehydrate (most important for terrestrials)
Other effects of temperature on ectotherms Low temperatures can…
Reduce energy expenditures (also cease maintenance, repair activities)
Induce “hardening” in plants (acclimatization to low temps.)
Produce chilling injury - disruption of membrane structure that interferes with water uptake or retention
Produce freezing injury/death - ice crystal formation within cells
Temperature can affect distributions Organisms generally found where
temperatures are optimum for survival, growth, reproduction

Temperature can affect distributions - continued Lethal high or low temperatures can limit
distributions, but only need to occur infrequently to do so
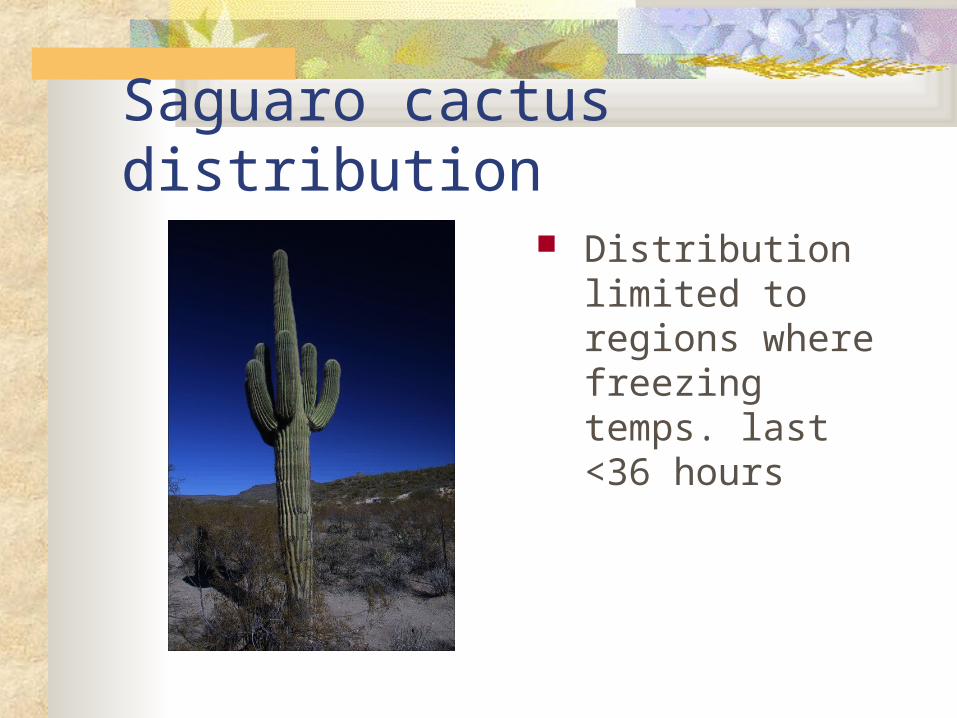
Saguaro cactus distribution Distribution limited
to regions where freezing temps. last <36 hours
Temperature can affect distributions - continued Distributions most often limited by sub-
optimal temperatures that reduce growth, reproduction, or increase mortality
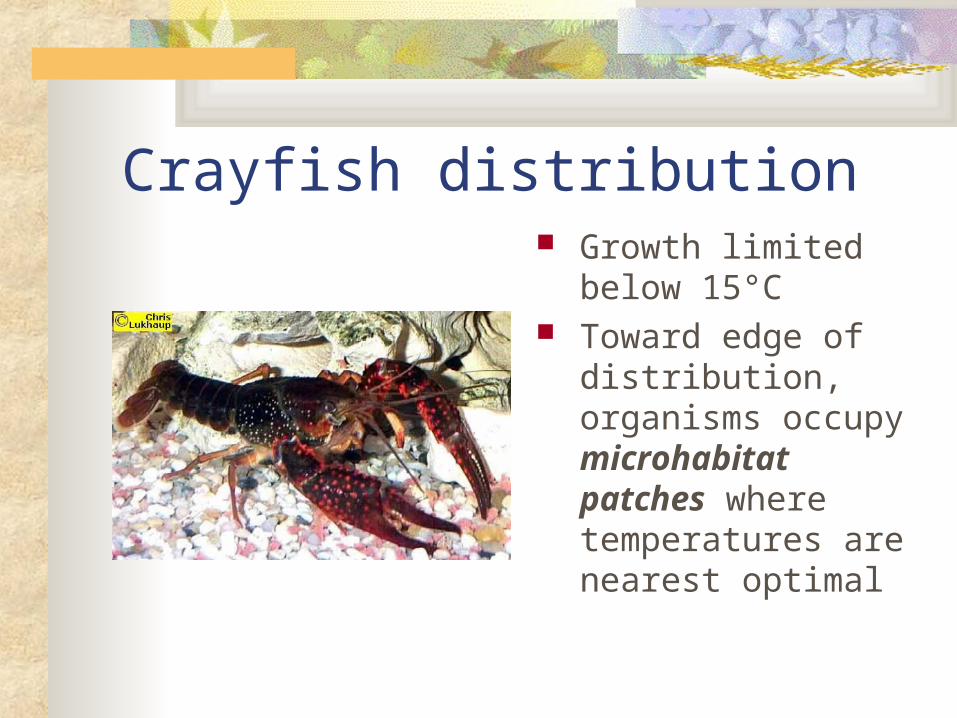
Crayfish distribution Growth limited below
15°C Toward edge of
distribution, organisms occupy microhabitat patches where temperatures are nearest optimal
Temperature can affect distributions - continued Sub-optimal temperatures may affect
distributions by altering competitive interactions between species, or by interacting with other factors (i.e., O2) that more strongly affect organisms
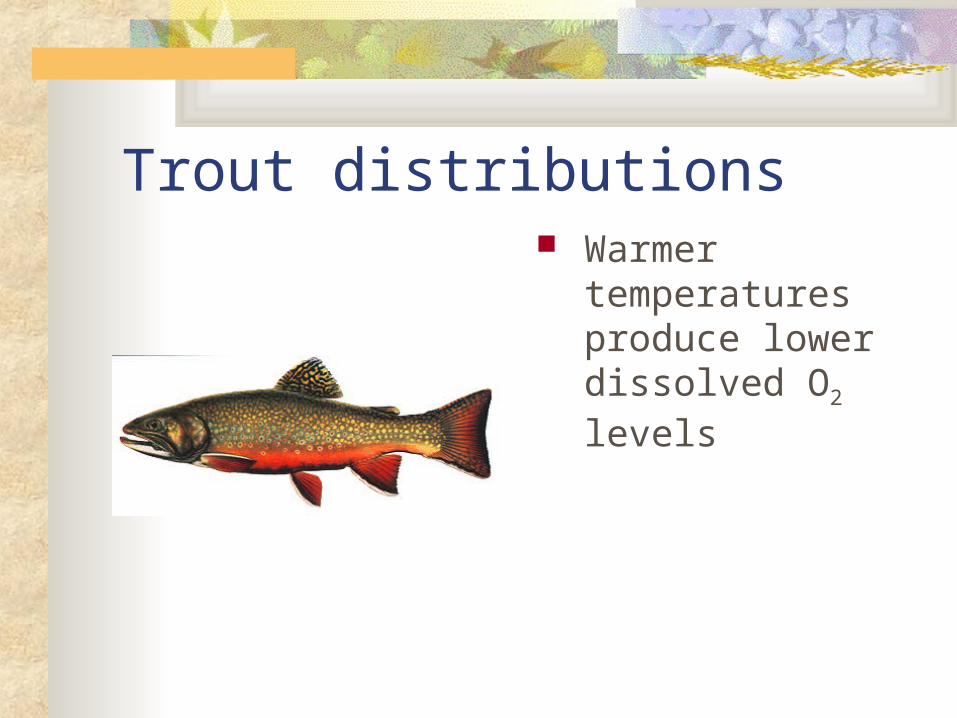
Trout distributions Warmer temperatures
produce lower dissolved O2 levels
Temperature can affect distributions - continued Effects of suboptimal temperatures can be
moderated by evolution, behavior, physiology
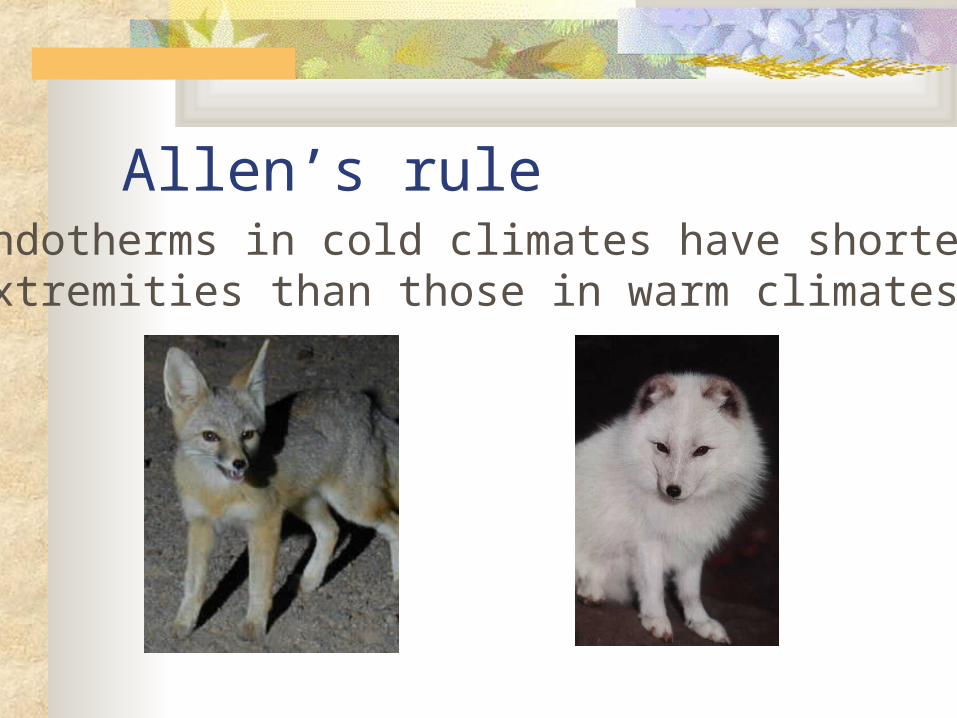
Allen’s ruleEndotherms in cold climates have shorterextremities than those in warm climates
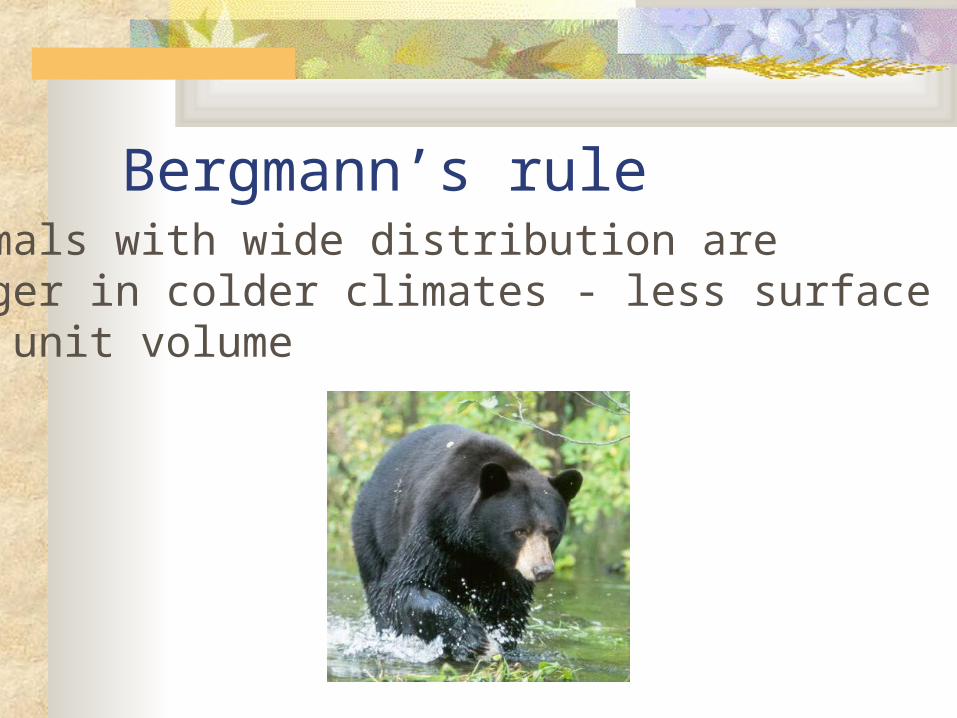
Bergmann’s ruleMammals with wide distribution arelarger in colder climates - less surface areaper unit volume
Other conditions Relative humidity Rate of water loss from evaporation and
respiration by terrestrials is dependent on relative humidity Higher humidity lower rate of loss Organisms differ in abilities to reduce or counteract
losses Require different relative humidities Often difficult to separate from temperature and wind
speed
pH Altered pH can:
Upset osmoregulation and other processes Alter availability of nutrients, minerals, toxic
metals Aluminum at pH < 4.0
Alter quality/range of available food resources
Different organisms have different requirements/tolerances
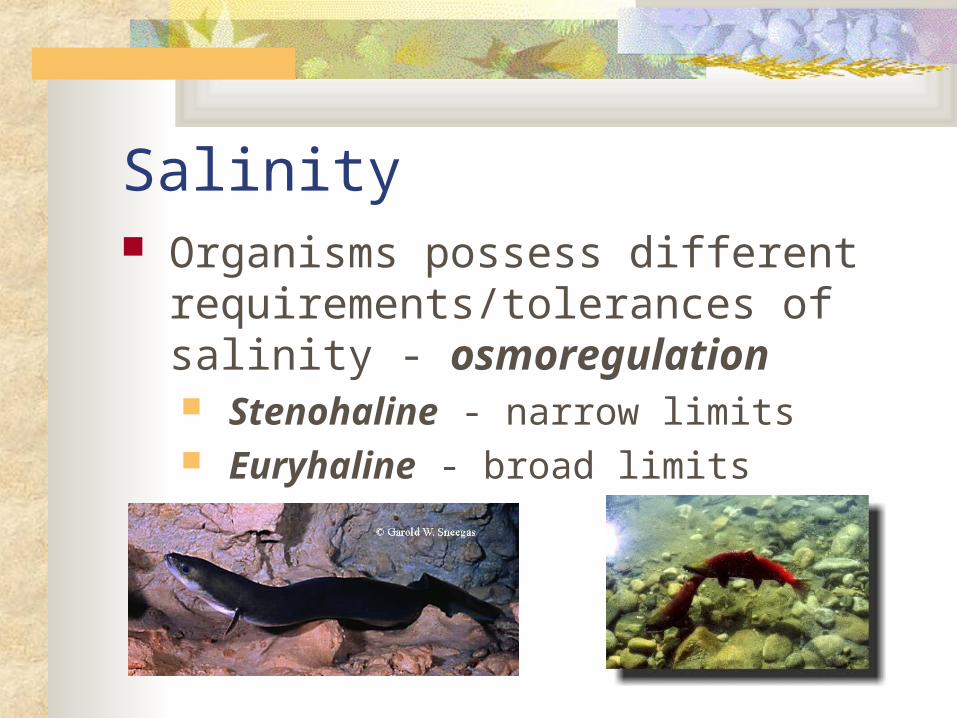
Salinity Organisms possess different
requirements/tolerances of salinity - osmoregulation Stenohaline - narrow limits Euryhaline - broad limits
Current velocity Different requirements of body
shape/attachment under different flow regimes
Low-profile, streamlining, encrusting forms in higher velocities
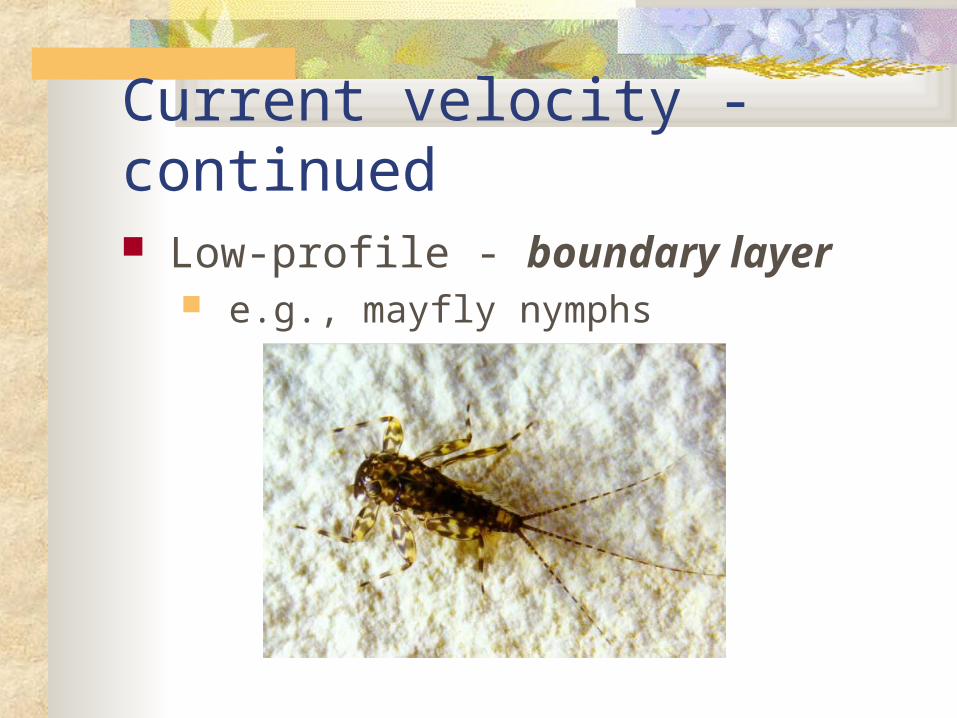
Current velocity - continued Low-profile - boundary layer
e.g., mayfly nymphs
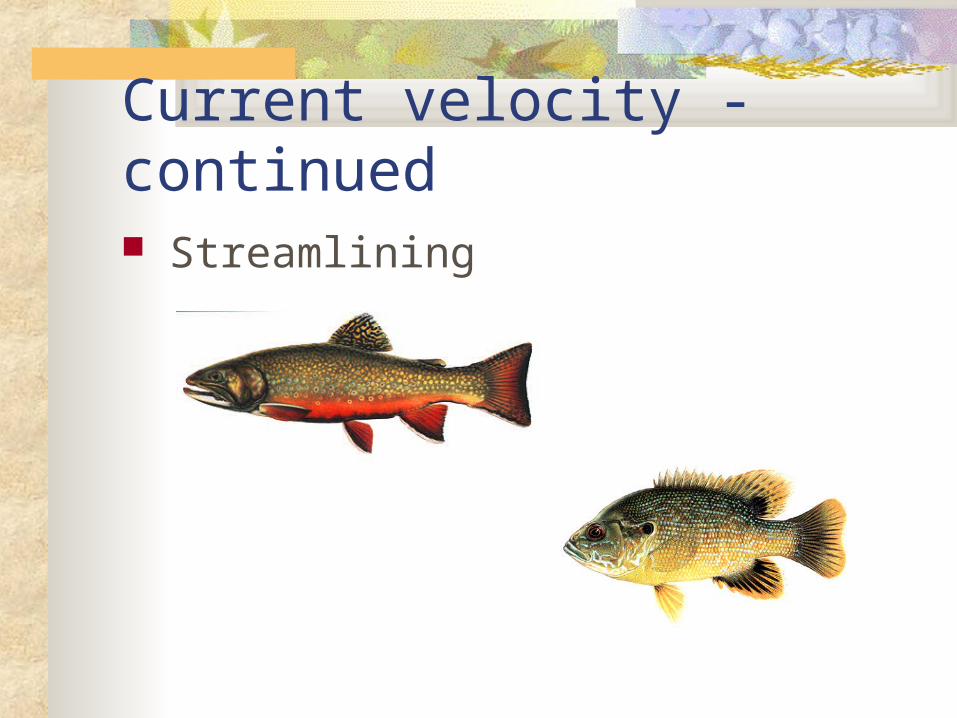
Current velocity - continued Streamlining
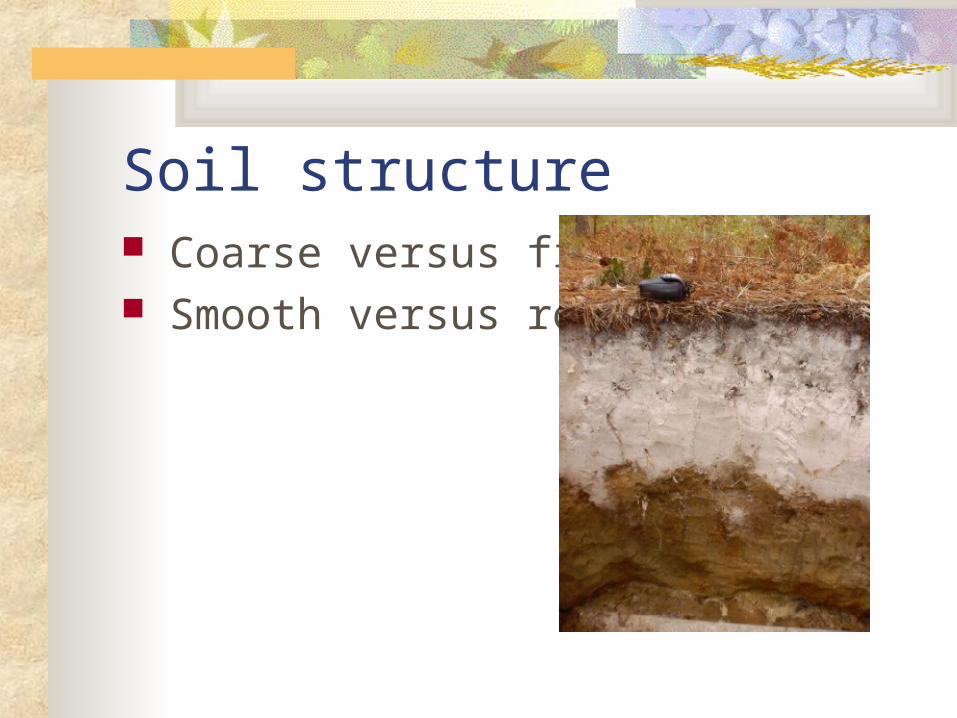
Soil structure Coarse versus fine Smooth versus rough

Pollutants Differing tolerances to various pollutants
Concentration
Percentsurvival
100
0
Species A Species B
Ecological Niche Description of the various environmental
limits within which a given species can: Survive Grow Reproduce Maintain a viable population
n-dimensional hypervolume
Two Kinds of Niches Fundamental niche
Potential limits of the species
Realized niche Actual limits of the species as imposed on it
by competitors and predators
Resources Consumed or made less available to others
Solar radiation CO2
Water Macronutrients (N, P, S, K, Ca, Mg) Trace elements (e.g., Mn, Zn, Cu) O2
Food Space
Solar Radiation Source of energy used by plants for
photosynthesis Not equally distributed worldwide
Equator - most Poles - least
Results from tilt of earth on axis relative to sun and thickness of atmosphere penetrated by light
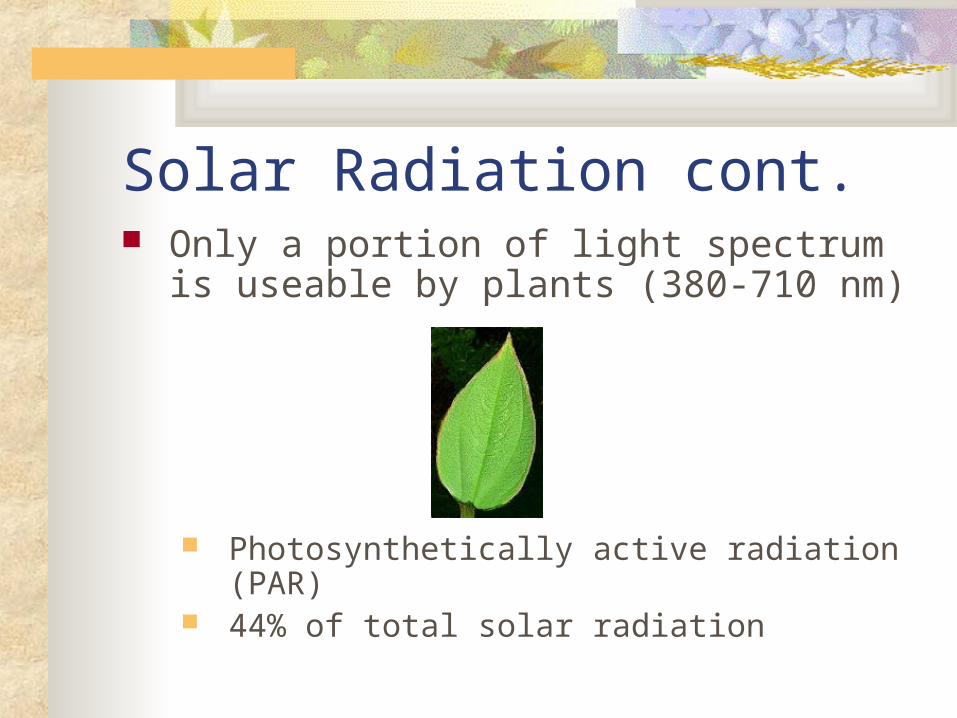
Solar Radiation cont. Only a portion of light spectrum is useable by
plants (380-710 nm)
Photosynthetically active radiation (PAR) 44% of total solar radiation
Solar Radiation cont. Rate of photosynthesis depends on light
intensity Zero in darkness Compensation point - level where
photosynthesis equals respiration Saturation - maximal (achieved only if
products of photosynthesis are withdrawn rapidly for growth or storage)
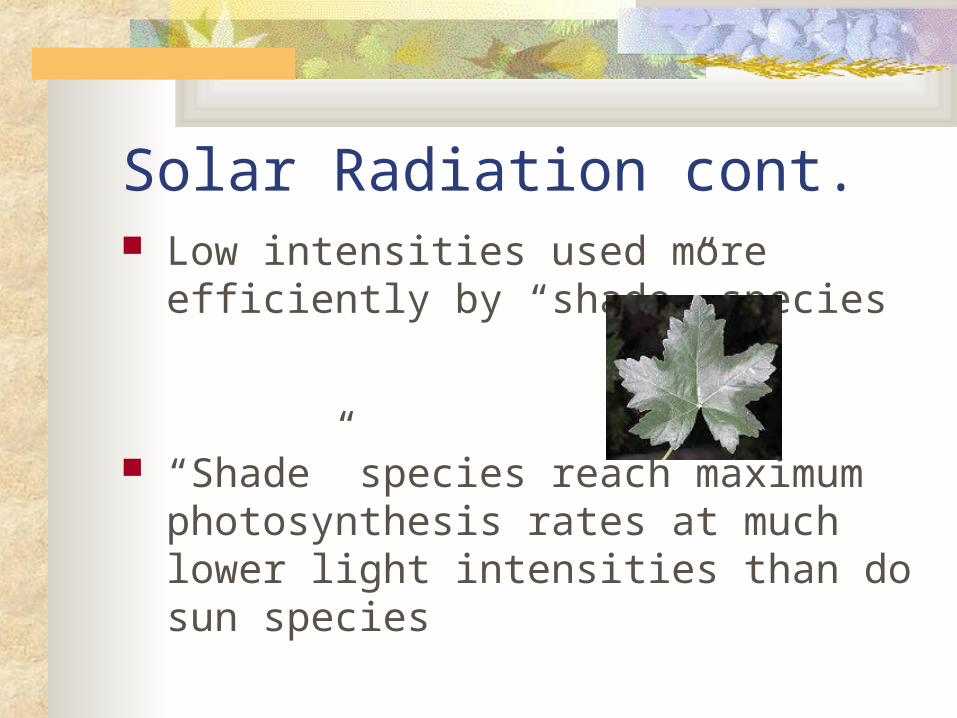
Solar Radiation cont. Low intensities used more efficiently by
“shade” species
“Shade” species reach maximum photosynthesis rates at much lower light intensities than do sun species

Solar Radiation cont. Light intensity determines optimal leaf area
index (LAI) for a plant population LAI is surface area of leaves borne above
area of ground High light intensities -> high LAI Low light intensities -> low LAI
Most plants have LAI optimal for average light intensity they receive
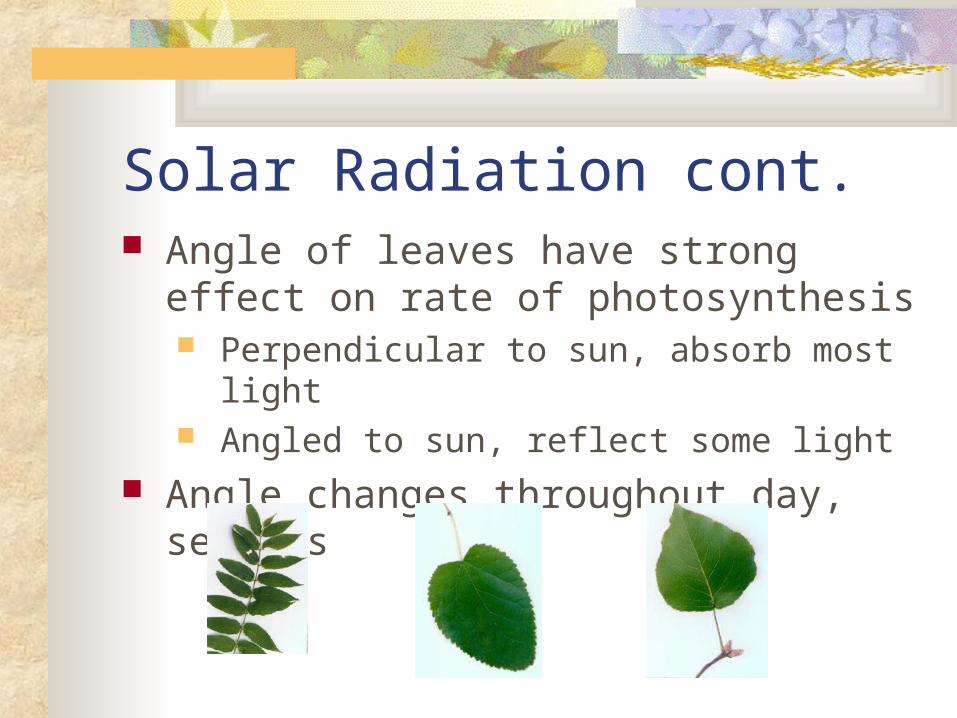
Solar Radiation cont. Angle of leaves have strong effect on rate
of photosynthesis Perpendicular to sun, absorb most light Angled to sun, reflect some light
Angle changes throughout day, seasons
Solar Radiation cont. Efficiency of utilization
Maximum lab values < 5% Maximum field values < 3%
Tropics 1-3% Temperate 0.6-1.2%
Temperate crops 0.6%
Water Terrestrial organisms continually lose
water to environment Animals replenish it by:
Drinking water Obtaining it from their food (metabolism)
Availability can limit distribution and abundance
Water Plants obtain moisture from ground
Constant supply in many locations, limited in others
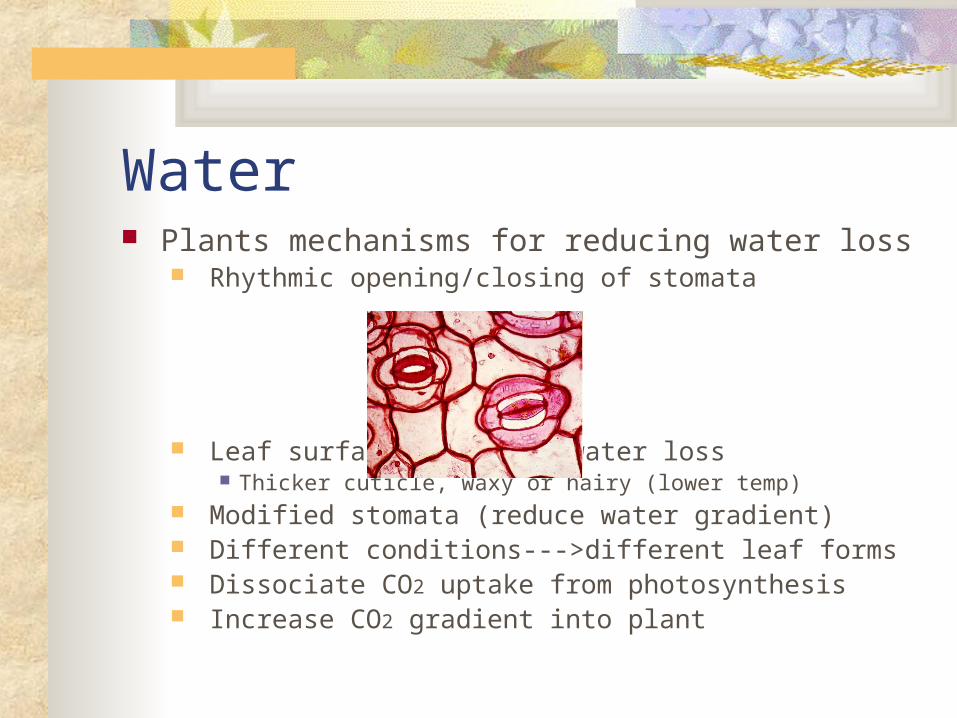
Water Plants mechanisms for reducing water loss
Rhythmic opening/closing of stomata
Leaf surface to reduce water loss Thicker cuticle, waxy or hairy (lower temp)
Modified stomata (reduce water gradient) Different conditions--->different leaf forms Dissociate CO2 uptake from photosynthesis Increase CO2 gradient into plant
Water Limits placed on plant roots’ abilities to
obtain water from soil Field capacity - maximum amount soil can
contain (held by soil pores against gravity) Permanent wilting point - minimum amount
needed by plants (can’t be extracted by root’s suction force, plant wilts and can’t recover)
Suction force causes resource depletion zone in vicinity of root
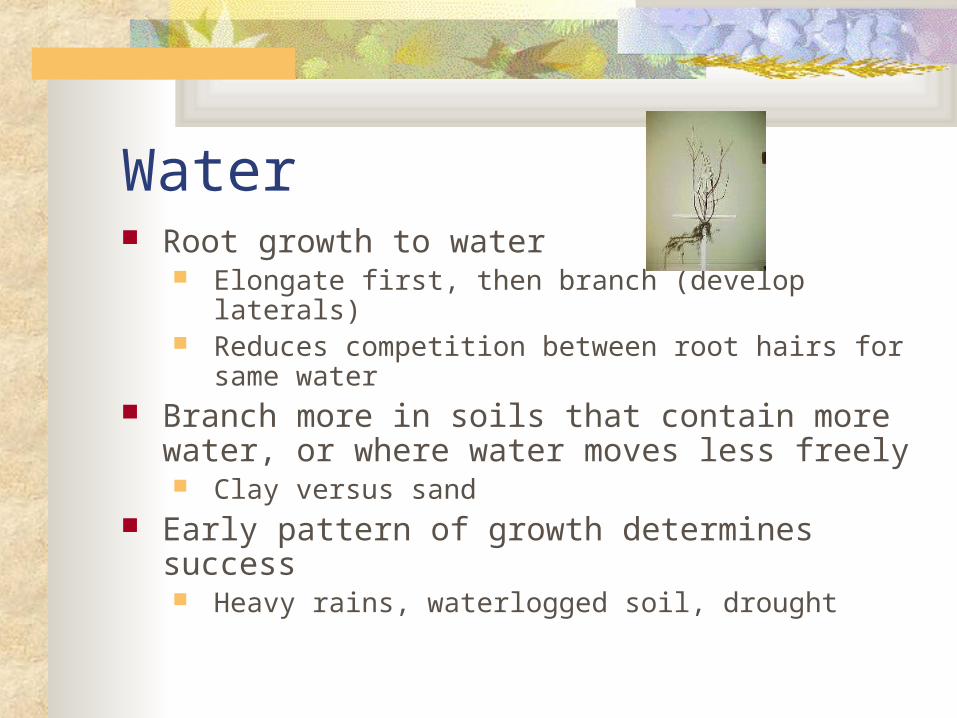
Water Root growth to water
Elongate first, then branch (develop laterals) Reduces competition between root hairs for same
water Branch more in soils that contain more water, or
where water moves less freely Clay versus sand
Early pattern of growth determines success Heavy rains, waterlogged soil, drought
Macronutrients, trace elements Animals get them from food Plants get them from soil
Require the same, but in different quantities or proportions Limits distributions of certain plants to certain soil
types Each nutrient enters soil independently of
others, has different properties of absorption, diffusion

Macronutrients, trace elements Nitrates, calcium, sodium move freely
through soil with water Often delivered to roots faster than can be
taken up by plant Resource depletion zones may be wide
because of ease of movement through soil
Macronutrients, trace elements Phosphate and potassium bound on soil
colloids by surfaces with calcium, aluminum, ferric ions Rate at which they move to plant depends
primarily on how rapidly they are released from colloids (tightly adsorbed)
Resource depletion zones usually narrow
Food Heterotrophs, consumers
Predators - kill and eat part or whole Parasites - eat on living Decomposers - eat on dead
Polyphagous - generalists - have preferences but are adaptable
Monophagous - specialists - not very adaptable
Food Quality Plants - high C:N ratio (40:1-20:1) because
of high-C cellulose, other structural materials
Heterotrophs - low C:N ratios (10:1-8:1), no structural carbohydrate but lots of protein
Food Most organisms lack cellulase to break
down cellulose Herbivores physically rupture cell walls to
gain access to contents, or use microbes Detritivores may get much nutrition from
bacteria, fungi colonizing dead materials
Food Herbivores may be selective on certain
plant parts Parts often have less cellulose and more:
Nitrogen - growing tips Carbohydrate (starch, sugar) - tubers Fats (oils) - seeds
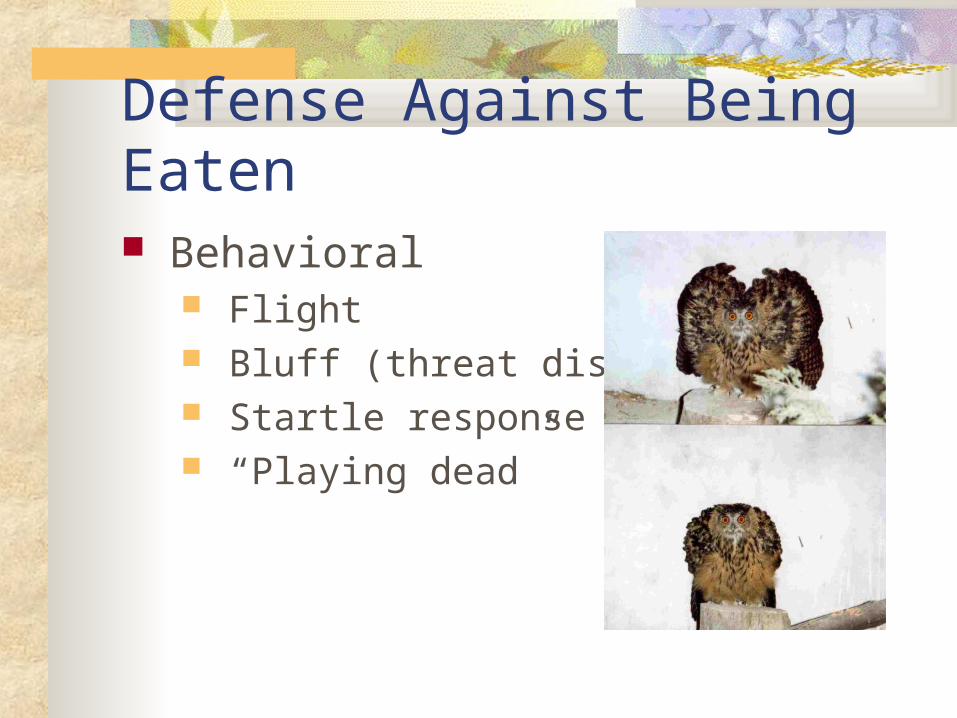
Defense Against Being Eaten Behavioral
Flight Bluff (threat displays) Startle response (moths) “Playing dead”
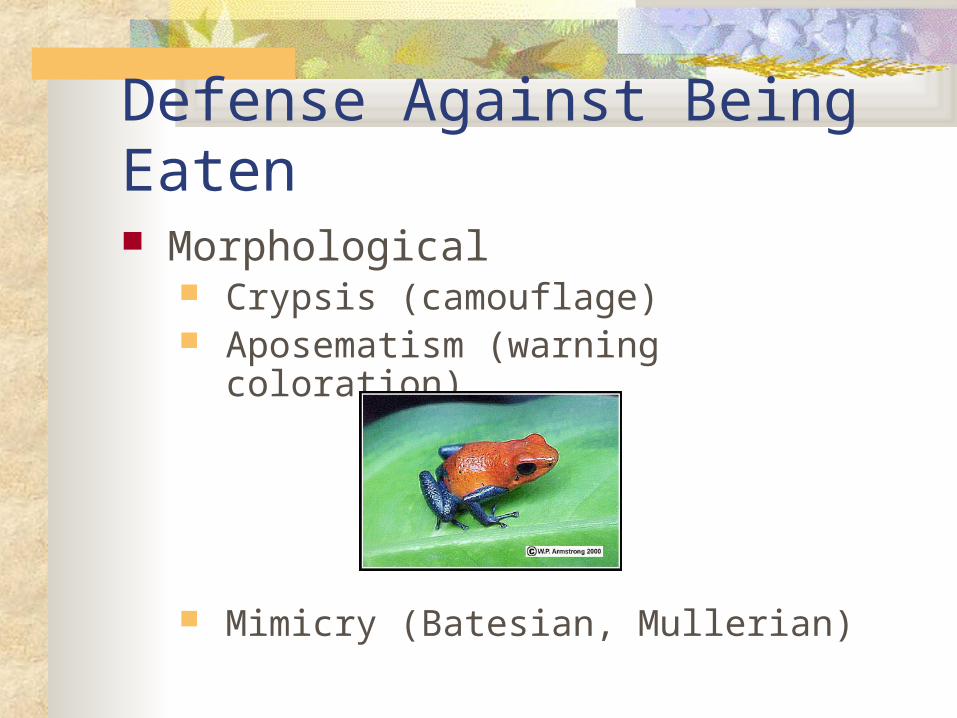
Defense Against Being Eaten Morphological
Crypsis (camouflage) Aposematism (warning coloration)
Mimicry (Batesian, Mullerian)
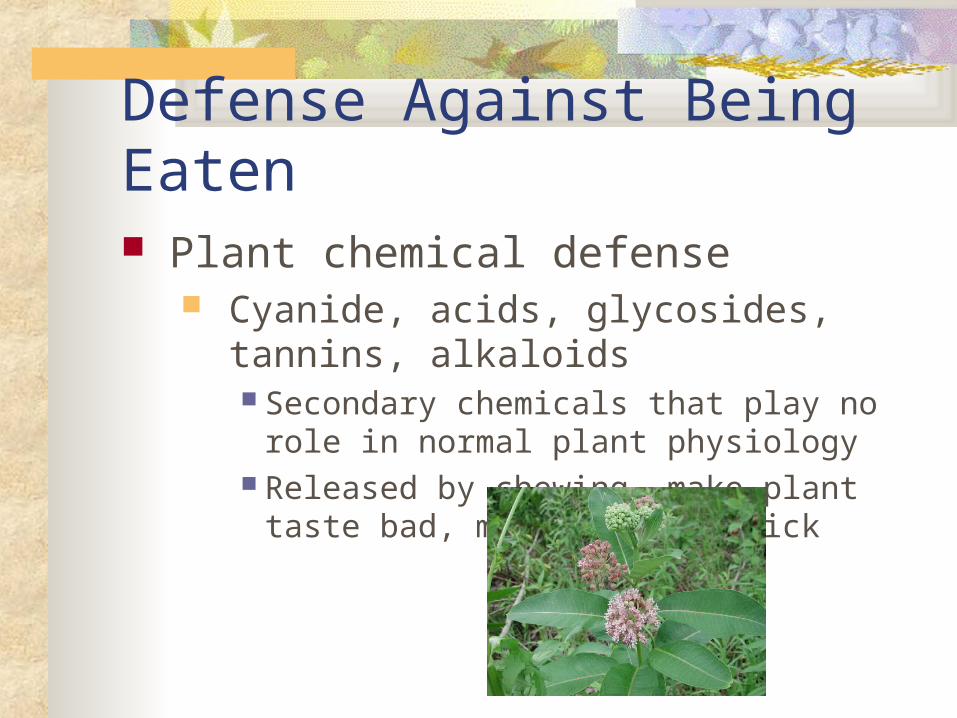
Defense Against Being Eaten Plant chemical defense
Cyanide, acids, glycosides, tannins, alkaloids Secondary chemicals that play no role in normal
plant physiology Released by chewing, make plant taste bad, make
organism sick
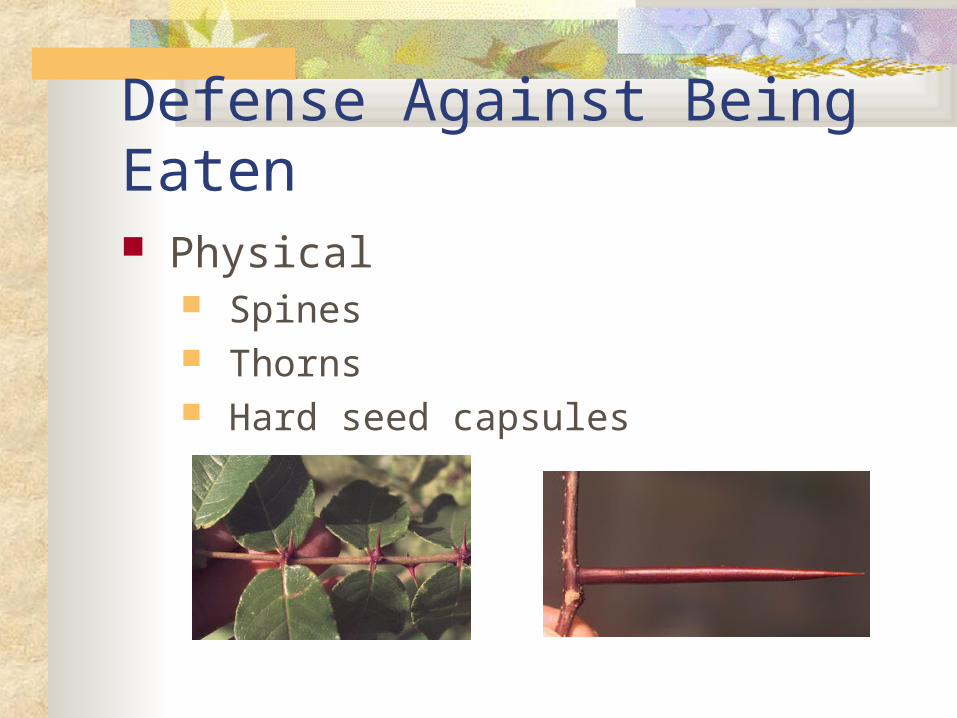
Defense Against Being Eaten Physical
Spines Thorns Hard seed capsules
Defense Against Being Eaten All defenses reduce likelihood of being
consumed One or more “predators” capable of
overcoming the defense Defense costs energy that could have been
used in other activities
Resources Add more dimensions to the ecological
niche