Condition of America's Public School Facilities: …Condition of America’s Public School...
61
Condition of America’s Public School Facilities: 2012 –13 First Look NCES 2014-022 U.S. DEPARTMENT OF EDUCATION
Transcript of Condition of America's Public School Facilities: …Condition of America’s Public School...

Condition of America’s Public School Facilities: 2012 –13
First Look
NCES 2014-022 U.S. DEPARTMENT OF EDUCATION

Condition of America’s Public School Facilities: 2012–13 First Look
MARCH 2014
Debbie Alexander Laurie Lewis Westat
John Ralph Program Director National Center for Education Statistics
NCES 2014-022 U.S. DEPARTMENT OF EDUCATION

U.S. Department of Education Arne Duncan Secretary
Institute of Education Sciences John Q. Easton Director
National Center for Education Statistics John Q. Easton Acting Commissioner
The National Center for Education Statistics (NCES) is the primary federal entity for collecting, analyzing, and reporting data related to education in the United States and other nations. It fulfills a congressional mandate to collect, collate, analyze, and report full and complete statistics on the condition of education in the United States; conduct and publish reports and specialized analyses of the meaning and significance of such statistics; assist state and local education agencies in improving their statistical systems; and review and report on education activities in foreign countries.
NCES activities are designed to address high-priority education data needs; provide consistent, reliable, complete, and accurate indicators of education status and trends; and report timely, useful, and high-quality data to the U.S. Department of Education, the Congress, the states, other education policymakers, practitioners, data users, and the general public. Unless specifically noted, all information contained herein is in the public domain.
We strive to make our products available in a variety of formats and in language that is appropriate to a variety of audiences. You, as our customer, are the best judge of our success in communicating information effectively. If you have any comments or suggestions about this or any other NCES product or report, we would like to hear from you. Please direct your comments to
NCES, IES, U.S. Department of Education 1990 K Street NW Washington, DC 20006-5651
March 2014
The NCES Home Page address is http://nces.ed.gov. The NCES Publications and Products address is http://nces.ed.gov/pubsearch.
This publication is only available online. To download, view, and print the report as a PDF file, go to the NCES Publications and Products address shown above.
This report was prepared for the National Center for Education Statistics under Contract No. ED-04-C0-0059/0025 with Westat. Mention of trade names, commercial products, or organizations does not imply endorsement by the U.S. Government.
Suggested Citation
Alexander, D., and Lewis, L. (2014). Condition of America’s Public School Facilities: 2012–13 (NCES 2014-022). U.S. Department of Education. Washington, DC: National Center for Education Statistics. Retrieved [date] from http://nces.ed.gov/pubsearch.
Content Contact
John Ralph (202) 502-7441 [email protected]

Acknowledgments
The authors would like to recognize the respondents from public school districts who provided data on the condition of public school facilities upon which the report is based.
iii

Contents
Page
Acknowledgments ....................................................................................................................... iii
List of Tables .............................................................................................................................. v
Introduction ................................................................................................................................. 1
Selected Findings ........................................................................................................................ 3
Tables .......................................................................................................................................... 5
References ................................................................................................................................... 21
Appendix A: Standard Error Tables ............................................................................................ A-1
Appendix B: Technical Notes ..................................................................................................... B-1
Appendix C: Questionnaire ......................................................................................................... C-1
iv
List of Tables
Table Page
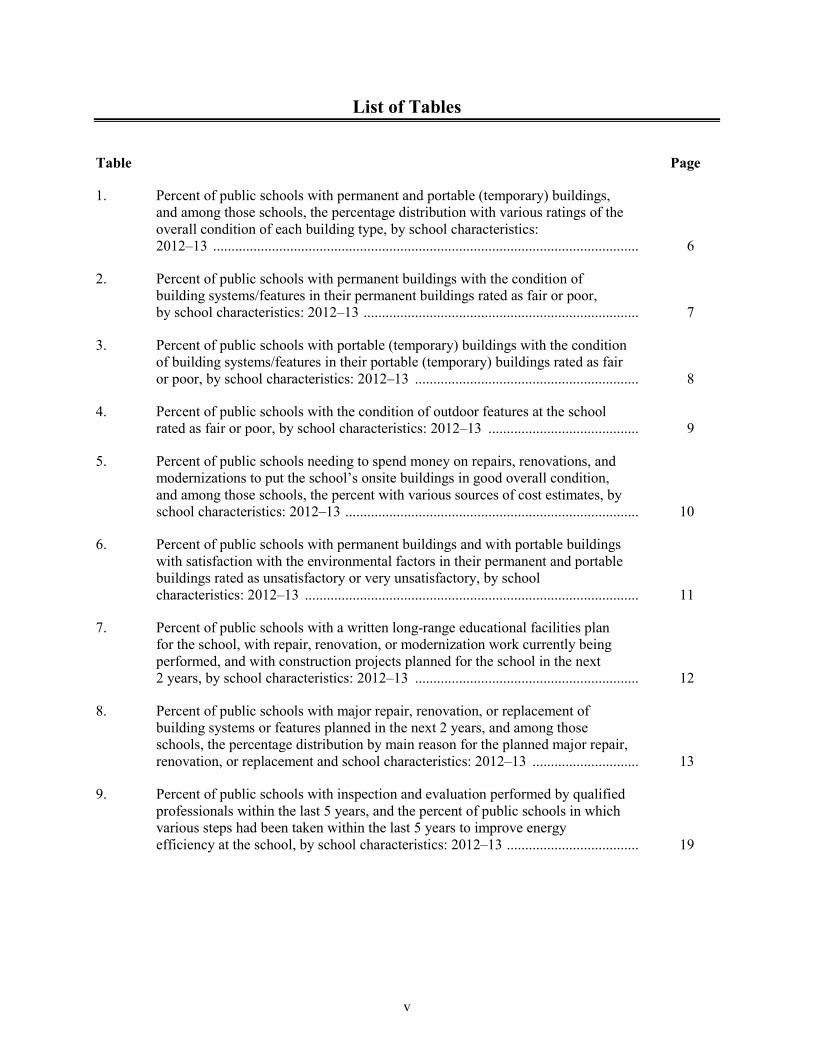
1. Percent of public schools with permanent and portable (temporary) buildings, and among those schools, the percentage distribution with various ratings of the overall condition of each building type, by school characteristics: 2012–13 .................................................................................................................... 6
2. Percent of public schools with permanent buildings with the condition of building systems/features in their permanent buildings rated as fair or poor, by school characteristics: 2012–13 ........................................................................... 7
3. Percent of public schools with portable (temporary) buildings with the condition of building systems/features in their portable (temporary) buildings rated as fair or poor, by school characteristics: 2012–13 ............................................................. 8
4. Percent of public schools with the condition of outdoor features at the school rated as fair or poor, by school characteristics: 2012–13 ......................................... 9
5. Percent of public schools needing to spend money on repairs, renovations, and modernizations to put the school’s onsite buildings in good overall condition, and among those schools, the percent with various sources of cost estimates, by school characteristics: 2012–13 ................................................................................ 10
6. Percent of public schools with permanent buildings and with portable buildings with satisfaction with the environmental factors in their permanent and portable buildings rated as unsatisfactory or very unsatisfactory, by school characteristics: 2012–13 ........................................................................................... 11
7. Percent of public schools with a written long-range educational facilities plan for the school, with repair, renovation, or modernization work currently being performed, and with construction projects planned for the school in the next 2 years, by school characteristics: 2012–13 ............................................................. 12
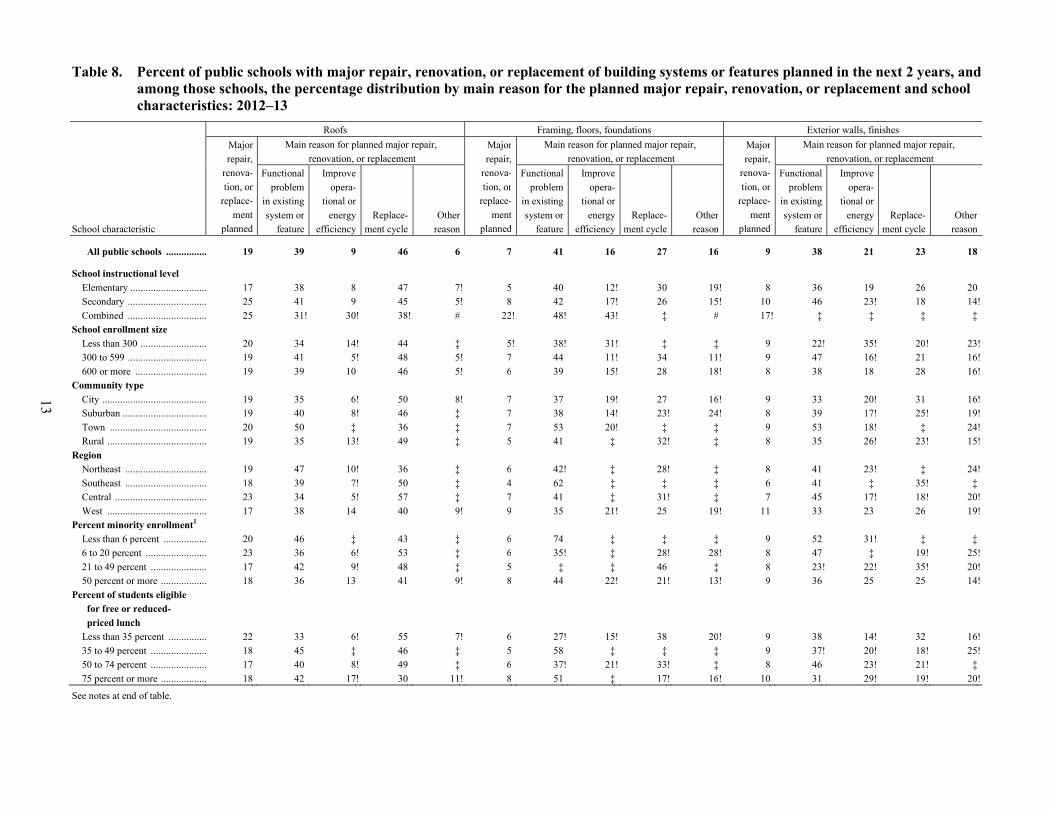
8. Percent of public schools with major repair, renovation, or replacement of building systems or features planned in the next 2 years, and among those schools, the percentage distribution by main reason for the planned major repair, renovation, or replacement and school characteristics: 2012–13 ............................. 13
9. Percent of public schools with inspection and evaluation performed by qualified professionals within the last 5 years, and the percent of public schools in which various steps had been taken within the last 5 years to improve energy efficiency at the school, by school characteristics: 2012–13 .................................... 19
v

Table Page
10. Among public schools, years since original construction of the main instructional building, years since the most recent major renovation of the main instructional building, years since the last major building replacement or addition at the school, functional age of the main instructional building, and the percentage distribution of public schools according to the functional age of the main instructional building, by school characteristics: 2012–13 ........................ 20
Appendix A Table
1a. Standard errors for the percent of public schools with permanent and portable (temporary) buildings, and among those schools, the percentage distribution with various ratings of the overall condition of each building type, by school characteristics: 2012–13 ........................................................................... A-2
2a. Standard errors for the percent of public schools with permanent buildings with the condition of building systems/features in their permanent buildings rated as fair or poor, by school characteristics: 2012–13 ....................................................... A-3
3a. Standard errors for the percent of public schools with portable (temporary) buildings with the condition of building systems/features in their portable (temporary) buildings rated as fair or poor, by school characteristics: 2012–13 ..... A-4
4a. Standard errors for the percent of public schools with the condition of outdoor features at the school rated as fair or poor, by school characteristics: 2012–13 ....... A-5
5a. Standard errors for the percent of public schools needing to spend money on repairs, renovations, and modernizations to put the school’s onsite buildings in good overall condition, and among those schools, the percent with various sources of cost estimates, by school characteristics: 2012–13 ................................. A-6
6a. Standard errors for the percent of public schools with permanent buildings and with portable buildings with satisfaction with the environmental factors in their permanent and portable buildings rated as unsatisfactory or very unsatisfactory, by school characteristics: 2012–13 ........................................................................... A-7
7a. Standard errors for the percent of public schools with a written long-range educational facilities plan for the school, with repair, renovation, or modernization work currently being performed, and with construction projects planned for the school in the next 2 years, by school characteristics: 2012–13 ....... A-8
8a. Standard errors for the percent of public schools with major repair, renovation, or replacement of building systems or features planned in the next 2 years, and among those schools, the percentage distribution by main reason for the planned major repair, renovation, or replacement, by school characteristics: 2012–13 ........ A-9
vi

Appendix A Table Page
9a. Standard errors for the percent of public schools with inspection and evaluation performed by qualified professionals within the last 5 years, and the percent of public schools in which various steps had been taken within the last 5 years to improve energy efficiency at the school, by school characteristics: 2012–13 .......... A-15
10a. Among public schools, standard errors for the years since original construction of the main instructional building, years since the most recent major renovation of the main instructional building, years since the last major building replacement or addition at the school, functional age of the main instructional building, and the percentage distribution of public schools according to the functional age of the main instructional building, by school characteristics: 2012–13 ..................................................................................................................... A-16
Appendix B Table
B-1. Number and percentage of responding public schools in the study sample, and estimated number and percentage of public schools the sample represents, by school characteristics: 2012–13 ............................................................................................. B-3
vii

Introduction
This report provides nationally representative data on the condition of public school facilities. The National Center for Education Statistics (NCES) previously collected data on this topic in 1999 (Lewis et al. 2000). The study presented in this report collected information about the condition of public school facilities in the 2012–13 school year. Specifically, the survey covered the following:
• Whether the school had permanent and portable (temporary) onsite buildings; • The condition of 17 building systems/features in the permanent and portable (temporary) onsite buildings;
• The condition of seven outdoor features at the school; • The overall condition of the permanent and portable (temporary) onsite buildings; • The estimated total cost of all repairs/renovations/modernizations required to put the school’s onsite
buildings in good overall condition, and the sources on which the cost estimate was based; • How satisfactory each of eight environmental factors was in the permanent and portable (temporary)
onsite buildings;
• The year in which the school’s main instructional building was constructed, the year of the last major renovation of the main instructional building, and the year of the last major building replacement or addition at the school;
• Whether any major repair/renovation/modernization work was currently being performed at the school;
• Whether various construction projects were planned for the school in the next 2 years; • Which of 17 building systems/features at the school, if any, had major repairs, renovations, or
replacements planned for the next 2 years, and if work was planned, the main reason for the planned major repair, renovation, or replacement;
• Whether there was a written long-range educational facilities plan1 for the school; • Whether inspection of the condition of the physical features of the facility and evaluations of energy use
and indoor environmental hazards at the school had been performed by qualified professionals within the last 5 years; and
• Whether various steps had been taken in the last 5 years to improve energy efficiency at the school. NCES, in the Institute of Education Sciences, conducted this survey in spring 2013 using the Fast Response Survey System (FRSS). FRSS is a survey system designed to collect small amounts of issue-oriented data from a nationally representative sample of districts, schools, or teachers with minimal burden on respondents and within a relatively short period of time. The survey on the condition of public school facilities was mailed to the school districts of approximately 1,800 public schools in the 50 states and the District of Columbia. While individual schools were sampled, the questionnaires were mailed to the districts with which the schools were associated. A separate questionnaire was enclosed for each sampled school. The cover letter indicated that the survey was designed to be completed by district-level personnel who were very familiar with the school facilities in the district. Often this was a district facilities coordinator. The letter indicated that the respondent might want to consult with other district-level personnel or with school-level personnel, such as the principal of the sampled school, in answering some of the questions. Respondents were offered the option of completing the survey via the Web. The unweighted survey response rate was 90 percent and the weighted response rate using the initial base weights was also 90 percent. The survey weights were adjusted for questionnaire nonresponse and the data were then weighted to yield national estimates that represent all eligible public schools in the United States.
1 Terms used in the report are presented in appendix B.
1

Because the purpose of this report is to introduce new NCES data from the survey through the presentation of tables containing descriptive information, only selected national findings are presented. These findings have been chosen to demonstrate the range of information available from the FRSS study rather than to discuss all of the data collected; they are not meant to emphasize any particular issue. Readers are cautioned not to make causal inferences about the data presented here. The findings are based on self-reported data from public schools and school districts. Many of the variables examined are related to one another, and complex interactions and relationships have not been explored.
Tables of standard error estimates are provided in appendix A. See the technical notes (appendix B) for detailed information about the survey methodology. Appendix B also includes definitions of the analysis variables (i.e., school characteristics) and rating scales and terms used in the report. The questionnaire is located in appendix C.
2

Selected Findings
This section presents selected findings based on survey responses on the condition of public school facilities in the 2012–13 school year.2
• Based on survey responses, almost all (99 percent) of the schools had permanent buildings, and 31 percent had portable (temporary) buildings (table 1). Among schools with permanent buildings, the overall condition of about three-quarters of the permanent buildings was described as excellent (20 percent) or good (56 percent); 21 percent were in fair condition, and 3 percent were in poor condition. Among schools with portable buildings, overall condition was excellent in 6 percent, good in 49 percent, fair in 36 percent, and poor in 9 percent.
• Among public schools with permanent buildings, the building systems/features were rated as being in fair or poor condition in their permanent buildings in 14 to 32 percent of the schools:3 windows (32 percent); plumbing/lavatories (31 percent); heating system, air conditioning system, and ventilation/filtration system (30 percent each); energy management system, security systems, and exterior lighting (29 percent each); roofs, interior finishes/trim, and internal communication systems (25 percent each); electrical system (22 percent); technology infrastructure (21 percent); interior lighting and life safety features (19 percent each); exterior walls/finishes (18 percent); and framing, floors, and foundations (14 percent) (table 2).
• Among public schools with portable (temporary) buildings, the building systems/features were rated as being in fair or poor condition in their portable buildings in 29 to 45 percent of the schools:4 windows and exterior lighting (45 percent each); interior finishes/trim (43 percent); roofs and exterior walls/finishes (42 percent each); framing, floors, and foundations (41 percent); ventilation/filtration system, and energy management system (41 percent each); security systems (40 percent); plumbing/lavatories and air conditioning systems (37 percent each); heating systems (36 percent); internal communication systems and technology infrastructure (33 percent each); electrical system and interior lighting (30 percent each); and life safety features (29 percent) (table 3).
• The condition of the following outdoor features was rated as fair or poor in public schools that had that feature: school parking lots and roadways (36 percent); fencing (32 percent); bus lanes and drop-off areas (31 percent); outdoor athletic facilities (31 percent); covered walkways (28 percent); school sidewalks and walkways (27 percent); and outdoor play areas/playgrounds (27 percent) (table 4).
• Based on survey responses, 53 percent of public schools needed to spend money on repairs, renovations, and modernizations to put the school’s onsite buildings in good overall condition (table 5). The total amount needed was estimated to be approximately $197 billion, and the average dollar amount for schools needing to spend money was about $4.5 million per school (not shown in tables).5 Among schools needing to spend, the cost estimate was based on the best professional judgment of the survey respondent in 57 percent of the schools; on facilities inspection(s)/assessment(s) performed within the last 3 years by licensed professionals in 44 percent of the schools; and on a capital improvement/facilities master plan, schedule, or budget in 42 percent of the schools (table 5).
• Among public schools with permanent buildings, the environmental factors in permanent buildings were rated as unsatisfactory or very unsatisfactory in 5 to 17 percent of schools6 (table 6). Among public
2 Rating scales and terms used in the report are presented in appendix B. 3 Percentages are based on schools with that building system/feature in their permanent buildings. 4 Percentages are based on schools with that building system/feature in their portable (temporary) buildings. 5 These estimates are based on the survey question that asked for the estimated total cost of all repairs/renovations/modernizations required to put the school’s onsite buildings in good overall condition. The standard error for the total amount needed was $12 billion, and the standard error for the average dollar amount for schools needing to spend money was $264,000. Data are not shown in the table broken out by school characteristics because totals (sums) are affected by the number of cases in an analysis group, and totals and average dollars are heavily influenced by some very large (but verified as correct) estimated costs. 6 Percentages are based on schools with that environmental factor in their permanent buildings.
3

schools with portable buildings, ratings of unsatisfactory or very unsatisfactory were reported for the environmental factors in portable buildings in 10 to 28 percent of the schools.7
• Sixty percent of public schools were reported to have a written long-range educational facilities plan (table 7). Seventeen percent of public schools had major repairs, renovations, or modernization work currently being performed at the school, and 39 percent had major repairs/renovations/ modernization work planned for the school in the next two years.
• Respondents indicated whether there were major repair, renovation, or replacement of various building systems or features planned for the school in the next 2 years, and if so, the main reason for such plans. Among schools with the building system/feature, 21 percent had plans for major repair, renovation, or replacement of security systems, and 20 percent had plans for such work on technology infrastructure (table 8). Improved operational or energy efficiency was cited as the main reason for the work in 46 percent of those with planned work on security systems, and in 51 percent of those with planned work on technology infrastructure. Nineteen percent of schools had plans for major repair, renovation, or replacement of roofs, and among these schools, 46 percent had replacement cycle cited as the main reason. Major repair, renovation, or replacement of the remaining building systems/features was planned in 7 to 16 percent of public schools with that system/feature.
• Based on survey responses, the following types of inspections and evaluations were performed at public schools by qualified professionals within the last 5 years: inspection of the condition of the physical features of the facility (83 percent), evaluation of indoor environmental hazards (80 percent), and evaluation of energy use (72 percent) (table 9). The following steps had been taken within the last 5 years to improve energy efficiency: replaced lighting fixtures, lighting ballast, or bulbs (65 percent), installed motion sensors for lighting (35 percent), installed or upgraded an energy management system (34 percent), installed more efficient HVAC systems (31 percent), replaced windows and/or doors (25 percent), installed or upgraded a reflective roof coating (19 percent), and upgraded insulation, outer walls, and/or siding (building envelopes) (14 percent).
• The average of the reported number of years since the construction of the main instructional building was 44 years (table 10). Among schools with major renovation of the main instructional building, the renovation occurred on average 12 years ago. Among schools with major building replacement or addition, the replacement or addition occurred on average 16 years ago. The average functional age8 of the main instructional building was 19 years.
7 Percentages are based on schools with that environmental factor in their portable buildings. 8 Functional age is defined as the age of the school based on the year of the most recent major renovation or the year of construction of the main instructional building if no renovation has occurred.
4

Tables
5

6
Table 1. Percent of public schools with permanent and portable (temporary) buildings, and among those schools, the percentage distribution with various ratings of the overall condition of each building type, by school characteristics: 2012–13
School characteristic
Permanent buildings Portable (temporary) buildings
Schools with permanent buildings
Overall condition Schools with portable
(temporary) buildings
Overall condition
Excellent Good Fair Poor Excellent Good Fair Poor
All public schools ....................................... 99 20 56 21 3 31 6 49 36 9
School instructional level Elementary .................................................... 99 20 57 21 3 33 6 49 36 9 Secondary ..................................................... 100 2 20 57 20 2 ! 24 5 ! 46 43 7 ! Combined ..................................................... 100 15 ! 44 38 ‡ 29 ‡ 56 ‡ ‡ School enrollment size Less than 300 ................................................ 98 14 53 28 5 ! 20 ‡ 44 39 13 ! 300 to 599 ..................................................... 100 2 20 57 21 3 27 6 ! 45 39 10 600 or more .................................................. 100 25 58 17 1 ! 43 7 54 33 6 Community type City ............................................................... 99 17 55 23 5 40 4 ! 53 34 8 ! Suburban ....................................................... 100 2 23 56 20 ‡ 32 5 ! 51 38 6 ! Town ............................................................ 99 18 57 23 ‡ 27 10 ! 43 38 9 ! Rural ............................................................. 100 2 20 57 20 2 ! 25 7 ! 44 36 13 Region Northeast ...................................................... 100 16 61 20 3 ! 12 ‡ 60 25 ‡ Southeast ...................................................... 99 25 54 18 3 ! 36 ‡ 45 41 10 ! Central .......................................................... 100 20 58 20 2 ! 11 ‡ 25 ! 50 ‡ West ............................................................. 99 19 54 24 3 ! 51 6 53 33 7 Percent minority enrollment1
Less than 6 percent ....................................... 100 17 58 23 ‡ 13 ‡ 34 ! 36 ! 24 ! 6 to 20 percent .............................................. 100 2 20 60 18 2 ! 17 ‡ 37 43 14 ! 21 to 49 percent ............................................ 100 24 55 19 ‡ 32 6 ! 52 34 8 ! 50 percent or more ........................................ 99 19 54 23 3 45 6 52 36 6 Percent of students eligible for free or reduced-priced lunch Less than 35 percent ..................................... 100 2 24 56 18 2 ! 25 8 ! 51 29 12 35 to 49 percent ............................................ 99 18 63 17 2 ! 30 7 ! 53 36 ‡ 50 to 74 percent ............................................ 100 20 56 22 2 ! 31 4 ! 45 41 10 ! 75 percent or more ........................................ 98 16 52 28 4 39 5 ! 48 38 8 ! ! Interpret data with caution; the coefficient of variation is greater than or equal to 30 percent. ‡ Reporting standards not met. The coefficient of variation for this estimate is 50 percent or greater or the sample size is less than 3. 1 Minority enrollment includes Hispanic, Asian, Native Hawaiian/Pacific Islander, American Indian/Alaska Native, and students of two or more races. 2 Rounds to 100 percent. NOTE: Respondents were presented the following definitions. Excellent means that the facility meets all the reasonable needs for normal school performance yet goes well beyond adequate. Relatively minor enhancements may be necessary. Good means that the facility meets all the reasonable needs for normal school performance, is most often in good condition, and generally meets some, but not all, of the characteristics of an excellent facility. Fair means that the facility meets minimal needs for normal school performance but requires frequent maintenance or has other limitations. It requires some upgrading to be considered in good condition. Poor means that the facility does not meet minimal requirements for normal school performance. Details may not sum to totals because of rounding. SOURCE: U.S. Department of Education, National Center for Education Statistics, Fast Response Survey System (FRSS), “Condition of Public School Facilities: 2012–13,” FRSS 105, 2013.

7
Table 2. Percent of public schools with permanent buildings with the condition of building systems/features in their permanent buildings rated as fair or poor, by school characteristics: 2012–13
School characteristic Roofs
Framing, floors, foun-
dations
Exterior walls,
finishes
Win-dows, doors
Interior finishes,
trim
Plumb-ing/
lava-tories
Heating system
Air condi-
tioning system
Venti-lation/
filtration system
Elec-trical
system Interior lighting
Exterior lighting
Energy manage-
ment system
Life safety
features1 Security systems
Internal commu-nication systems
Tech-nology
infra-structure
All public schools ................... 25 14 18 32 25 31 30 30 30 22 19 29 29 19 29 25 21
School instructional level Elementary ................................. 26 14 17 31 24 30 30 30 29 22 20 30 29 19 29 25 22 Secondary .................................. 24 12 18 35 27 34 31 33 30 22 16 26 30 18 29 24 17 Combined .................................. 31 27 32 38 39 41 29 27 37 28 30 39 41 25 40 27 19 ! School enrollment size Less than 300 ............................. 31 19 25 43 32 43 42 38 38 31 25 39 45 27 41 34 30 300 to 599 .................................. 23 13 16 32 26 32 28 30 30 22 20 29 28 18 28 26 20 600 or more ............................... 24 12 15 26 20 23 24 26 24 16 14 22 22 14 23 17 16 Community type City ............................................ 27 16 19 35 29 34 31 33 31 22 21 30 28 17 25 23 20 Suburban .................................... 28 11 15 29 22 26 26 27 27 20 19 26 22 15 23 21 19 Town ......................................... 28 16 21 37 30 36 34 37 36 25 23 34 37 19 38 30 23 Rural .......................................... 21 15 18 31 24 32 31 29 28 23 18 29 34 22 34 26 22 Region Northeast ................................... 26 14 17 31 25 28 29 32 34 26 20 26 31 16 27 28 22 Southeast ................................... 22 12 13 30 20 26 24 29 28 18 19 28 26 17 22 17 16 Central ....................................... 27 13 15 31 25 37 32 31 29 22 16 31 31 18 34 28 21 West .......................................... 26 16 23 36 30 32 33 30 29 23 22 31 30 21 31 25 22 Percent minority enrollment2
Less than 6 percent .................... 25 17 19 36 26 37 38 36 33 30 24 31 35 20 34 30 21 6 to 20 percent ........................... 27 13 17 33 24 33 30 28 30 21 15 29 31 19 36 25 22 21 to 49 percent ......................... 23 11 15 29 21 28 26 28 27 20 17 26 27 16 24 20 18 50 percent or more ..................... 26 15 20 33 29 31 30 32 30 22 22 31 28 19 26 25 21 Percent of students eligible for free or reduced- priced lunch Less than 35 percent .................. 25 11 17 28 23 27 27 25 27 21 17 26 25 15 27 25 23 35 to 49 percent ......................... 22 12 12 31 18 33 29 32 28 20 16 28 30 16 29 20 17 50 to 74 percent ......................... 22 14 18 34 28 33 31 32 30 22 20 30 32 19 34 25 21 75 percent or more ..................... 32 20 23 37 31 33 34 34 33 24 24 33 32 24 26 28 21 ! Interpret data with caution; the coefficient of variation is greater than or equal to 30 percent. 1 “Life safety features” includes sprinklers, fire alarms, and smoke detectors. 2 Minority enrollment includes Hispanic, Asian, Native Hawaiian/Pacific Islander, American Indian/Alaska Native, and students of two or more races. NOTE: Respondents were provided the following definitions. Excellent means that a particular feature or system meets all the reasonable needs of the school pertaining to that item yet goes well beyond adequate. Relatively minor enhancements may be necessary. Good means a feature or system meets all the reasonable needs of the school, is most often in good condition, and generally meets some, but not all, of the characteristics of an excellent system/feature. Fair means that a feature or system meets minimal conditions but is not dependable, breaks down frequently, or has other limitations. It is a feature or system that would require some upgrading to be considered in good condition. Poor means that a particular feature or system as it exists is inadequate to meet even the minimal needs of the school. This table presents combined data for ratings of fair and poor. percentages are based on schools with that building system/feature in their permanent buildings. SOURCE: U.S. Department of Education, National Center for Education Statistics, Fast Response Survey System (FRSS), “Condition of Public School Facilities: 2012–13,” FRSS 105, 2013.

8
Table 3. Percent of public schools with portable (temporary) buildings with the condition of building systems/features in their portable (temporary) buildings rated as fair or poor, by school characteristics: 2012–13
School characteristic Roofs
Framing, floors, foun-
dations
Exterior walls,
finishes
Win-dows, doors
Interior finishes,
trim
Plumb-ing/
lava-tories
Heating system
Air condi-
tioning system
Venti-lation/
filtration system
Elec-trical
system Interior lighting
Exterior lighting
Energy manage-
ment system
Life safety
features1 Security systems
Internal commu-nication systems
Tech-nology
infra-structure
All public schools ................... 42 41 42 45 43 37 36 37 41 30 30 45 41 29 40 33 33
School instructional level Elementary ................................. 43 41 43 45 43 36 35 36 42 31 31 45 41 28 40 33 33 Secondary .................................. 41 42 43 49 46 41 40 42 42 27 26 46 45 31 40 33 32 Combined .................................. ‡ ‡ ‡ ‡ 27 ! ‡ ‡ ‡ ‡ ‡ ‡ 34 ! 26 ! 37 ! 42 ! ‡ ‡ School enrollment size Less than 300 ............................. 54 48 47 56 45 53 41 45 56 38 39 58 72 56 65 53 49 300 to 599 .................................. 45 44 48 53 46 38 39 40 50 34 36 47 37 22 38 31 35 600 or more ............................... 36 35 36 36 41 30 31 32 30 24 23 40 35 26 33 29 26 Community type City ............................................ 39 43 42 44 42 35 33 35 37 29 29 40 38 27 34 31 32 Suburban .................................... 44 33 41 40 44 35 38 40 43 29 30 47 33 24 31 29 25 Town ......................................... 39 45 40 51 41 31 ! 30 33 43 21 22 37 44 24 ! 47 30 38 Rural .......................................... 45 44 44 49 45 44 38 38 44 35 36 54 58 39 55 43 40 Region Northeast ................................... 53 41 51 47 58 43 ! 44 46 43 40 38 53 49 31 ! 45 42 31 ! Southeast ................................... 46 47 45 49 47 44 40 42 49 39 38 52 54 33 47 34 42 Central ....................................... 43 50 52 64 42 35 41 41 51 37 31 39 30 ! 16 ! 45 ! 31 ! 34 ! West .......................................... 39 36 38 40 40 33 32 32 36 23 25 42 36 28 36 32 29 Percent minority enrollment2
Less than 6 percent .................... 60 62 67 81 56 52 ! 66 66 70 63 63 79 83 54 ! 79 66 58 6 to 20 percent ........................... 41 38 43 51 50 50 40 41 52 34 33 53 52 40 60 36 37 21 to 49 percent ......................... 45 40 41 43 44 32 38 40 42 30 27 44 39 22 40 24 30 50 percent or more ..................... 40 40 40 41 40 35 31 32 36 26 28 42 37 27 33 34 31 Percent of students eligible for free or reduced- priced lunch Less than 35 percent .................. 41 34 41 42 48 39 38 41 41 32 31 45 39 27 37 27 31 35 to 49 percent ......................... 32 38 43 39 33 27 29 31 38 28 23 41 43 27 40 27 31 50 to 74 percent ......................... 46 43 39 49 44 44 41 39 46 28 33 49 48 31 53 35 40 75 percent or more ..................... 47 46 45 47 45 35 33 35 38 31 31 45 37 30 32 41 28 ! Interpret data with caution; the coefficient of variation is greater than or equal to 30 percent. ‡ Reporting standards not met. The coefficient of variation for this estimate is 50 percent or greater or the sample size is less than 3. 1 “Life safety features” includes sprinklers, fire alarms, and smoke detectors. 2 Minority enrollment includes Hispanic, Asian, Native Hawaiian/Pacific Islander, American Indian/Alaska Native, and students of two or more races. NOTE: Respondents were provided the following definitions. Excellent means that a particular feature or system meets all the reasonable needs of the school pertaining to that item yet goes well beyond adequate. Relatively minor enhancements may be necessary. Good means a feature or system meets all the reasonable needs of the school, is most often in good condition, and generally meets some, but not all, of the characteristics of an excellent system/feature. Fair means that a feature or system meets minimal conditions but is not dependable, breaks down frequently, or has other limitations. It is a feature or system that would require some upgrading to be considered in good condition. Poor means that a particular feature or system as it exists is inadequate to meet even the minimal needs of the school. This table presents combined data for ratings of fair and poor. percentages are based on schools with that building system/feature in their portable (temporary) buildings. SOURCE: U.S. Department of Education, National Center for Education Statistics, Fast Response Survey System (FRSS), “Condition of Public School Facilities: 2012–13,” FRSS 105, 2013.

9
Table 4. Percent of public schools with the condition of outdoor features at the school rated as fair or poor, by school characteristics: 2012–13
School characteristic
School parking lots and
roadways Bus lanes and drop-off areas
School sidewalks
and walkways
Outdoor play areas/
playgrounds
Outdoor athletic
facilities Covered
walkways Fencing
All public schools ...................................................................................................... 36 31 27 27 31 28 32
School instructional level Elementary .................................................................................................................... 35 30 26 27 32 27 31 Secondary ..................................................................................................................... 36 32 26 29 28 29 33 Combined ..................................................................................................................... 45 46 43 39 42 32 42 School enrollment size Less than 300 ................................................................................................................ 49 42 35 38 44 44 43 300 to 599 ..................................................................................................................... 34 30 26 26 32 26 32 600 or more .................................................................................................................. 28 25 21 22 22 22 25 Community type City ............................................................................................................................... 34 30 28 27 31 24 32 Suburban ....................................................................................................................... 33 29 22 24 30 24 29 Town ............................................................................................................................ 34 31 29 31 35 33 30 Rural ............................................................................................................................. 40 33 28 28 31 32 34 Region Northeast ...................................................................................................................... 38 27 27 23 28 25 39 Southeast ...................................................................................................................... 31 27 24 27 31 23 30 Central .......................................................................................................................... 39 34 28 28 34 37 35 West ............................................................................................................................. 36 33 27 29 32 29 27 Percent minority enrollment1
Less than 6 percent ....................................................................................................... 44 36 33 33 42 44 44 6 to 20 percent .............................................................................................................. 35 29 25 26 29 28 32 21 to 49 percent ............................................................................................................ 37 32 24 21 26 26 30 50 percent or more ........................................................................................................ 33 29 27 30 33 25 30 Percent of students eligible for free or reduced-priced lunch Less than 35 percent ..................................................................................................... 33 28 23 25 27 27 31 35 to 49 percent ............................................................................................................ 32 30 22 21 25 26 21 50 to 74 percent ............................................................................................................ 38 33 31 29 35 32 39 75 percent or more ........................................................................................................ 39 33 29 34 39 25 33 1 Minority enrollment includes Hispanic, Asian, Native Hawaiian/Pacific Islander, American Indian/Alaska Native, and students of two or more races. NOTE: Respondents were provided the following definitions. Excellent means that a particular feature or system meets all the reasonable needs of the school pertaining to that item yet goes well beyond adequate. Relatively minor enhancements may be necessary. Good means a feature or system meets all the reasonable needs of the school, is most often in good condition, and generally meets some, but not all, of the characteristics of an excellent system/feature. Fair means that a feature or system meets minimal conditions but is not dependable, breaks down frequently, or has other limitations. It is a feature or system that would require some upgrading to be considered in good condition. Poor means that a particular feature or system as it exists is inadequate to meet even the minimal needs of the school. This table presents combined data for ratings of fair and poor. percentages are based on schools with that outdoor feature. SOURCE: U.S. Department of Education, National Center for Education Statistics, Fast Response Survey System (FRSS), “Condition of Public School Facilities: 2012–13,” FRSS 105, 2013.

10
Table 5. Percent of public schools needing to spend money on repairs, renovations, and modernizations to put the school’s onsite buildings in good overall condition, and among those schools, the percent with various sources of cost estimates, by school characteristics: 2012–13
School characteristic
Percent of schools
reporting needing to spend
Source of cost estimate was: Facilities
inspection(s)/ assessment(s)
performed within the last 3 years
by licensed professionals
Repair/ renovation/
modernization work already
being performed and/or
contracted for
Capital improvement/
facilities master plan,
schedule, or budget
Best professional
judgment
Opinions of other district
or school administrators
Other sources1
All public schools ...................................................................................................... 53 44 25 42 57 17 11
School instructional level Elementary .................................................................................................................... 52 43 22 41 56 17 12 Secondary ..................................................................................................................... 52 50 33 46 59 15 8 Combined ..................................................................................................................... 67 40 34 34 71 29 ! ‡ School enrollment size Less than 300 ................................................................................................................ 65 46 26 33 62 16 6 ! 300 to 599 ..................................................................................................................... 51 46 22 43 54 18 13 600 or more .................................................................................................................. 46 41 29 50 56 16 13 Community type City ............................................................................................................................... 54 35 22 39 55 16 10 Suburban ....................................................................................................................... 49 51 25 53 54 20 16 Town ............................................................................................................................ 55 43 21 46 54 20 14 Rural ............................................................................................................................. 53 48 29 35 62 15 6 Region Northeast ...................................................................................................................... 49 44 23 42 56 16 15 Southeast ...................................................................................................................... 45 46 30 50 54 14 9 ! Central .......................................................................................................................... 53 50 28 42 63 18 7 ! West ............................................................................................................................. 59 40 21 38 55 18 12 Percent minority enrollment2
Less than 6 percent ....................................................................................................... 52 51 34 39 63 11 ! ‡ 6 to 20 percent .............................................................................................................. 51 47 23 39 55 16 13 21 to 49 percent ............................................................................................................ 50 49 28 48 62 21 11 50 percent or more ........................................................................................................ 55 38 22 42 54 17 12 Percent of students eligible for free or reduced-priced lunch Less than 35 percent ..................................................................................................... 48 42 21 44 53 12 14 35 to 49 percent ............................................................................................................ 51 55 28 41 62 21 8 ! 50 to 74 percent ............................................................................................................ 52 50 27 44 57 19 8 75 percent or more ........................................................................................................ 60 35 26 39 58 17 12 ! Interpret data with caution; the coefficient of variation is greater than or equal to 30 percent. ‡ Reporting standards not met. The coefficient of variation for this estimate is 50 percent or greater or the sample size is less than 3. 1 Examples of other sources include information from past projects of the same magnitude, and insurance carrier/current industry costs. 2 Minority enrollment includes Hispanic, Asian, Native Hawaiian/Pacific Islander, American Indian/Alaska Native, and students of two or more races. SOURCE: U.S. Department of Education, National Center for Education Statistics, Fast Response Survey System (FRSS), “Condition of Public School Facilities: 2012–13,” FRSS 105, 2013.

11
Table 6. Percent of public schools with permanent buildings and with portable buildings with satisfaction with the environmental factors in their permanent and portable buildings rated as unsatisfactory or very unsatisfactory, by school characteristics: 2012–13
School characteristic
Permanent buildings1 Portable buildings2
Arti-ficial
lighting Natural lighting Heating
Air condi-
tioning Venti-lation
Indoor air
quality Water
quality
Acou-stics or
noise control
Arti-ficial
lighting Natural lighting Heating
Air condi-
tioning Venti-lation
Indoor air
quality Water
quality
Acou-stics or
noise control
All public schools ................................... 8 16 14 17 17 9 5 14 11 28 12 15 19 16 10 21
School instructional level Elementary ................................................. 8 17 13 16 16 9 5 14 11 29 11 16 19 17 10 21 Secondary .................................................. 7 16 16 20 16 9 6 12 12 28 16 14 22 14 8 ! 21 Combined .................................................. ‡ 15 ! 20 ! 21 ! 28 13 ! 16 ! 25 # ‡ # ‡ ‡ # ‡ ‡ School enrollment size Less than 300 ............................................. 11 21 19 24 25 14 9 20 14 ! 28 18 ! 18 ! 26 21 19 ! 28 300 to 599 .................................................. 9 15 15 18 17 9 6 13 17 33 15 21 25 19 10 ! 23 600 or more ............................................... 4 15 9 13 11 6 3 10 5 25 7 10 13 12 6 ! 17 Community type City ............................................................ 9 16 16 21 18 11 6 14 10 26 11 15 18 17 7 ! 19 Suburban .................................................... 7 15 10 13 12 4 3 10 6 ! 26 7 ! 12 14 11 7 ! 17 Town ......................................................... 8 20 14 18 16 7 ! 5 ! 15 14 ! 41 17 ! 14 ! 26 18 ! 16 ! 24 ! Rural .......................................................... 9 16 14 17 20 12 7 16 15 28 16 18 24 19 14 ! 26 Region Northeast ................................................... 10 12 15 22 18 9 5 ! 13 ‡ 22 ! ‡ ‡ ‡ ‡ ‡ ‡ Southeast ................................................... 10 16 9 12 14 9 4 ! 13 16 26 14 17 22 20 13 ! 22 Central ....................................................... 5 10 14 20 16 9 5 13 14 ! 25 ! 15 ! ‡ 24 ! 15 ! ‡ 17 ! West .......................................................... 8 24 15 16 18 9 8 15 8 31 10 14 18 14 7 22 Percent minority enrollment3
Less than 6 percent .................................... 11 12 18 26 18 13 5 ! 14 28 ! 36 ! 31 ! 33 ! 36 ! 33 ! ‡ 31 ! 6 to 20 percent ........................................... 8 17 15 16 18 9 6 15 ‡ 31 17 ! 17 ! 27 13 ! ‡ 26 21 to 49 percent ......................................... 5 15 10 13 15 7 4 10 9 ! 24 8 ! 9 ! 19 14 7 ! 11 ! 50 percent or more ..................................... 9 19 14 18 16 8 6 15 10 29 11 15 16 16 11 23 Percent of students eligible for free or reduced-priced lunch Less than 35 percent .................................. 6 14 12 17 15 7 4 12 10 ! 26 13 17 18 14 9 ! 19 35 to 49 percent ......................................... 7 17 14 16 16 9 5 13 8 ! 28 8 ! 13 ! 18 ! 15 ! ‡ 11 ! 50 to 74 percent ......................................... 8 17 14 15 16 11 6 13 12 29 15 16 23 19 11 ! 26 75 percent or more ..................................... 11 19 15 19 20 10 7 17 12 30 10 14 18 16 14 23 # Rounds to zero. ! Interpret data with caution; the coefficient of variation is greater than or equal to 30 percent. ‡ Reporting standards not met. The coefficient of variation for this estimate is 50 percent or greater or the sample size is less than 3. 1 Based on schools with environmental factor in their permanent buildings. 2 Based on schools with environmental factor in their portable (temporary) buildings. 3 Minority enrollment includes Hispanic, Asian, Native Hawaiian/Pacific Islander, American Indian/Alaska Native, and students of two or more races. NOTE: Based on schools with that environmental factor in their permanent and portable buildings. SOURCE: U.S. Department of Education, National Center for Education Statistics, Fast Response Survey System (FRSS), “Condition of Public School Facilities: 2012–13,” FRSS 105, 2013.

12
Table 7. Percent of public schools with a written long-range educational facilities plan for the school, with repair, renovation, or modernization work currently being performed, and with construction projects planned for the school in the next 2 years, by school characteristics: 2012–13
School characteristic School has long-range written facilities plan
Major repairs, renovations, or modernization work
currently being performed
Construction projects planned
Build new permanent buildings/additions
Major repairs/renovations/ modernization of existing
permanent buildings
All public schools ................................................................................................................ 60 17 9 39
School instructional level Elementary .............................................................................................................................. 60 15 8 37 Secondary ............................................................................................................................... 61 21 11 45 Combined ............................................................................................................................... 54 26 24 52 School enrollment size Less than 300 .......................................................................................................................... 47 15 9 41 300 to 599 ............................................................................................................................... 62 16 10 41 600 or more ............................................................................................................................ 67 18 8 35 Community type City ......................................................................................................................................... 63 18 8 39 Suburban ................................................................................................................................. 68 17 7 39 Town ...................................................................................................................................... 59 19 12 41 Rural ....................................................................................................................................... 52 14 10 38 Region Northeast ................................................................................................................................ 70 17 5 ! 42 Southeast ................................................................................................................................ 62 13 10 31 Central .................................................................................................................................... 54 18 9 45 West ....................................................................................................................................... 58 18 11 38 Percent minority enrollment1
Less than 6 percent ................................................................................................................. 53 11 6 ! 43 6 to 20 percent ........................................................................................................................ 59 18 10 38 21 to 49 percent ...................................................................................................................... 60 18 9 38 50 percent or more .................................................................................................................. 63 17 9 38 Percent of students eligible for free or reduced-priced lunch Less than 35 percent ............................................................................................................... 66 19 8 42 35 to 49 percent ...................................................................................................................... 58 15 10 38 50 to 74 percent ...................................................................................................................... 58 17 10 36 75 percent or more .................................................................................................................. 56 15 9 39 ! Interpret data with caution; the coefficient of variation is greater than or equal to 30 percent. 1 Minority enrollment includes Hispanic, Asian, Native Hawaiian/Pacific Islander, American Indian/Alaska Native, and students of two or more races. SOURCE: U.S. Department of Education, National Center for Education Statistics, Fast Response Survey System (FRSS), “Condition of Public School Facilities: 2012–13,” FRSS 105, 2013.
13
Table 8. Percent of public schools with major repair, renovation, or replacement of building systems or features planned in the next 2 years, and among those schools, the percentage distribution by main reason for the planned major repair, renovation, or replacement and school characteristics: 2012–13
School characteristic
Roofs Framing, floors, foundations Exterior walls, finishes Major repair,
renova-tion, or
replace-ment
planned
Main reason for planned major repair, renovation, or replacement
Major repair,
renova-tion, or
replace-ment
planned
Main reason for planned major repair, renovation, or replacement
Major repair,
renova-tion, or
replace-ment
planned
Main reason for planned major repair, renovation, or replacement
Functional problem
in existing system or
feature
Improve opera-
tional or energy
efficiency Replace-
ment cycle Other
reason
Functional problem
in existing system or
feature
Improve opera-
tional or energy
efficiency Replace-
ment cycle Other
reason
Functional problem
in existing system or
feature
Improve opera-
tional or energy
efficiency Replace-
ment cycle Other
reason
All public schools ................ 19 39 9 46 6 7 41 16 27 16 9 38 21 23 18
School instructional level Elementary .............................. 17 38 8 47 7 ! 5 40 12 ! 30 19 ! 8 36 19 26 20 Secondary ............................... 25 41 9 45 5 ! 8 42 17 ! 26 15 ! 10 46 23 ! 18 14 ! Combined ............................... 25 31 ! 30 ! 38 ! # 22 ! 48 ! 43 ! ‡ # 17 ! ‡ ‡ ‡ ‡ School enrollment size Less than 300 .......................... 20 34 14 ! 44 ‡ 5 ! 38 ! 31 ! ‡ ‡ 9 22 ! 35 ! 20 ! 23 ! 300 to 599 ............................... 19 41 5 ! 48 5 ! 7 44 11 ! 34 11 ! 9 47 16 ! 21 16 ! 600 or more ............................ 19 39 10 46 5 ! 6 39 15 ! 28 18 ! 8 38 18 28 16 ! Community type City ......................................... 19 35 6 ! 50 8 ! 7 37 19 ! 27 16 ! 9 33 20 ! 31 16 ! Suburban ................................. 19 40 8 ! 46 ‡ 7 38 14 ! 23 ! 24 ! 8 39 17 ! 25 ! 19 ! Town ...................................... 20 50 ‡ 36 ‡ 7 53 20 ! ‡ ‡ 9 53 18 ! ‡ 24 ! Rural ....................................... 19 35 13 ! 49 ‡ 5 41 ‡ 32 ! ‡ 8 35 26 ! 23 ! 15 ! Region Northeast ................................ 19 47 10 ! 36 ‡ 6 42 ! ‡ 28 ! ‡ 8 41 23 ! ‡ 24 ! Southeast ................................ 18 39 7 ! 50 ‡ 4 62 ‡ ‡ ‡ 6 41 ‡ 35 ! ‡ Central .................................... 23 34 5 ! 57 ‡ 7 41 ‡ 31 ! ‡ 7 45 17 ! 18 ! 20 ! West ....................................... 17 38 14 40 9 ! 9 35 21 ! 25 19 ! 11 33 23 26 19 ! Percent minority enrollment1
Less than 6 percent ................. 20 46 ‡ 43 ‡ 6 74 ‡ ‡ ‡ 9 52 31 ! ‡ ‡ 6 to 20 percent ........................ 23 36 6 ! 53 ‡ 6 35 ! ‡ 28 ! 28 ! 8 47 ‡ 19 ! 25 ! 21 to 49 percent ...................... 17 42 9 ! 48 ‡ 5 ‡ ‡ 46 ‡ 8 23 ! 22 ! 35 ! 20 ! 50 percent or more .................. 18 36 13 41 9 ! 8 44 22 ! 21 ! 13 ! 9 36 25 25 14 ! Percent of students eligible for free or reduced- priced lunch Less than 35 percent ............... 22 33 6 ! 55 7 ! 6 27 ! 15 ! 38 20 ! 9 38 14 ! 32 16 ! 35 to 49 percent ...................... 18 45 ‡ 46 ‡ 5 58 ‡ ‡ ‡ 9 37 ! 20 ! 18 ! 25 ! 50 to 74 percent ...................... 17 40 8 ! 49 ‡ 6 37 ! 21 ! 33 ! ‡ 8 46 23 ! 21 ! ‡ 75 percent or more .................. 18 42 17 ! 30 11 ! 8 51 ‡ 17 ! 16 ! 10 31 29 ! 19 ! 20 !
See notes at end of table.

14
Table 8. Percent of public schools with major repair, renovation, or replacement of building systems or features planned in the next 2 years, and among those schools, the percentage distribution by main reason for the planned major repair, renovation, or replacement and school characteristics: 2012–13—Continued
School characteristic
Windows, doors Interior finishes, trim Plumbing/lavatories Major repair,
renova-tion, or
replace-ment
planned
Main reason for planned major repair, renovation, or replacement
Major repair,
renova-tion, or
replace-ment
planned
Main reason for planned major repair, renovation, or replacement
Major repair,
renova-tion, or
replace-ment
planned
Main reason for planned major repair, renovation, or replacement
Functional problem
in existing system or
feature
Improve opera-
tional or energy
efficiency Replace-
ment cycle Other
reason
Functional problem
in existing system or
feature
Improve opera-
tional or energy
efficiency Replace-
ment cycle Other
reason
Functional problem
in existing system or
feature
Improve opera-
tional or energy
efficiency Replace-
ment cycle Other
reason
All public schools ................ 15 30 43 17 10 12 19 20 44 17 13 25 35 26 13
School instructional level Elementary .............................. 13 29 41 19 11 11 17 17 48 18 12 25 32 28 14 Secondary ............................... 21 31 45 14 10 ! 13 27 24 31 19 ! 17 21 41 25 13 ! Combined ............................... 21 ! 40 ! 60 # # 25 ‡ 33 ! 49 ! # 28 46 ! 44 ! ‡ # School enrollment size Less than 300 .......................... 18 20 ! 56 12 ! 12 ! 9 ‡ 30 ! 33 ! 31 ! 10 26 ! 40 18 ! 16 ! 300 to 599 ............................... 16 38 35 18 8 ! 13 22 19 44 14 ! 15 27 40 23 10 ! 600 or more ............................ 13 29 40 21 10 ! 12 21 16 49 14 13 22 26 36 16 Community type City ......................................... 15 24 34 31 11 ! 13 19 18 45 18 ! 15 29 27 34 10 ! Suburban ................................. 14 30 36 21 13 ! 13 20 ! 17 ! 46 18 ! 13 22 33 22 24 Town ...................................... 18 40 43 ‡ 14 ! 12 32 ! 33 ! 30 ! ‡ 16 26 ! 49 19 ! ‡ Rural ....................................... 16 31 54 10 ! ‡ 11 13 ! 19 ! 47 22 11 24 39 27 10 ! Region Northeast ................................ 18 34 42 16 ! ‡ 11 17 ! 18 ! 41 24 ! 11 28 ! 26 21 ! 25 ! Southeast ................................ 12 37 40 19 ! ‡ 13 23 ! 16 ! 54 ‡ 12 32 36 29 ‡ Central .................................... 16 27 50 14 ! 8 ! 10 21 ! 11 ! 41 27 13 25 ! 38 27 11 ! West ....................................... 16 27 38 19 15 ! 12 17 29 39 15 ! 15 21 37 27 15 Percent minority enrollment1
Less than 6 percent ................. 21 37 51 ‡ ‡ 12 25 ! 18 ! 27 ! 29 ! 11 45 31 ! ‡ ‡ 6 to 20 percent ........................ 15 32 47 8 ! 13 ! 8 21 ! ‡ 43 27 ! 12 24 ! 31 28 18 ! 21 to 49 percent ...................... 13 20 ! 45 28 ‡ 12 13 ! 16 ! 59 ‡ 13 18 ! 42 25 16 ! 50 percent or more .................. 15 32 35 21 12 ! 14 20 27 40 13 15 25 36 29 10 ! Percent of students eligible for free or reduced- priced lunch Less than 35 percent ............... 15 28 39 20 13 ! 14 17 ! 14 ! 50 19 ! 13 26 24 29 22 35 to 49 percent ...................... 15 27 52 12 ! ‡ 9 16 ! ‡ 44 26 ! 13 29 29 25 ! 16 ! 50 to 74 percent ...................... 15 37 46 13 ! ‡ 11 27 20 39 13 ! 13 27 47 23 ‡ 75 percent or more .................. 16 30 36 22 ! 12 ! 12 16 ! 31 39 14 ! 13 20 ! 42 28 10 !
See notes at end of table.

15
Table 8. Percent of public schools with major repair, renovation, or replacement of building systems or features planned in the next 2 years, and among those schools, the percentage distribution by main reason for the planned major repair, renovation, or replacement and school characteristics: 2012–13—Continued
School characteristic
Heating system Air conditioning system Ventilation/filtration system Major repair,
renova-tion, or
replace-ment
planned
Main reason for planned major repair, renovation, or replacement
Major repair,
renova-tion, or
replace-ment
planned
Main reason for planned major repair, renovation, or replacement
Major repair,
renova-tion, or
replace-ment
planned
Main reason for planned major repair, renovation, or replacement
Functional problem
in existing system or
feature
Improve opera-
tional or energy
efficiency Replace-
ment cycle Other
reason
Functional problem
in existing system or
feature
Improve opera-
tional or energy
efficiency Replace-
ment cycle Other
reason
Functional problem
in existing system or
feature
Improve opera-
tional or energy
efficiency Replace-
ment cycle Other
reason
All public schools ................ 16 26 41 27 6 16 28 44 23 5 11 31 38 23 8
School instructional level Elementary .............................. 14 23 34 35 8 ! 14 26 39 29 6 ! 10 30 30 29 10 ! Secondary ............................... 21 31 54 13 ! ‡ 22 34 52 11 ! 4 ! 15 32 55 8 ! 5 ! Combined ............................... 29 33 ! 54 ‡ # 17 ! ‡ 57 ! ‡ # 13 ! ‡ 41 ! ‡ # School enrollment size Less than 300 .......................... 16 23 54 18 ! ‡ 16 34 48 ‡ ‡ 9 23 ! 55 ‡ ‡ 300 to 599 ............................... 17 32 33 28 7 ! 17 34 42 22 ‡ 12 40 28 24 9 ! 600 or more ............................ 14 19 43 32 6 ! 16 19 43 31 7 ! 11 22 43 28 7 ! Community type City ......................................... 15 24 34 35 ‡ 18 25 44 26 ‡ 11 30 39 19 ! ‡ Suburban ................................. 17 24 37 31 8 ! 16 29 43 21 8 ! 11 26 39 24 11 ! Town ...................................... 15 32 38 23 ! ‡ 14 31 ! 39 27 ! ‡ 11 37 ! 28 ! 32 ! ‡ Rural ....................................... 16 27 51 20 ‡ 16 30 46 20 ‡ 11 33 41 22 ‡ Region Northeast ................................ 18 20 50 23 ! ‡ 14 24 ! 55 ‡ ‡ 13 31 40 16 ! ‡ Southeast ................................ 14 28 35 34 ‡ 15 36 36 25 ‡ 12 32 37 26 ‡ Central .................................... 16 31 42 24 ‡ 16 30 51 19 ! # 10 38 37 18 ! ‡ West ....................................... 16 24 39 28 9 ! 17 24 40 28 8 ! 11 24 38 28 9 ! Percent minority enrollment1
Less than 6 percent ................. 18 45 52 ‡ ‡ 18 47 39 ‡ ‡ 14 62 34 ! ‡ ‡ 6 to 20 percent ........................ 15 26 31 36 ‡ 14 22 40 37 ‡ 12 29 32 30 ‡ 21 to 49 percent ...................... 16 9 ! 49 35 ‡ 15 25 53 16 ! ‡ 10 15 ! 52 25 ! ‡ 50 percent or more .................. 16 29 38 26 7 ! 17 28 42 25 5 ! 10 28 37 25 10 ! Percent of students eligible for free or reduced- priced lunch Less than 35 percent ............... 18 23 31 38 8 ! 14 28 36 31 ‡ 13 27 33 30 ‡ 35 to 49 percent ...................... 15 31 38 30 ‡ 18 31 44 19 ! ‡ 11 37 36 25 ! ‡ 50 to 74 percent ...................... 16 23 53 20 ‡ 17 22 54 23 ‡ 11 26 49 22 ! ‡ 75 percent or more .................. 15 30 45 17 ! ‡ 16 34 40 16 ! 10 ! 9 38 35 ‡ 18 !
See notes at end of table.

16
Table 8. Percent of public schools with major repair, renovation, or replacement of building systems or features planned in the next 2 years, and among those schools, the percentage distribution by main reason for the planned major repair, renovation, or replacement and school characteristics: 2012–13—Continued
School characteristic
Electrical system Interior lighting Exterior lighting Major repair,
renova-tion, or
replace-ment
planned
Main reason for planned major repair, renovation, or replacement
Major repair,
renova-tion, or
replace-ment
planned
Main reason for planned major repair, renovation, or replacement
Major repair,
renova-tion, or
replace-ment
planned
Main reason for planned major repair, renovation, or replacement
Functional problem
in existing system or
feature
Improve opera-
tional or energy
efficiency Replace-
ment cycle Other
reason
Functional problem
in existing system or
feature
Improve opera-
tional or energy
efficiency Replace-
ment cycle Other
reason
Functional problem
in existing system or
feature
Improve opera-
tional or energy
efficiency Replace-
ment cycle Other
reason
All public schools ................ 9 28 37 22 13 13 12 70 9 9 10 19 56 14 11
School instructional level Elementary .............................. 9 28 31 26 15 13 13 68 10 10 ! 9 20 53 15 12 ! Secondary ............................... 10 27 51 11 ! 11 ! 13 11 ! 74 6 ! ‡ 10 19 ! 62 10 ! ‡ Combined ............................... 17 ! ‡ 52 ! ‡ # 18 ! ‡ 73 ‡ # 18 ! ‡ 73 ‡ # School enrollment size Less than 300 .......................... 10 25 ! 43 ‡ 19 ! 12 ‡ 77 ‡ ‡ 8 ‡ 57 ‡ ‡ 300 to 599 ............................... 10 30 31 26 12 ! 15 17 67 8 ! 8 ! 11 26 51 13 ! 10 ! 600 or more ............................ 9 27 41 22 10 ! 11 9 ! 69 13 9 ! 9 10 ! 64 17 9 ! Community type City ......................................... 11 31 29 33 ‡ 14 12 ! 66 13 ! ‡ 9 12 ! 50 27 ! ‡ Suburban ................................. 10 32 35 16 ! 17 ! 14 12 ! 67 8 ! 13 ! 10 14 ! 67 ‡ 14 ! Town ...................................... 9 25 ! 42 ! 19 ! ‡ 10 22 ! 62 ‡ ‡ 9 39 ! 47 ‡ ‡ Rural ....................................... 8 21 ! 45 18 ! 15 ! 12 ‡ 78 8 ! ‡ 10 22 ! 56 15 ! ‡ Region Northeast ................................ 9 21 ! 61 ‡ ‡ 16 13 ! 66 ‡ ‡ 10 ‡ 49 14 ! ‡ Southeast ................................ 9 36 20 ! 32 ‡ 12 17 ! 64 15 ! ‡ 9 22 ! 54 20 ! ‡ Central .................................... 7 40 28 ! 18 ! ‡ 11 ‡ 79 ‡ ‡ 9 ‡ 67 ‡ ‡ West ....................................... 11 19 41 24 16 ! 13 12 ! 70 9 ! 10 ! 11 24 54 11 ! 11 ! Percent minority enrollment1
Less than 6 percent ................. 10 35 ! 48 ‡ ‡ 16 18 ! 73 ‡ ‡ 8 ‡ 46 ! ‡ ‡ 6 to 20 percent ........................ 8 21 ! 24 ! 34 ! 22 ! 10 ‡ 66 ‡ 16 ! 10 19 ! 51 16 ! ‡ 21 to 49 percent ...................... 9 26 ! 51 20 ! ‡ 14 ‡ 78 8 ! ‡ 10 16 ! 61 15 ! ‡ 50 percent or more .................. 10 30 33 22 15 ! 13 15 65 13 ! 7 ! 10 18 ! 60 15 ! 7 ! Percent of students eligible for free or reduced- priced lunch Less than 35 percent ............... 11 23 37 32 ‡ 15 11 ! 65 13 ! 10 ! 12 13 ! 57 17 ! 13 ! 35 to 49 percent ...................... 8 46 29 ! ‡ ‡ 10 ‡ 78 ‡ ‡ 8 ‡ 66 ‡ ‡ 50 to 74 percent ...................... 8 24 ! 42 23 ! ‡ 13 13 ! 78 7 ! ‡ 7 29 ! 48 17 ! ‡ 75 percent or more .................. 10 28 ! 38 15 ! 19 ! 12 19 ! 60 ‡ 11 ! 10 21 ! 56 ‡ ‡
See notes at end of table.

17
Table 8. Percent of public schools with major repair, renovation, or replacement of building systems or features planned in the next 2 years, and among those schools, the percentage distribution by main reason for the planned major repair, renovation, or replacement and school characteristics: 2012–13—Continued
School characteristic
Energy management system Life safety features2 Security systems Major repair,
renova-tion, or
replace-ment
planned
Main reason for planned major repair, renovation, or replacement
Major repair,
renova-tion, or
replace-ment
planned
Main reason for planned major repair, renovation, or replacement
Major repair,
renova-tion, or
replace-ment
planned
Main reason for planned major repair, renovation, or replacement
Functional problem
in existing system or
feature
Improve opera-
tional or energy
efficiency Replace-
ment cycle Other
reason
Functional problem
in existing system or
feature
Improve opera-
tional or energy
efficiency Replace-
ment cycle Other
reason
Functional problem
in existing system or
feature
Improve opera-
tional or energy
efficiency Replace-
ment cycle Other
reason
All public schools ................ 14 14 65 14 7 12 24 37 21 19 21 22 46 9 22
School instructional level Elementary .............................. 13 13 64 16 7 ! 11 23 34 22 21 20 22 44 10 25 Secondary ............................... 16 15 66 9 ! 9 ! 12 23 41 19 16 ! 20 25 50 10 ! 15 Combined ............................... 34 ‡ 68 ‡ # 16 ! ‡ 60 ! ‡ # 32 ‡ 67 # ‡ School enrollment size Less than 300 .......................... 12 # 79 ‡ ‡ 8 ‡ 36 ! ‡ 39 ! 23 22 47 ‡ 29 300 to 599 ............................... 17 19 60 14 6 ! 14 31 36 20 14 ! 21 26 40 10 ! 24 600 or more ............................ 13 13 65 15 8 ! 11 18 38 28 16 19 18 53 14 14 Community type City ......................................... 13 19 ! 59 13 ! ‡ 11 22 ! 42 24 ! ‡ 16 19 ! 43 14 ! 24 Suburban ................................. 14 ‡ 63 16 ! 12 ! 13 30 33 19 ! 19 ! 19 16 53 8 ! 22 Town ...................................... 17 21 ! 64 13 ! ‡ 16 21 ! 40 24 ! 16 ! 24 33 51 ‡ 9 ! Rural ....................................... 15 11 ! 71 14 ! ‡ 10 21 ! 35 18 ! 26 ! 24 24 41 9 ! 26 Region Northeast ................................ 17 ‡ 66 20 ! ‡ 10 31 ! 38 ‡ 22 ! 18 17 ! 40 9 ! 33 Southeast ................................ 14 23 ! 56 18 ! ‡ 10 30 32 27 ! ‡ 18 28 38 14 ! 20 Central .................................... 14 15 ! 66 13 ! ‡ 12 21 ! 27 25 27 26 28 43 8 ! 20 West ....................................... 14 8 ! 70 9 ! 13 ! 13 20 46 19 16 19 15 57 8 ! 20 Percent minority enrollment1
Less than 6 percent ................. 14 31 ! 56 ‡ ‡ 12 35 ! 35 ! ‡ ‡ 28 29 37 ‡ 30 6 to 20 percent ........................ 18 12 ! 62 18 ! ‡ 13 29 32 15 ! 24 ! 23 28 44 11 ! 17 ! 21 to 49 percent ...................... 13 ‡ 62 18 ! ‡ 11 26 ! 37 16 ! 21 ! 22 18 48 11 23 50 percent or more .................. 13 11 ! 73 9 ! 7 ! 11 15 41 29 14 ! 16 16 51 10 ! 23 Percent of students eligible for free or reduced- priced lunch Less than 35 percent ............... 17 16 58 20 ‡ 13 26 31 23 19 ! 23 17 48 13 21 35 to 49 percent ...................... 12 ‡ 68 15 ! ‡ 12 36 29 17 ! 19 ! 19 33 36 ‡ 25 50 to 74 percent ...................... 14 16 ! 72 8 ! ‡ 11 20 ! 41 20 ! 19 ! 21 22 48 7 ! 22 75 percent or more .................. 14 11 ! 67 ‡ 11 ! 9 12 ! 51 20 ! 17 ! 17 21 48 ‡ 22
See notes at end of table.

18
Table 8. Percent of public schools with major repair, renovation, or replacement of building systems or features planned in the next 2 years, and among those schools, the percentage distribution by main reason for the planned major repair, renovation, or replacement and school characteristics: 2012–13—Continued
School characteristic
Internal communication systems Technology infrastructure Major repair,
renova-tion, or
replace-ment
planned
Main reason for planned major repair, renovation, or replacement
Major repair,
renova-tion, or
replace-ment
planned
Main reason for planned major repair, renovation, or replacement
Functional problem
in existing system or
feature
Improve opera-
tional or energy
efficiency Replace-
ment cycle Other
reason
Functional problem
in existing system or
feature
Improve opera-
tional or energy
efficiency Replace-
ment cycle Other
reason
All public schools ..................................................................................................................... 14 24 43 21 13 20 17 51 21 11
School instructional level Elementary ................................................................................................................................... 13 21 39 25 15 19 16 46 25 13 Secondary .................................................................................................................................... 16 28 49 12 ! 11 ! 23 19 59 14 8 ! Combined .................................................................................................................................... 23 ! 37 ! 63 # # 33 ‡ 71 ‡ # School enrollment size Less than 300 ............................................................................................................................... 17 24 41 13 ! 22 ! 25 25 43 22 10 ! 300 to 599 .................................................................................................................................... 14 27 40 26 7 ! 20 17 50 22 11 ! 600 or more ................................................................................................................................. 12 18 49 21 12 ! 18 10 59 20 12 Community type City .............................................................................................................................................. 13 24 41 21 14 ! 17 16 ! 53 21 9 ! Suburban ...................................................................................................................................... 13 19 ! 50 15 ! 16 ! 20 11 ! 51 21 17 Town ........................................................................................................................................... 16 17 ! 42 34 ‡ 23 16 ! 65 10 ! ‡ Rural ............................................................................................................................................ 14 30 39 19 ! 12 ! 21 22 44 26 8 ! Region Northeast ..................................................................................................................................... 11 31 ! 35 ‡ ‡ 17 20 ! 45 15 ! 20 ! Southeast ..................................................................................................................................... 12 26 ! 35 32 ‡ 18 22 47 22 9 ! Central ......................................................................................................................................... 16 31 40 16 ! 14 ! 24 19 45 27 9 ! West ............................................................................................................................................ 15 14 ! 52 20 14 ! 20 11 60 19 10 ! Percent minority enrollment1
Less than 6 percent ...................................................................................................................... 19 34 35 ! ‡ ‡ 22 35 32 17 ! ‡ 6 to 20 percent ............................................................................................................................. 12 19 ! 44 24 ! 14 ! 22 15 ! 46 30 9 ! 21 to 49 percent ........................................................................................................................... 14 19 ! 49 14 ! 18 ! 19 12 ! 63 15 10 ! 50 percent or more ....................................................................................................................... 14 24 42 24 9 ! 19 15 54 20 11 Percent of students eligible for free or reduced-priced lunch Less than 35 percent .................................................................................................................... 15 21 43 25 12 ! 23 14 44 28 13 35 to 49 percent ........................................................................................................................... 12 31 47 ‡ ‡ 20 17 ! 53 19 ! 11 ! 50 to 74 percent ........................................................................................................................... 14 23 39 22 16 ! 18 16 59 19 6 ! 75 percent or more ....................................................................................................................... 14 24 44 19 ! 13 ! 19 23 51 15 ! 12 ! # Rounds to zero. ! Interpret data with caution; the coefficient of variation is greater than or equal to 30 percent. ‡ Reporting standards not met. The coefficient of variation for this estimate is 50 percent or greater or the sample size is less than 3. 1 Minority enrollment includes Hispanic, Asian, Native Hawaiian/Pacific Islander, American Indian/Alaska Native, and students of two or more races. 2 “Life safety features” includes sprinklers, fire alarms, and smoke detectors. NOTE: Based on schools with that building system/feature. Detail may not sum to totals because of rounding. SOURCE: U.S. Department of Education, National Center for Education Statistics, Fast Response Survey System (FRSS), “Condition of Public School Facilities: 2012–13,” FRSS 105, 2013.

19
Table 9. Percent of public schools with inspection and evaluation performed by qualified professionals within the last 5 years, and the percent of public schools in which various steps had been taken within the last 5 years to improve energy efficiency at the school, by school characteristics: 2012–13
School characteristic
Inspection and evaluation performed by qualified professionals Steps to improve energy efficiency
Inspection of the
condition of the physical
features of the facility
Evaluation of energy
use
Evaluation of indoor
environ-mental
hazards
Replaced lighting fixtures, lighting
ballasts, or bulbs
Installed motion
sensors for lighting
Upgraded insulation,
outer walls, and/or siding
(building envelopes)
Replaced windows
and/or doors
Installed or upgraded a
reflective roof coating
Installed more
efficient HVAC
systems
Installed or upgraded an
energy management
system
All public schools ........................................................................ 83 72 80 65 35 14 25 19 31 34
School instructional level Elementary ...................................................................................... 82 71 80 64 32 12 23 18 28 33 Secondary ....................................................................................... 86 75 83 68 41 16 29 21 39 39 Combined ....................................................................................... 84 74 77 77 57 31 43 21 39 27 School enrollment size Less than 300 .................................................................................. 81 63 76 67 33 14 28 17 27 25 300 to 599 ....................................................................................... 83 73 80 66 35 14 27 21 31 35 600 or more .................................................................................... 85 76 84 63 37 13 21 17 34 40 Community type City ................................................................................................. 87 71 83 62 35 15 27 19 29 36 Suburban ......................................................................................... 85 75 82 65 38 12 22 16 28 35 Town .............................................................................................. 82 68 78 65 32 13 27 26 36 40 Rural ............................................................................................... 79 71 78 68 34 14 26 18 33 30 Region Northeast ........................................................................................ 85 79 87 67 45 20 37 18 30 36 Southeast ........................................................................................ 83 70 78 50 26 10 17 16 31 28 Central ............................................................................................ 87 74 83 73 39 14 33 22 32 39 West ............................................................................................... 79 67 77 68 32 13 19 18 31 34 Percent minority enrollment1
Less than 6 percent ......................................................................... 84 71 83 66 36 17 35 24 36 35 6 to 20 percent ................................................................................ 84 76 83 75 41 17 29 17 32 37 21 to 49 percent .............................................................................. 83 77 80 63 37 12 23 18 32 34 50 percent or more .......................................................................... 82 66 78 60 29 11 21 18 29 32 Percent of students eligible for free or reduced-priced lunch Less than 35 percent ....................................................................... 84 75 84 70 43 15 28 18 31 36 35 to 49 percent .............................................................................. 86 76 78 68 34 14 24 20 30 32 50 to 74 percent .............................................................................. 80 69 80 63 31 12 23 19 34 35 75 percent or more .......................................................................... 82 67 78 59 29 13 25 19 29 32 1 Minority enrollment includes Hispanic, Asian, Native Hawaiian/Pacific Islander, American Indian/Alaska Native, and students of two or more races. SOURCE: U.S. Department of Education, National Center for Education Statistics, Fast Response Survey System (FRSS), “Condition of Public School Facilities: 2012–13,” FRSS 105, 2013.

20
Table 10. Among public schools, years since original construction of the main instructional building, years since the most recent major renovation of the main instructional building, years since the last major building replacement or addition at the school, functional age of the main instructional building, and the percentage distribution of public schools according to the functional age of the main instructional building, by school characteristics: 2012–13
School characteristic
Years since construction of
the main instructional
building
Years since most recent
major renovation of the main
instructional building
Years since last major
building replacement or
addition
Functional age of the main
instructional building
Functional age of the main instructional building
Less than 5 years old
5–14 years old
15–34 years old
35 or more years old
All public schools ............................................................................... 44 12 16 19 21 38 23 18
School instructional level Elementary ............................................................................................. 45 12 17 19 19 37 25 19 Secondary .............................................................................................. 43 11 14 17 25 39 17 18 Combined .............................................................................................. 50 12 12 18 27 34 28 11 ! School enrollment size Less than 300 ......................................................................................... 49 13 19 23 19 31 24 25 300 to 599 .............................................................................................. 47 12 18 20 21 37 23 20 600 or more ........................................................................................... 38 10 12 15 22 43 24 11 Community type City ........................................................................................................ 50 11 18 21 24 33 20 22 Suburban ................................................................................................ 43 11 15 18 23 39 20 19 Town ..................................................................................................... 48 14 18 19 19 37 27 17 Rural ...................................................................................................... 40 12 14 18 17 40 28 15 Region Northeast ............................................................................................... 54 10 19 22 23 31 20 25 Southeast ............................................................................................... 36 11 14 17 22 40 22 16 Central ................................................................................................... 49 13 19 19 22 35 24 19 West ...................................................................................................... 41 12 14 19 18 41 25 16 Percent minority enrollment1
Less than 6 percent ................................................................................ 50 12 20 21 21 33 22 24 6 to 20 percent ....................................................................................... 44 13 16 19 21 34 27 18 21 to 49 percent ..................................................................................... 41 12 14 17 19 42 26 13 50 percent or more ................................................................................. 45 10 15 20 22 39 20 20 Percent of students eligible for free or reduced-priced lunch Less than 35 percent .............................................................................. 42 11 17 17 20 40 25 15 35 to 49 percent ..................................................................................... 46 12 16 20 23 34 22 21 50 to 74 percent ..................................................................................... 43 12 15 19 18 39 25 17 75 percent or more ................................................................................. 48 11 16 20 24 35 20 21 ! Interpret data with caution; the coefficient of variation is greater than or equal to 30 percent. 1 Minority enrollment includes Hispanic, Asian, Native Hawaiian/Pacific Islander, American Indian/Alaska Native, and students of two or more races. NOTE: Functional age is defined as the age of the school based on the year of the most recent major renovation or the year of construction of the main instructional building if no renovation has occurred. Detail may not sum to totals because of rounding. SOURCE: U.S. Department of Education, National Center for Education Statistics, Fast Response Survey System (FRSS), “Condition of Public School Facilities: 2012–13,” FRSS 105, 2013.

References
Kalton, G. (1983). Compensating for Missing Survey Data. Survey Research Center, Institute for Social Research: University of Michigan.
Levy, P., and Lemeshow, S. (1991). Sampling of Populations. New York: J. Wiley & Sons.
Lewis, L., Snow, K., Farris, E., Smerdon, B., Cronen, S., and Kaplan, J. (2000). Condition of America’s Public School Facilities: 1999 (NCES 2000-032). U.S. Department of Education. Washington, DC: National Center for Education Statistics.
21

Appendix A
Standard Error Tables
A-1
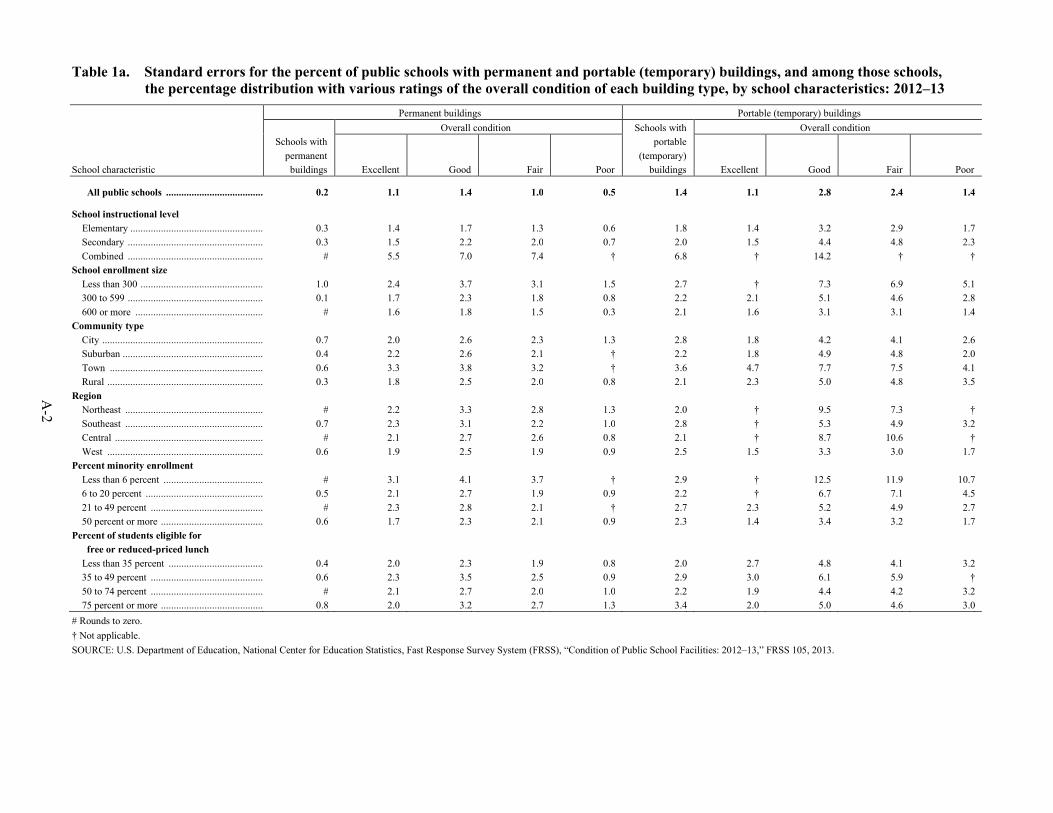
A-2
Table 1a. Standard errors for the percent of public schools with permanent and portable (temporary) buildings, and among those schools, the percentage distribution with various ratings of the overall condition of each building type, by school characteristics: 2012–13
School characteristic
Permanent buildings Portable (temporary) buildings
Schools with permanent buildings
Overall condition Schools with portable
(temporary) buildings
Overall condition
Excellent Good Fair Poor Excellent Good Fair Poor
All public schools ....................................... 0.2 1.1 1.4 1.0 0.5 1.4 1.1 2.8 2.4 1.4
School instructional level Elementary .................................................... 0.3 1.4 1.7 1.3 0.6 1.8 1.4 3.2 2.9 1.7 Secondary ..................................................... 0.3 1.5 2.2 2.0 0.7 2.0 1.5 4.4 4.8 2.3 Combined ..................................................... # 5.5 7.0 7.4 † 6.8 † 14.2 † † School enrollment size Less than 300 ................................................ 1.0 2.4 3.7 3.1 1.5 2.7 † 7.3 6.9 5.1 300 to 599 ..................................................... 0.1 1.7 2.3 1.8 0.8 2.2 2.1 5.1 4.6 2.8 600 or more .................................................. # 1.6 1.8 1.5 0.3 2.1 1.6 3.1 3.1 1.4 Community type City ............................................................... 0.7 2.0 2.6 2.3 1.3 2.8 1.8 4.2 4.1 2.6 Suburban ....................................................... 0.4 2.2 2.6 2.1 † 2.2 1.8 4.9 4.8 2.0 Town ............................................................ 0.6 3.3 3.8 3.2 † 3.6 4.7 7.7 7.5 4.1 Rural ............................................................. 0.3 1.8 2.5 2.0 0.8 2.1 2.3 5.0 4.8 3.5 Region Northeast ...................................................... # 2.2 3.3 2.8 1.3 2.0 † 9.5 7.3 † Southeast ...................................................... 0.7 2.3 3.1 2.2 1.0 2.8 † 5.3 4.9 3.2 Central .......................................................... # 2.1 2.7 2.6 0.8 2.1 † 8.7 10.6 † West ............................................................. 0.6 1.9 2.5 1.9 0.9 2.5 1.5 3.3 3.0 1.7 Percent minority enrollment
Less than 6 percent ....................................... # 3.1 4.1 3.7 † 2.9 † 12.5 11.9 10.7 6 to 20 percent .............................................. 0.5 2.1 2.7 1.9 0.9 2.2 † 6.7 7.1 4.5 21 to 49 percent ............................................ # 2.3 2.8 2.1 † 2.7 2.3 5.2 4.9 2.7 50 percent or more ........................................ 0.6 1.7 2.3 2.1 0.9 2.3 1.4 3.4 3.2 1.7 Percent of students eligible for free or reduced-priced lunch Less than 35 percent ..................................... 0.4 2.0 2.3 1.9 0.8 2.0 2.7 4.8 4.1 3.2 35 to 49 percent ............................................ 0.6 2.3 3.5 2.5 0.9 2.9 3.0 6.1 5.9 † 50 to 74 percent ............................................ # 2.1 2.7 2.0 1.0 2.2 1.9 4.4 4.2 3.2 75 percent or more ........................................ 0.8 2.0 3.2 2.7 1.3 3.4 2.0 5.0 4.6 3.0 # Rounds to zero. † Not applicable. SOURCE: U.S. Department of Education, National Center for Education Statistics, Fast Response Survey System (FRSS), “Condition of Public School Facilities: 2012–13,” FRSS 105, 2013.

A-3
Table 2a. Standard errors for the percent of public schools with permanent buildings with the condition of building systems/features in their permanent buildings rated as fair or poor, by school characteristics: 2012–13
School characteristic Roofs
Framing, floors, foun-
dations
Exterior walls,
finishes
Win-dows, doors
Interior finishes,
trim
Plumb-ing/
lava-tories
Heating system
Air condi-
tioning system
Venti-lation/
filtration system
Elec-trical
system Interior lighting
Exterior lighting
Energy manage-
ment system
Life safety
features Security systems
Internal commu-nication systems
Tech-nology
infra-structure
All public schools ................... 1.1 1.1 1.1 1.3 1.3 1.2 1.2 1.3 1.3 1.2 1.1 1.3 1.4 1.2 1.2 1.3 1.2
School instructional level Elementary ................................. 1.4 1.3 1.3 1.6 1.5 1.6 1.5 1.6 1.6 1.4 1.4 1.6 1.7 1.4 1.6 1.6 1.5 Secondary .................................. 2.0 1.8 2.1 2.5 2.1 2.5 2.4 2.4 2.3 2.2 1.8 2.2 2.6 2.1 2.3 2.4 2.0 Combined .................................. 6.8 7.2 7.2 8.1 7.0 8.0 6.5 7.1 8.4 7.0 7.0 7.2 8.2 6.8 7.4 6.6 6.2 School enrollment size Less than 300 ............................. 2.9 2.8 3.0 3.5 3.2 3.4 3.3 3.3 3.2 3.0 2.9 3.5 4.0 3.2 3.4 3.2 3.3 300 to 599 .................................. 1.9 2.0 1.7 2.2 2.2 2.2 2.2 2.5 2.3 2.0 2.0 2.1 2.3 1.8 2.0 2.1 1.9 600 or more ............................... 1.7 1.3 1.6 2.0 1.6 1.8 1.7 1.9 1.9 1.6 1.5 1.8 1.9 1.5 1.7 1.7 1.6 Community type City ............................................ 2.4 2.1 2.2 2.6 2.8 2.4 2.3 2.5 2.6 2.3 2.5 2.7 2.7 2.3 2.7 2.6 2.3 Suburban .................................... 2.4 1.6 1.9 2.4 2.1 2.5 2.4 2.7 2.4 2.3 2.1 2.2 2.2 1.9 2.4 2.2 2.0 Town ......................................... 3.5 2.9 2.9 3.9 3.3 3.6 3.3 3.5 3.9 2.8 3.4 3.9 3.8 3.0 3.8 3.4 2.8 Rural .......................................... 2.0 1.9 2.1 2.4 2.1 2.4 2.5 2.6 2.3 2.0 1.9 2.3 2.9 2.3 2.4 2.3 2.2 Region Northeast ................................... 3.0 2.6 2.6 2.8 2.8 2.8 2.7 3.2 3.1 2.9 2.8 3.0 3.5 2.8 2.8 3.4 3.0 Southeast ................................... 2.5 2.3 2.2 2.7 2.5 2.7 2.8 3.0 2.8 2.5 2.5 2.6 2.9 2.4 2.2 2.2 2.4 Central ....................................... 2.6 2.1 2.3 2.8 2.3 2.8 2.9 2.8 2.7 2.4 2.2 2.8 2.7 2.2 3.0 2.8 2.5 West .......................................... 2.1 1.8 2.2 2.5 2.4 2.6 2.4 2.2 2.3 2.3 1.9 2.0 2.3 2.3 2.3 2.3 2.3 Percent minority enrollment
Less than 6 percent .................... 3.4 3.7 3.4 4.0 3.3 4.1 4.3 4.3 3.8 4.1 3.6 4.3 4.4 3.4 4.3 3.9 3.2 6 to 20 percent ........................... 2.3 1.9 2.2 2.8 2.5 2.8 2.6 3.1 2.4 2.5 2.1 2.6 2.8 2.1 2.6 2.5 2.4 21 to 49 percent ......................... 2.4 1.8 1.8 2.5 2.2 2.5 2.1 2.6 2.4 2.3 2.3 2.5 2.6 2.2 2.6 2.5 1.9 50 percent or more ..................... 1.8 1.5 1.9 2.3 2.1 1.8 2.0 2.0 2.0 1.7 1.9 2.1 2.3 2.0 2.1 2.2 1.9 Percent of students eligible for free or reduced- priced lunch Less than 35 percent .................. 2.0 1.6 1.9 2.2 2.2 2.4 2.3 2.5 2.4 2.6 2.2 2.4 2.2 2.1 2.2 2.5 2.2 35 to 49 percent ......................... 2.9 2.2 1.9 3.2 2.5 3.1 3.0 3.2 3.0 2.8 2.2 3.0 3.3 2.5 3.3 2.7 2.5 50 to 74 percent ......................... 2.5 2.1 2.2 2.6 2.6 2.8 2.6 3.1 2.6 2.2 2.2 2.4 3.0 2.3 2.6 2.8 2.5 75 percent or more ..................... 2.8 2.4 2.6 3.1 3.3 2.8 3.1 3.1 3.0 2.7 2.5 2.9 3.3 2.9 2.7 3.0 2.3 SOURCE: U.S. Department of Education, National Center for Education Statistics, Fast Response Survey System (FRSS), “Condition of Public School Facilities: 2012–13,” FRSS 105, 2013.

A-4
Table 3a. Standard errors for the percent of public schools with portable (temporary) buildings with the condition of building systems/features in their portable (temporary) buildings rated as fair or poor, by school characteristics: 2012–13
School characteristic Roofs
Framing, floors, foun-
dations
Exterior walls,
finishes
Win-dows, doors
Interior finishes,
trim
Plumb-ing/
lava-tories
Heating system
Air condi-
tioning system
Venti-lation/
filtration system
Elec-trical
system Interior lighting
Exterior lighting
Energy manage-
ment system
Life safety
features Security systems
Internal commu-nication systems
Tech-nology
infra-structure
All public schools ................... 2.5 2.5 2.6 2.7 2.5 3.1 2.6 2.7 2.7 2.3 2.3 2.7 3.0 2.7 2.9 2.8 2.7
School instructional level Elementary ................................. 3.1 2.9 3.0 3.1 2.9 3.8 3.0 3.1 3.2 2.7 2.6 2.9 3.8 3.1 3.7 3.2 3.3 Secondary .................................. 4.2 5.0 4.3 4.5 4.5 5.5 4.8 4.6 4.9 4.3 4.1 5.1 5.5 4.1 5.5 4.5 4.8 Combined .................................. † † † † 12.4 † † † † † † 14.3 12.2 15.5 15.3 † † School enrollment size Less than 300 ............................. 7.6 7.1 7.6 7.5 7.1 9.3 7.8 8.5 8.3 7.4 7.4 7.3 8.2 9.1 8.1 8.1 8.1 300 to 599 .................................. 4.5 4.5 4.6 4.6 4.9 5.9 4.6 4.5 4.3 4.4 4.4 4.8 5.8 4.2 5.5 4.9 4.7 600 or more ............................... 3.0 3.0 3.1 3.1 3.1 3.9 3.2 3.3 3.2 2.4 2.7 3.6 3.7 3.2 3.6 3.3 2.7 Community type City ............................................ 4.4 4.4 4.3 4.4 4.2 4.6 4.1 4.4 4.4 4.4 4.3 4.9 5.1 3.9 4.6 4.1 4.6 Suburban .................................... 4.2 4.1 4.3 4.4 4.4 5.5 4.4 4.5 4.6 4.1 4.2 4.2 5.0 3.7 4.6 4.3 3.9 Town ......................................... 7.8 7.9 7.3 7.8 7.2 9.2 7.0 7.7 8.2 6.1 6.3 8.0 11.0 7.4 9.7 7.7 7.4 Rural .......................................... 4.9 4.9 5.4 5.2 5.2 6.3 4.9 5.2 5.2 5.0 5.0 5.7 5.7 5.4 5.7 5.7 5.4 Region Northeast ................................... 9.2 9.6 9.7 9.5 9.1 15.9 10.1 9.9 10.9 10.0 10.2 10.4 12.3 10.6 11.7 10.6 10.3 Southeast ................................... 4.6 5.2 5.2 5.3 5.0 6.1 5.1 5.2 5.4 5.2 4.9 5.4 6.2 5.1 5.9 4.9 5.8 Central ....................................... 10.0 9.2 11.1 9.3 10.1 10.5 9.7 10.0 9.1 9.4 9.0 9.6 13.9 8.2 14.9 10.2 11.2 West .......................................... 2.8 3.0 2.9 3.3 3.2 4.0 2.8 3.1 3.1 2.6 2.9 3.5 3.7 3.4 3.4 3.5 3.2 Percent minority enrollment
Less than 6 percent .................... 13.1 13.4 12.8 9.7 14.2 20.5 13.7 13.7 14.5 13.4 13.4 14.8 18.8 16.2 14.0 15.1 15.5 6 to 20 percent ........................... 6.7 6.7 6.9 7.0 6.3 8.6 6.1 6.9 7.4 6.4 6.5 7.6 8.9 7.2 8.4 7.8 8.4 21 to 49 percent ......................... 5.4 5.0 5.2 5.2 5.3 6.2 5.0 5.4 5.2 4.7 4.7 5.9 5.5 4.3 6.1 4.5 4.9 50 percent or more ..................... 3.3 3.3 2.9 3.4 3.0 3.9 3.0 3.1 3.3 2.8 2.9 3.3 3.9 3.4 3.4 3.4 3.0 Percent of students eligible for free or reduced- priced lunch Less than 35 percent .................. 4.7 4.8 4.9 4.7 4.8 6.2 4.8 4.9 5.0 4.5 4.7 5.1 5.6 4.8 6.1 5.2 4.5 35 to 49 percent ......................... 5.2 6.3 6.1 6.4 5.6 6.2 5.9 5.9 6.1 5.5 4.9 6.7 7.3 5.3 6.7 5.6 6.2 50 to 74 percent ......................... 4.8 4.4 4.7 4.7 4.6 5.7 4.6 4.8 4.7 4.4 4.6 5.3 5.4 4.7 5.5 4.8 5.0 75 percent or more ..................... 5.0 4.8 4.2 4.8 4.9 5.6 4.8 4.9 4.9 4.3 4.3 4.7 6.4 4.9 5.0 5.3 5.1 † Not applicable. SOURCE: U.S. Department of Education, National Center for Education Statistics, Fast Response Survey System (FRSS), “Condition of Public School Facilities: 2012–13,” FRSS 105, 2013.
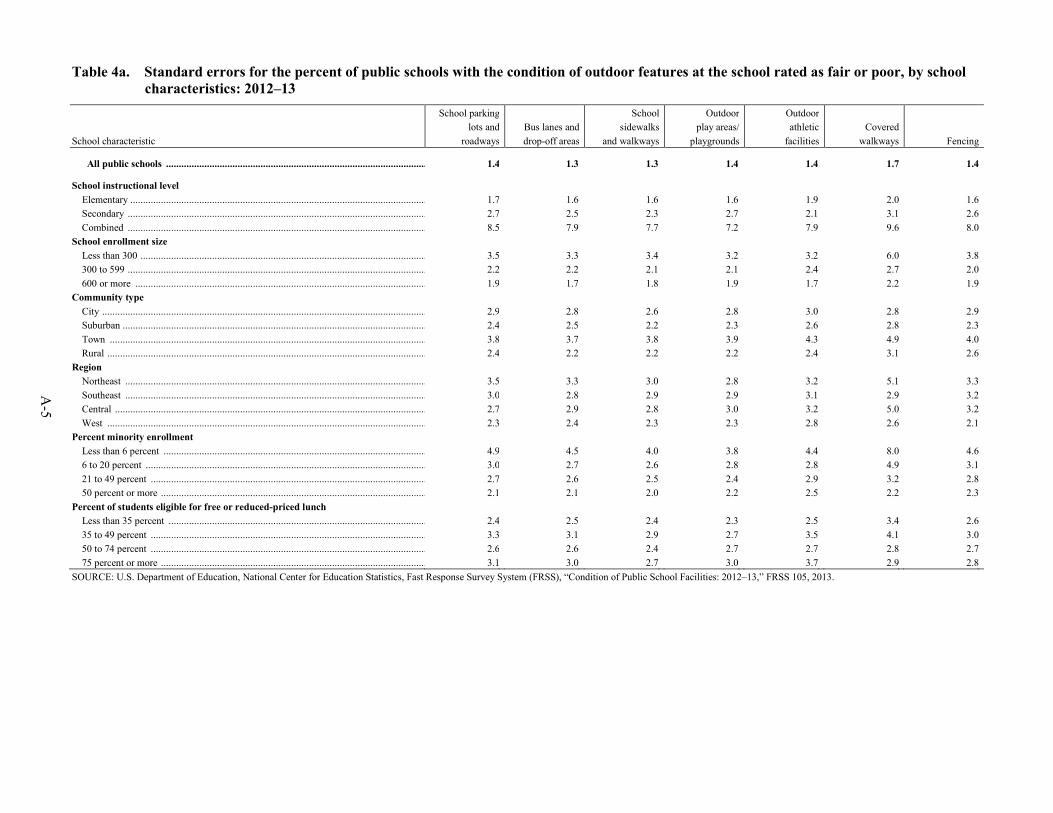
A-5
Table 4a. Standard errors for the percent of public schools with the condition of outdoor features at the school rated as fair or poor, by school characteristics: 2012–13
School characteristic
School parking lots and
roadways Bus lanes and drop-off areas
School sidewalks
and walkways
Outdoor play areas/
playgrounds
Outdoor athletic
facilities Covered
walkways Fencing
All public schools ...................................................................................................... 1.4 1.3 1.3 1.4 1.4 1.7 1.4
School instructional level Elementary .................................................................................................................... 1.7 1.6 1.6 1.6 1.9 2.0 1.6 Secondary ..................................................................................................................... 2.7 2.5 2.3 2.7 2.1 3.1 2.6 Combined ..................................................................................................................... 8.5 7.9 7.7 7.2 7.9 9.6 8.0 School enrollment size Less than 300 ................................................................................................................ 3.5 3.3 3.4 3.2 3.2 6.0 3.8 300 to 599 ..................................................................................................................... 2.2 2.2 2.1 2.1 2.4 2.7 2.0 600 or more .................................................................................................................. 1.9 1.7 1.8 1.9 1.7 2.2 1.9 Community type City ............................................................................................................................... 2.9 2.8 2.6 2.8 3.0 2.8 2.9 Suburban ....................................................................................................................... 2.4 2.5 2.2 2.3 2.6 2.8 2.3 Town ............................................................................................................................ 3.8 3.7 3.8 3.9 4.3 4.9 4.0 Rural ............................................................................................................................. 2.4 2.2 2.2 2.2 2.4 3.1 2.6 Region Northeast ...................................................................................................................... 3.5 3.3 3.0 2.8 3.2 5.1 3.3 Southeast ...................................................................................................................... 3.0 2.8 2.9 2.9 3.1 2.9 3.2 Central .......................................................................................................................... 2.7 2.9 2.8 3.0 3.2 5.0 3.2 West ............................................................................................................................. 2.3 2.4 2.3 2.3 2.8 2.6 2.1 Percent minority enrollment
Less than 6 percent ....................................................................................................... 4.9 4.5 4.0 3.8 4.4 8.0 4.6 6 to 20 percent .............................................................................................................. 3.0 2.7 2.6 2.8 2.8 4.9 3.1 21 to 49 percent ............................................................................................................ 2.7 2.6 2.5 2.4 2.9 3.2 2.8 50 percent or more ........................................................................................................ 2.1 2.1 2.0 2.2 2.5 2.2 2.3 Percent of students eligible for free or reduced-priced lunch Less than 35 percent ..................................................................................................... 2.4 2.5 2.4 2.3 2.5 3.4 2.6 35 to 49 percent ............................................................................................................ 3.3 3.1 2.9 2.7 3.5 4.1 3.0 50 to 74 percent ............................................................................................................ 2.6 2.6 2.4 2.7 2.7 2.8 2.7 75 percent or more ........................................................................................................ 3.1 3.0 2.7 3.0 3.7 2.9 2.8 SOURCE: U.S. Department of Education, National Center for Education Statistics, Fast Response Survey System (FRSS), “Condition of Public School Facilities: 2012–13,” FRSS 105, 2013.
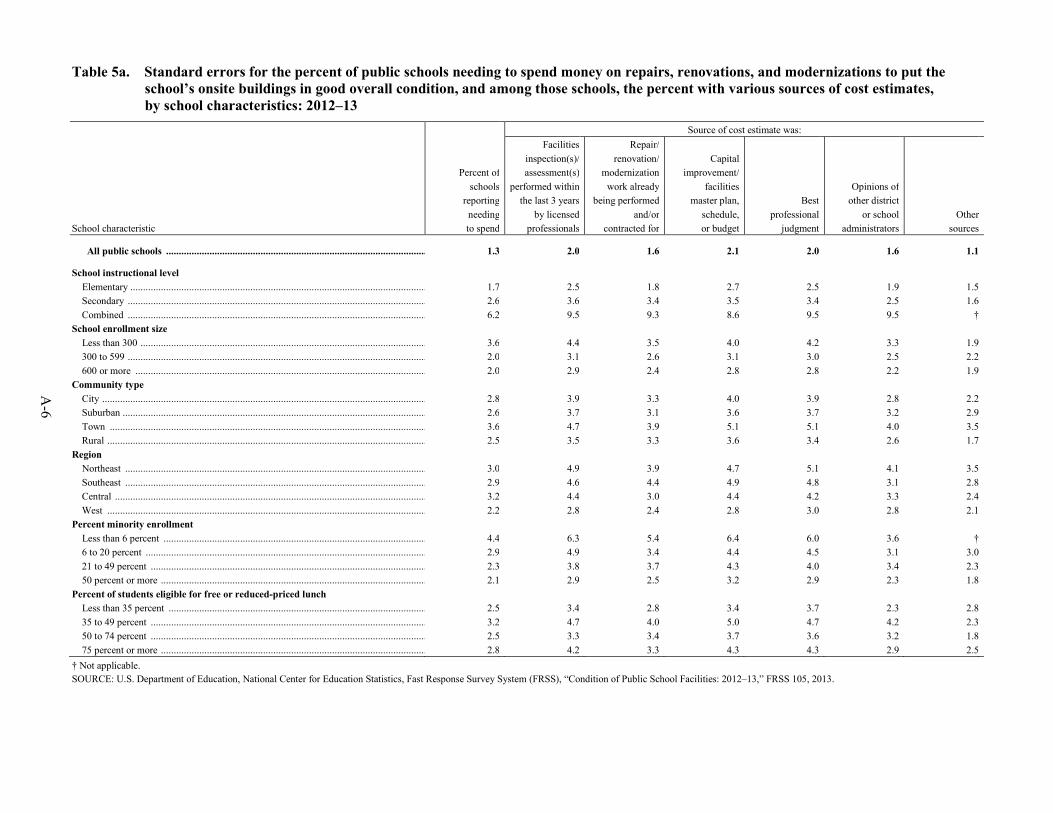
A-6
Table 5a. Standard errors for the percent of public schools needing to spend money on repairs, renovations, and modernizations to put the school’s onsite buildings in good overall condition, and among those schools, the percent with various sources of cost estimates, by school characteristics: 2012–13
School characteristic
Percent of schools
reporting needing to spend
Source of cost estimate was: Facilities
inspection(s)/ assessment(s)
performed within the last 3 years
by licensed professionals
Repair/ renovation/
modernization work already
being performed and/or
contracted for
Capital improvement/
facilities master plan,
schedule, or budget
Best professional
judgment
Opinions of other district
or school administrators
Other sources
All public schools ...................................................................................................... 1.3 2.0 1.6 2.1 2.0 1.6 1.1
School instructional level Elementary .................................................................................................................... 1.7 2.5 1.8 2.7 2.5 1.9 1.5 Secondary ..................................................................................................................... 2.6 3.6 3.4 3.5 3.4 2.5 1.6 Combined ..................................................................................................................... 6.2 9.5 9.3 8.6 9.5 9.5 † School enrollment size Less than 300 ................................................................................................................ 3.6 4.4 3.5 4.0 4.2 3.3 1.9 300 to 599 ..................................................................................................................... 2.0 3.1 2.6 3.1 3.0 2.5 2.2 600 or more .................................................................................................................. 2.0 2.9 2.4 2.8 2.8 2.2 1.9 Community type City ............................................................................................................................... 2.8 3.9 3.3 4.0 3.9 2.8 2.2 Suburban ....................................................................................................................... 2.6 3.7 3.1 3.6 3.7 3.2 2.9 Town ............................................................................................................................ 3.6 4.7 3.9 5.1 5.1 4.0 3.5 Rural ............................................................................................................................. 2.5 3.5 3.3 3.6 3.4 2.6 1.7 Region Northeast ...................................................................................................................... 3.0 4.9 3.9 4.7 5.1 4.1 3.5 Southeast ...................................................................................................................... 2.9 4.6 4.4 4.9 4.8 3.1 2.8 Central .......................................................................................................................... 3.2 4.4 3.0 4.4 4.2 3.3 2.4 West ............................................................................................................................. 2.2 2.8 2.4 2.8 3.0 2.8 2.1 Percent minority enrollment
Less than 6 percent ....................................................................................................... 4.4 6.3 5.4 6.4 6.0 3.6 † 6 to 20 percent .............................................................................................................. 2.9 4.9 3.4 4.4 4.5 3.1 3.0 21 to 49 percent ............................................................................................................ 2.3 3.8 3.7 4.3 4.0 3.4 2.3 50 percent or more ........................................................................................................ 2.1 2.9 2.5 3.2 2.9 2.3 1.8 Percent of students eligible for free or reduced-priced lunch Less than 35 percent ..................................................................................................... 2.5 3.4 2.8 3.4 3.7 2.3 2.8 35 to 49 percent ............................................................................................................ 3.2 4.7 4.0 5.0 4.7 4.2 2.3 50 to 74 percent ............................................................................................................ 2.5 3.3 3.4 3.7 3.6 3.2 1.8 75 percent or more ........................................................................................................ 2.8 4.2 3.3 4.3 4.3 2.9 2.5 † Not applicable. SOURCE: U.S. Department of Education, National Center for Education Statistics, Fast Response Survey System (FRSS), “Condition of Public School Facilities: 2012–13,” FRSS 105, 2013.
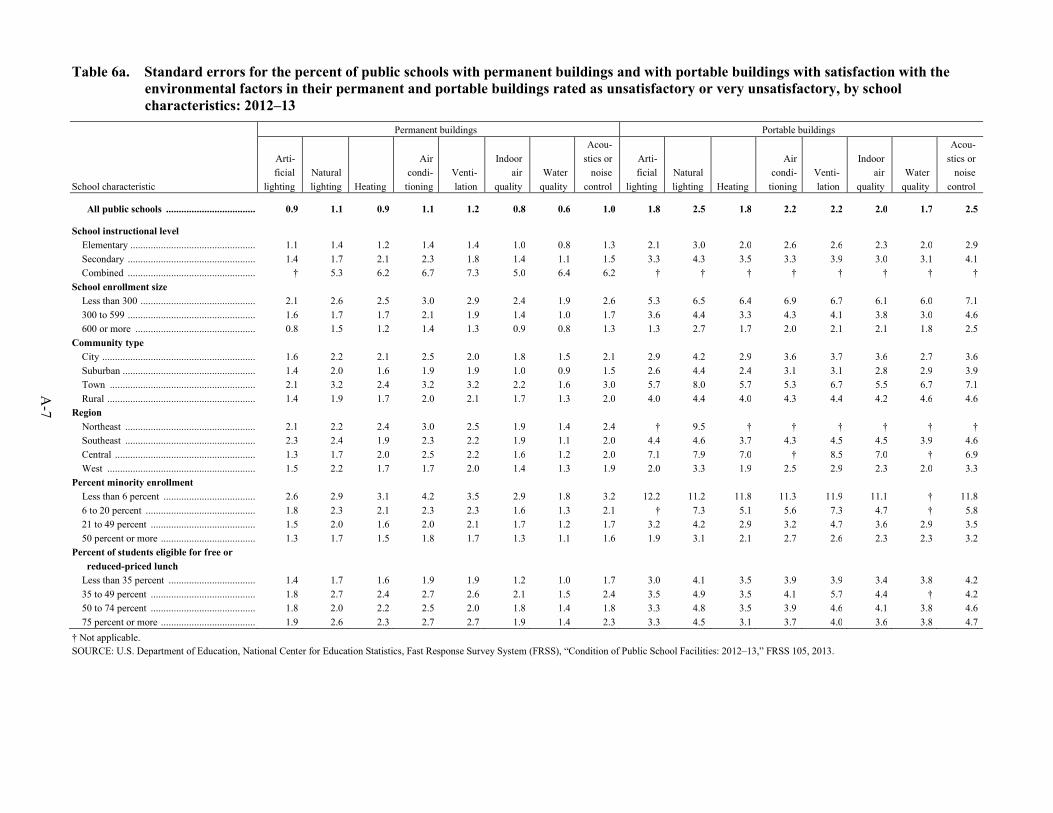
A-7
Table 6a. Standard errors for the percent of public schools with permanent buildings and with portable buildings with satisfaction with the environmental factors in their permanent and portable buildings rated as unsatisfactory or very unsatisfactory, by school characteristics: 2012–13
School characteristic
Permanent buildings Portable buildings
Arti-ficial
lighting Natural lighting Heating
Air condi-
tioning Venti-lation
Indoor air
quality Water
quality
Acou-stics or
noise control
Arti-ficial
lighting Natural lighting Heating
Air condi-
tioning Venti-lation
Indoor air
quality Water
quality
Acou-stics or
noise control
All public schools ................................... 0.9 1.1 0.9 1.1 1.2 0.8 0.6 1.0 1.8 2.5 1.8 2.2 2.2 2.0 1.7 2.5
School instructional level Elementary ................................................. 1.1 1.4 1.2 1.4 1.4 1.0 0.8 1.3 2.1 3.0 2.0 2.6 2.6 2.3 2.0 2.9 Secondary .................................................. 1.4 1.7 2.1 2.3 1.8 1.4 1.1 1.5 3.3 4.3 3.5 3.3 3.9 3.0 3.1 4.1 Combined .................................................. † 5.3 6.2 6.7 7.3 5.0 6.4 6.2 † † † † † † † † School enrollment size Less than 300 ............................................. 2.1 2.6 2.5 3.0 2.9 2.4 1.9 2.6 5.3 6.5 6.4 6.9 6.7 6.1 6.0 7.1 300 to 599 .................................................. 1.6 1.7 1.7 2.1 1.9 1.4 1.0 1.7 3.6 4.4 3.3 4.3 4.1 3.8 3.0 4.6 600 or more ............................................... 0.8 1.5 1.2 1.4 1.3 0.9 0.8 1.3 1.3 2.7 1.7 2.0 2.1 2.1 1.8 2.5 Community type City ............................................................ 1.6 2.2 2.1 2.5 2.0 1.8 1.5 2.1 2.9 4.2 2.9 3.6 3.7 3.6 2.7 3.6 Suburban .................................................... 1.4 2.0 1.6 1.9 1.9 1.0 0.9 1.5 2.6 4.4 2.4 3.1 3.1 2.8 2.9 3.9 Town ......................................................... 2.1 3.2 2.4 3.2 3.2 2.2 1.6 3.0 5.7 8.0 5.7 5.3 6.7 5.5 6.7 7.1 Rural .......................................................... 1.4 1.9 1.7 2.0 2.1 1.7 1.3 2.0 4.0 4.4 4.0 4.3 4.4 4.2 4.6 4.6 Region Northeast ................................................... 2.1 2.2 2.4 3.0 2.5 1.9 1.4 2.4 † 9.5 † † † † † † Southeast ................................................... 2.3 2.4 1.9 2.3 2.2 1.9 1.1 2.0 4.4 4.6 3.7 4.3 4.5 4.5 3.9 4.6 Central ....................................................... 1.3 1.7 2.0 2.5 2.2 1.6 1.2 2.0 7.1 7.9 7.0 † 8.5 7.0 † 6.9 West .......................................................... 1.5 2.2 1.7 1.7 2.0 1.4 1.3 1.9 2.0 3.3 1.9 2.5 2.9 2.3 2.0 3.3 Percent minority enrollment
Less than 6 percent .................................... 2.6 2.9 3.1 4.2 3.5 2.9 1.8 3.2 12.2 11.2 11.8 11.3 11.9 11.1 † 11.8 6 to 20 percent ........................................... 1.8 2.3 2.1 2.3 2.3 1.6 1.3 2.1 † 7.3 5.1 5.6 7.3 4.7 † 5.8 21 to 49 percent ......................................... 1.5 2.0 1.6 2.0 2.1 1.7 1.2 1.7 3.2 4.2 2.9 3.2 4.7 3.6 2.9 3.5 50 percent or more ..................................... 1.3 1.7 1.5 1.8 1.7 1.3 1.1 1.6 1.9 3.1 2.1 2.7 2.6 2.3 2.3 3.2 Percent of students eligible for free or reduced-priced lunch Less than 35 percent .................................. 1.4 1.7 1.6 1.9 1.9 1.2 1.0 1.7 3.0 4.1 3.5 3.9 3.9 3.4 3.8 4.2 35 to 49 percent ......................................... 1.8 2.7 2.4 2.7 2.6 2.1 1.5 2.4 3.5 4.9 3.5 4.1 5.7 4.4 † 4.2 50 to 74 percent ......................................... 1.8 2.0 2.2 2.5 2.0 1.8 1.4 1.8 3.3 4.8 3.5 3.9 4.6 4.1 3.8 4.6 75 percent or more ..................................... 1.9 2.6 2.3 2.7 2.7 1.9 1.4 2.3 3.3 4.5 3.1 3.7 4.0 3.6 3.8 4.7 † Not applicable. SOURCE: U.S. Department of Education, National Center for Education Statistics, Fast Response Survey System (FRSS), “Condition of Public School Facilities: 2012–13,” FRSS 105, 2013.

A-8
Table 7a. Standard errors for the percent of public schools with a written long-range educational facilities plan for the school, with repair, renovation, or modernization work currently being performed, and with construction projects planned for the school in the next 2 years, by school characteristics: 2012–13
School characteristic School has long-range written facilities plan
Major repairs, renovations, or modernization work
currently being performed
Construction projects planned
Build new permanent buildings/additions
Major repairs/renovations/ modernization of existing
permanent buildings
All public schools ................................................................................................................ 1.5 1.0 0.8 1.3
School instructional level Elementary .............................................................................................................................. 1.7 1.2 1.0 1.7 Secondary ............................................................................................................................... 2.6 1.9 1.3 2.4 Combined ............................................................................................................................... 7.5 6.7 6.3 7.5 School enrollment size Less than 300 .......................................................................................................................... 3.6 2.2 2.1 3.1 300 to 599 ............................................................................................................................... 2.3 1.5 1.3 2.3 600 or more ............................................................................................................................ 1.6 1.5 1.1 1.6 Community type City ......................................................................................................................................... 2.9 2.1 1.5 2.7 Suburban ................................................................................................................................. 2.5 2.0 1.4 2.5 Town ...................................................................................................................................... 3.3 3.1 2.3 3.6 Rural ....................................................................................................................................... 2.5 1.7 1.4 2.2 Region Northeast ................................................................................................................................ 3.3 2.2 1.6 3.2 Southeast ................................................................................................................................ 2.7 1.7 1.7 2.9 Central .................................................................................................................................... 2.9 2.1 1.6 2.8 West ....................................................................................................................................... 2.4 1.7 1.4 2.2 Percent minority enrollment
Less than 6 percent ................................................................................................................. 4.9 2.7 2.0 3.9 6 to 20 percent ........................................................................................................................ 2.8 2.1 1.7 2.4 21 to 49 percent ...................................................................................................................... 2.9 2.2 1.6 2.6 50 percent or more .................................................................................................................. 2.2 1.6 1.3 2.2 Percent of students eligible for free or reduced-priced lunch Less than 35 percent ............................................................................................................... 2.5 1.9 1.4 2.3 35 to 49 percent ...................................................................................................................... 3.7 2.3 1.8 3.2 50 to 74 percent ...................................................................................................................... 2.4 1.9 1.4 2.3 75 percent or more .................................................................................................................. 3.4 2.3 1.7 3.1 SOURCE: U.S. Department of Education, National Center for Education Statistics, Fast Response Survey System (FRSS), “Condition of Public School Facilities: 2012–13,” FRSS 105, 2013.
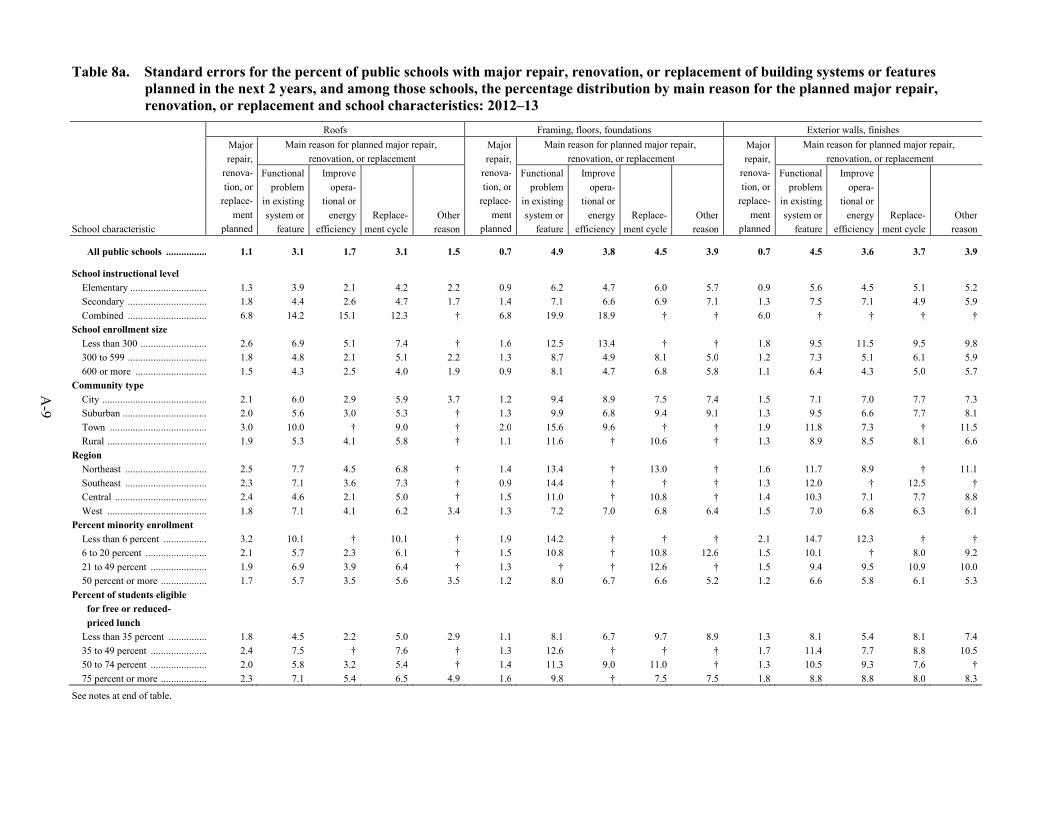
A-9
Table 8a. Standard errors for the percent of public schools with major repair, renovation, or replacement of building systems or features planned in the next 2 years, and among those schools, the percentage distribution by main reason for the planned major repair, renovation, or replacement and school characteristics: 2012–13
School characteristic
Roofs Framing, floors, foundations Exterior walls, finishes Major repair,
renova-tion, or
replace-ment
planned
Main reason for planned major repair, renovation, or replacement
Major repair,
renova-tion, or
replace-ment
planned
Main reason for planned major repair, renovation, or replacement
Major repair,
renova-tion, or
replace-ment
planned
Main reason for planned major repair, renovation, or replacement
Functional problem
in existing system or
feature
Improve opera-
tional or energy
efficiency Replace-
ment cycle Other
reason
Functional problem
in existing system or
feature
Improve opera-
tional or energy
efficiency Replace-
ment cycle Other
reason
Functional problem
in existing system or
feature
Improve opera-
tional or energy
efficiency Replace-
ment cycle Other
reason
All public schools ................ 1.1 3.1 1.7 3.1 1.5 0.7 4.9 3.8 4.5 3.9 0.7 4.5 3.6 3.7 3.9
School instructional level Elementary .............................. 1.3 3.9 2.1 4.2 2.2 0.9 6.2 4.7 6.0 5.7 0.9 5.6 4.5 5.1 5.2 Secondary ............................... 1.8 4.4 2.6 4.7 1.7 1.4 7.1 6.6 6.9 7.1 1.3 7.5 7.1 4.9 5.9 Combined ............................... 6.8 14.2 15.1 12.3 † 6.8 19.9 18.9 † † 6.0 † † † † School enrollment size Less than 300 .......................... 2.6 6.9 5.1 7.4 † 1.6 12.5 13.4 † † 1.8 9.5 11.5 9.5 9.8 300 to 599 ............................... 1.8 4.8 2.1 5.1 2.2 1.3 8.7 4.9 8.1 5.0 1.2 7.3 5.1 6.1 5.9 600 or more ............................ 1.5 4.3 2.5 4.0 1.9 0.9 8.1 4.7 6.8 5.8 1.1 6.4 4.3 5.0 5.7 Community type City ......................................... 2.1 6.0 2.9 5.9 3.7 1.2 9.4 8.9 7.5 7.4 1.5 7.1 7.0 7.7 7.3 Suburban ................................. 2.0 5.6 3.0 5.3 † 1.3 9.9 6.8 9.4 9.1 1.3 9.5 6.6 7.7 8.1 Town ...................................... 3.0 10.0 † 9.0 † 2.0 15.6 9.6 † † 1.9 11.8 7.3 † 11.5 Rural ....................................... 1.9 5.3 4.1 5.8 † 1.1 11.6 † 10.6 † 1.3 8.9 8.5 8.1 6.6 Region Northeast ................................ 2.5 7.7 4.5 6.8 † 1.4 13.4 † 13.0 † 1.6 11.7 8.9 † 11.1 Southeast ................................ 2.3 7.1 3.6 7.3 † 0.9 14.4 † † † 1.3 12.0 † 12.5 † Central .................................... 2.4 4.6 2.1 5.0 † 1.5 11.0 † 10.8 † 1.4 10.3 7.1 7.7 8.8 West ....................................... 1.8 7.1 4.1 6.2 3.4 1.3 7.2 7.0 6.8 6.4 1.5 7.0 6.8 6.3 6.1 Percent minority enrollment
Less than 6 percent ................. 3.2 10.1 † 10.1 † 1.9 14.2 † † † 2.1 14.7 12.3 † † 6 to 20 percent ........................ 2.1 5.7 2.3 6.1 † 1.5 10.8 † 10.8 12.6 1.5 10.1 † 8.0 9.2 21 to 49 percent ...................... 1.9 6.9 3.9 6.4 † 1.3 † † 12.6 † 1.5 9.4 9.5 10.9 10.0 50 percent or more .................. 1.7 5.7 3.5 5.6 3.5 1.2 8.0 6.7 6.6 5.2 1.2 6.6 5.8 6.1 5.3 Percent of students eligible for free or reduced- priced lunch Less than 35 percent ............... 1.8 4.5 2.2 5.0 2.9 1.1 8.1 6.7 9.7 8.9 1.3 8.1 5.4 8.1 7.4 35 to 49 percent ...................... 2.4 7.5 † 7.6 † 1.3 12.6 † † † 1.7 11.4 7.7 8.8 10.5 50 to 74 percent ...................... 2.0 5.8 3.2 5.4 † 1.4 11.3 9.0 11.0 † 1.3 10.5 9.3 7.6 † 75 percent or more .................. 2.3 7.1 5.4 6.5 4.9 1.6 9.8 † 7.5 7.5 1.8 8.8 8.8 8.0 8.3
See notes at end of table.

A-10
Table 8a. Standard errors for the percent of public schools with major repair, renovation, or replacement of building systems or features planned in the next 2 years, and among those schools, the percentage distribution by main reason for the planned major repair, renovation, or replacement and school characteristics: 2012–13—Continued
School characteristic
Windows, doors Interior finishes, trim Plumbing/lavatories Major repair,
renova-tion, or
replace-ment
planned
Main reason for planned major repair, renovation, or replacement
Major repair,
renova-tion, or
replace-ment
planned
Main reason for planned major repair, renovation, or replacement
Major repair,
renova-tion, or
replace-ment
planned
Main reason for planned major repair, renovation, or replacement
Functional problem
in existing system or
feature
Improve opera-
tional or energy
efficiency Replace-
ment cycle Other
reason
Functional problem
in existing system or
feature
Improve opera-
tional or energy
efficiency Replace-
ment cycle Other
reason
Functional problem
in existing system or
feature
Improve opera-
tional or energy
efficiency Replace-
ment cycle Other
reason
All public schools ................ 0.9 3.4 3.9 2.6 2.3 0.8 3.1 3.2 3.9 3.0 1.0 3.7 3.8 3.1 2.5
School instructional level Elementary .............................. 1.1 4.5 4.7 3.4 2.9 1.0 3.7 3.7 5.1 4.0 1.2 4.6 4.7 4.4 3.5 Secondary ............................... 2.1 4.8 6.1 3.8 3.3 1.5 5.3 6.2 5.1 5.7 1.8 3.8 5.9 5.0 4.1 Combined ............................... 6.7 16.8 16.8 † † 6.8 † 16.4 15.3 † 7.2 16.6 15.0 † † School enrollment size Less than 300 .......................... 2.4 6.6 8.4 5.3 5.2 1.9 † 9.6 10.4 10.5 1.8 10.9 10.2 7.6 7.9 300 to 599 ............................... 1.5 5.3 5.5 4.5 3.1 1.3 5.1 4.4 6.4 4.7 1.6 5.3 5.7 5.1 3.7 600 or more ............................ 1.3 5.2 5.5 4.2 3.5 1.2 5.0 4.2 5.5 3.8 1.3 4.0 4.7 4.9 4.0 Community type City ......................................... 2.1 5.4 6.7 6.7 5.1 1.7 5.5 5.4 7.6 6.5 2.0 7.0 6.4 6.7 4.5 Suburban ................................. 1.8 7.0 7.2 5.8 4.8 1.6 6.1 5.2 6.9 5.7 1.9 6.1 6.9 4.8 5.6 Town ...................................... 2.7 9.6 9.8 † 6.3 2.3 11.5 10.9 10.8 † 2.4 7.9 9.6 7.7 † Rural ....................................... 1.8 6.3 7.1 3.9 † 1.3 5.7 6.2 7.7 6.2 1.5 7.2 7.7 6.5 4.8 Region Northeast ................................ 2.5 8.3 8.2 5.8 † 1.9 7.9 6.5 9.9 9.8 2.0 9.8 7.7 6.8 9.3 Southeast ................................ 1.7 8.4 8.5 6.7 † 2.0 6.9 6.1 9.4 † 1.9 8.3 7.8 7.8 † Central .................................... 2.1 6.0 7.8 4.8 3.7 1.7 6.7 4.8 7.9 7.1 1.9 7.9 8.3 6.7 4.7 West ....................................... 1.7 6.3 6.6 4.5 4.6 1.4 4.7 6.8 6.6 5.5 1.5 4.8 5.7 4.7 4.1 Percent minority enrollment
Less than 6 percent ................. 3.2 8.5 8.5 † † 2.5 12.2 8.5 11.0 11.3 2.4 12.6 10.2 † † 6 to 20 percent ........................ 2.1 7.6 8.9 3.7 5.3 1.5 7.8 † 9.5 9.4 1.7 7.9 7.7 7.0 7.0 21 to 49 percent ...................... 2.1 7.2 8.4 7.2 † 1.9 5.8 5.5 7.7 † 1.9 6.0 8.1 6.3 6.2 50 percent or more .................. 1.5 5.0 5.7 4.7 3.8 1.4 4.7 5.2 6.3 3.8 1.7 5.1 5.5 4.8 3.2 Percent of students eligible for free or reduced- priced lunch Less than 35 percent ............... 1.8 6.2 6.9 4.9 4.8 1.6 5.4 4.8 6.9 5.9 1.8 7.4 5.7 5.8 5.5 35 to 49 percent ...................... 2.2 7.7 9.2 5.5 † 1.7 6.2 † 9.0 8.4 2.0 8.6 8.0 7.6 6.6 50 to 74 percent ...................... 1.9 7.5 7.3 4.4 † 1.7 7.0 5.7 7.8 5.8 1.7 6.1 7.6 6.3 † 75 percent or more .................. 2.2 6.4 8.0 6.6 4.9 1.9 5.8 8.0 9.0 5.7 2.2 6.5 7.6 7.3 4.9
See notes at end of table.

A-11
Table 8a. Standard errors for the percent of public schools with major repair, renovation, or replacement of building systems or features planned in the next 2 years, and among those schools, the percentage distribution by main reason for the planned major repair, renovation, or replacement and school characteristics: 2012–13—Continued
School characteristic
Heating system Air conditioning system Ventilation/filtration system Major repair,
renova-tion, or
replace-ment
planned
Main reason for planned major repair, renovation, or replacement
Major repair,
renova-tion, or
replace-ment
planned
Main reason for planned major repair, renovation, or replacement
Major repair,
renova-tion, or
replace-ment
planned
Main reason for planned major repair, renovation, or replacement
Functional problem
in existing system or
feature
Improve opera-
tional or energy
efficiency Replace-
ment cycle Other
reason
Functional problem
in existing system or
feature
Improve opera-
tional or energy
efficiency Replace-
ment cycle Other
reason
Functional problem
in existing system or
feature
Improve opera-
tional or energy
efficiency Replace-
ment cycle Other
reason
All public schools ................ 1.1 2.9 3.1 2.9 1.7 1.1 3.5 3.5 2.8 1.5 0.8 4.3 4.3 3.4 2.4
School instructional level Elementary .............................. 1.2 3.7 3.7 4.0 2.7 1.3 4.4 4.6 3.9 2.2 0.9 5.6 5.3 5.0 3.5 Secondary ............................... 2.1 4.7 5.4 4.4 † 2.2 4.9 5.0 3.6 1.8 1.7 5.6 6.1 3.0 2.4 Combined ............................... 6.8 14.0 14.1 † † 5.2 † 19.0 † † 4.3 † 19.2 † † School enrollment size Less than 300 .......................... 2.6 6.8 8.3 6.6 † 2.7 9.4 10.2 † † 2.1 8.9 11.2 † † 300 to 599 ............................... 1.7 5.0 4.9 4.9 3.0 2.0 5.2 5.7 4.7 † 1.4 7.1 6.2 5.6 3.9 600 or more ............................ 1.4 3.3 5.1 5.2 2.5 1.4 3.6 4.8 4.5 2.7 1.2 4.3 5.4 5.2 3.0 Community type City ......................................... 2.0 6.1 6.8 6.5 † 2.4 6.2 7.4 6.0 † 1.6 7.4 8.4 5.7 † Suburban ................................. 1.9 6.0 5.4 6.0 3.5 2.0 6.7 5.7 5.6 3.4 1.6 7.5 7.2 7.0 4.9 Town ...................................... 2.5 8.8 9.6 8.4 † 2.7 10.4 11.1 9.6 † 2.6 13.5 10.5 11.6 † Rural ....................................... 1.8 6.0 6.8 5.1 † 1.9 6.4 7.1 5.9 † 1.5 7.3 7.8 6.4 † Region Northeast ................................ 2.6 5.9 8.4 7.1 † 2.4 9.2 10.2 † † 2.1 9.0 9.3 7.8 † Southeast ................................ 2.0 7.5 7.1 6.9 † 2.1 7.9 6.9 5.7 † 2.0 9.2 9.3 7.8 † Central .................................... 2.0 7.0 7.7 6.7 † 2.2 7.9 7.8 6.5 † 1.7 10.2 9.1 7.1 † West ....................................... 1.6 4.9 5.7 5.0 3.5 1.8 5.0 5.6 5.0 3.1 1.4 6.1 6.4 5.6 4.1 Percent minority enrollment
Less than 6 percent ................. 3.4 9.5 10.3 † † 3.5 11.3 11.3 † † 3.5 10.0 10.9 † † 6 to 20 percent ........................ 1.9 6.7 6.4 6.6 † 1.9 6.0 7.9 8.0 † 1.8 7.8 7.1 7.5 † 21 to 49 percent ...................... 2.2 3.3 6.3 6.4 † 2.2 7.2 7.1 5.1 † 1.6 6.6 9.1 7.9 † 50 percent or more .................. 1.7 5.0 5.3 5.1 3.0 1.8 5.0 5.4 4.7 2.4 1.4 6.1 6.6 5.4 3.9 Percent of students eligible for free or reduced- priced lunch Less than 35 percent ............... 1.7 5.3 5.0 5.4 3.8 1.7 6.0 5.9 6.0 † 1.4 6.5 6.1 6.7 † 35 to 49 percent ...................... 2.0 8.1 8.1 7.9 † 2.6 7.9 8.0 6.4 † 1.9 10.8 10.0 8.8 † 50 to 74 percent ...................... 1.9 5.3 6.8 5.5 † 2.3 6.2 6.4 5.9 † 1.5 7.4 8.3 6.8 † 75 percent or more .................. 2.2 7.6 7.6 6.4 † 2.5 7.7 7.5 5.9 4.4 1.7 10.7 10.1 † 7.3
See notes at end of table.

A-12
Table 8a. Standard errors for the percent of public schools with major repair, renovation, or replacement of building systems or features planned in the next 2 years, and among those schools, the percentage distribution by main reason for the planned major repair, renovation, or replacement and school characteristics: 2012–13—Continued
School characteristic
Electrical system Interior lighting Exterior lighting Major repair,
renova-tion, or
replace-ment
planned
Main reason for planned major repair, renovation, or replacement
Major repair,
renova-tion, or
replace-ment
planned
Main reason for planned major repair, renovation, or replacement
Major repair,
renova-tion, or
replace-ment
planned
Main reason for planned major repair, renovation, or replacement
Functional problem
in existing system or
feature
Improve opera-
tional or energy
efficiency Replace-
ment cycle Other
reason
Functional problem
in existing system or
feature
Improve opera-
tional or energy
efficiency Replace-
ment cycle Other
reason
Functional problem
in existing system or
feature
Improve opera-
tional or energy
efficiency Replace-
ment cycle Other
reason
All public schools ................ 0.8 4.0 4.5 3.5 3.2 0.9 2.6 3.9 2.0 2.3 0.8 3.5 4.7 3.0 3.2
School instructional level Elementary .............................. 0.9 5.0 6.0 4.9 4.2 1.1 3.4 4.9 2.6 2.9 1.0 4.6 5.9 3.9 3.8 Secondary ............................... 1.4 5.8 7.7 4.5 5.4 1.4 3.8 5.6 2.8 † 1.3 5.8 6.9 3.9 † Combined ............................... 6.1 † 19.2 † † 6.5 † 17.7 † † 6.0 † 17.2 † † School enrollment size Less than 300 .......................... 1.9 10.1 11.2 † 8.9 2.1 † 8.4 † † 1.9 † 11.8 † † 300 to 599 ............................... 1.3 6.7 7.0 6.3 5.0 1.6 4.4 5.7 3.2 3.6 1.6 6.2 7.6 4.6 4.4 600 or more ............................ 1.0 5.3 6.3 5.0 3.7 1.2 3.3 5.3 3.8 3.5 1.0 3.8 6.1 5.1 4.0 Community type City ......................................... 1.5 8.2 7.1 8.3 † 1.9 4.5 7.2 5.5 † 1.5 5.2 9.2 8.6 † Suburban ................................. 1.6 7.6 8.5 5.7 6.2 1.7 5.3 7.4 3.4 4.9 1.5 6.3 8.8 † 6.1 Town ...................................... 2.1 12.3 13.5 9.2 † 2.3 9.5 11.2 † † 2.1 14.2 13.9 † † Rural ....................................... 1.4 8.4 9.7 7.5 7.0 1.6 † 6.1 3.5 † 1.6 7.2 8.5 6.2 † Region Northeast ................................ 1.9 9.8 11.1 † † 2.4 6.1 9.5 † † 2.1 † 11.6 6.5 † Southeast ................................ 1.8 8.9 7.9 9.4 † 1.9 6.0 8.2 6.4 † 1.8 8.7 10.9 8.4 † Central .................................... 1.4 10.1 9.5 7.6 † 1.7 † 8.3 † † 1.5 † 10.5 † † West ....................................... 1.3 5.8 7.0 6.5 5.6 1.6 4.3 5.9 3.3 4.0 1.4 6.7 7.0 3.9 4.6 Percent minority enrollment
Less than 6 percent ................. 2.5 14.1 14.1 † † 3.0 8.5 10.4 † † 2.3 † 16.5 † † 6 to 20 percent ........................ 1.5 8.0 7.7 10.3 9.3 1.5 † 9.6 † 7.6 1.6 7.8 10.0 7.2 † 21 to 49 percent ...................... 1.7 9.5 9.6 7.8 † 2.0 † 6.4 3.3 † 1.7 7.4 9.0 5.7 † 50 percent or more .................. 1.3 6.0 6.3 5.9 5.2 1.5 4.4 6.1 4.2 3.1 1.5 5.8 7.4 5.2 3.7 Percent of students eligible for free or reduced- priced lunch Less than 35 percent ............... 1.5 6.2 7.4 7.0 † 1.6 4.4 7.1 4.3 4.6 1.6 5.5 7.8 5.1 5.7 35 to 49 percent ...................... 1.6 12.9 11.1 † † 1.9 † 8.6 † † 1.7 † 10.9 † † 50 to 74 percent ...................... 1.3 8.2 9.6 7.5 † 1.7 5.4 5.9 3.2 † 1.2 9.9 10.2 7.5 † 75 percent or more .................. 1.7 8.3 9.4 7.5 7.7 2.1 6.5 8.4 † 5.4 1.8 8.1 10.2 † †
See notes at end of table.

A-13
Table 8a. Standard errors for the percent of public schools with major repair, renovation, or replacement of building systems or features planned in the next 2 years, and among those schools, the percentage distribution by main reason for the planned major repair, renovation, or replacement and school characteristics: 2012–13—Continued
School characteristic
Energy management system Life safety features Security systems Major repair,
renova-tion, or
replace-ment
planned
Main reason for planned major repair, renovation, or replacement
Major repair,
renova-tion, or
replace-ment
planned
Main reason for planned major repair, renovation, or replacement
Major repair,
renova-tion, or
replace-ment
planned
Main reason for planned major repair, renovation, or replacement
Functional problem
in existing system or
feature
Improve opera-
tional or energy
efficiency Replace-
ment cycle Other
reason
Functional problem
in existing system or
feature
Improve opera-
tional or energy
efficiency Replace-
ment cycle Other
reason
Functional problem
in existing system or
feature
Improve opera-
tional or energy
efficiency Replace-
ment cycle Other
reason
All public schools ................ 0.9 2.4 3.6 2.7 2.0 0.8 3.7 4.2 3.0 3.5 1.2 2.8 3.0 1.8 3.0
School instructional level Elementary .............................. 1.2 3.2 4.5 3.5 2.6 1.0 4.4 4.9 4.0 4.2 1.5 3.5 3.7 2.3 3.9 Secondary ............................... 1.9 4.1 6.0 4.3 4.1 1.5 5.8 6.9 4.9 5.5 1.9 4.4 5.5 3.1 4.3 Combined ............................... 7.9 † 14.8 † † 5.8 † 22.4 † † 7.4 † 12.3 † † School enrollment size Less than 300 .......................... 2.3 † 8.0 † † 1.9 † 11.1 † 13.4 3.2 5.2 6.6 † 6.4 300 to 599 ............................... 1.7 4.2 5.3 4.2 3.0 1.6 5.5 5.9 4.8 4.4 1.9 4.3 4.7 3.1 4.8 600 or more ............................ 1.2 3.5 5.3 3.8 3.1 1.1 4.6 5.6 5.0 4.3 1.4 4.0 4.7 3.2 3.3 Community type City ......................................... 2.0 5.9 8.7 5.6 † 1.6 7.5 8.3 7.5 † 2.1 5.7 7.2 5.1 6.9 Suburban ................................. 1.9 † 7.3 6.2 4.8 1.8 7.8 7.6 6.6 5.8 2.0 4.7 6.2 2.5 5.5 Town ...................................... 2.9 7.9 10.3 5.1 † 2.7 7.7 8.5 8.7 6.7 3.1 7.5 7.6 † 4.2 Rural ....................................... 1.9 4.2 5.6 5.0 † 1.5 6.6 8.1 6.0 8.2 2.2 4.6 5.3 3.1 4.8 Region Northeast ................................ 2.9 † 8.5 7.2 † 2.1 11.2 11.2 † 10.8 2.6 6.6 8.0 4.2 8.1 Southeast ................................ 2.1 7.4 8.0 5.9 † 1.8 8.6 8.2 8.9 † 2.2 6.7 6.3 5.1 5.8 Central .................................... 2.0 5.7 6.5 5.4 † 1.9 6.8 8.1 6.8 7.4 2.6 5.0 5.7 3.3 5.6 West ....................................... 1.6 3.2 6.1 4.3 4.6 1.4 5.2 6.8 4.6 4.4 1.9 3.8 5.3 2.7 4.3 Percent minority enrollment
Less than 6 percent ................. 3.2 11.5 12.3 † † 2.6 12.5 10.8 † † 3.9 8.1 8.8 † 8.8 6 to 20 percent ........................ 2.2 4.2 6.4 5.7 † 1.9 7.4 8.0 6.1 7.4 2.6 5.9 6.9 4.1 5.3 21 to 49 percent ...................... 2.0 † 8.0 6.0 † 1.8 8.5 9.4 6.7 7.7 2.4 5.3 6.1 3.2 5.4 50 percent or more .................. 1.6 3.5 5.8 3.7 3.4 1.4 3.7 6.8 5.9 4.9 1.6 4.2 5.9 3.5 5.3 Percent of students eligible for free or reduced- priced lunch Less than 35 percent ............... 1.9 4.4 6.8 5.8 † 1.8 6.2 6.9 6.0 6.0 2.2 3.8 5.2 3.6 4.7 35 to 49 percent ...................... 2.0 † 8.4 6.7 † 2.0 9.4 7.9 6.2 8.1 2.7 7.7 7.2 † 6.9 50 to 74 percent ...................... 1.9 5.7 6.3 3.4 † 1.8 6.3 8.2 6.2 6.7 2.2 4.9 5.7 3.0 4.8 75 percent or more .................. 2.0 5.2 8.4 † 5.3 1.7 4.7 9.6 8.6 7.2 2.3 6.1 8.0 † 6.6
See notes at end of table.

A-14
Table 8a. Standard errors for the percent of public schools with major repair, renovation, or replacement of building systems or features planned in the next 2 years, and among those schools, the percentage distribution by main reason for the planned major repair, renovation, or replacement and school characteristics: 2012–13—Continued
School characteristic
Internal communication systems Technology infrastructure Major repair,
renova-tion, or
replace-ment
planned
Main reason for planned major repair, renovation, or replacement
Major repair,
renova-tion, or
replace-ment
planned
Main reason for planned major repair, renovation, or replacement
Functional problem
in existing system or
feature
Improve opera-
tional or energy
efficiency Replace-
ment cycle Other
reason
Functional problem
in existing system or
feature
Improve opera-
tional or energy
efficiency Replace-
ment cycle Other
reason
All public schools ..................................................................................................................... 1.0 3.3 3.5 3.1 2.7 1.0 2.4 3.3 2.6 2.0
School instructional level Elementary ................................................................................................................................... 1.2 4.2 4.7 4.2 3.5 1.2 3.0 4.2 3.4 2.7 Secondary .................................................................................................................................... 2.1 5.5 6.9 3.8 4.6 2.2 4.1 5.0 3.4 2.9 Combined .................................................................................................................................... 7.0 18.4 18.4 † † 7.4 † 14.0 † † School enrollment size Less than 300 ............................................................................................................................... 2.5 6.9 7.3 5.4 6.7 2.8 5.8 6.8 5.6 4.0 300 to 599 .................................................................................................................................... 1.7 5.2 5.9 5.6 3.4 1.7 3.6 4.9 4.1 3.4 600 or more ................................................................................................................................. 1.3 4.3 5.4 4.6 3.9 1.4 2.6 4.7 4.0 3.1 Community type City .............................................................................................................................................. 2.0 6.4 7.3 6.4 6.2 2.1 5.0 6.5 5.5 4.3 Suburban ...................................................................................................................................... 1.7 5.9 8.1 5.2 5.7 2.1 4.1 6.5 4.5 4.5 Town ........................................................................................................................................... 2.6 6.7 9.1 9.3 † 2.8 5.6 7.3 4.6 † Rural ............................................................................................................................................ 1.7 6.2 7.0 5.7 4.8 2.0 4.7 5.3 5.1 3.6 Region Northeast ..................................................................................................................................... 2.2 12.0 10.4 † † 2.8 7.9 8.2 7.1 6.5 Southeast ..................................................................................................................................... 2.1 8.3 7.8 8.2 † 2.4 6.1 6.9 5.7 4.0 Central ......................................................................................................................................... 2.1 6.2 7.6 5.7 5.1 2.2 4.8 6.1 5.3 3.4 West ............................................................................................................................................ 1.7 4.3 5.6 5.7 4.3 1.7 3.2 5.1 4.2 3.1 Percent minority enrollment
Less than 6 percent ...................................................................................................................... 3.4 9.7 10.7 † † 3.6 9.2 7.8 8.5 † 6 to 20 percent ............................................................................................................................. 1.8 5.8 8.5 7.9 6.3 1.9 4.6 6.1 5.6 3.6 21 to 49 percent ........................................................................................................................... 2.1 6.5 8.6 5.6 6.5 2.1 4.5 6.0 4.1 4.2 50 percent or more ....................................................................................................................... 1.6 5.0 5.6 5.1 3.6 1.8 3.6 5.5 4.1 3.2 Percent of students eligible for free or reduced-priced lunch Less than 35 percent .................................................................................................................... 1.8 5.2 6.3 6.2 4.8 2.0 3.8 4.9 5.1 3.7 35 to 49 percent ........................................................................................................................... 2.1 8.0 9.5 † † 2.6 5.9 7.3 6.0 4.5 50 to 74 percent ........................................................................................................................... 1.8 6.3 7.5 6.5 5.3 2.1 4.6 6.6 5.4 2.9 75 percent or more ....................................................................................................................... 2.5 7.0 7.1 6.3 5.5 2.6 5.3 6.5 4.8 4.8 † Not applicable. SOURCE: U.S. Department of Education, National Center for Education Statistics, Fast Response Survey System (FRSS), “Condition of Public School Facilities: 2012–13,” FRSS 105, 2013.

A-15
Table 9a. Standard errors for the percent of public schools with inspection and evaluation performed by qualified professionals within the last 5 years, and the percent of public schools in which various steps had been taken within the last 5 years to improve energy efficiency at the school, by school characteristics: 2012–13
School characteristic
Inspection and evaluation performed by qualified professionals Steps to improve energy efficiency
Inspection of the
condition of the physical
features of the facility
Evaluation of energy
use
Evaluation of indoor
environ-mental
hazards
Replaced lighting fixtures, lighting
ballasts, or bulbs
Installed motion
sensors for lighting
Upgraded insulation,
outer walls, and/or siding
(building envelopes)
Replaced windows
and/or doors
Installed or upgraded a
reflective roof coating
Installed more
efficient HVAC
systems
Installed or upgraded an
energy management
system
All public schools ........................................................................ 1.1 1.3 1.2 1.2 1.4 0.9 1.2 1.2 1.2 1.2
School instructional level Elementary ...................................................................................... 1.3 1.6 1.4 1.5 1.7 1.1 1.5 1.4 1.5 1.6 Secondary ....................................................................................... 1.7 2.2 2.0 2.1 2.6 2.0 2.3 1.9 2.3 2.4 Combined ....................................................................................... 6.1 6.2 6.2 6.1 7.8 7.1 7.7 6.2 7.3 6.7 School enrollment size Less than 300 .................................................................................. 2.4 3.0 2.8 3.0 3.0 2.1 2.6 2.4 2.5 2.7 300 to 599 ....................................................................................... 1.6 2.0 1.8 2.1 2.4 1.5 2.1 2.0 2.1 1.9 600 or more .................................................................................... 1.5 1.7 1.6 1.9 2.1 1.4 1.8 1.6 1.8 1.9 Community type City ................................................................................................. 1.7 2.7 2.3 2.8 2.8 2.0 2.7 2.2 2.4 2.7 Suburban ......................................................................................... 1.8 2.4 2.1 2.5 2.6 1.5 2.2 1.9 2.2 2.5 Town .............................................................................................. 2.8 3.7 3.0 3.5 3.2 2.5 3.6 3.4 3.4 3.5 Rural ............................................................................................... 2.0 2.4 1.9 2.2 2.5 1.7 1.9 1.7 2.2 2.3 Region Northeast ........................................................................................ 2.7 2.5 2.3 2.9 3.3 2.5 3.0 2.6 3.2 3.0 Southeast ........................................................................................ 2.0 2.7 2.1 3.0 2.8 1.6 2.2 2.2 2.7 2.4 Central ............................................................................................ 2.2 2.7 2.7 2.5 2.7 2.1 3.0 2.8 2.8 2.9 West ............................................................................................... 1.9 2.2 2.2 2.1 2.5 1.5 1.8 1.8 2.2 2.0 Percent minority enrollment
Less than 6 percent ......................................................................... 3.3 3.9 3.3 3.9 4.0 2.9 3.8 3.5 3.6 3.9 6 to 20 percent ................................................................................ 2.2 2.5 2.2 2.5 2.7 2.0 2.6 2.3 2.7 2.7 21 to 49 percent .............................................................................. 2.0 2.4 2.3 2.6 2.7 1.9 2.4 2.2 2.3 2.5 50 percent or more .......................................................................... 1.8 2.3 2.0 2.1 2.2 1.3 2.0 1.6 1.9 2.1 Percent of students eligible for free or reduced-priced lunch Less than 35 percent ....................................................................... 1.9 2.3 1.7 2.2 2.7 1.7 2.2 2.1 2.1 2.3 35 to 49 percent .............................................................................. 2.4 2.9 2.7 2.9 3.1 2.2 2.9 2.5 2.8 3.2 50 to 74 percent .............................................................................. 2.1 2.6 2.2 2.6 2.6 1.6 2.3 2.0 2.4 2.4 75 percent or more .......................................................................... 2.5 2.5 2.5 2.9 2.5 1.9 2.9 2.3 2.7 2.7 SOURCE: U.S. Department of Education, National Center for Education Statistics, Fast Response Survey System (FRSS), “Condition of Public School Facilities: 2012–13,” FRSS 105, 2013.

A-16
Table 10a. Among public schools, standard errors for the years since original construction of the main instructional building, years since the most recent major renovation of the main instructional building, years since the last major building replacement or addition at the school, functional age of the main instructional building, and the percentage distribution of public schools according to the functional age of the main instructional building, by school characteristics: 2012–13
School characteristic
Years since construction of
the main instructional
building
Years since most recent
major renovation of the main
instructional building
Years since last major
building replacement or
addition
Functional age of the main
instructional building
Functional age of the main instructional building
Less than 5 years old
5–14 years old
15–34 years old
35 or more years old
All public schools ............................................................................... 0.7 0.4 0.6 0.5 1.1 1.2 1.2 1.2
School instructional level Elementary ............................................................................................. 0.9 0.5 0.8 0.6 1.2 1.4 1.6 1.4 Secondary .............................................................................................. 1.2 0.7 0.8 0.9 2.2 2.3 1.8 1.7 Combined .............................................................................................. 4.2 2.0 1.6 3.1 6.8 7.2 7.5 4.3 School enrollment size Less than 300 ......................................................................................... 1.7 1.0 1.4 1.5 2.9 3.3 2.8 2.8 300 to 599 .............................................................................................. 1.1 0.6 1.1 0.9 1.6 2.2 2.0 2.0 600 or more ........................................................................................... 0.9 0.5 0.6 0.7 1.8 2.0 1.7 1.3 Community type City ........................................................................................................ 1.7 0.7 1.5 1.4 2.6 2.5 2.3 2.4 Suburban ................................................................................................ 1.2 0.7 0.9 1.1 2.2 2.7 1.8 2.2 Town ..................................................................................................... 1.8 1.2 1.4 1.4 2.9 4.1 3.6 3.0 Rural ...................................................................................................... 1.2 0.8 0.8 0.9 1.9 2.3 2.3 1.9 Region Northeast ............................................................................................... 1.9 0.8 1.7 1.6 2.9 3.0 2.6 3.0 Southeast ............................................................................................... 1.2 0.9 0.9 1.1 2.4 3.0 2.6 2.5 Central ................................................................................................... 1.5 0.8 1.3 1.0 2.5 2.9 2.4 2.3 West ...................................................................................................... 1.3 0.7 0.8 1.0 1.9 2.3 2.0 2.1 Percent minority enrollment
Less than 6 percent ................................................................................ 2.2 1.2 1.8 2.1 3.7 4.1 4.1 3.9 6 to 20 percent ....................................................................................... 1.4 0.9 1.0 1.0 2.2 2.6 2.7 2.3 21 to 49 percent ..................................................................................... 1.4 0.7 1.1 0.9 2.3 2.7 2.4 2.0 50 percent or more ................................................................................. 1.3 0.6 1.0 0.9 1.8 2.0 2.0 1.9 Percent of students eligible for free or reduced-priced lunch Less than 35 percent .............................................................................. 1.3 0.6 0.8 0.9 2.1 2.2 2.1 2.0 35 to 49 percent ..................................................................................... 1.8 1.1 1.4 1.3 2.9 3.3 2.9 2.9 50 to 74 percent ..................................................................................... 1.4 0.8 1.0 1.0 2.0 2.6 2.3 2.1 75 percent or more ................................................................................. 1.9 0.8 1.8 1.3 2.5 3.0 2.7 2.8 SOURCE: U.S. Department of Education, National Center for Education Statistics, Fast Response Survey System (FRSS), “Condition of Public School Facilities: 2012–13,” FRSS 105, 2013.

Appendix B
Technical Notes
B-1

Technical Notes
Fast Response Survey System
The Fast Response Survey System (FRSS) was established in 1975 by the National Center for Education Statistics (NCES), U.S. Department of Education. FRSS is designed to collect issue-oriented data within a relatively short time frame. FRSS collects data from state education agencies, local education agencies, public and private elementary and secondary schools, public school teachers, and public libraries. To ensure minimal burden on respondents, the surveys are generally limited to three pages of questions, with a response burden of about 30 minutes per respondent. Sample sizes are relatively small (usually about 1,200 to 1,800 respondents per survey) so that data collection can be completed quickly. Data are weighted to produce national estimates of the sampled education sector. The sample size permits limited breakouts by analysis variables. However, as the number of categories within any single analysis variable increases, the sample size within categories decreases, which results in larger sampling errors for the breakouts by analysis variables.
Sample Design
The sample for the FRSS survey of the Condition of Public School Facilities consisted of approximately 1,800 regular public elementary, middle, and secondary/combined schools in the 50 states and the District of Columbia. The nationally representative sample was selected from the 2010–11 NCES Common Core of Data (CCD) Public School Universe file, which was the most current file available at the time of selection. The sampling frame included 50,995 regular elementary schools, 16,582 regular middle schools, and 19,190 regular secondary/combined schools. For purposes of this study, “regular” schools included charter schools. Excluded from the sampling frame were schools with a high grade of prekindergarten, kindergarten, or ungraded, schools with zero, missing, or “not applicable” enrollment, along with special education, vocational, and alternative/other schools, and schools outside the 50 states and the District of Columbia. A school was defined as an elementary school if the lowest grade was less than or equal to grade 3 and the highest grade was less than or equal to grade 8. A middle school was defined as having a lowest grade greater than or equal to grade 4 and a highest grade less than or equal to grade 9. A school was considered a secondary school if its lowest grade was greater than or equal to grade 9 and the highest grade was greater than or equal to grade 10. Combined schools were defined as having a lowest grade less than or equal to grade 3 and a highest grade greater than or equal to grade 9 or the lowest grade is in grades 4 through 8 and the highest grade is in grades 10 through 12. Secondary and combined schools were combined into one category for sampling.
The public school sampling frame was stratified by instructional level (elementary, middle, secondary/ combined), community type (City, suburban, town, rural), and enrollment size (less than 300, 300 to 499, 500 to 999, 1,000 to 1,499, and 1,500 or more) to create 52 primary strata. Within the strata, schools were sorted by percent combined enrollment of American Indian/Alaska Native, Asian, Black, Hawaiian Native/Pacific Islander, Hispanic, and students of two or more races (missing, less than 6 percent, 6 to 20 percent, 21 to 49 percent, and 50 percent or more) and region (Northeast, Southeast, Central, West) prior to selection to induce additional implicit stratification. These variables are defined in more detail in the “Definitions of Analysis Variables” section of this report. For analysis, school instructional level was defined as elementary, secondary, and combined rather than the categories used for sampling. This was the same approach used in the 1999 FRSS study on the condition of school facilities (Lewis et al. 2000). This was done to facilitate comparisons between data in the two reports. Within each primary stratum, schools were selected systematically at rates that depended on the size class of the school. The sample contained approximately 720 elementary schools, 540 middle schools, and 540 secondary/combined schools. The approximately 1,800 schools were located in approximately 1,380 school districts. Approximately 16 percent of the districts with
B-2

sampled schools had more than one sampled school in the district. While there was no maximum number of schools that could be sampled within a district, most districts had only one sampled school.
Data Collection and Response Rates
Questionnaires and cover letters were mailed in January 2013. While individual schools were sampled, the questionnaires were mailed to the districts with which the schools were associated. A separate questionnaire was enclosed for each sampled school. This is the same approach used in the 1999 FRSS study on the condition of school facilities. The cover letter indicated that the survey was designed to be completed by district-level personnel who were very familiar with the school facilities in the district. Often this was a district facilities coordinator (although the title of the position varied). The letter indicated that the respondent might want to consult with other district-level personnel or with school-level personnel, such as the principal of the sampled school, in answering some of the questions. Respondents were offered the option of completing the survey via the Web. Telephone follow-up for survey nonresponse and data clarification was initiated in February 2013 and completed in June 2013.
Of the approximately 1,800 public schools in the sample, approximately 40 were found to be ineligible because the school was closed or did not meet some other criteria for inclusion in the sample (e.g., was an alternative school). For the eligible schools, an unweighted response rate of 90 percent was obtained for this survey (about 1,590 responding schools divided by the approximately 1,760 eligible schools in the sample). The corresponding weighted response rate using the initial base weights was 90 percent (table B-1). Of the schools that completed the survey, 62 percent completed it via the Web, 38 percent completed it by paper (sent by mail, fax, or e-mail), and less than 1 percent completed it by telephone. The final weighted count of responding schools in the survey after nonresponse adjustment represents the estimated universe of eligible public schools in the 50 states and the District of Columbia—approximately 84,000 schools (table B-1).1 The difference between the final weighted count of approximately 84,000 schools and the approximately 87,000 schools in the sampling frame for this FRSS study is due to the relatively high percentage of ineligible schools that were found in the sample.
Table B-1. Number and percentage of responding public schools in the study sample, and estimated number and percentage of public schools the sample represents, by school characteristics: 2012–13
School characteristic Respondent sample (unweighted) National estimate (weighted)1
Number Percent Number Percent
All public schools ............................................................... 1,590 100 84,000 100
School instructional level Elementary 1,020 64 62,600 75 Secondary ................................................................................. 510 32 18,900 23 Combined ................................................................................. 50 3 2,400 3
School enrollment size Less than 300 ............................................................................ 240 15 20,000 24 300 to 599 ................................................................................. 560 35 35,500 42 600 or more .............................................................................. 790 50 28,500 34
Community type City ........................................................................................... 410 25 21,200 25 Suburban ................................................................................... 480 30 23,500 28 Town ......................................................................................... 220 14 10,900 13 Rural ......................................................................................... 490 31 28,400 34
See notes at end of table.
1 For more details about the development of survey weights, see the section of this report on sampling errors.
B-3

Table B-1. Number and percentage of responding public schools in the study sample, and estimated number and percentage of public schools the sample represents, by school characteristics: 2012–13—Continued
School characteristic Respondent sample (unweighted) National estimate (weighted)1
Number Percent Number Percent Region
Northeast .................................................................................. 280 18 15,000 18 Southeast .................................................................................. 380 24 18,800 22 Central ...................................................................................... 380 24 21,500 26 West .......................................................................................... 550 35 28,700 34
Percent minority enrollment2
Less than 6 percent ................................................................... 170 10 10,600 13 6 to 20 percent .......................................................................... 380 24 21,300 25 21 to 49 percent ........................................................................ 400 25 19,900 24 50 percent or more .................................................................... 640 40 32,200 38
Percent of students eligible for free or reduced-price lunch
Less than 35 percent ................................................................. 530 33 26,300 31 35 to 49 percent ........................................................................ 300 19 15,500 18 50 to 74 percent ........................................................................ 440 28 22,800 27 75 percent or more .................................................................... 330 20 19,400 23
1 Weighted count of responding schools using the final nonresponse-adjusted weights. The weighted count is an estimate of the number of eligible schools in the study universe (see text for definition of the types of schools included in the study). 2 Minority enrollment includes Hispanic, Asian, Native Hawaiian/Pacific Islander, American Indian/Alaska Native, and students of two or more races. NOTE: Detail may not sum to totals because of rounding. SOURCE: U.S. Department of Education, National Center for Education Statistics, Fast Response Survey System (FRSS), “Condition of Public School Facilities: 2012-13,” FRSS 105, 2013.
Imputation for Item Nonresponse
Cases with missing data were recontacted by telephone to collect the missing information. However, for cases in which this data retrieval was unsuccessful, missing data were imputed. Although item nonresponse was very low (less than 1 percent for any item), missing data were imputed for the 48 items with a response rate of less than 100 percent. The missing items included both numerical data such as the total cost of all repairs/renovations/modernizations required to put the school’s onsite buildings in good overall condition, as well as categorical data, such as whether there was a written long-range educational facilities plan for the school. The missing categorical data were imputed using a “hot-deck” approach to obtain a “donor” school from which the imputed values were derived. Under the hot-deck approach, a donor school that matched selected characteristics of the school with missing data (the recipient school) was identified (Kalton 1983, pp. 65–104). The matching characteristics included instructional level, enrollment size, community type, region, percent eligible for free or reduced-price lunch, and percent combined enrollment of American Indian/Alaska Native, Asian, Black, Hawaiian Native/Pacific Islander, Hispanic, and students of two or more races. In addition, other relevant questionnaire items were used to form appropriate imputation groupings. Once a donor was found, the imputed value was simply the corresponding value from the donor school.
Data Reliability
Although the school survey on the condition of public school facilities was designed to account for sampling error and to minimize nonsampling error, estimates produced from the data collected are subject to both types of error. Sampling error occurs because the data are collected from a sample rather than a census of the population, and nonsampling errors are errors made during the collection and processing of the data.
B-4

Sampling Errors
The responses were weighted to produce national estimates (table B-1). The weights were designed to reflect the probabilities of selection of the sampled schools and were adjusted for differential unit (questionnaire) nonresponse. The nonresponse weighting adjustments were made within classes defined by school instructional level, community type, and school enrollment size. Within the final weighting classes, the base weights (i.e., the reciprocal of schools’ probabilities of selection) of the responding schools were inflated by the inverse of the weighted response rate for the class. The findings in this report are estimates based on the sample selected and, consequently, are subject to sampling variability.
Because the data from the FRSS survey on the condition of public school facilities were collected using a complex sampling design, the variances of the estimates from this survey (e.g., estimates of proportions) are typically different from what would be expected from data collected with a simple random sample. Not taking the complex sample design into account can lead to an under- or overestimation of the standard errors associated with such estimates. To generate accurate standard errors for the estimates in this report, standard errors were computed using a technique known as jackknife replication (Levy and Lemeshow 1991). A form of jackknife replication referred to as the JK1 method was used construct the replicates. As with any replication method, jackknife replication involves constructing a number of subsamples (replicates) from the full sample and computing the statistic of interest for each replicate. The mean square error of the replicate estimates around the full sample estimate provides an estimate of the variance of the statistic. To construct the replications, 100 stratified subsamples of the full sample were created and then dropped one at a time to define 100 jackknife replicates. Estimates of standard errors can be computed using statistical packages such as SAS or WesVar.
The standard error is a measure of the variability of an estimate due to sampling. It indicates the variability of a sample estimate that would be obtained from all possible samples of a given design and size. Standard errors are used as a measure of the precision expected from a particular sample. If all possible samples were surveyed under similar conditions, intervals of 1.96 standard errors below to 1.96 standard errors above a particular statistic would include the true population parameter being estimated in about 95 percent of the samples. This is a 95 percent confidence interval. For example, the estimated percent of public schools with portable buildings is 31 percent, and the standard error is 1.4 percent (tables 1 and 1a). The 95 percent confidence interval for the statistic extends from [31 – (1.4 x 1.96)] to [31 + (1.4 x 1.96)], or from 28.3 to 33.7 percent. The 1.96 is the appropriate percentile from a standard normal distribution corresponding to a two-sided statistical test at the p < .05 significance level (where .05 indicates the 5 percent of all possible samples that would be outside the range of the confidence interval).
Comparisons can be tested for statistical significance at the p < .05 level using Student’s t-statistic to ensure that the differences are larger than those that might be expected due to sampling variation.2 Student’s t values are computed to test the difference between estimates with the following formula:
22
21
21
sese
EEt+
−=
where E1 and E2 are the estimates to be compared and se1 and se2 are their corresponding standard errors.
2 This includes comparisons to the 1999 FRSS study on the condition of school facilities (Lewis et al. 2000).
B-5

Nonsampling Errors
Nonsampling error is the term used to describe variations in the estimates that may be caused by population coverage limitations and data collection, processing, and reporting procedures. The sources of nonsampling errors are typically problems like unit and item nonresponse, differences in respondents’ interpretations of the meaning of questions, response differences related to the particular time the survey was conducted, and mistakes made during data preparation. It is difficult to identify and estimate either the amount of nonsampling error or the bias caused by this error. To minimize the potential for nonsampling error, this study used a variety of procedures, including a pretest of the questionnaire with district-level personnel who were very familiar with the school facilities in the district. The pretest provided the opportunity to check for consistency of interpretation of questions and definitions and to eliminate ambiguous items. The questionnaire and instructions were also extensively reviewed by NCES. In addition, extensive editing of the questionnaire responses was conducted to check the data for accuracy and consistency. Cases with missing or inconsistent items were recontacted by telephone to resolve problems. Data entered for all surveys received by mail, fax, or telephone were verified to ensure accuracy.
Definitions of Analysis Variables
Many of the school characteristics, described below, may be related to each other. For example, school enrollment size and community type are related, with city schools typically being larger than rural schools. Other relationships between these analysis variables may exist. However, this First Look report focuses on national estimates and bivariate relationships between the analysis variables and questionnaire variables rather than more complex analyses.
Instructional level—Schools were classified according to their grade span in the 2010–11 CCD Public School Universe file. The categories for analysis differed from the categories used for sampling. This was the same approach used in the 1999 FRSS study on the condition of public schools.
Elementary school—had grade 6 or lower and no grade higher than grade 8 Secondary school—had no grade lower than grade 7 and had grade 7 or higher Combined school—had grades lower than grade 7 and higher than grade 8
Enrollment size—This variable indicates the total number of students enrolled in the school based on data from the 2010–11 CCD Public School Universe file. The variable was collapsed into the following three categories:
Less than 300 students 300 to 599 students 600 or more students
Community type—This variable indicates the type of community in which the school is located, as defined in the 2010–11 CCD Public School Universe file. These codes are based on the location of school buildings. The urban-centric locale codes are assigned through a methodology developed by the U.S. Census Bureau’s Population Division in 2005. This classification system has four major locale categories—city, suburban, town, and rural—each of which is subdivided into three subcategories. This variable was based on the 12-category urban-centric locale variable from CCD and collapsed into the four categories below.
City—Territory inside an urbanized area and inside a principal city Suburban—Territory outside a principal city and inside an urbanized area Town—Territory inside an urban cluster
B-6

Rural—Territory outside an urbanized area and outside an urban cluster
Region—This variable classifies schools into one of the four geographic regions used by the Bureau of Economic Analysis of the U.S. Department of Commerce. Data were obtained from the 2010–11 CCD Public School Universe file. The geographic regions are as follows:
Northeast—Connecticut, Delaware, District of Columbia, Maine, Maryland, Massachusetts, New Hampshire, New Jersey, New York, Pennsylvania, Rhode Island, and Vermont Southeast—Alabama, Arkansas, Florida, Georgia, Kentucky, Louisiana, Mississippi, North Carolina, South Carolina, Tennessee, Virginia, and West Virginia Central—Illinois, Indiana, Iowa, Kansas, Michigan, Minnesota, Missouri, Nebraska, North Dakota, Ohio, South Dakota, and Wisconsin West—Alaska, Arizona, California, Colorado, Hawaii, Idaho, Montana, Nevada, New Mexico, Oklahoma, Oregon, Texas, Utah, Washington, and Wyoming
Percent minority enrollment—This variable indicates the percentage of students enrolled in the school whose race or ethnicity is classified as one of the categories below based on data in the 2010–11 CCD Public School Universe file.
• American Indian/Alaska Native • Asian • Black • Hawaiian Native/Pacific Islander • Hispanic • Two or more races
The variable was collapsed into the following four categories:
Less than 6 percent 6 to 20 percent 21 to 49 percent 50 percent or more
Percent of students eligible for free or reduced price lunch—This variable serves as a measure of the concentration of poverty at the school. This variable is based on data in the 2010–11 CCD Public School Universe file. This variable was collapsed into the four categories below.
Less than 35 percent 35 to 49 percent 50 to 74 percent 75 percent or more
B-7

Rating Scales and Definitions of Terms Used in This Report
Rating Scale for Table 1
The following rating scale was used in question 4 to indicate the overall condition of each type of onsite building at this school:
Excellent means that the facility meets all the reasonable needs for normal school performance yet goes well beyond adequate. Relatively minor enhancements may be necessary. Good means that the facility meets all the reasonable needs for normal school performance, is most often in good condition, and generally meets some, but not all, of the characteristics of an excellent facility. Fair means that the facility meets minimal needs for normal school performance but requires frequent maintenance or has other limitations. It requires some upgrading to be considered in good condition. Poor means that the facility does not meet minimal requirements for normal school performance.
Rating Scale for Tables 2, 3, and 4
The following rating scale was used in questions 2 and 3 to indicate the condition of building systems/features and outdoor features:
Excellent means that a particular feature or system meets all the reasonable needs of the school pertaining to that item yet goes well beyond adequate. Relatively minor enhancements may be necessary. Good means a feature or system meets all the reasonable needs of the school, is most often in good condition, and generally meets some, but not all, of the characteristics of an excellent system/feature. Fair means that a feature or system meets minimal conditions but is not dependable, breaks down frequently, or has other limitations. It is a feature or system that would require some upgrading to be considered in good condition. Poor means that a particular feature or system as it exists is inadequate to meet even the minimal needs of the school.
Definitions of Terms
Energy management system—A control system (often computerized) designed to regulate the energy consumption of a building by controlling the operation of energy consuming systems, such as the heating, ventilation, and air conditioning (HVAC), lighting, and water heating systems. These systems are sometimes referred to as mechanical control systems or building automation systems.
Life safety features—Includes sprinklers, fire alarms, and smoke detectors.
Security systems—Includes surveillance cameras, perimeter intrusion alarms, metal detectors, and door controllers.
Internal communications—Intercom and/or phone systems enabling communication with academic and administrative areas of the school individually and collectively.
B-8

Technology infrastructure—Facility access to voice, video, and data transmission in classrooms and administrative areas of the school. Includes wiring for computer workstations and other electronic equipment in program areas.
Long-range educational facilities plan—This plan may be referred to as a Capital Improvement Plan, Capital Facilities Plan, or Facilities Master Plan.
Contact Information
For more information about the survey, contact John Ralph, National Center for Education Statistics, Institute of Education Sciences, U.S. Department of Education, 1990 K Street NW, Washington, DC 20006; e-mail: [email protected]; telephone: (202) 502-7441.
B-9

Appendix C
Questionnaire
C-1

U.S. DEPARTMENT OF EDUCATION
NATIONAL CENTER FOR EDUCATION STATISTICS WASHINGTON, D.C. 20006–5651
CONDITION OF PUBLIC SCHOOL FACILITIES: 2012–13
FAST RESPONSE SURVEY SYSTEM
FORM APPROVED O.M.B. No.: 1850–0733 EXPIRATION DATE: 05/2015
This survey is authorized by law (Education Sciences Reform Act of 2002, 20 U.S.C. § 9543). While participation in this survey is voluntary, your cooperation is critical to make the results of this survey comprehensive, accurate, and timely. Your answers may be used only for statistical purposes and may not be disclosed, or used, in identifiable form for any other purpose unless otherwise compelled by law (Education Sciences Reform Act of 2002, 20 U.S.C. § 9573).
Please provide information only about the school that is indicated on the front of this survey. This survey is designed to be completed by district-level personnel who are very familiar with the school facilities in this district. You may wish to consult with other district-level personnel or with school-level personnel, such as the principal of the selected school, in answering some questions. Please respond about the selected school for the current 2012–13 school year, even if the selected school is new.
NAME AND ADDRESS OF SAMPLED SCHOOL HERE
IF ABOVE SCHOOL INFORMATION IS INCORRECT, PLEASE UPDATE DIRECTLY ON LABEL.
Name of person completing this form: ___________________________________________________________________
Title/position: ______________________________________________________________________________________
Telephone number: ___________________________________ E-mail: ______________________________________
Best days and times to reach you (in case of questions): ___________________________________________________
Grades taught at this school: Lowest grade taught ________ Highest grade taught ________
THANK YOU. PLEASE KEEP A COPY OF THIS SURVEY FOR YOUR RECORDS.
PLEASE RETURN COMPLETED FORM TO: Mail: Debbie Alexander (8599.13.13.02) Westat 1600 Research Boulevard Rockville, Maryland 20850-3129Fax: 800-254-0984
IF YOU HAVE ANY QUESTIONS OR COMMENTS, CONTACT: Debbie Alexander at Westat 800-937-8281, ext. 2088 or 301-294-2088 E-mail: [email protected]
According to the Paperwork Reduction Act of 1995, no persons are required to respond to a collection of information unless it displays a valid OMB control number. The valid OMB control number for this information collection is 1850–0733. The time required to complete this information collection is estimated to average 30 minutes per response, including the time to review instructions, search existing data resources, gather the data needed, and complete and review the information collection. If you have any comments concerning the accuracy of the time estimate or suggestions for improving this form, please write to: U.S. Department of Education, Washington, DC 20202–4537. If you have any comments or concerns regarding the status of your individual submission of this form, write directly to: National Center for Education Statistics, 1990 K Street, NW, Washington, DC 20006. FRSS Form No. 105, 01/2013
C-2
Infor
mation
Cop
y - D
o Not
Comple
te

Instructions and Definitions Page
Please provide information only about the school that is indicated on the front of this survey. Respond about the selected school for the current 2012–13 school year, even if the selected school is new.
If the school has more than one permanent or portable building on site, consider all of them in providing a rating.
In questions 2 and 3, use the following rating scale to indicate the condition of building systems/features and outdoor features:
“School does not have” means that a building system/feature does not exist within that type of building or that the school does not have that outdoor feature.
Excellent means that a particular feature or system meets all the reasonable needs of the school pertaining to that item yet goes well beyond adequate. Relatively minor enhancements may be necessary.
Good means a feature or system meets all the reasonable needs of the school, is most often in good condition, and generally meets some, but not all, of the characteristics of an excellent system/feature.
Fair means that a feature or system meets minimal conditions but is not dependable, breaks down frequently, or has other limitations. It is a feature or system that would require some upgrading to be considered in good condition.
Poor means that a particular feature or system as it exists is inadequate to meet even the minimal needs of the school.
In question 4, use the following rating scale to indicate the overall condition of each type of onsite building at this school:
“School does not have” means that the school does not have that type of building.
Excellent means that the facility meets all the reasonable needs for normal school performance yet goes well beyond adequate. Relatively minor enhancements may be necessary.
Good means that the facility meets all the reasonable needs for normal school performance, is most often in good condition, and generally meets some, but not all, of the characteristics of an excellent facility.
Fair means that the facility meets minimal needs for normal school performance but requires frequent maintenance or has other limitations. It requires some upgrading to be considered in good condition.
Poor means that the facility does not meet minimal requirements for normal school performance.
Definitions Energy management system: A control system (often computerized) designed to regulate the energy consumption of a building by controlling the operation of energy consuming systems, such as the heating, ventilation, and air conditioning (HVAC), lighting, and water heating systems. These systems are sometimes referred to as mechanical control systems or building automation systems.
Life safety features: Includes sprinklers, fire alarms, and smoke detectors.
Security systems: Includes surveillance cameras, perimeter intrusion alarms, metal detectors, and door controllers.
Internal communications: Intercom and/or phone systems enabling communication with academic and administrative areas of the school individually and collectively.
Technology infrastructure: Facility access to voice, video, and data transmission in classrooms and administrative areas of the school. Includes wiring for computer workstations and other electronic equipment in program areas.
Long-range educational facilities plan: This plan may be referred to as a Capital Improvement Plan, Capital Facilities Plan, or Facilities Master Plan.
C-3
Infor
mation
Cop
y - D
o Not
Comple
te

See rating scales on instructions and definitions page.
1. Does this school have the following types of onsite buildings? (Indicate yes or no for each type of building.) Yes No
a. Permanent buildings ......................... 1 2 b. Portable (temporary) buildings ......... 1 2
2. What is the condition of each building system/feature for the permanent and portable (temporary) onsite buildings at this school? (See instructions and definitions page.)
• In Part A, circle one rating on each line to indicate the condition of each system/feature for the permanent buildings at this school. If the school has more than one permanent building, consider all of them in providing a rating. Leave Part A blank if this school does not have any permanent buildings.
• In Part B, circle one rating on each line to indicate the condition of each system/feature for the portable (temporary) buildings at this school. If the school has more than one temporary building, consider all of them in providing a rating. Leave Part B blank if this school does not have any portable (temporary) buildings.
Building system/feature
Part A. Permanent buildings (Circle one on each line)
Part B. Portable (temporary) buildings (Circle one on each line)
School does not
have system/ feature
Excel-lent Good Fair Poor
School does not
have system/ feature
Excel-lent Good Fair Poor
a. Roofs 0 1 2 3 4 0 1 2 3 4 b. Framing, floors, foundations 0 1 2 3 4 0 1 2 2 4 c. Exterior walls, finishes 0 1 2 3 4 0 1 2 3 4 d. Windows, doors 0 1 2 3 4 0 1 2 3 4 e. Interior finishes, trim 0 1 2 3 4 0 1 2 3 4 f. Plumbing/lavatories 0 1 2 3 4 0 1 2 3 4 g. Heating system 0 1 2 3 4 0 1 2 3 4 h. Air conditioning system 0 1 2 3 4 0 1 2 3 4 i. Ventilation/filtration system 0 1 2 3 4 0 1 2 3 4 j. Electrical system 0 1 2 3 4 0 1 2 3 4 k. Interior lighting 0 1 2 3 4 0 1 2 3 4 l. Exterior lighting 0 1 2 3 4 0 1 2 3 4 m. Energy management system 0 1 2 3 4 0 1 2 3 4 n. Life safety features 0 1 2 3 4 0 1 2 3 4 o. Security systems 0 1 2 3 4 0 1 2 3 4 p. Internal communication
systems 0 1 2 3 4 0 1 2 3 4 q. Technology infrastructure 0 1 2 3 4 0 1 2 3 4
3. What is the condition of the following outdoor features at this school? (Circle one rating on each line.)
Outdoor feature
School does not have feature Excellent Good Fair Poor
a. School parking lots and roadways 0 1 2 3 4 b. Bus lanes and drop-off areas 0 1 2 3 4 c. School sidewalks and walkways 0 1 2 3 4 d. Outdoor play areas/playgrounds 0 1 2 3 4 e. Outdoor athletic facilities 0 1 2 3 4 f. Covered walkways 0 1 2 3 4 g. Fencing 0 1 2 3 4
C-4
Infor
mation
Cop
y - D
o Not
Comple
te

4. What is the overall condition of the permanent and portable (temporary) onsite buildings at this school? (If the school has more than one building of a particular type, consider all of them in providing a rating. Circle one on each line.)
Building type
School does not have building
type Excellent Good Fair Poor a. Permanent buildings 0 1 2 3 4 b. Portable (temporary) buildings 0 1 2 3 4
5. What would probably be the total cost of all repairs/renovations/modernizations required to put this school’s onsite buildings in good overall condition? (Give your best estimate. If this school’s onsite buildings are already in good or excellent overall condition, enter zero.) $________________
6. On which of the sources listed below is this cost estimate based? (Circle all that apply.) a. Facilities inspection(s)/assessment(s) performed within the last 3 years by licensed professionals ............... 1 b. Repair/renovation/modernization work already being performed and/or contracted for .................................. 2 c. Capital improvement/facilities master plan, schedule, or budget ..................................................................... 3 d. My best professional judgment ......................................................................................................................... 4 e. Opinions of other district or school administrators............................................................................................ 5 f. Other (specify) ________________________________________________________________________ 6
7. How satisfactory is each environmental factor in the permanent and portable (temporary) onsite buildings at this school? • In Part A, circle one rating on each line to indicate the overall satisfaction with each environmental factor for the
permanent buildings at this school. If the school has more than one permanent building, consider all of them in providing a rating. Leave Part A blank if this school does not have any permanent buildings.
• In Part B, circle one rating on each line to indicate the overall satisfaction with each environmental factor for the portable (temporary) buildings at this school. If the school has more than one temporary building, consider all of them in providing a rating. Leave Part B blank if this school does not have any portable (temporary) buildings.
Environmental factor
Part A. Permanent buildings (Circle one on each line)
Part B. Portable (temporary) buildings (Circle one on each line)
School does not
have factor
Very satis-
factory Satis-
factory Unsatis-factory
Very unsatis-factory
School does not
have factor
Very satis-
factory Satis-
factory Unsatis-factory
Very unsatis-factory
a. Artificial lighting 0 1 2 3 4 0 1 2 3 4 b. Natural lighting 0 1 2 3 4 0 1 2 3 4 c. Heating 0 1 2 3 4 0 1 2 3 4 d. Air conditioning 0 1 2 3 4 0 1 2 3 4 e. Ventilation 0 1 2 3 4 0 1 2 3 4 f. Indoor air quality 0 1 2 3 4 0 1 2 3 4 g. Water quality 0 1 2 3 4 0 1 2 3 4 h. Acoustics or noise control 0 1 2 3 4 0 1 2 3 4
8. In what year was this school’s main instructional building constructed? ____________ 9. In what year was the last major renovation of the main instructional building? ____________
Check here if the main instructional building has never undergone a major renovation
10. In what year was the last major building replacement or addition made to this school? ____________ Check here if the school has never had a major addition or replacement
11. Is any major repair/renovation/modernization work currently being performed at this school? Yes ...... 1 No ...... 2
12. Which of the following construction projects, if any, are planned for this school in the next 2 years? (Indicate yes or no for each item.) Yes No a. Build new permanent buildings or permanent additions to buildings
(e.g., a new classroom wing or gymnasium)...................................................................................... 1 2 b. Major repairs, renovations, or modernization of existing permanent buildings .................................. 1 2
C-5
Infor
mation
Cop
y - D
o Not
Comple
te

13. Which of the following building systems or features at this school, if any, have major repairs, renovations, or replacements planned for the next 2 years? If major repairs, renovations, or replacements are planned for a building system or feature, what is the main reason for the planned major repair, renovation, or replacement?
• In Part A, circle one response on each line to indicate major repair, renovation, or replacement plans for each building system or feature. Do not include preventive maintenance or minor repairs.
• Complete Part B for any building system or feature for which major repair, renovation, or replacement is planned in the next 2 years. Circle one response to indicate the main reason for any planned major repairs, renovations, or replacements for a building system or feature.
Building system/feature
Part A. Plans for major repair, renovation, or replacement
in the next 2 years (Circle one on each line)
Part B. Main reason for planned major repair, renovation, or replacement
(Circle one for each system/feature with major repair, renovation, or replacement planned)
School does not have building system/ feature
No major repair,
renovation, or replacement
planned
Major repair or renovation
planned
Replace-ment
planned
Functional problem in
existing system or
feature
Improved operational or energy efficiency
Replace-ment cycle
Other reason
(If work is planned, continue to Part B)
a. Roofs 0 1 2 3 1 2 3 4 b. Framing, floors, foundations 0 1 2 3 1 2 3 4 c. Exterior walls, finishes 0 1 2 3 1 2 3 4 d. Windows, doors 0 1 2 3 1 2 3 4 e. Interior finishes, trim 0 1 2 3 1 2 3 4 f. Plumbing/lavatories 0 1 2 3 1 2 3 4 g. Heating system 0 1 2 3 1 2 3 4 h. Air conditioning system 0 1 2 3 1 2 3 4 i. Ventilation/filtration system 0 1 2 3 1 2 3 4 j. Electrical system 0 1 2 3 1 2 3 4 k. Interior lighting 0 1 2 3 1 2 3 4 l. Exterior lighting 0 1 2 3 1 2 3 4 m. Energy management system 0 1 2 3 1 2 3 4 n. Life safety features 0 1 2 3 1 2 3 4 o. Security systems 0 1 2 3 1 2 3 4 p. Internal communication systems 0 1 2 3 1 2 3 4 q. Technology infrastructure 0 1 2 3 1 2 3 4
14. Is there a written long-range educational facilities plan for this school? (See definition.) Yes ............. 1 No .......... 2
15. Has this school had the following performed by qualified professionals within the last 5 years? (Indicate yes or no for each item.) Yes No a. Inspection of the condition of the physical features of the facility (e.g., roofs, foundations) .............. 1 2 b. Evaluation of energy use (e.g., energy audit) .................................................................................... 1 2 c. Evaluation of indoor environmental hazards (e.g., air quality, asbestos, lead paint)......................... 1 2
16. Have any of the following been done within the last 5 years to improve energy efficiency at this school? (Indicate yes or no for each item.) Yes No a. Replaced lighting fixtures, lighting ballasts, or bulbs ......................................................................... 1 2 b. Installed motion sensors for lighting ................................................................................................... 1 2 c. Upgraded insulation, outer walls, and/or siding (building envelopes) ................................................ 1 2 d. Replaced windows and/or doors ....................................................................................................... 1 2 e. Installed or upgraded a reflective roof coating ................................................................................... 1 2 f. Installed more efficient HVAC systems .............................................................................................. 1 2 g. Installed or upgraded an energy management system ...................................................................... 1 2
17. Are there significant problems with the facilities at this school that are not covered in this survey? Yes ............. 1 No .......... 2
If yes, please briefly describe those problems on the back of the questionnaire.
C-6
Infor
mation
Cop
y - D
o Not
Comple
te

Comments for question 17: ___________________________________________________________________________
_________________________________________________________________________________________________
_________________________________________________________________________________________________
_________________________________________________________________________________________________
_________________________________________________________________________________________________
C-7
Infor
mation
Cop
y - D
o Not
Comple
te