Condensed fs2016 november
11
Summary Operating Statements For the Period September 1, 2016 ‐ November 30, 2016 For the Meeting of the Board of Trustees ‐ January 12, 2017 for Houston Community College System & Houston Community College Public Facility Corporation
-
Upload
houston-community-college -
Category
Economy & Finance
-
view
24 -
download
0
Transcript of Condensed fs2016 november

Summary Operating Statements
For the Period
September 1, 2016 ‐ November 30, 2016
For the Meeting of the Board of Trustees ‐ January 12, 2017
forHouston Community College System
&
Houston Community College Public Facility Corporation
Summary Summary of Financial Statements 1
Fund Balances Fund Balance Statement 2
Operating Summary HCCS Unrestricted Revenue & Expenditures 3
Auxiliary Sources and Uses of Auxiliary Funds 4
Budgets Adjusted Budgets by Divisions 6
Balance Sheet Balance Sheet by Fund 8
Exemptions/Waivers Exemptions & Waivers Detail 9
Table of ContentsFor the Period September 1, 2016 ‐ November 30, 2016
Houston Community College System

1
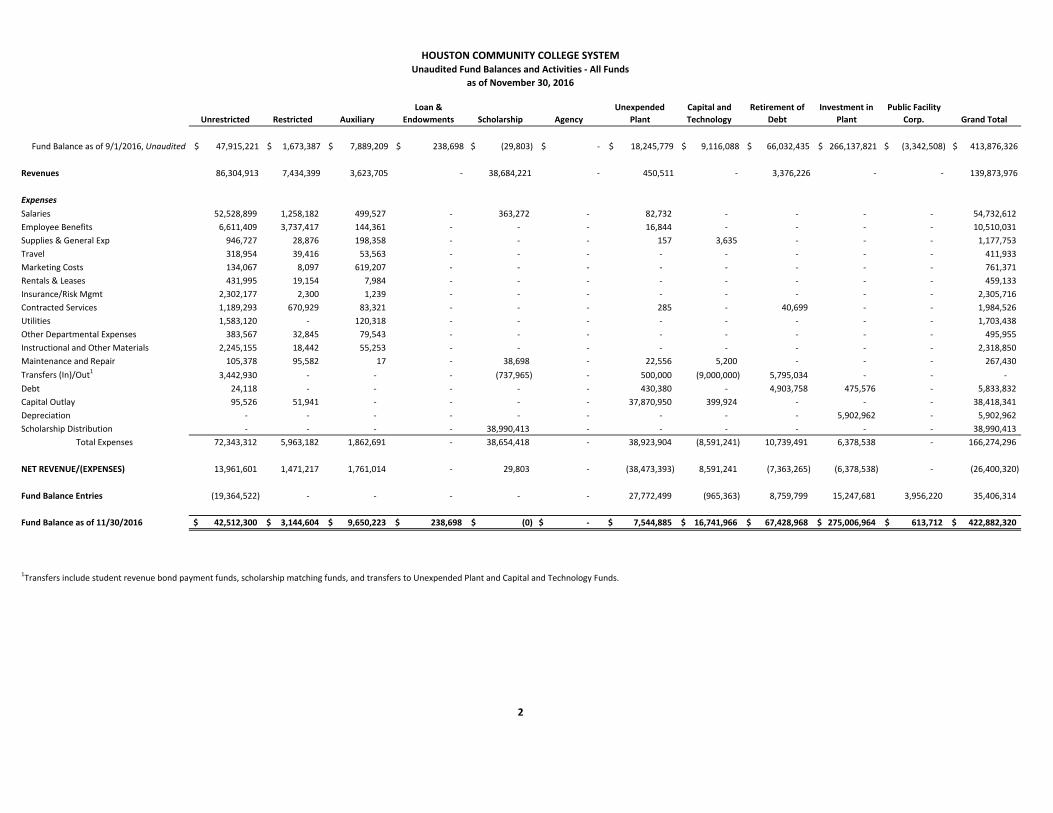
Houston Community College System Summary of Financial Statements
As of November 30, 2016
In the Unrestricted Fund as of November 30, 2016, total revenue received is $86.3 million. This
represents 25.5% of budgeted annual revenues of $338 million. Expenses total $72.3 million to
date; which is 21.4% of the total expense budget of $338 million. Compared with the same
time last year, revenue shows a 1% decrease, and expenses are 12.4% lower than the prior
year. Actual net revenue is $13.9 million to‐date. That translates into a like amount increase in
fund balance.
Salaries increased 5%. This increase is due namely to the compensation study alignment and an
across the board salary increase of 2% for full‐time employees.
The expenses in Transfers & Debt show a decrease of $8.7 million namely due to the
redemption of the PFC Westgate Bonds Series 2005A in the amount of $8.1 million in FY2016.
Total revenue and expenses are expected to fall within budget plan at year end.
Unrestricted Restricted Auxiliary
Loan &
Endowments Scholarship Agency
Unexpended
Plant
Capital and
Technology
Retirement of
Debt
Investment in
Plant
Public Facility
Corp. Grand Total
Fund Balance as of 9/1/2016, Unaudited $ 47,915,221 $ 1,673,387 $ 7,889,209 $ 238,698 $ (29,803) $ ‐ $ 18,245,779 $ 9,116,088 $ 66,032,435 $ 266,137,821 $ (3,342,508) $ 413,876,326
Revenues 86,304,913 7,434,399 3,623,705 ‐ 38,684,221 ‐ 450,511 ‐ 3,376,226 ‐ ‐ 139,873,976
ExpensesSalaries 52,528,899 1,258,182 499,527 ‐ 363,272 ‐ 82,732 ‐ ‐ ‐ ‐ 54,732,612
Employee Benefits 6,611,409 3,737,417 144,361 ‐ ‐ ‐ 16,844 ‐ ‐ ‐ ‐ 10,510,031
Supplies & General Exp 946,727 28,876 198,358 ‐ ‐ ‐ 157 3,635 ‐ ‐ ‐ 1,177,753
Travel 318,954 39,416 53,563 ‐ ‐ ‐ ‐ ‐ ‐ ‐ ‐ 411,933
Marketing Costs 134,067 8,097 619,207 ‐ ‐ ‐ ‐ ‐ ‐ ‐ ‐ 761,371
Rentals & Leases 431,995 19,154 7,984 ‐ ‐ ‐ ‐ ‐ ‐ ‐ ‐ 459,133
Insurance/Risk Mgmt 2,302,177 2,300 1,239 ‐ ‐ ‐ ‐ ‐ ‐ ‐ ‐ 2,305,716
Contracted Services 1,189,293 670,929 83,321 ‐ ‐ ‐ 285 ‐ 40,699 ‐ ‐ 1,984,526
Utilities 1,583,120 ‐ 120,318 ‐ ‐ ‐ ‐ ‐ ‐ ‐ ‐ 1,703,438
Other Departmental Expenses 383,567 32,845 79,543 ‐ ‐ ‐ ‐ ‐ ‐ ‐ ‐ 495,955
Instructional and Other Materials 2,245,155 18,442 55,253 ‐ ‐ ‐ ‐ ‐ ‐ ‐ ‐ 2,318,850
Maintenance and Repair 105,378 95,582 17 ‐ 38,698 ‐ 22,556 5,200 ‐ ‐ ‐ 267,430
Transfers (In)/Out1 3,442,930 ‐ ‐ ‐ (737,965) ‐ 500,000 (9,000,000) 5,795,034 ‐ ‐ ‐
Debt 24,118 ‐ ‐ ‐ ‐ ‐ 430,380 ‐ 4,903,758 475,576 ‐ 5,833,832
Capital Outlay 95,526 51,941 ‐ ‐ ‐ ‐ 37,870,950 399,924 ‐ ‐ ‐ 38,418,341
Depreciation ‐ ‐ ‐ ‐ ‐ ‐ ‐ ‐ ‐ 5,902,962 ‐ 5,902,962
Scholarship Distribution ‐ ‐ ‐ ‐ 38,990,413 ‐ ‐ ‐ ‐ ‐ ‐ 38,990,413
Total Expenses 72,343,312 5,963,182 1,862,691 ‐ 38,654,418 ‐ 38,923,904 (8,591,241) 10,739,491 6,378,538 ‐ 166,274,296
NET REVENUE/(EXPENSES) 13,961,601 1,471,217 1,761,014 ‐ 29,803 ‐ (38,473,393) 8,591,241 (7,363,265) (6,378,538) ‐ (26,400,320)
Fund Balance Entries (19,364,522) ‐ ‐ ‐ ‐ ‐ 27,772,499 (965,363) 8,759,799 15,247,681 3,956,220 35,406,314
Fund Balance as of 11/30/2016 42,512,300$ 3,144,604$ 9,650,223$ 238,698$ (0)$ ‐$ 7,544,885$ 16,741,966$ 67,428,968$ 275,006,964$ 613,712$ 422,882,320$
1Transfers include student revenue bond payment funds, scholarship matching funds, and transfers to Unexpended Plant and Capital and Technology Funds.
Unaudited Fund Balances and Activities ‐ All Funds
as of November 30, 2016
2
HOUSTON COMMUNITY COLLEGE SYSTEM

Year‐to‐Date Actuals
Thru November 30,
2016 FY2017 Budget
Actuals as a %
of Budget
Year‐to‐Date Actuals
Thru November 30,
2016
Year‐to‐Date Actuals
Thru November 30,
2015
Increase (Decrease)
FY2017 Compared to
FY2016
% Increase
(Decrease)
REVENUES
State Appropriations 23,504,344$ 70,162,214$ 33.5% 23,504,344$ 23,448,466$ 55,878$ 0.2%Ad Valorem Taxes 1,689,188 146,800,000 1.2% 1,689,188 107,410 1,581,778 1472.7%Tuition, Net 30,869,818 41,750,000 73.9% 30,869,818 32,690,314 (1,820,497) ‐5.6%Fees 26,266,742 66,632,000 39.4% 26,266,742 26,755,845 (489,103) ‐1.8%Other Local Income 688,957 2,500,000 27.6% 688,957 732,134 (43,177) ‐5.9%Tuition & Fee, Net
‐‐ Extended Learning3,166,699 9,500,000 33.3% 3,166,699 3,307,881 (141,181) ‐4.3%
Indirect Cost Revenues, Grant 119,165 620,000 19.2% 119,165 128,057 (8,892) ‐6.9%Total Revenues 86,304,913 337,964,214 25.5% 86,304,913 87,170,107 (865,194) ‐1.0%
EXPENSES
Salaries 52,528,899 205,683,480 25.5% 52,528,899 50,050,262 2,478,636 5.0%Employee Benefits 6,611,409 22,116,875 29.9% 6,611,409 5,999,435 611,974 10.2%Supplies Gen Exp 946,727 6,141,998 15.4% 946,727 759,476 187,252 24.7%Travel 318,954 2,342,615 13.6% 318,954 150,218 168,735 112.3%Marketing Costs 134,067 1,037,191 12.9% 134,067 56,892 77,175 135.7%Rental & Leases 431,995 2,475,748 17.4% 431,995 438,855 (6,860) ‐1.6%Insurance/Risk Mgmt 2,302,177 5,826,348 39.5% 2,302,177 4,465,345 (2,163,168) ‐48.4%Contract Services 1,189,293 24,012,980 5.0% 1,189,293 3,284,237 (2,094,944) ‐63.8%Utilities 1,583,120 11,261,576 14.1% 1,583,120 1,459,402 123,718 8.5%Other Departmental Expenses 383,567 2,248,672 17.1% 383,567 436,753 (53,186) ‐12.2%Instructional & Other Materials 2,245,155 10,557,659 21.3% 2,245,155 2,788,841 (543,686) ‐19.5%Maintenance & Repair 105,378 1,258,057 8.4% 105,378 96,354 9,024 9.4%Transfers/Debt 3,467,048 33,892,313 10.2% 3,467,048 12,206,707 (8,739,659) ‐71.6%Contingency ‐ 4,332,050 0.0% ‐ ‐ ‐ 0.0%Capital Outlay 95,526 4,776,652 2.0% 95,526 365,897 (270,371) ‐73.9%
Total Expenses 72,343,312$ 337,964,214$ 21.4% 72,343,312$ 82,558,674$ (10,215,362) ‐12.4%
NET REVENUE/(EXPENSES) 13,961,601$ ‐$ 0.0% 13,961,601$ 4,611,433$ 9,350,168$ 202.8%
HOUSTON COMMUNITY COLLEGE SYSTEMComparison to Budget and Comparison to Previous Fiscal Year
as of November 30, 2016
HCCS CURRENT UNRESTRICTED
3
25% of Year Expended

Main Leasing Misc. Auxiliary* Foundation Marketing
Bookstore
Commission
International
Student Services
Cafe Club NEO
3100 Main Scholarships
Subtotal
Uncommitted
25,538,684$ (16,975,895)$ (2,139,698)$ (24,867,927)$ 28,251,330$ (2,463,947)$ (1,657,679)$ (2,066,107)$ 3,618,760$
FY2017 Revenue 1,845,072 154,556 ‐ ‐ 1,091,995 ‐ 117,067 ‐ 3,208,691
Salaries 88,446 153,060 ‐ ‐ ‐ 94,417 59,155 ‐ 395,078
Benefits 16,828 66,849 ‐ ‐ ‐ 22,990 12,052 ‐ 118,719
Supplies Gen Exp 8,688 22,029 7,817 ‐ ‐ 2,645 ‐ 41,179
Travel ‐ 12,209 4,118 ‐ ‐ 2,583 ‐ ‐ 18,910
Marketing Costs ‐ 1,447 ‐ 617,761 ‐ ‐ ‐ ‐ 619,207
Rental & Leases ‐ 900 ‐ ‐ ‐ ‐ ‐ ‐ 900
Contract Services 13,487 39,000 3,688 ‐ ‐ ‐ 864 ‐ 57,038
Utilities 120,318 ‐ ‐ ‐ ‐ ‐ ‐ ‐ 120,318
Departmental Expenses ‐ 61,864 ‐ ‐ ‐ 3,018 ‐ ‐ 64,882
Instructional & Other
Materials ‐ ‐ ‐ ‐ ‐ ‐ 55,253 ‐ 55,253
Maintenance & Repair ‐ 17 ‐ ‐ ‐ ‐ ‐ ‐ 17
Insurance/Risk Mgmt ‐ 168 ‐ ‐ ‐ ‐ ‐ ‐ 168
Exemptions and Waivers ‐ ‐ ‐ ‐ ‐ ‐ ‐ 640,998 640,998
Transfer/Debt ‐ ‐ ‐ ‐ ‐ ‐ ‐ ‐ ‐
Capital Outlay ‐ ‐ ‐ ‐ ‐ ‐ ‐ ‐ ‐
Total Expense 247,767 357,541 15,622 617,761 ‐ 123,009 129,969 640,998 2,132,667
Contribution to Fund Balance 1,597,306 (202,985) (15,622) (617,761) 1,091,995 (123,009) (12,902) (640,998) 1,076,024
Auxiliary Fund Balance ‐ Uncommitted Portion 4,694,784$
* Expenditures in this category include mailroom, child day care, Minority Male Initiative, Govt. Relation, Mobile Go, etc.
4
Fund Balance –
September 1, 2016 (Unaudited )
HOUSTON COMMUNITY COLLEGE SYSTEMAuxiliary Budget By Fund
as of November 30, 2016
Auxilary Funds ‐ Uncommitted Portion

Total
Saigon Tech
Other
International
Initiatives
Subtotal
International
Student
Vending
Commission
Student
Activity Fee
Student
Athletic Fee Subtotal
Committed Total Auxiliary
391,768$ (154,092)$ 1,820,093$ 305,749$ 957,788$ 1,186,818$ 2,450,355$ 7,889,208$ (Unaudited)
FY2017 Revenue ‐ ‐ ‐ 10,500 596,125 449,388 1,056,013 4,264,703
Salaries ‐ ‐ ‐ 350 24,358 79,741 104,449 499,527
Benefits ‐ ‐ ‐ 4,065 21,577 25,642 144,361
Supplies Gen Exp 25 25 20,337 91,303 45,515 157,154 198,358
Travel 2,607 1,127 3,734 ‐ 11,961 18,959 30,920 53,563
Marketing Costs ‐ ‐ ‐ ‐ ‐ ‐ ‐ 619,207
Rental & Leases ‐ ‐ ‐ ‐ ‐ 7,084 7,084 7,984
Contract Services ‐ ‐ ‐ 3,050 3,600 19,632 26,282 83,321
Utilities ‐ ‐ ‐ ‐ ‐ ‐ ‐ 120,318
Departmental Expenses ‐ ‐ ‐ 375 887 13,400 14,662 79,543
Instructional & Other
Materials ‐ ‐ ‐ ‐ ‐ ‐ ‐ 55,253
Maintenance & Repair ‐ ‐ ‐ ‐ ‐ ‐ ‐ 17
Insurance/Risk Mgmt ‐ ‐ ‐ ‐ 294 777 1,071 1,239
Exemptions and Waivers ‐ ‐ ‐ ‐ ‐ ‐ ‐ 640,998
Transfer/Debt ‐ ‐ ‐ ‐ ‐ ‐ ‐ ‐
Capital Outlay ‐ ‐ ‐ ‐ ‐ ‐ ‐ ‐
Total Expense 2,632 1,127 3,759 24,112 136,467 206,685 367,264 2,503,689
Contribution to Fund Balance (2,632) (1,127) (3,759) (13,612) 459,658 242,703 688,749 1,761,014
Auxiliary Fund Balance ‐ Intl, Committed, Total 1,816,335$ 292,137$ 1,417,446$ 1,429,521$ 3,139,104$ 9,650,223$
HOUSTON COMMUNITY COLLEGE SYSTEMAuxiliary Budget By Fund
as of November 30, 2016
5
Auxiliary Funds ‐ International and Committed Portions
International Committed
Fund Balance –
September 1, 2016

as of November 30, 2016
Budgeted Expenditures CENTRAL NORTH
WEST
NORTH
EAST
SOUTH
WEST
SOUTH
EAST COLEMAN
EXTENDED
LEARNING
ACADEMIC
INSTRUCTION
Salary 9,673,295$ 9,719,918$ 12,433,369$ 10,937,715$ 6,124,587$ 12,979,435$ 11,676,383$ 60,293,019$
Employee Benefits ‐ ‐ ‐ ‐ ‐ ‐ ‐ ‐
Supplies & Gen 208,009 280,836 212,732 271,917 290,240 474,515 203,643 345,967
Travel 36,050 134,500 39,135 53,406 72,054 162,069 107,942 183,814
Marketing Costs 11,330 33,276 ‐ 550 73,814 4,281 261,057 30,392
Rentals & Leases 4,968 52,425 941,962 475,953 41,698 497,054 21,517 22,460
Insurance/Risk Mgmt ‐ ‐ ‐ ‐ ‐ 126 ‐ 511
Contracted Services 300,174 281,142 70,089 13,386 146,332 416,954 111,659 348,521
Utilities 5,550 ‐ 4,600 1,826 ‐ ‐ ‐ ‐
Other Departmental Expenses 36,831 81,819 44,031 48,859 68,680 177,044 56,688 89,434
Instructional And Other Materials 332,891 91,751 243,281 119,207 110,615 435,333 760,598 776,925
Maintenance and Repair 138,332 38,633 145,162 12,365 32,167 60,078 130,011 45,704
Transfers/Debt ‐ 7,723 ‐ ‐ ‐ ‐ ‐ ‐
Contingency 545,653 239,216 371,635 255,880 142,544 200,867 154,130 22,171
Capital Outlay 424,290 84,201 356,973 16,929 70,643 179,151 27,099 333,895
Total 11,717,373$ 11,045,440$ 14,862,969$ 12,207,993$ 7,173,374$ 15,586,907$ 13,510,727$ 62,492,813$
HOUSTON COMMUNITY COLLEGEFY 2016‐17 Adjusted Budget by Divisions
6

as of November 30, 2016
HOUSTON COMMUNITY COLLEGEFY 2016‐17 Adjusted Budget by Divisions
Budgeted Expenditures CHANCELLOR FINANCE &
ADMIN. SUSTAINABILITY
INSTRUCTIONAL
SERVICES
STUDENT
SERVICES SYSTEM Grand Total
Salary 8,441,074$ 34,477,172$ 3,448,618$ 19,433,185$ 5,256,663$ 789,047$ 205,683,480$
Employee Benefits ‐ ‐ ‐ ‐ ‐ 22,116,875 22,116,875
Supplies & Gen 709,750 835,815 127,428 399,103 194,459 1,587,584 6,141,998
Travel 251,890 274,304 66,235 865,777 95,439 ‐ 2,342,615
Marketing Costs 438,417 174,739 5,335 4,000 ‐ ‐ 1,037,191
Rentals & Leases 66,473 272,246 61,273 12,319 5,400 ‐ 2,475,748
Insurance/Risk Mgmt 5,824,129 ‐ ‐ 1,582 ‐ ‐ 5,826,348
Contracted Services 3,344,328 14,745,771 80,239 234,520 1,193,812 2,726,053 24,012,980
Utilities ‐ 1,766,727 ‐ 94 ‐ 9,482,779 11,261,576
Other Departmental Expenses 491,590 335,637 100,578 577,792 139,689 ‐ 2,248,672
Instructional And Other Materials 89,918 6,392,022 36,380 814,570 354,168 ‐ 10,557,659
Maintenance and Repair 20,909 629,814 4,438 444 ‐ ‐ 1,258,057
Transfers/Debt 200,000 43,591 ‐ ‐ ‐ 33,640,999 33,892,313
Contingency 159,000 112,384 30,082 330,947 197,000 1,570,541 4,332,050
Capital Outlay 307,386 2,802,262 116,252 53,413 4,158 ‐ 4,776,652
Total 20,344,864$ 62,862,484$ 4,076,858$ 22,727,746$ 7,440,788$ 71,913,878$ 337,964,214$
7

CURRENT &
LOAN FUNDS1PLANT & BOND
FUNDS2 Total All Funds
ASSETSCurrent Assets:
Cash & cash equivalents 86,094,275$ 43,693,404$ 129,787,679$ Restricted cash & cash equivalents 1,795,814 ‐ 1,795,814 Short term Investments ‐ ‐ ‐ Accounts/Other receivable (net) 23,002,623 2,854,196 25,856,819 Deferred charges 47,653 ‐ 47,653 Prepaids 55,879 673,299 729,178
Total Current Assets 110,996,244 47,220,898 158,217,143
Non‐current Assets:Restricted cash & cash equivalents ‐ 123,689,033 123,689,033 Restricted long‐term investments ‐ 56,074,272 56,074,272 Long‐term Investments 38,052,314 ‐ 38,052,314 Deferred Outflows of Resources: Pension 30,015,995 ‐ 30,015,995 Advance Funding Valuation Outflows ‐ 10,224,394 10,224,394 Capital Assets, net 1,200,172 1,106,441,899 1,107,642,071
Total Non‐current Assets 69,268,482 1,296,429,598 1,365,698,080
Total Assets 180,264,726$ 1,343,650,497$ 1,523,915,222$
LIABILITIESCurrent Liabilities:
Accounts payable 12,165,329 9,829,534 21,994,863
Accrued liabilities 611,859 12,258,048 12,869,907 Compensated absences 2,919,816 ‐ 2,919,816 Funds held for others 714,180 189,209 903,389 Deferred revenue 1,710,822 329,281 2,040,104 Notes payable‐current portion ‐ 9,143,299 9,143,299 Bonds payable‐current portion ‐ 28,320,000 28,320,000
Total Current Liabilities 18,122,006 60,069,371 78,191,377
Non‐current Liabilities:Deposits 440 ‐ 440 Net Pension Liability 78,185,706 ‐ 78,185,706 Deferred Inflows of Resources: Pension 28,410,749 ‐ 28,410,749 Advance Funding Valuation Inflows ‐ 2,787,029 2,787,029 Notes payable ‐ 142,974,407 142,974,407 Bonds payable ‐ 771,096,905 771,096,905 Capital lease obligations ‐ ‐ ‐
Total Non‐current Liabilities 106,596,895 916,858,341 1,023,455,236
Total Liabilities 124,718,901$ 976,927,712$ 1,101,646,613$
Fund Balance‐
August 31, 2016 Unaudited 60,954,420 359,120,057 420,074,477
Revenues Over Expenditures Unrestricted (6,909,616) (6,909,616) Restricted 1,501,020 1,501,020 Net Investment in Plant 7,602,729 7,602,729
Total Fund Balances 55,545,824$ 366,722,786$ 422,268,610$
Total Liabilities & Fund Balances 180,264,725$ 1,343,650,498$ 1,523,915,222$
1 In cludes Unrestricted, Restricted, Loan & Endowment, Scholarship, Agency and Auxiliary Funds.2 Includes Unexpended Plant, Retirement of Debt and Investment in Plant Funds.
Houston Community CollegeBalance Sheet By Fund
For Month Ended November 30, 2016
8

FY 2015‐16 FY 2016‐17
Budget:Adjusted Budget FY 2016‐17, Net 41,750,000$
Revenues Received:Tuition 46,484,449 36,188,655 35,842,351
Waivers & Exemptions:Dual Credit & Early College HS (5,302,212) (2,808,960) (4,194,609)
Other (1,440,396) (689,381) (777,924)
Total Waivers & Exemptions (6,742,608) (3,498,341) (4,972,533)
Total Tuition Revenue, Net 39,741,841$ 32,690,314$ 30,869,818$
Budget:Budget FY 2016‐17, Net 9,500,000$
Revenues Received:Tuition 10,105,286 3,750,263 3,805,727
Waivers & Exemptions:Department of Corrections (1,649,039) (442,382) (639,028)
Total EL Tuition Revenue, Net 8,456,247$ 3,307,881$ 3,166,699$
FY 2015‐16 FY 2016‐17
Dept of Corrections 1,649,039$ 442,382$ 639,028$ 44.5%
Dual Credit & Early College HS Waiver 5,302,212 2,808,960 4,194,609 49.3%
Other:
Employee Fee Exemptions 59,220 30,247 24,085 ‐20.4%
Firemen 10,035 2,354 10,095 328.8%
Hazelwood 792,654 342,794 436,092 27.2%
Deaf & Blind 203,182 120,835 123,931 2.6%
High Ranking Hi SCH Grad 1,519 775 1,140 47.1%
Child of Disabled Vet ETC 3,459 1,444 411 ‐71.5%
Emp of State Coll & Univ 2,372 ‐ 1,593 0.0%
Nonres Teach/Research Asst 965 80 1,151 1338.8%
Nonres Competitive Scholar 39,206 2,744 27,993 920.2%
Senior Citizens 12,315 6,865 7,243 5.5%
Scholarship Distribution ‐ 2,800 ‐ ‐100.0%
Foster Children‐Resident 160,182 89,752 28,966 ‐67.7%
Fire Academy Waiver (15) ‐ ‐ 0.0%
Undocumented Students 1,859 1,062 1,151 8.4%
TX Tomorrow Waiver 1,792 1,792 ‐ ‐100.0%
Surviving Spouse/Children 2,942 1,680 1,712 1.9%
Peace Officer Exemption 1,359 615 1,734 182.0%
Adopted Student Waiver 147,100 83,542 110,627 32.4%
Stipends 250 ‐ ‐ 0.0%
Total Other Exemptions 1,440,396 689,381 777,924 12.8%
Grand Total Exemptions & Waivers 8,391,647$ 3,940,723$ 5,611,561$ 42.4%
Year‐to‐Date
Activity thru
11/30/2016
Houston Community College
9
Actuals %
Inc/(Dec)YTD
vs. PriorYTD
Exemptions & WaiversThrough November 30, 2016
Account
End of Year
Activity
Year‐to‐Date
Activity thru
11/30/2015
Year‐to‐Date
Activity thru
11/30/2016
Tuition
Tuition ‐ Extended Learning
Exemptions & Waivers
End of Year
Activity
Year‐to‐Date
Activity thru
11/30/2015