Condensed Financial Statements as at 31 March 2016 · Condensed Financial Statements as at 31 March...
235
1 BANK LEUMI LE-ISRAEL B.M. AND ITS INVESTEE COMPANIES Condensed Financial Statements as at 31 March 2016 (unaudited) This is a translation from the Hebrew and has been prepared for convenience only. In the event of any discrepancy, the Hebrew will prevail.
Transcript of Condensed Financial Statements as at 31 March 2016 · Condensed Financial Statements as at 31 March...
1
BANK LEUMI LE-ISRAEL B.M. AND ITS INVESTEE COMPANIES
Condensed Financial Statements
as at 31 March 2016 (unaudited)
This is a translation from the Hebrew and has been prepared for convenience only. In the event of any
discrepancy, the Hebrew will prevail.
2
BANK LEUMI LE-ISRAEL B.M. AND ITS INVESTEE COMPANIES
Condensed Financial Statements
Table of contents Page
Report of the Board of Directors and Management
A. General Review, Goals and Strategy
Summary of Financial Position 4
Forward-Looking Information in the Report of the Board of Directors and Management 7
B. Explanation and Analysis of the Results and Business Condition
Trends, Phenomena, Developments and Material Changes 8
Significant Developments in Income, Expenses and Other Comprehensive Income 12
Structure and Development of Assets, Liabilities, Capital and Capital Adequacy 22
Operating Segments 34
Major Investee Companies 50
C. Review of Risks
Exposure to Risk and Methods of Risk Management 53
Credit Risk 53
Market Risk 71
Liquidity Risk 83
Operational Risks 85
Compliance Risks 86
D. Critical Accounting Policy and Estimates, Controls and Procedures
Accounting Policy and Estimates on Critical Subjects 88
Controls and Procedures regarding Disclosure in the Financial Statements 89
Board of Directors 90
Certification 92
Financial Statements 95
Corporate Governance, Additional Details and Appendices 219
Appendices 232

3

4
Report of the Board of Directors and Management
The Directors’ Report has been prepared in accordance with the Public Reporting Directives of the Supervisor
of Banks. The principles applied in preparing the interim reports are consistent with those used in preparing
the Annual Report as at 31 December 2015. These reports should be read in conjunction with the Annual
Report for 2015. Summary of Financial Position
The consolidated statement of profit and loss data are as follows:
For the year
ended
31 December
2016 2015 2015
Unaudited Audited
Interest income 1,925 1,502 8,784
Interest expenses 270 (14) 1,666
Net interest income 1,655 1,516 7,118
Expenses in respect of credit losses (123) 81 199
Net interest income after expenses in respect of credit losses 1,778 1,435 6,919
Non-interest income
Non-interest financing income 24 1,319 1,610
Commissions 988 1,051 4,092
Other income 20 55 595
Total non-interest income 1,032 2,425 6,297
Operating and other expenses
Salaries and related expenses 1,202 1,418 5,448
Building and equipment maintenance and depreciation 417 421 1,702
Amortization of intangible assets and goodwill - - 5
Other expenses 371 396 1,681
Total operating and other expenses 1,990 2,235 8,836
Profit before taxes 820 1,625 4,380
Provision for taxes on profit 371 565 1,691
Profit after taxes 449 1,060 2,689
Banking corporation's share in profits of companies included on equity
basis after tax 19 131 177
Net profit - - -
Before attributing to non-controlling interests 468 1,191 2,866
Attributed to non-controlling interests (9) (9) (31)
Attributed to shareholders of the banking corporation 459 1,182 2,835
Basic and diluted earnings per share:
Net profit attributed to shareholders of the banking corporation (in NIS) 0.30 0.80 1.92
For the three months
ended 31 March
NIS millions
(a)
(a )
(a)(a)(a )
(a)
(a)
(a) (a) (a)(a)(a(a(a)
(a) Restated as a result of a retroactive application of the directives of the Supervisor of Banks regarding the capitalization of software costs for self-development. For further information, ssee Note 1A.2.
Total assets under management of the Group (both balance sheet and off-balance sheet*) amounted to NIS 1,212 billion at 31 March 2016, similar to the end of 2015.
* Total assets, as well as customers' securities, the value of securities in custody of mutual funds, provident funds and supplementary training funds for which operational, management, custodial and pension counseling services are provided.

5
The consolidated balance sheet data are as follows:
31 March 2016 31 March 2015 31 December 2015
Unaudited Audited
NIS millions
Assets
Cash and deposits with banks 55,648 51,769 60,455
Securities 78,727 64,379 69,475
Securities borrowed or purchased under agreements
to resell 1,621 2,197 1,764
Credit to the public 267,705 254,223 265,070
Allowance for credit losses (3,572) (3,948) (3,671)
Credit to the public, net 264,133 250,275 261,399
Credit to governments 412 433 453
Investments in companies included on equity basis 899 896 924
Buildings and equipment 3,060 3,103 3,095
Intangible assets and goodwill 17 18 18
Assets in respect of derivative instruments 13,150 18,831 11,250
Other assets 7,890 7,418 7,666
Total assets 425,557 399,319 416,499
Liabilities and equity
Deposits of the public 330,354 305,017 328,693
Deposits from banks 4,441 6,187 3,859
Deposits from governments 808 517 750
Securities lent or sold under agreements to repurchase 845 1,384 938
Debentures, bonds and subordinated notes 24,810 19,596 21,308
Liabilities in respect of derivative instruments 13,996 18,086 11,098
Other liabilities 20,650 21,591 20,746
Total liabilities 395,904 372,378 387,392
Non-controlling interests 340 329 340
Equity attributable to shareholders of the banking
corporation 29,313 26,612 28,767
Total equity 29,653 26,941 29,107
Total liabilities and equity 425,557 399,319 416,499
(a)
(a)
(a)
(a)
(a) Restated, including a retroactive implementation of the directives of the Supervisor of Banks regarding the capitalization of software costs for self-development. For further information, see Note 1A.2.

6
The principal financial ratios (in %) are as follows:
31 March
2016
31 March
2015
31 December
2015
Credit to the public, net, to total balance sheet 62.1 62.7 62.8
Securities to total balance sheet 18.5 16.1 16.7
Deposits of the public to total balance sheet 77.6 76.4 78.9
Deposits of the public to total credit, net 125.1 121.9 125.7
Total equity to risk assets (a) 14.28 13.68 13.74
Tier 1 capital to risk assets 9.96 9.20 9.58
Leveraging ratio (g) 6.35 - 6.27
Liquidity coverage ratio (g) 125.0 - 105.00
Equity (excluding non-controlling interests) to balance sheet 6.9 6.7 6.9
Net profit to average equity (excluding
non-controlling interests) (c) 6.6 19.3 10.3
Rate of provision for tax on the profit before taxes 45.2 34.8 38.6
Expenses in respect of credit losses to credit to the
public, net (c) (0.19) 0.13 0.08
Of which: expenses in respect of collective allowance to credit
to the public, net (c) 0.23 0.25 0.17
Expenses in respect of credit losses to total risk of credit to the
public (c) (0.03) 0.02 0.05
Interest income, net to total balance sheet (c) 1.56 1.53 1.71
Total income to total assets (b)(c) 2.55 4.01 3.22
Total income to total assets managed by the Group (b)(c)(d) 0.91 1.28 1.11
Total operating and other expenses to total balance sheet (c) 1.88 2.26 2.12
Total operating and other expenses to total assets managed by
the Group (c)(d) 0.66 0.73 0.73
Net profit to total average assets (c)(e) 0.43 1.17 0.69
Interest margin 1.67 1.74 1.84
Operating and other expenses (excluding early retirement
expenses) to total income (b) 74.1 56.7 65.8
Non-interest income to operating and other expenses
(excluding early retirement expenses) 51.9 108.5 71.3
Non-interest income to total income (b) 38.4 61.5 46.9
(f)(f)
(a) Capital – with the addition of non-controlling interests and sundry adjustments.
(b) Total income – net interest income and noninterest income.
(c) On an annual basis
(d) Including off balance sheet activity.
(e) Average assets are total income-producing and other balance sheet assets.
(f) Restated, including retroactive application of the directives of the Supervisor of Banks regarding the capitalization of software
costs for self-development. For further information, see Note 1A.2.
(g) Pursuant to the Bank of Israel directives, the leverage ratio and the liquidity coverage ratio were computed from the second
quarter of 2015. Accordingly, comparative figures are not presented.
For further information regarding the leverage ratio, see chapter Structure and Development of the Assets and Liabilities, Capital
and Capital Adequacy, chapter on Capital and Capital Adequacy, and for further information regarding liquidity coverage ratio,
see chapter Exposure to Risks and Ways of Managing Them.

7
Forward-Looking Information in the Report of the Board of Directors and Management
The Director's Report includes, as mentioned above, in addition to data relating to the past, information that
relates to the future, which is defined in the Securities Law, 1968, ("the Law") as "forward-looking
information". Forward-looking information relates to a future event or matter, the realization of which is not
certain and is not within the exclusive control of the Bank.
Forward-looking information is generally drafted with words or phrases such as "the Bank believes", "the
Bank foresees", "the Bank expects", "the Bank intends", "the Bank plans", "the Bank estimates", "the Bank's
policy", "the Bank's programs", "the Bank's forecast", "expected", "strategy", "aims", "likely to affect" and
additional phrases testifying to the fact that the matter in question is a forecast of the future and not a past fact.
Forward-looking information included in the Directors' Report is based, inter alia, on forecasts of the future
regarding various matters related to economic developments in Israel and abroad, and especially to the
currency markets and the capital markets, to legislation, to directives of regulatory bodies, to the behavior of
competitors, to technological developments and to personnel matters.
As a result of the inability to foresee with certainty that these forecasts will be realized, and the fact that in
reality events may turn out differently from those forecasted, readers of the Report should relate to information
defined as "forward-looking" with caution, since reliance on such information involves risks and uncertainty
and the future financial and business results of the Leumi Group are likely to be materially different.
The Bank does not undertake to publish updates of the forward-looking information included in these reports.
The aforesaid does not derogate from the Bank's reporting obligation by any law.

8
Trends, Phenomena, Developments and Material Changes
Principal Developments in the Economy1
The combined index for examining the state of the economy published each month by the Bank of Israel
increased in the first quarter of the year by 0.8%, in annual terms, compared with the fourth quarter of 2015
and by 1.7%, compared with the corresponding quarter last year. The slow growth derives from fall in exports
and public consumption, alongside an increase in public consumption and investments in the economy.
The global economy
In April 2016, the International Monetary Fund revised its estimate of the expected development of growth in
the world for 2016. In comparison to a previous announcement in January 2016, the forecast among the
advanced countries was revised downward. According to the Fund's revised estimates, growth in the United
States and the Euro Area in 2016 is expected to amount to 2.4% and 1.5%, respectively, compared to 2.4% and
1.6%, respectively in 2015. The forecast for growth of global output in 2016 is 3.2%.
The State Budget and its Financing
During the first three months of the year, the Government's budget surplus amounted to some NIS 1.0 billion,
this compared with NIS 0.5 billion surplus in the corresponding period of last year. The planned annual deficit
for 2016 is NIS 35.0 billion (2.9% of GDP), whereas according to the Ministry of Finance's estimates for the
last 12 months ended in March 2016, the budget deficit totaled some 2.1% of GDP. Some of the budget
surplus since the beginning of the year can be explained by an increase in the State's income from taxes over
the budget collection forecast at the basis of the budget, amounting to NIS 1.5 billion.
Foreign trade and capital movements
Israel's total trade deficit in the first quarter of the year amounted to US$ 2.6 billion, an increase of US$ 1.6
billion, compared with the deficit in the corresponding period last year. The increase in the trade deficit
derives from a significant fall in exports (particularly in the diamonds, chemicals and medicines sector),
compared with an increase in imports.
In the first three months of the year, total foreign currency capital inflows were higher than capital outflows.
Direct investments in Israel by foreign residents, via the banking system, amounted to US$ 2.5 billion, while
financial investments of foreign residents amounted US$ 1.9 billion. On the other hand, total investments of
Israeli residents abroad (the direct investments via the banks in Israel and financial investments) amounted to
US$ 0.1 billion.
Exchange Rate and Foreign Currency Reserves
In the first quarter of the year, the shekel appreciated against the dollar by a rate of some 3.5%, while relative
to the euro, a devaluation of 0.9% was recorded. During this period, the shekel appreciated against the
effective nominal currency basket by 1.3%.
Foreign currency balances in the Bank of Israel at the end of March 2016 amounted to US$ 94.8 billion,
compared with US$ 90.6 billion at the end of 2015.
In the first quarter of the year, foreign currency purchases by the Bank of Israel totaled US$ 0.6 billion as part
of a program of purchases to offset the effect of gas production on the exchange rate. In total, the Bank of
Israel purchased foreign currency amounting to US$ 1.0 billion during this period.
Inflation and Monetary Policy
The consumer price index fell in the first quarter of the year by 1.0%, while in the 12 months ending March
2016 it fell by 0.7%. This rate is under the lower limit of the Government's target range of the price stability of
1% to 3%. Most of the index items fell in the first quarter with transportation and communication items being
the main contributor, mainly due to the effect of the decline in oil prices.
During the first quarter of the year, as in the decisions in both April and May, there was no change in Bank of
Israel's interest rate, and it stands at 0.1%. In the May 2016 interest announcement, the Monetary Committee
stated that it continues to estimate that the monetary policy will remain expansionary for the long term, and it
also contemplates that the chances for achieving the inflation and growth goals remain high.
1 Sources of the data: Publications of the Central Bureau of Statistics, the Bank of Israel, the Finance Ministry and the Stock Exchange.

9
Israeli capital market
The shares and convertible securities index fell by 8.7% in the first three months of the year, following an
increase of 6.8% in 2015, similar to the global trend and by the effect of the situation in the Chinese stock
exchanges.
Average daily trading volumes of shares and convertible securities decreased in the first quarter of the year by
4.0%, compared with the average for 2015, and amounted to NIS 1,391 million.
The Government bond market was characterized during the months of January-March by an increase in prices.
The price of index-linked Government bonds rose by 1.8%, while unlinked Government bonds increased by
1.2% (the fixed-interest bond indices rose by 1.4%, while the variable-interest (Gilon) bond index fell by
0.1%). A possible explanation for this rise in prices is the shifting from assets of high risk level (shares) to a
lower risk level (bonds), in view of the growing risk in the global markets.
In the index-linked non-government debenture market (corporate bonds) in the first quarter of the year, there
were moderate price increases of some 1.1%, following price increases of some 0.8% in 2015.
Financial Assets held by the Public
The value of the portfolio of financial assets held by the public decreased in the first quarter months of the
year by 0.6%, amounting to NIS 3,296 billion at the end of March 2016. This decrease in the value of the
portfolio derived from a decrease in the value of shares held by the public. The proportion of shares (in Israel
and abroad) in the financial assets portfolio of the Israeli public at the end of March 2016 reached 21.6%,
compared with 23.0% in December 2015.
Bank Credit
Bank credit in the economy granted to the private sector, including corporate credit and household credit,
(before allowances for credit losses) increased in the first two months of the year by 1.0%. This was
a consequence of a 1.4% increase in credit extended to the corporate sector and a 0.5% increase in credit
extended to the household sector. The development of the components of credit to the household sector
indicated an increase in housing credit of 0.8%, with non-housing credit (consumer credit) reducing by 0.2%.
The following table sets out details of changes in representative exchange rates and the CPI and
the rates of change therein:
31 March 31 December
2016 2015 2015 2014
NIS
Exchange rate:
U.S. Dollar 3.766 3.980 3.902 3.889
Euro 4.286 4.273 4.247 4.725
Pound Sterling 5.427 5.881 5.784 6.064
Swiss Franc 3.919 4.089 3.925 3.929
Consumer price index: (points)
The "known" index 98.3 98.5 99.2 100.1
The index for 98.1 98.8 99.1 100.1
The following table sets out changes in the consumer price index and exchange rates:
31 March Year
2016 2015 2015
(in percentages)
Rate of decrease in the "known" index (0.9) (1.6) (0.9)
Rate of increase (decrease) in the U.S.
dollar exchange rate (3.5) 2.3 0.3
Rate of increase (decrease) in the euro
exchange rate 0.9 (9.6) (10.1)
Rate of decrease in the pound sterling
exchange rate (6.2) (3.0) (4.6)
Rate of increase (decrease) in the Swiss
franc exchange rate (0.2) 4.1 (0.1)
10
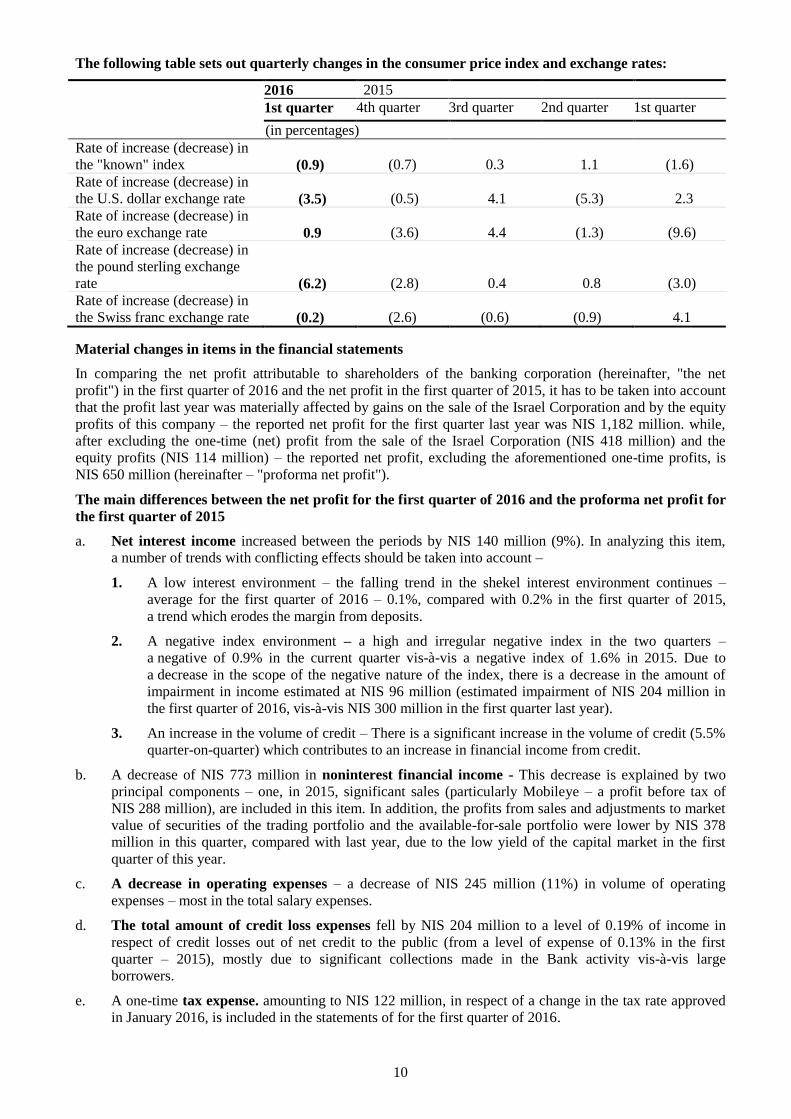
The following table sets out quarterly changes in the consumer price index and exchange rates:
2016 2015
1st quarter 4th quarter 3rd quarter 2nd quarter 1st quarter
(in percentages)
Rate of increase (decrease) in
the "known" index (0.9) (0.7) 0.3 1.1 (1.6)
Rate of increase (decrease) in
the U.S. dollar exchange rate (3.5) (0.5) 4.1 (5.3) 2.3
Rate of increase (decrease) in
the euro exchange rate 0.9 (3.6) 4.4 (1.3) (9.6)
Rate of increase (decrease) in
the pound sterling exchange
rate (6.2) (2.8) 0.4 0.8 (3.0)
Rate of increase (decrease) in
the Swiss franc exchange rate (0.2) (2.6) (0.6) (0.9) 4.1
Material changes in items in the financial statements
In comparing the net profit attributable to shareholders of the banking corporation (hereinafter, "the net
profit") in the first quarter of 2016 and the net profit in the first quarter of 2015, it has to be taken into account
that the profit last year was materially affected by gains on the sale of the Israel Corporation and by the equity
profits of this company – the reported net profit for the first quarter last year was NIS 1,182 million. while,
after excluding the one-time (net) profit from the sale of the Israel Corporation (NIS 418 million) and the
equity profits (NIS 114 million) – the reported net profit, excluding the aforementioned one-time profits, is
NIS 650 million (hereinafter – "proforma net profit").
The main differences between the net profit for the first quarter of 2016 and the proforma net profit for
the first quarter of 2015
a. Net interest income increased between the periods by NIS 140 million (9%). In analyzing this item,
a number of trends with conflicting effects should be taken into account –
1. A low interest environment – the falling trend in the shekel interest environment continues –
average for the first quarter of 2016 – 0.1%, compared with 0.2% in the first quarter of 2015,
a trend which erodes the margin from deposits.
2. A negative index environment – a high and irregular negative index in the two quarters –
a negative of 0.9% in the current quarter vis-à-vis a negative index of 1.6% in 2015. Due to
a decrease in the scope of the negative nature of the index, there is a decrease in the amount of
impairment in income estimated at NIS 96 million (estimated impairment of NIS 204 million in
the first quarter of 2016, vis-à-vis NIS 300 million in the first quarter last year).
3. An increase in the volume of credit – There is a significant increase in the volume of credit (5.5%
quarter-on-quarter) which contributes to an increase in financial income from credit.
b. A decrease of NIS 773 million in noninterest financial income - This decrease is explained by two
principal components – one, in 2015, significant sales (particularly Mobileye – a profit before tax of
NIS 288 million), are included in this item. In addition, the profits from sales and adjustments to market
value of securities of the trading portfolio and the available-for-sale portfolio were lower by NIS 378
million in this quarter, compared with last year, due to the low yield of the capital market in the first
quarter of this year.
c. A decrease in operating expenses – a decrease of NIS 245 million (11%) in volume of operating
expenses – most in the total salary expenses.
d. The total amount of credit loss expenses fell by NIS 204 million to a level of 0.19% of income in
respect of credit losses out of net credit to the public (from a level of expense of 0.13% in the first
quarter – 2015), mostly due to significant collections made in the Bank activity vis-à-vis large
borrowers.
e. A one-time tax expense. amounting to NIS 122 million, in respect of a change in the tax rate approved
in January 2016, is included in the statements of for the first quarter of 2016.

11
The net profit per share attributable to the shareholders of the banking corporation in the first quarter of 2016
was NIS 0.30, compared with NIS 0.80 in the first quarter of 2015.
Total profit after the effect of tax (in addition to the net profit including adjustments in respect of the
presentation of available-for-sale securities at fair value, adjustments in respect of employee benefits and
adjustments from the translation of the financial statements) amounted to a loss of NIS 90 million in the first
quarter of 2016. The total loss derives from the negative effect of a fund in respect of employee benefits
amounting to NIS 592 million, which partly offset the total net profit and the positive movement in the quarter
in the adjustment fund of available-for-sale securities amounting to NIS 96 million.
For further information, see chapter "Structure and Development of Assets, Liabilities, Capital and Capital Adequacy,
section, "Securities".
12
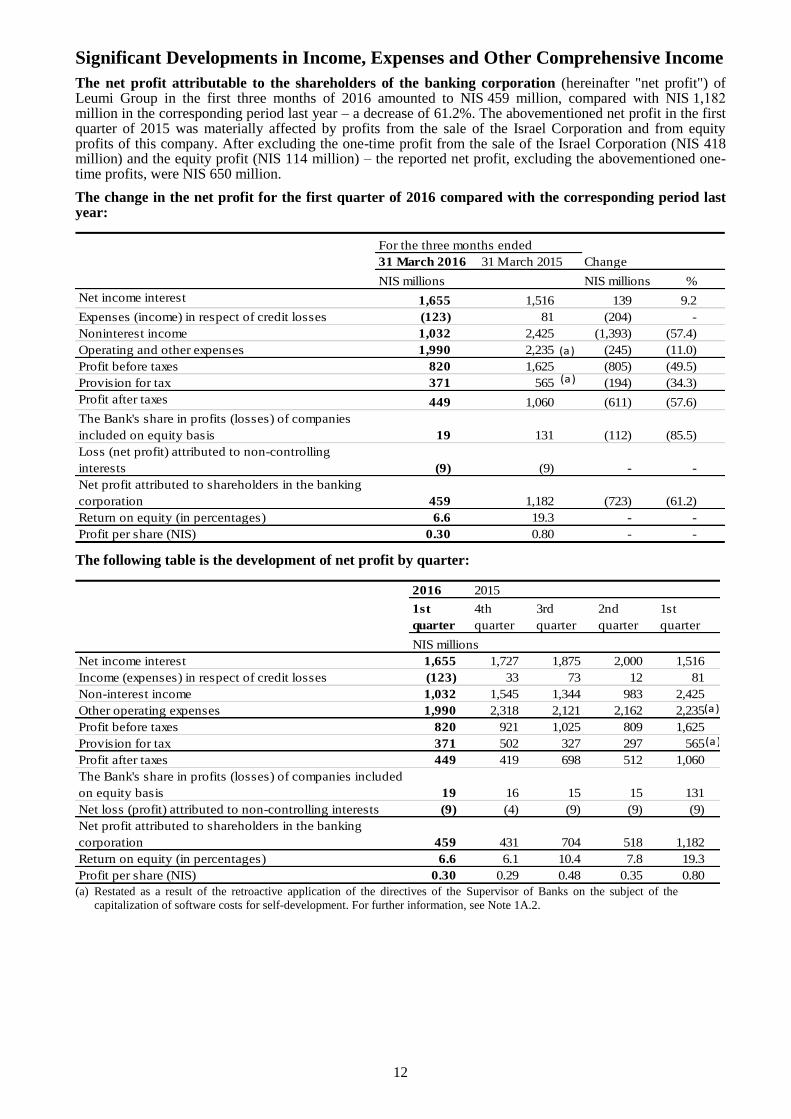
Significant Developments in Income, Expenses and Other Comprehensive Income
The net profit attributable to the shareholders of the banking corporation (hereinafter "net profit") of Leumi Group in the first three months of 2016 amounted to NIS 459 million, compared with NIS 1,281 million in the corresponding period last year – a decrease of 61.2%. The abovementioned net profit in the first quarter of 2015 was materially affected by profits from the sale of the Israel Corporation and from equity profits of this company. After excluding the one-time profit from the sale of the Israel Corporation (NIS 418 million) and the equity profit (NIS 114 million) – the reported net profit, excluding the abovementioned one-time profits, were NIS 650 million.
The change in the net profit for the first quarter of 2016 compared with the corresponding period last year:
31 March 2016 31 March 2015
NIS millions NIS millions %
Net income interest 1,655 1,516 139 9.2
Expenses (income) in respect of credit losses (123) 81 (204) -
Noninterest income 1,032 2,425 (1,393) (57.4)
Operating and other expenses 1,990 2,235 (245) (11.0)
Profit before taxes 820 1,625 (805) (49.5)
Provision for tax 371 565 (194) (34.3)
Profit after taxes 449 1,060 (611) (57.6)
The Bank's share in profits (losses) of companies
included on equity basis 19 131 (112) (85.5)
Loss (net profit) attributed to non-controlling
interests (9) (9) - -
Net profit attributed to shareholders in the banking
corporation 459 1,182 (723) (61.2)
Return on equity (in percentages) 6.6 19.3 - -
Profit per share (NIS) 0.30 0.80 - -
Change
For the three months ended
(a)
(a)
The following table is the development of net profit by quarter:
2016 2015
1st
quarter
4th
quarter
3rd
quarter
2nd
quarter
1st
quarter
NIS millions
Net income interest 1,655 1,727 1,875 2,000 1,516
Income (expenses) in respect of credit losses (123) 33 73 12 81
Non-interest income 1,032 1,545 1,344 983 2,425
Other operating expenses 1,990 2,318 2,121 2,162 2,235
Profit before taxes 820 921 1,025 809 1,625
Provision for tax 371 502 327 297 565
Profit after taxes 449 419 698 512 1,060
The Bank's share in profits (losses) of companies included
on equity basis 19 16 15 15 131
Net loss (profit) attributed to non-controlling interests (9) (4) (9) (9) (9)
Net profit attributed to shareholders in the banking
corporation 459 431 704 518 1,182
Return on equity (in percentages) 6.6 6.1 10.4 7.8 19.3
Profit per share (NIS) 0.30 0.29 0.48 0.35 0.80
(a)
(a)
(a) Restated as a result of the retroactive application of the directives of the Supervisor of Banks on the subject of the
capitalization of software costs for self-development. For further information, see Note 1A.2.
13
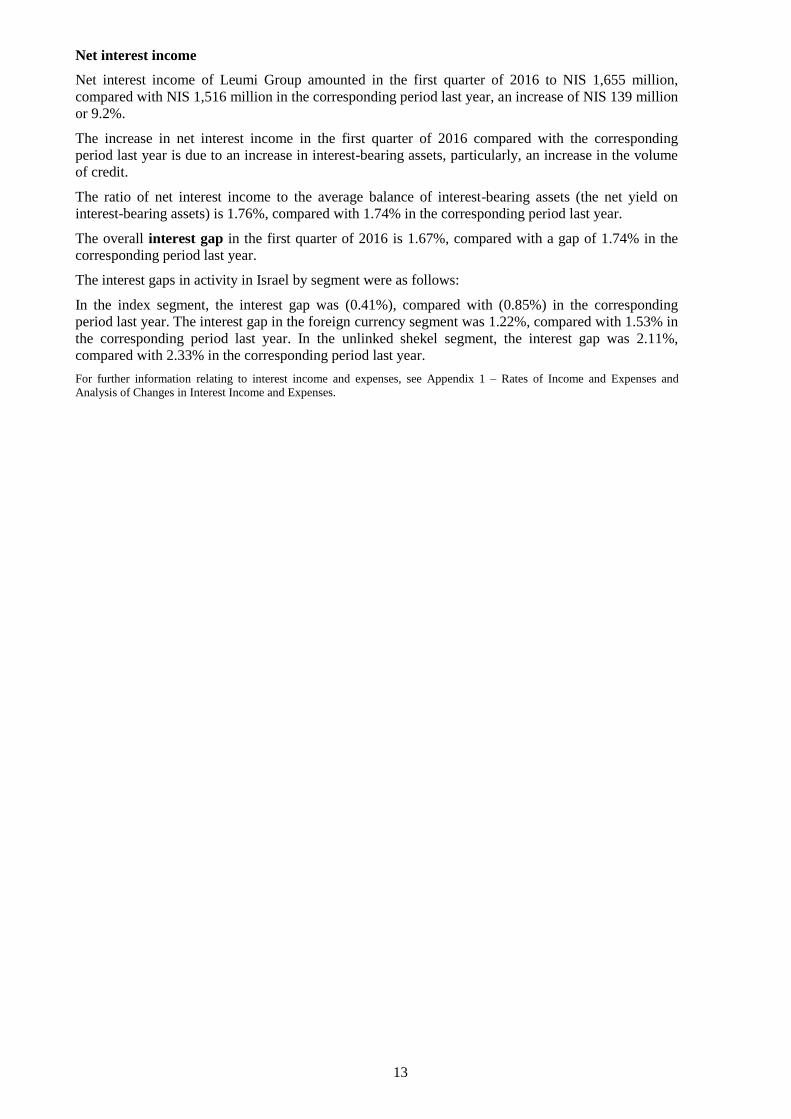
Net interest income
Net interest income of Leumi Group amounted in the first quarter of 2016 to NIS 1,655 million,
compared with NIS 1,516 million in the corresponding period last year, an increase of NIS 139 million
or 9.2%.
The increase in net interest income in the first quarter of 2016 compared with the corresponding
period last year is due to an increase in interest-bearing assets, particularly, an increase in the volume
of credit.
The ratio of net interest income to the average balance of interest-bearing assets (the net yield on
interest-bearing assets) is 1.76%, compared with 1.74% in the corresponding period last year.
The overall interest gap in the first quarter of 2016 is 1.67%, compared with a gap of 1.74% in the
corresponding period last year.
The interest gaps in activity in Israel by segment were as follows:
In the index segment, the interest gap was (0.41%), compared with (0.85%) in the corresponding
period last year. The interest gap in the foreign currency segment was 1.22%, compared with 1.53% in
the corresponding period last year. In the unlinked shekel segment, the interest gap was 2.11%,
compared with 2.33% in the corresponding period last year.
For further information relating to interest income and expenses, see Appendix 1 – Rates of Income and Expenses and
Analysis of Changes in Interest Income and Expenses.

14
Expenses in respect of credit losses
For the three months ended 31 March
2016 2015 Change
NIS millions NIS millions %
Individual expense (income) in respect of credit losses (275) (74) (201) -
Collective expenses (income) in respect of credit losses 152 155 (3) (1.9)
Total expense (income) in respect of credit losses (123) 81 (204) -
Percentage ratios:
Rate of individual expenses (income) in respect of
credit losses to total credit to the public, net (0.42) (0.12)
Rate of collective expense in respect of credit
losses to total credit to the public, net 0.23 0.25
Rate of total expenses (income) in respect of
credit losses to total credit to the public, net (0.19) 0.13
2016 2015
1st quarter 4th quarter 3rd quarter 2nd quarter 1st quarter
NIS millions
Individual expense (income) in respect of credit
losses (275) (54) (14) (112) (74)
Collective expense in respect of credit losses 152 87 87 124 155
Total expense (income) in respect of credit losses
(123) 33 73 12 81
Percentage ratios (in annual terms):
Rate of individual expenses (income) in respect of
credit losses to total credit to the public, net (0.42) (0.08) (0.02) (0.17) (0.12)
Rate of collective expense in respect of credit
losses to total credit to the public, net 0.23 0.13 0.13 0.19 0.25
Rate of total expenses (income) in respect of
credit losses to total credit to the public, net (0.19) 0.05 0.11 0.02 0.13
Income in respect of credit losses of Leumi Group amounted to NIS 123 million in the first quarter of 2016,
compared with expenses of NIS 81 million in the corresponding period last year. Income in the first quarter of
2016 derives from high collection during the current quarter.
For further information relating to credit loss expenses, see Note 6 and Note 13.
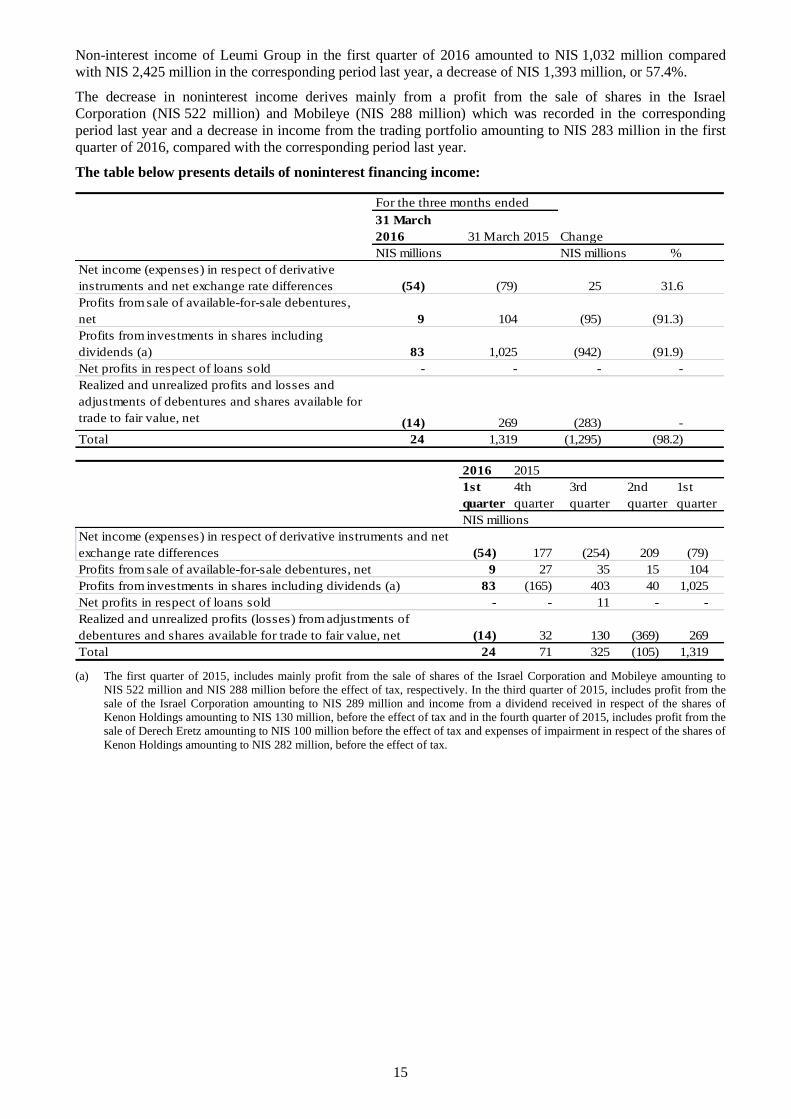
Non-interest Income
For the three months ended
31 March 2016 31 March 2015 Change
NIS million NIS million %
Non-interest financial income 24 1,319 (1,295) (98.2)
Commissions 988 1,051 (63) (6.0)
Other income 20 55 (35) (63.6)
Total 1,032 2,425 (1,393) (57.4)
2016 2015
1st
quarter
4th
quarter
3rd
quarter
2nd
quarter
1st
quarter
Non-interest financial income 24 71 325 (105) 1,319
Commissions 988 993 1,013 1,035 1,051
Other income 20 481 6 53 55
Total 1,032 1,545 1,344 983 2,425
NIS millions
15
Non-interest income of Leumi Group in the first quarter of 2016 amounted to NIS 1,032 million compared
with NIS 2,425 million in the corresponding period last year, a decrease of NIS 1,393 million, or 57.4%.
The decrease in noninterest income derives mainly from a profit from the sale of shares in the Israel
Corporation (NIS 522 million) and Mobileye (NIS 288 million) which was recorded in the corresponding
period last year and a decrease in income from the trading portfolio amounting to NIS 283 million in the first
quarter of 2016, compared with the corresponding period last year.
The table below presents details of noninterest financing income:
For the three months ended
31 March
2016 31 March 2015
NIS millions NIS millions %
Net income (expenses) in respect of derivative
instruments and net exchange rate differences (54) (79) 25 31.6
Profits from sale of available-for-sale debentures,
net 9 104 (95) (91.3)
Profits from investments in shares including
dividends (a) 83 1,025 (942) (91.9)
Net profits in respect of loans sold - - - -
Realized and unrealized profits and losses and
adjustments of debentures and shares available for
trade to fair value, net (14) 269 (283) -
Total 24 1,319 (1,295) (98.2)
Change
2016 2015
1st
quarter
4th
quarter
3rd
quarter
2nd
quarter
1st
quarter
Net income (expenses) in respect of derivative instruments and net
exchange rate differences (54) 177 (254) 209 (79)
Profits from sale of available-for-sale debentures, net 9 27 35 15 104
Profits from investments in shares including dividends (a) 83 (165) 403 40 1,025
Net profits in respect of loans sold - - 11 - -
Realized and unrealized profits (losses) from adjustments of
debentures and shares available for trade to fair value, net (14) 32 130 (369) 269
Total 24 71 325 (105) 1,319
NIS millions
(a) The first quarter of 2015, includes mainly profit from the sale of shares of the Israel Corporation and Mobileye amounting to
NIS 522 million and NIS 288 million before the effect of tax, respectively. In the third quarter of 2015, includes profit from the
sale of the Israel Corporation amounting to NIS 289 million and income from a dividend received in respect of the shares of
Kenon Holdings amounting to NIS 130 million, before the effect of tax and in the fourth quarter of 2015, includes profit from the
sale of Derech Eretz amounting to NIS 100 million before the effect of tax and expenses of impairment in respect of the shares of
Kenon Holdings amounting to NIS 282 million, before the effect of tax.
16
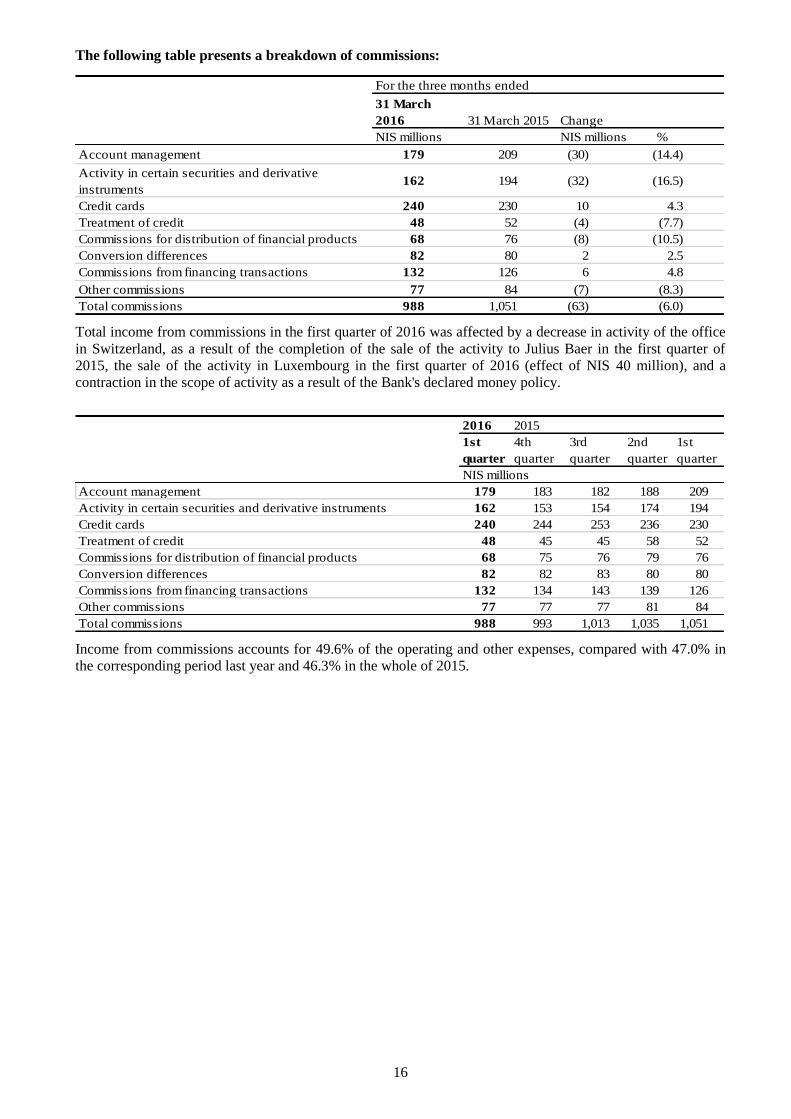
The following table presents a breakdown of commissions:
31 March
2016 31 March 2015
NIS millions NIS millions %
Account management 179 209 (30) (14.4)
Activity in certain securities and derivative
instruments 162 194 (32) (16.5)
Credit cards 240 230 10 4.3
Treatment of credit 48 52 (4) (7.7)
Commissions for distribution of financial products 68 76 (8) (10.5)
Conversion differences 82 80 2 2.5
Commissions from financing transactions 132 126 6 4.8
Other commissions 77 84 (7) (8.3)
Total commissions 988 1,051 (63) (6.0)
For the three months ended
Change
Total income from commissions in the first quarter of 2016 was affected by a decrease in activity of the office
in Switzerland, as a result of the completion of the sale of the activity to Julius Baer in the first quarter of
2015, the sale of the activity in Luxembourg in the first quarter of 2016 (effect of NIS 40 million), and a
contraction in the scope of activity as a result of the Bank's declared money policy.
2016 2015
1st
quarter
4th
quarter
3rd
quarter
2nd
quarter
1st
quarter
Account management 179 183 182 188 209
Activity in certain securities and derivative instruments 162 153 154 174 194
Credit cards 240 244 253 236 230
Treatment of credit 48 45 45 58 52
Commissions for distribution of financial products 68 75 76 79 76
Conversion differences 82 82 83 80 80
Commissions from financing transactions 132 134 143 139 126
Other commissions 77 77 77 81 84
Total commissions 988 993 1,013 1,035 1,051
NIS millions
Income from commissions accounts for 49.6% of the operating and other expenses, compared with 47.0% in
the corresponding period last year and 46.3% in the whole of 2015.

17
Details of other income are as follows:
For the three months ended
31 March
2016
31 March
2015 Change
NIS millions NIS millions %
Profits from severance pay fund - 38 )38( )100.0(
Other income including the sale of buildings and
equipment 20 17 3 17.6
Total 20 55 )35( )63.6(
The decrease in profits from the reserve for severance pay derives from negative yields in the first quarter of
2016, compared with positive yields in the corresponding period last year.
2016 2015
1st quarter 4th quarter 3rd quarter 2nd quarter 1st quarter
Profits from severance pay fund - 15 (24) 6 38
Other income including the sale of buildings and
equipment 20 466 30 47 17
Total 20 481 6 53 55
NIS millions
(a) In the first quarter of 2015 including profit from the sale of buildings in the subsidiary in the United States amounting to NIS 380
million.
The weight of noninterest income as a percentage of total income (i.e., net interest income and noninterest
income) was 38.4%, compared with 61.5% in the corresponding period last year and 46.9% in the whole of
2015.
18
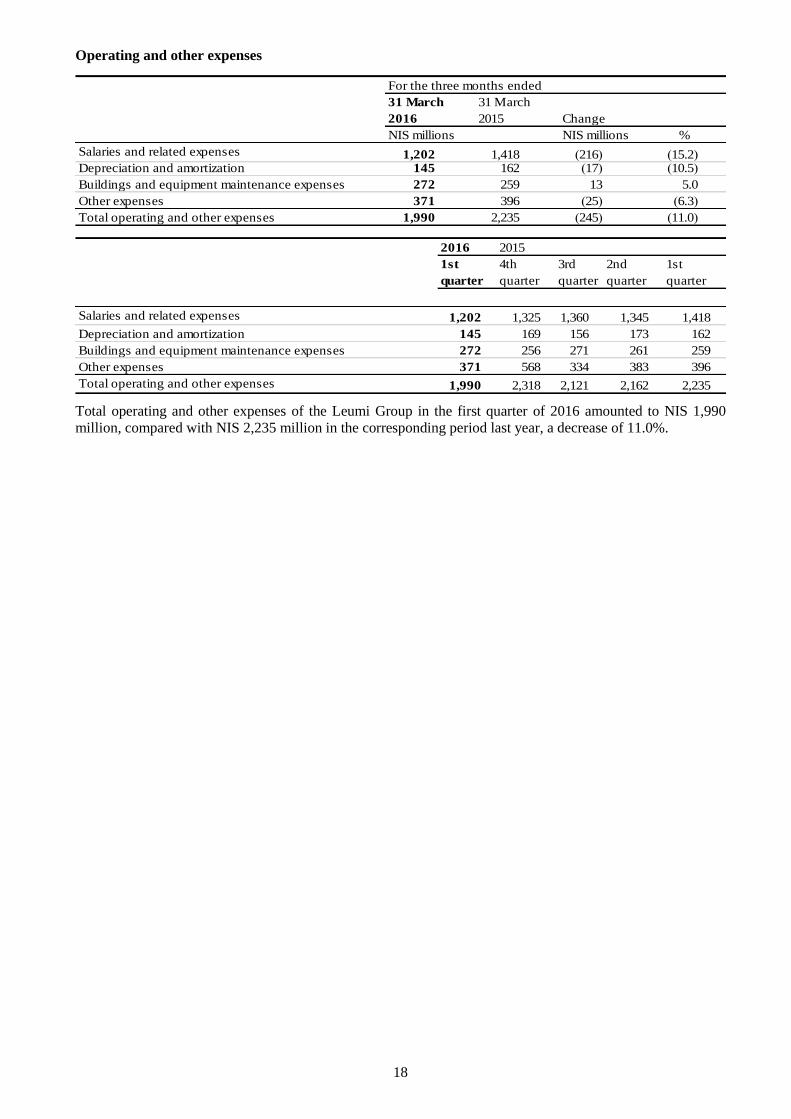
Operating and other expenses
31 March
2016
31 March
2015
NIS millions NIS millions %
Salaries and related expenses 1,202 1,418 )216( )15.2(Depreciation and amortization 145 162 )17( )10.5(
Buildings and equipment maintenance expenses 272 259 13 5.0
Other expenses 371 396 )25( )6.3(
Total operating and other expenses 1,990 2,235 )245( )11.0(
For the three months ended
Change
2016 2015
1st
quarter
4th
quarter
3rd
quarter
2nd
quarter
1st
quarter
Salaries and related expenses 1,202 1,325 1,360 1,345 1,418
Depreciation and amortization 145 169 156 173 162
Buildings and equipment maintenance expenses 272 256 271 261 259
Other expenses 371 568 334 383 396
Total operating and other expenses 1,990 2,318 2,121 2,162 2,235
Total operating and other expenses of the Leumi Group in the first quarter of 2016 amounted to NIS 1,990
million, compared with NIS 2,235 million in the corresponding period last year, a decrease of 11.0%.
19
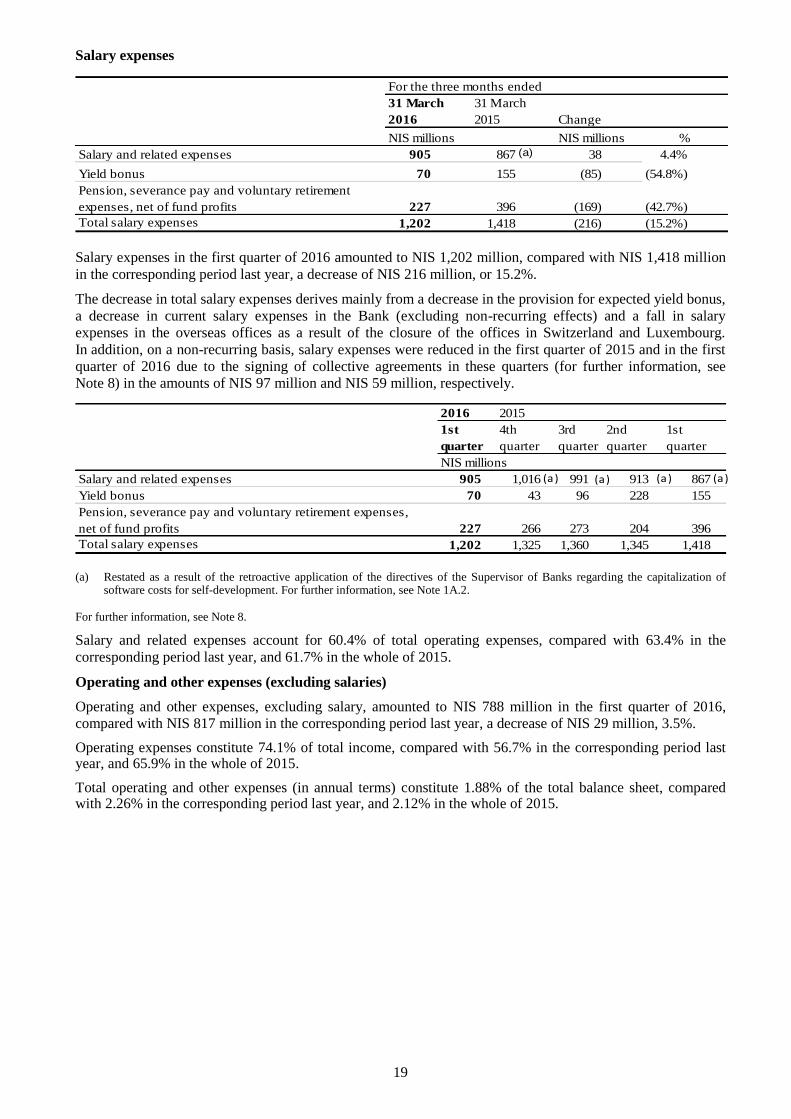
Salary expenses
For the three months ended
31 March
2016
31 March
2015 Change
NIS millions NIS millions %
Salary and related expenses 905 867 38 4.4%
Yield bonus 70 155 (85) (54.8%)
Pension, severance pay and voluntary retirement
expenses, net of fund profits 227 396 (169) (42.7%)
Total salary expenses 1,202 1,418 (216) (15.2%)
(a)
Salary expenses in the first quarter of 2016 amounted to NIS 1,202 million, compared with NIS 1,418 million
in the corresponding period last year, a decrease of NIS 216 million, or 15.2%.
The decrease in total salary expenses derives mainly from a decrease in the provision for expected yield bonus,
a decrease in current salary expenses in the Bank (excluding non-recurring effects) and a fall in salary
expenses in the overseas offices as a result of the closure of the offices in Switzerland and Luxembourg.
In addition, on a non-recurring basis, salary expenses were reduced in the first quarter of 2015 and in the first
quarter of 2016 due to the signing of collective agreements in these quarters (for further information, see
Note 8) in the amounts of NIS 97 million and NIS 59 million, respectively.
2016 2015
1st
quarter
4th
quarter
3rd
quarter
2nd
quarter
1st
quarter
Salary and related expenses 905 1,016 991 913 867
Yield bonus 70 43 96 228 155
Pension, severance pay and voluntary retirement expenses,
net of fund profits 227 266 273 204 396
Total salary expenses 1,202 1,325 1,360 1,345 1,418
NIS millions
(a) (a)(a) (a)
(a) Restated as a result of the retroactive application of the directives of the Supervisor of Banks regarding the capitalization of
software costs for self-development. For further information, see Note 1A.2.
For further information, see Note 8.
Salary and related expenses account for 60.4% of total operating expenses, compared with 63.4% in the
corresponding period last year, and 61.7% in the whole of 2015.
Operating and other expenses (excluding salaries)
Operating and other expenses, excluding salary, amounted to NIS 788 million in the first quarter of 2016,
compared with NIS 817 million in the corresponding period last year, a decrease of NIS 29 million, 3.5%.
Operating expenses constitute 74.1% of total income, compared with 56.7% in the corresponding period last year, and 65.9% in the whole of 2015.
Total operating and other expenses (in annual terms) constitute 1.88% of the total balance sheet, compared with 2.26% in the corresponding period last year, and 2.12% in the whole of 2015.
20
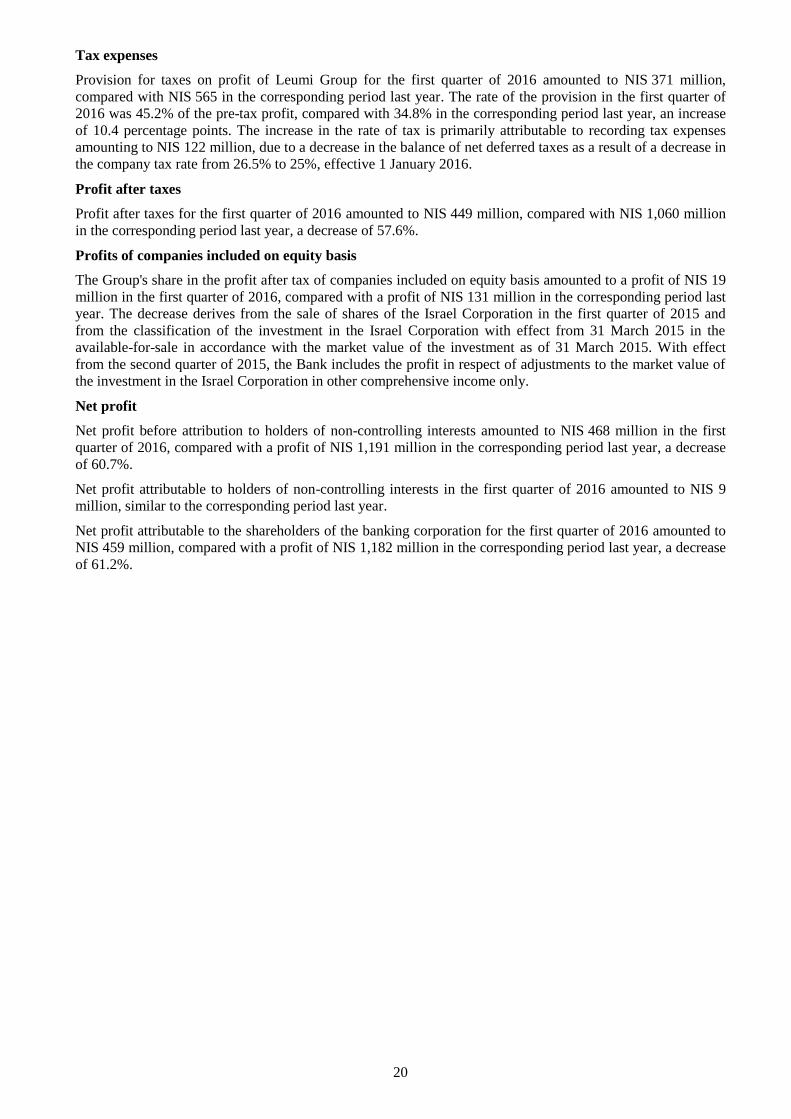
Tax expenses
Provision for taxes on profit of Leumi Group for the first quarter of 2016 amounted to NIS 371 million,
compared with NIS 565 in the corresponding period last year. The rate of the provision in the first quarter of
2016 was 45.2% of the pre-tax profit, compared with 34.8% in the corresponding period last year, an increase
of 10.4 percentage points. The increase in the rate of tax is primarily attributable to recording tax expenses
amounting to NIS 122 million, due to a decrease in the balance of net deferred taxes as a result of a decrease in
the company tax rate from 26.5% to 25%, effective 1 January 2016.
Profit after taxes
Profit after taxes for the first quarter of 2016 amounted to NIS 449 million, compared with NIS 1,060 million
in the corresponding period last year, a decrease of 57.6%.
Profits of companies included on equity basis
The Group's share in the profit after tax of companies included on equity basis amounted to a profit of NIS 19
million in the first quarter of 2016, compared with a profit of NIS 131 million in the corresponding period last
year. The decrease derives from the sale of shares of the Israel Corporation in the first quarter of 2015 and
from the classification of the investment in the Israel Corporation with effect from 31 March 2015 in the
available-for-sale in accordance with the market value of the investment as of 31 March 2015. With effect
from the second quarter of 2015, the Bank includes the profit in respect of adjustments to the market value of
the investment in the Israel Corporation in other comprehensive income only.
Net profit
Net profit before attribution to holders of non-controlling interests amounted to NIS 468 million in the first
quarter of 2016, compared with a profit of NIS 1,191 million in the corresponding period last year, a decrease
of 60.7%.
Net profit attributable to holders of non-controlling interests in the first quarter of 2016 amounted to NIS 9
million, similar to the corresponding period last year.
Net profit attributable to the shareholders of the banking corporation for the first quarter of 2016 amounted to
NIS 459 million, compared with a profit of NIS 1,182 million in the corresponding period last year, a decrease
of 61.2%.

21
The following is a condensed statement of the comprehensive profit:
Other comprehensive income (loss) before attribution to non-controlling interests
Adjustments
for
presentation
of securities
available for
sale at fair
value
Translation
adjustments
(a), net
after effect
of hedges
(b)
Banking
corporation's
share in other
comprehensive
income of
investee
companies
dealt with
under the
equity method
Adjustments
in respect of
employee
benefits Total
Other
comprehensive
income
attributed to
non-
controlling
interests
Other
comprehensive
income
attributed to
shareholders
of the Bank
(NIS millions)
Balance at 31 December 2014 394 (65) 22 (1,904) (1,553) (4) (1,549)
Net change in the period 355 40 25 (781) (361) 1 (362)
Balance at 31 March 2015 749 (25) 47 (2,685) (1,914) (3) (1,911)
Balance at 31 December 2015 67 (67) 38 (1,490) (1,452) (4) (1,448)
Net change in the period 96 (44) (9) (544) (501) - (501)
Balance at 31 March 2016 163 (111) 29 (2,034) (1,953) (4) (1,949)
Other comprehensive income (loss) before attribution to non-controlling interests
Adjustments
for
presentation
of securities
available for
sale at fair
value
Translation
adjustments
(a), net
after effect
of hedges
(b)
Banking
corporation's
share in other
comprehensive
income of
investee
companies
dealt with
under the
equity method
Adjustments
in respect of
employee
benefits Total
Other
comprehensive
income
attributed to
non-
controlling
interests
Other
comprehensive
income
attributed to
shareholders
of the Bank
(NIS millions)
Balance at 31 December 2014 394 (65) 22 (1,904) (1,553) (4) (1,549)
Net change in the period (327) (2) 16 414 101 - 101
Balance at 31 December 2015 67 (67) 38 (1,490) (1,452) (4) (1,448) (a) Adjustments from the translation of financial statements of foreign activities which, from the nature of their activity differ from
the functional currency of the banking corporation, including adjustments in respect of companies included on equity basis. (b) Net profits (losses) in respect of net hedging of investment in foreign currency.
22
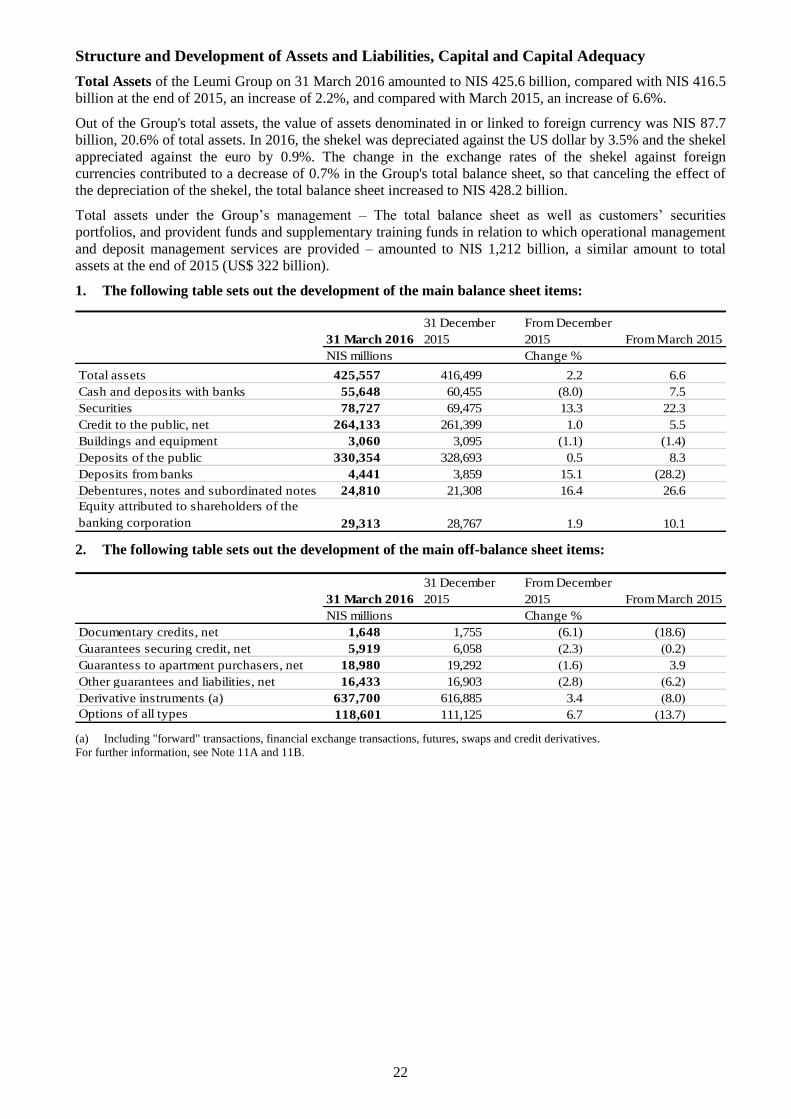
Structure and Development of Assets and Liabilities, Capital and Capital Adequacy
Total Assets of the Leumi Group on 31 March 2016 amounted to NIS 425.6 billion, compared with NIS 416.5
billion at the end of 2015, an increase of 2.2%, and compared with March 2015, an increase of 6.6%.
Out of the Group's total assets, the value of assets denominated in or linked to foreign currency was NIS 87.7
billion, 20.6% of total assets. In 2016, the shekel was depreciated against the US dollar by 3.5% and the shekel
appreciated against the euro by 0.9%. The change in the exchange rates of the shekel against foreign
currencies contributed to a decrease of 0.7% in the Group's total balance sheet, so that canceling the effect of
the depreciation of the shekel, the total balance sheet increased to NIS 428.2 billion.
Total assets under the Group’s management – The total balance sheet as well as customers’ securities
portfolios, and provident funds and supplementary training funds in relation to which operational management
and deposit management services are provided – amounted to NIS 1,212 billion, a similar amount to total
assets at the end of 2015 (US$ 322 billion).
1. The following table sets out the development of the main balance sheet items:
31 March 2016
31 December
2015
From December
2015 From March 2015
NIS millions
Total assets 425,557 416,499 2.2 6.6
Cash and deposits with banks 55,648 60,455 (8.0) 7.5
Securities 78,727 69,475 13.3 22.3
Credit to the public, net 264,133 261,399 1.0 5.5
Buildings and equipment 3,060 3,095 (1.1) (1.4)
Deposits of the public 330,354 328,693 0.5 8.3
Deposits from banks 4,441 3,859 15.1 (28.2)
Debentures, notes and subordinated notes 24,810 21,308 16.4 26.6
Equity attributed to shareholders of the
banking corporation 29,313 28,767 1.9 10.1
Change %
2. The following table sets out the development of the main off-balance sheet items:
31 March 2016
31 December
2015
From December
2015 From March 2015
NIS millions
Documentary credits, net 1,648 1,755 (6.1) (18.6)
Guarantees securing credit, net 5,919 6,058 )2.3( )0.2(
Guarantess to apartment purchasers, net 18,980 19,292 )1.6( 3.9
Other guarantees and liabilities, net 16,433 16,903 )2.8( )6.2(
Derivative instruments (a) 637,700 616,885 3.4 )8.0(
Options of all types 118,601 111,125 6.7 )13.7(
Change %
(a) Including "forward" transactions, financial exchange transactions, futures, swaps and credit derivatives.
For further information, see Note 11A and 11B.
23
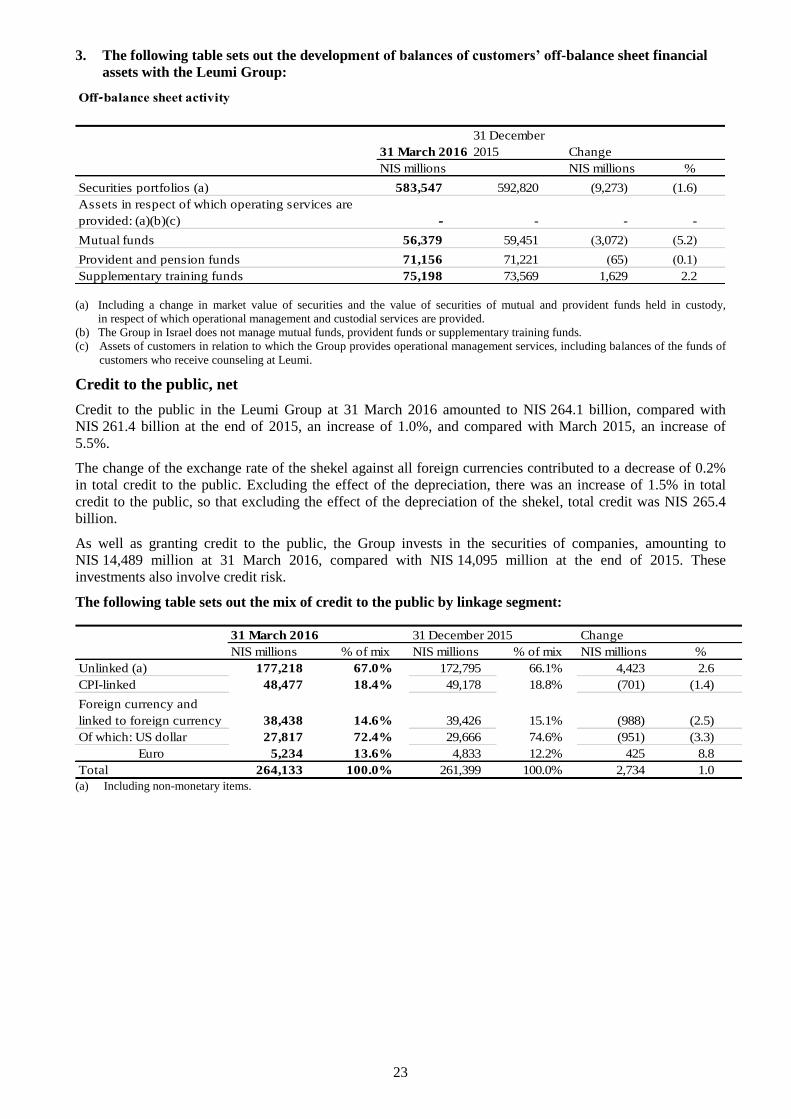
3. The following table sets out the development of balances of customers’ off-balance sheet financial
assets with the Leumi Group:
Off-balance sheet activity
31 March 2016
31 December
2015
NIS millions NIS millions %
Securities portfolios (a) 583,547 592,820 (9,273) (1.6)
Assets in respect of which operating services are
provided: (a)(b)(c) - - - -
Mutual funds 56,379 59,451 )3,072( )5.2(
Provident and pension funds 71,156 71,221 )65( )0.1(
Supplementary training funds 75,198 73,569 1,629 2.2
Change
(a) Including a change in market value of securities and the value of securities of mutual and provident funds held in custody,
in respect of which operational management and custodial services are provided.
(b) The Group in Israel does not manage mutual funds, provident funds or supplementary training funds.
(c) Assets of customers in relation to which the Group provides operational management services, including balances of the funds of
customers who receive counseling at Leumi.
Credit to the public, net
Credit to the public in the Leumi Group at 31 March 2016 amounted to NIS 264.1 billion, compared with
NIS 261.4 billion at the end of 2015, an increase of 1.0%, and compared with March 2015, an increase of
5.5%.
The change of the exchange rate of the shekel against all foreign currencies contributed to a decrease of 0.2%
in total credit to the public. Excluding the effect of the depreciation, there was an increase of 1.5% in total
credit to the public, so that excluding the effect of the depreciation of the shekel, total credit was NIS 265.4
billion.
As well as granting credit to the public, the Group invests in the securities of companies, amounting to
NIS 14,489 million at 31 March 2016, compared with NIS 14,095 million at the end of 2015. These
investments also involve credit risk.
The following table sets out the mix of credit to the public by linkage segment:
Change
NIS millions % of mix NIS millions % of mix NIS millions %
Unlinked (a) 177,218 67.0% 172,795 66.1% 4,423 2.6
CPI-linked 48,477 18.4% 49,178 18.8% (701) (1.4)
Foreign currency and
linked to foreign currency 38,438 14.6% 39,426 15.1% (988) (2.5)
Of which: US dollar 27,817 72.4% 29,666 74.6% (951) (3.3)
Euro 5,234 13.6% 4,833 12.2% 425 8.8
Total 264,133 100.0% 261,399 100.0% 2,734 1.0
31 March 2016 31 December 2015
(a) Including non-monetary items.
24
Credit to the public in unlinked shekels increased by NIS 4,423 million, 2.6%, and index-linked credit to the
public fell by NIS 70.1 million, or 1.4%. The decrease in foreign currency and foreign currency-linked credit
to the public amounted to NIS 988 million, or 2.5%, and excluding the effect of the changes in the exchange
rate of the shekel, credit to the public in foreign currency and linked to foreign currency increased by 0.7%.
The following table sets out the development of credit to the public, before the allowance for credit
losses, by principal operating segment:
31 March
2016
31
December
2015 Change
NIS millions NIS millionsNIS millions %
Individuals - housing loans 81,480 81,805 (325) (0.4)
Individuals - other 37,358 37,400 (42) (0.1)
Construction and real estate 50,414 50,124 290 0.6
Commercial 27,723 26,654 1,069 4.0
Industry 20,410 20,307 103 0.5
Other 50,320 48,780 1,540 3.2
Total 267,705 265,070 2,635 1.0 For further details on the development of credit and credit risks according to market sector, see chapter "Credit Risk"
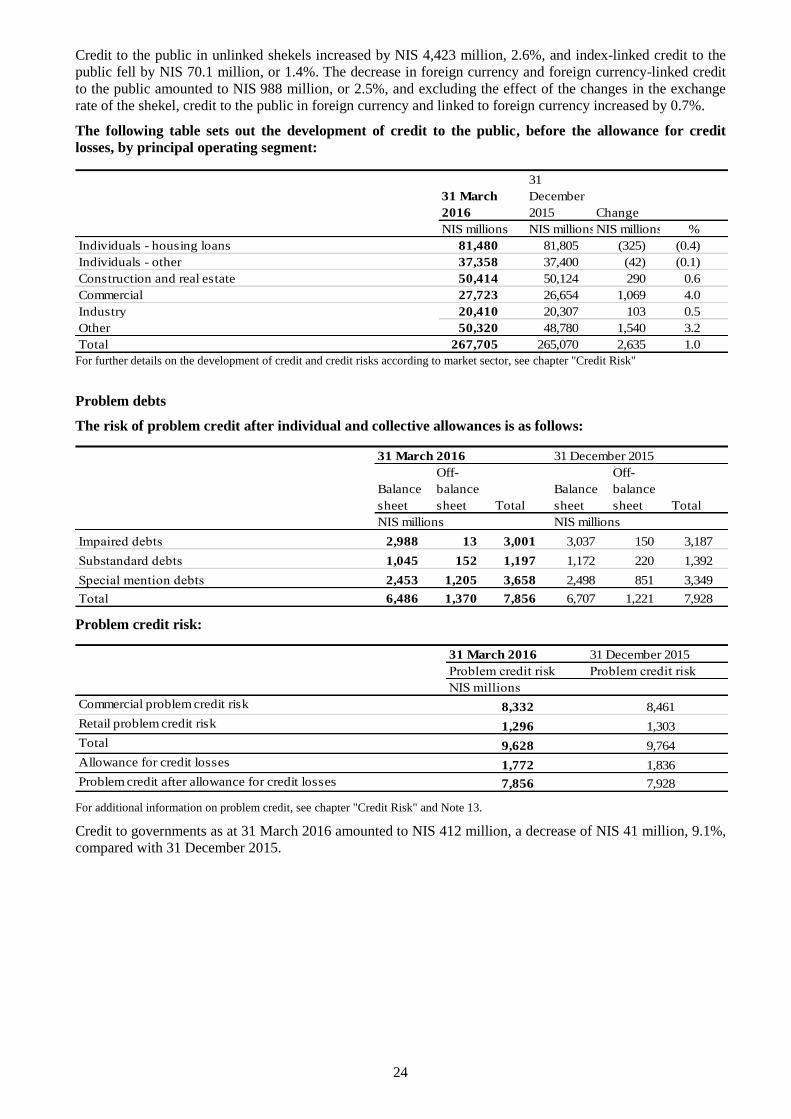
Problem debts
The risk of problem credit after individual and collective allowances is as follows:
31 March 2016 31 December 2015
Balance
sheet
Off-
balance
sheet Total
Balance
sheet
Off-
balance
sheet Total
NIS millions NIS millions
Impaired debts 2,988 13 3,001 3,037 150 3,187
Substandard debts 1,045 152 1,197 1,172 220 1,392
Special mention debts 2,453 1,205 3,658 2,498 851 3,349
Total 6,486 1,370 7,856 6,707 1,221 7,928
Problem credit risk:
31 March 2016 31 December 2015
Problem credit risk Problem credit risk
NIS millions
Commercial problem credit risk 8,332 8,461
Retail problem credit risk 1,296 1,303
Total 9,628 9,764
Allowance for credit losses 1,772 1,836
Problem credit after allowance for credit losses 7,856 7,928
For additional information on problem credit, see chapter "Credit Risk" and Note 13.
Credit to governments as at 31 March 2016 amounted to NIS 412 million, a decrease of NIS 41 million, 9.1%,
compared with 31 December 2015.

25
Securities
The Group’s investments in securities as at 31 March 2016 amounted to NIS 78.7 billion, compared with
NIS 69.5 billion at the end of 2015, an increase of 13.3%.
Securities in the Group are classified into two categories: securities for trading and available-for-sale
securities.
The classification of a security purchased by the Bank for the available-for-sale securities portfolio or for the
trading securities portfolio is done at the date of purchase and is carried out in accordance with the Bank's
intention for the use of the securities. Securities that are purchased for the purposes of trading (or with the aim
of hedging other components of the trading portfolio), for the purposes of market-making or within the
framework of the dealing room, are classified to the trading portfolio, while securities purchased as part of
managing the Bank's assets and liabilities are classified in the available-for-sale portfolio.
Securities for trading are presented in the balance sheet at fair value, and the difference between fair value and
adjusted cost is charged to the statement of profit and loss. Available-for-sale securities are presented in the
balance sheet at fair value, with the difference between fair value and adjusted cost presented as a separate
item in shareholders' equity in other overall profit, called "adjustments for presentation of available-for-sale
securities at fair value" less the related tax. Whenever the impairment is of a non-temporary nature, the
difference is charged to the statement of profit and loss.
The following table sets out the classification of the securities item in the consolidated balance sheet:
31 March 2016 31 December 2015
Securities
available
for sale
Trading
securities Total
Securities
available
for sale
Trading
securities Total
NIS millions NIS millions
Debentures of:
Government of Israel 36,808 5,290 42,098 28,553 6,664 35,217
Foreign governments 11,758 2,833 14,591 8,128 3,058 11,186
Financial institutions in Israel 35 347 382 35 238 273
Foreign financial institutions. 5,471 144 5,615 6,262 148 6,410
Asset-backed (ABS) or mortgage-backed (MBS) 9,957 697 10,654 9,566 751 10,317
Others in Israel 555 120 675 586 152 738
Others abroad 1,777 325 2,102 1,694 320 2,014
Shares and mutual funds 2,596 14 2,610 2,703 617 3,320
Total securities 68,957 9,770 78,727 57,527 11,948 69,475
(a) (b) (a) (b)
(a) Unrealized profits (losses) from adjustments to fair value amounting to NIS 514 million which were recorded in other
comprehensive income (31 December 2015 – NIS 294 million).
(b) Unrealized profits (losses) from adjustments to fair value amounting to losses of NIS 51million which were recorded in profit and
loss (31 December 2015 –NIS (100) million)
As at 31 December 2015, 87.6% of the Group’s nostro portfolio was classified as available-for-sale securities
and 12.4% as the trading portfolio. This classification allows for flexibility in the management of the securities
portfolio. 3.3% of the value of the securities represents investments in shares of companies that are not
presented on equity basis, but according to cost or to the market value of the shares traded on the stock
exchange.
For details in the value of securities according to the method of measurement, see Note 15A.
Available-for-sale portfolio
1. In first quarter of 2016, there was an increase in other comprehensive income in respect of available-for-
sale securities amounting to NIS 156 million (before the effect of tax). The increase derives from an
increase in value amounting to NIS 246 million, which was partly offset by securities which were sold and
classified to profit and loss amounting to NIS 90 million (before tax). This compared with an increase in
other comprehensive income in respect of available securities amounting to NIS 549 million (before tax)
in the corresponding period last year which derived from securities amounting to NIS 1,155 million which
was partly offset by a decrease in profit from securities which were sold and classified to profit and loss
amounting to NIS 606 million (before tax).
2. In addition, net profits from the sale of available-for-sale debentures amounting to NIS 9 million was
recorded to profit and loss, compared with profits of NIS 104 in the corresponding period last year.

26
The accumulated net balance of adjustments to fair value of securities held in the available-for-sale portfolio,
as at 31 March 2016, amounted to a positive amount of NIS 163 million (after the effect of tax) compared with
NIS 67 million at the end of 2015. These amounts represent net profits which had not been realized at the
dates of the financial statements.
Bank management estimates that there is impairment in securities in the available-for-sale portfolio, which is
of a temporary nature. The Bank intends, and is able, to continue holding the investments until the expected
recovery of the full cost of the assets or until their redemption. Accordingly, this impairment is recorded in
capital, on the basis of the main accounting policies set forth in Note 1 to the 2015 Annual Report.
For details regarding adjustment to fair value of available-for-sale securities which were charged to equity, see Note 5
Trading portfolio
On 31 March 2016, there was NIS 9.8 billion of debentures in the trading portfolio, compared with NIS 11.3
billion of debentures and NIS 0.6 billion of shares at 31 December 2015. As of 31 March 2016, the trading
portfolio constitutes 12.4% of the Group's total nostro portfolio, compared to 17.2% at 31 December 2015.
For further information relating to the composition of the portfolio, see Note 5
In respect of trading debentures, realized and unrealized profits amounting to NIS 18 million were recorded in
the statement of profit and loss, compared with profits amounting to NIS 207 million in the corresponding
period last year, and in respect of shares and funds, realized and unrealized losses were recorded amounting to
NIS 32 million, compared with profits of NIS 62 million in the corresponding period last year.
Investments in securities issued abroad
The Group’s securities portfolio includes NIS 36.0 billion (US$ 9.6 billion) of securities issued abroad.
Approximately 97% of the portfolio is invested in debt instruments, all of which (except for 1.0%) are
investment grade securities, of which 95% are rated 'A-' and above). 4.7% of the portfolio is invested in shares
and funds. Of the said portfolio, NIS 32 billion (US$ 8.6 billion) is classified in the available-for-sale
securities portfolio, and the balance is classified in the trading portfolio.
A. Investments in asset-backed securities issued abroad
The Group’s asset-backed securities portfolio (both mortgage-backed and non-mortgage-backed), all of
which is rated investment grade at 31 March 2016, amounted to NIS 10.7 billion (US$ 2.8 billion),
compared with NIS 10.3 billion at the end of 2015. Of the said portfolio as of 31 March 2016, NIS 10.0
billion (US$ 2.7 billion) is classified in the available-for-sale portfolio, and the balance in the trading
portfolio.
The available-for-sale portfolio of investments in asset-backed securities abroad as at 31 March 2016
includes an investment in mortgage-backed debentures amounting to NIS 7.9 billion. 96% of the total
mortgage-backed debentures in the available-for-sale portfolio were issued by federal agencies in the
United States (GNMA, FHLMC and FNMA) and rated at the date of the report as AAA.
For further information regarding investments in asset-backed debentures, see Note 5.
As at 31 March 2016, the accumulated net impairment charged to shareholders' equity resulting from the
mortgage-backed securities portfolio was NIS 18 million.
The total of the asset-backed debentures, which are not under State guarantee (United States) and are not
covered by U.S. federal institutions in the available-for-sale portfolio and the trading portfolio, amounts to
NIS 1,125 million.
The projected term to maturity for all the mortgage-backed securities portfolio is an average of 4.1 years.
In addition to mortgage-backed securities, the Group’s available-for-sale portfolio also includes other
securities backed by assets other than mortgages (car financing credit and other types of credit), amounting
to NIS 2.0 billion. Of these, CLO-type debentures amount to NIS 1.9 billion. The projected term to
maturity of the debenture portfolio backed by assets other than mortgages is 3.7 years on average.
B. Investments in non-asset backed securities issued abroad
The Group’s securities portfolio as at 31 March 2016 includes NIS 25.7 billion (US$ 6.8 billion) of non-
asset-backed securities. Of these securities, NIS 22.3 billion (US$ 5.9 billion) are classified in the
available-for-sale portfolio, with the balance in the trading portfolio. Of the total securities, 99% are
investment grade and they include mainly securities issued by the U.S. government, banks and financial
institutions, securities, and the balance, mainly securities issued by the Israeli government.
For further information regarding exposure to overseas financial institutions, see chapter, "Credit Risk".

27
As at 31 March 2016, aggregate increase in value in shareholders' equity in respect of non-asset-backed
securities issued abroad in the available-for-sale portfolio amounted to NIS 128 million (NIS 80 million
after tax).
As stated above, in addition to the available-for-sale portfolio, the securities portfolio also includes non-
asset backed securities in the trading portfolio. This includes mainly securities of states, banks and
financial institutions, and securities funds. 99% of the securities in the trading portfolio are investment
grade.
The value of the non-asset backed trading portfolio as of 31 March 2016 amounted to NIS 3.4 billion
(US$ 0.9 billion). The difference between fair value and adjusted cost, if there is such a difference, is
recorded in the profit and loss account.
Investments in debentures - issued in Israel
Investments in debentures issued in Israel amounted to NIS 41.5 billion on 31 March 2016, of which NIS 40.4
billion was in debentures issued by the Government of Israel in NIS, with the balance in debentures of the
Government of Israel in foreign currency and debentures issued by companies. 55.8% of the investments in
corporate debentures amounting to NIS 0.6 billion were included in the available-for-sale portfolio, and the
balance was in the trading portfolio.
Corporate debentures in the available-for-sale portfolio amounting to NIS 0.6 billion includes a capital reserve
amounting to NIS 24 million.
All the corporate debentures in the trading portfolio and part of those in the available–for-sale portfolio are
listed and traded on the Stock Exchange.
Investments in shares and funds
Total investments in shares and funds amounted to NIS 2,610 million on 31 March 2016, of which NIS 1,544
million was in listed shares and NIS 1,066 million was in non-listed shares. Of the total investment, NIS 2,596
million is classified in the available-for-sale portfolio and NIS 14 million is classified in the trading portfolio.
The capital required in respect of these investments at 31 March 2016 was NIS 326 million.
For further information, see Note 5.
Main changes in investment in shares
On 21 April 2016 the Bank sold, in a deal outside of the Stock exchange, the remaining shares that it held in
the Israel Corporation Ltd. 451,252 shares, which is 5.86% of the issued and paid up capital of the Israel
Corporation, in return for 17,906,037 shares of Israel Chemicals Ltd (IC) which are 1.4% of the issued and
paid up capital of Israel Chemicals.
Deposits of the Public
Deposits of the public in the Group amounted to NIS 330.4 billion at 31 March 2016, compared with
NIS 328.7 billion at the end of 2015, an increase of 0.5% and compared with March 2015 an increase of 8.3%
The change in the exchange rate of the shekel against all foreign currencies reduced total deposits of the public
by 1.0%, so that, excluding the depreciation of the shekel, the increase in deposits of the public was 1.5%.
Debentures, capital notes and subordinated notes
Debentures, capital notes and subordinated notes totaled NIS 24.8 billion on 31 March 2016, compared with
NIS 21.3 billion as at the end of 2015, a decrease of 16.4%. In the first quarter of 2016, NIS 1.1 billion of
debentures was repaid.
Shelf prospectus and issue of debentures
On 28 May 2015, the Bank published a shelf prospectus in accordance with a permit received from the
Securities Authority.
On 21 January 2016, the Series 177 was expanded and further debentures amounting to NIS 3.6 billion were
issued.
Series 177 debentures are due for repayment in one installment on 30 June 2020, are linked as to principal and
interest to the consumer price index and bear interest of 0.59% per annum, payable twice a year on 30 June in
the years 2016 to 2020 (inclusive) and on 31 December in the years 2016 to 2019 (inclusive).
Debentures are not recognized for purpose of regulatory capital.
28
Pursuant to a shelf proposal dated 20 January 2016, on 21 January 2026, the Bank issued a total of NIS 926
million of Series 400 deferred notes.
The deferred notes are due for maturity in one lump-sum on 21 January 2026, with an option for the issuer for
early repayment not before 21 January 2021 and not after 21 February 2021, are not linked to any linkage
base, and bear interest of 3.25% per annum. On this date, given the failure to exercise the Bank's right to early
redemption, the nominal interest in the fee will be updated according to the difference between the anchor
interest (as defined in the shelf proposal report) on the date of the issue and that which is on the update of the
interest.
On fulfillment of circumstances for a defined event (a defined event for non-existence or a defined event for
absorbing principal losses, whichever is earlier), the deferred notes will be converted to shares at the fair value
of the shares on the conversion date or at the floor rate which is determined (NIS 6.78 per share), whichever is
higher.
These notes are eligible for inclusion in Tier 2 from the date of issue.
Other assets and debit balances in respect of derivative instruments
At 31 March 2016, other assets amounted to NIS 7.9 billion, compared with NIS 7.7 billion at the end of
2015, an increase of 2.9%.
The balance of the obligation in respect of the fair value of derivative instruments made with and for
customers fell from NIS 11.3 billion at the end of 2015 to NIS 13.2 billion at 31 March 2016.
Other liabilities and credit balances in respect of derivative instruments
Other liabilities amounted to NIS 20.7 billion at 31 March 2016, compared with NIS 20.7 billion at the end of
2015, a decrease of 0.5%.
The credit balance in respect of the fair value derivative instruments made with and for customers amounted
to NIS 14.0 billion compared with NIS 11.1 billion at the end of 2015.

29
Capital and Capital Adequacy
Capital attributable to the Shareholders of the Banking Corporation (hereinafter "capital") of the Group
as at 31 March 2016 amounted to NIS 29,313 million, compared with NIS 28,767 million at the end of 2015,
an increase of 1.9%. The increase derives, inter alia, from the issue of shares to employees and office holders
in the amount of NIS 636 million in accordance with the special collective agreement stemming from the
conversion of employees' rights to the Bank's shares.
For further information regarding the Special Collective Agreement, see Note 8.
Capital ratio to the balance sheet as at 31 March 2016 reached 6.9%, similar to the ratio as at 31 December
2015.
Capital adequacy structure
31 March 2016 31 March 2015 31 December 2015
Unaudited Audited Audited
NIS millions
Capital for purposes of calculating capital ratio
Tier 1 shareholders' equity, after regulatory adjustments
and deductions 29,719 27,416 29,001
Tier 2 capital, after deductions 12,890 13,329 12,593
Total capital 42,609 40,745 41,594
Weighted balances of risk assets
Credit risk 272,523 271,585 277,034
Market risk 5,793 5,952 5,167
Operational risk 20,100 20,376 20,432
Total weighted balances of risk assets 298,416 297,913 302,633
Ratio of capital to risk components
Ratio of Tier 1 shareholders' equity to risk components 9.96% 9.20% 9.58%
Ratio of total capital to risk components 14.28% 13.68% 13.74%
Implementation of the Basel III directives in Israel
On 30 May 2013, the Supervisor of Banks issued final directives for the implementation of Basel III in Israel,
by an amendment of Proper Conduct of Banking Business Directives Nos. 201-211. These directives came
into force on 1 January 2014.
According to the directives, the capital components in the Group for the purpose of calculating capital
adequacy are attributed to two tiers:
1. Tier 1, including Tier 1 shareholders' equity and additional Tier 1 capital;
2. Tier 2 capital.
The sum of these tiers is called "Capital basis for capital adequacy" or "Regulatory capital" or "Overall
capital".
Tier 1 capital including Tier 1 shareholders' equity and additional Tier 1 capital:
Tier 1 shareholders' equity includes the capital attributable to the shareholders of the banking corporation, with
the addition of the part of the rights not conferring control of capital of consolidated subsidiaries (minority
interests) and deducting goodwill, intangible and other assets and regulatory adjustments and additional
deductions, all as set forth in Proper Conduct of Banking Business Management Directive No. 202
"Measurement and Capital Adequacy – Regulatory Capital" and subject to the transitional provisions of Proper
Conduct of Banking Business Management Directive No. 299 "Measurement and Capital Adequacy –
Regulatory Capital – Transitional Provisions".
Additional Tier 1 capital which comprises capital instruments complying with the criteria determined in
Proper Conduct of Banking Business Management Directive No. 202. There are no capital instruments in this
tier in the Leumi Group. Any additional Tier 1 capital instruments that are issued in the future will be required
to comply with all the criteria set forth in Proper Conduct of Banking Business Management Directive No.
202.
30
Tier 2 capital:
In the Basel III directives, the distinction between Upper Tier 2 and Lower Tier 2 has been cancelled.
Tier 2 capital mainly includes capital instruments and the balance of a collective allowance for credit losses
before the effect of the related tax, up to a ceiling of 1.25% of total credit risk assets.
With regard to capital instruments which were included in Tier 2 capital on 31 December 2013, the transitional
provisions and the asset recognition ceiling which was computed to 1 January 2014, according to 80% of the
balance of instruments as of 31 December 2013, were determined, and at the beginning of each successive
year, this ceiling is lowered by 10%. The capital instruments which were part of Tier 2 at 31 December 2013
include compound capital instruments which were, until now, classified to upper Tier 2 capital, and deferred
notes, which were classified to lower Tier 2.
A description of the main features of regulatory capital instruments which have been issued is presented in the Bank's website:
/http://leumi.co.il/home01/32587 in the chapter regarding >Financial information and meetings> Additional regulatory disclosures.
It should be noted that the amount actually recognized as Tier 2 capital is the lower of the amortized amount of
the instruments themselves and their recognition ceiling according to the transitional provisions. From the
beginning of 2014, capital instruments to be issued will be required to comply with all the criteria set forth in
Proper Conduct of Banking Business Management Directive No. 202 for the purpose of their inclusion in
capital. The main criteria are that the instrument must include: (1) a mechanism for absorbing the losses of the
reserve by conversion to ordinary shares or the amortization of the instrument when the Tier 1 shareholders'
equity ratio of the banking corporation falls below 5%; (2) an item determining that on the occurrence of the
defining event for non-compliance (as defined in Appendix E to Proper Conduct of Banking Business
Directive No. 202), the instrument will be converted immediately to ordinary shares or will be expunged.
Pursuant to the shelf proposal report dated 20 January 2016, the Bank issued, on 21 January 2016, a total of
NIS 926 million of Series 400 deferred notes, which are eligible for inclusion in Tier 2.
For further information with regards issuance, see chapter "Structure and Development of the Assets, Liabilities, Capital and Capital
Adequacy", in section "debentures, capital notes and deferred notes".
Capital adequacy target
The capital adequacy ratios are calculated as the ratio of capital to weighted risk assets. The Tier 1
shareholders' equity ratio is calculated as the ratio of Tier 1 share ratio to weighted risk assets, and the overall
capital ratio is calculations as the ratio of the amount of overall capital to weighted risk assets.
The capital adequacy targets prescribed by the Bank of Israel are as follows:
Pursuant to Proper Conduct of Banking Business Directive No. 201, "Measurement and Capital Adequacy –
Introduction, Incidence and Calculation of Requirements", all banking corporations are required to comply
with a minimum Tier 1 capital ratio of 9% with effect from 1 January 2015. In addition, a large banking
corporation, whose total balance sheet assets on a consolidated basis constitutes at least 20% of the balance
sheet assets in the banking system in Israel, will be required to comply with a minimum Tier 1 capital ratio of
10%, with effect from 1 January 2017. This additional provision applies to the Bank. In addition, all banking
corporations in Israel are required to maintain a minimum overall capital ratio of 12.5% from 1 January 2015.
A large banking corporation will be required to maintain a minimum overall capital ratio of 13.5% by
1 January 2017. Leumi is subject to this additional directive.
On 28 September 2014, the Supervisor of Banks published a circular for an amendment to Proper Conduct of
Banking Business Management Directive No. 329 "Restrictions on the Grant of Housing Loans". Pursuant to
the amended directive, the banking corporation will be required to increase Tier 1 shareholders' equity target at
a rate expressing 1% of the balance of housing loans. The date for commencing compliance with the
determined capital target is 1 January 2017, and banking corporations are to increase the capital target in fixed
quarterly rates from 1 April 2015 until 1 January 2017. The effect of the amendments to the regulation on
Leumi Group at the final effective date is 0.27% of the capital adequacy ratio, with the effect being spread in
accordance with the regulation over eight quarters.
The abovementioned targets will be achieved gradually.
Capital adequacy targets prescribed by the Bank:
Capital planning in Leumi Group reflects a forward-looking vision of the risk appetite and the capital adequacy required as a consequence. The Group policy approved by the Board of Directors is to strengthen a higher level of capital adequacy than the minimum threshold that will be periodically specified by the Bank of Israel and will not be less than the rate required for covering risks as estimated in the ICAAP process. In addition, targets that the Group wishes to meet in the event of a stress scenario have been defined.

31
As part of the regulatory review procedure, the Supervisor directed the determination of internal capital targets, which will match the Bank's risk profile. Further thereto, the Board of Directors of the Bank approved an increase in the Bank's internal Tier 1 shareholders' equity target such that from 31 December 2017, it will stand at 10.5%. The Board of Directors of the Bank will reconvene to discuss this target no later than the end of 2016.
The regulations regarding employee rights, which were initially implemented in January 2015, were the influencing factor and are expected to have the most significant effect on Leumi's Tier 1 shareholders' equity, mainly due to the fact that the measurement of the liability is in accordance with market interest rates which is at historically low levels and due to the high volatility that accompanies this kind of measurement. The Bank is examining ways of moderating the volatility in capital arising from the regulations, e.g., purchase, direct or indirect, of instruments hedging the effect of changes in the capitalization coefficients (in full or in part), which are used for discounting the liability for employee rights.
In addition, a decrease in overall capital is expected as a result of the amortization of capital instruments attributed to Tier 2 capital, which were issued prior to the effective date of the directives for the implementation of Basel III, and a lowering of the ceiling of the amount recognized to capital of these capital instruments.
As of March 2016, the Bank's Tier 1 capital adequacy was 9.96%. During the first quarter of 2016, a number of significant steps were taken in order to improve the capital adequacy ratio, including the following:
Conversion of employees' rights to the Bank's shares: On 20 March 2016, the Board of Directors of the Bank approved the issue of shares to employees and office holders. The total amount of the employees' and office holders' rights that was converted to the Bank's shares totals NIS 636 million. The value of the Bank's shares for the purpose of converting rights is NIS 13.0 (closing rate of the Bank's shares on 6 March 2016). Accordingly, the Bank's Board of Directors approved an issue of 48,938,037 shares, which is 3.21% of the issued and paid-up capital of the bank (after the allocation). The shares were allocated to a trustee who held the shares in trust on behalf of the employees, in accordance with the instructions of Section 102 of the Income Tax Ordinance. The increase in capital resulting from this conversion of rights improved the Tier 1 shareholders' equity adequacy ratio of the Bank by 0.24%.
For further information on the special collective agreement see Note 8.
Insurance for portfolio of guarantees by virtue of Sales Law - On 8 March 2016, the Bank entered into an agreement with international re-insurers with high international-rating to purchase insurance for the portfolio of guarantees by virtue of the Sales Law (Apartments) and obligations to take out guarantees as aforesaid. The insurance policy guarantees the Bank in the event that it will have to pay due to the realization of the guarantees, all according to the terms of the policy. The purchase of the insurance policy enables the reduction of the restricted capital in respect of the risk of the credit deriving from the issue of the guarantees, while using the policy as a "credit risk mitigation policy", in accordance with Proper Banking Directive No. 203, and contributed to an improvement of 0.23% in the capital adequacy ratio.
Deduction from capital in respect of deferred tax asset - On 4 April 2016, an amendment to the Question and Answer file from the Supervisor of Banks on the implementation of Proper Banking Conduct of Banking Management directives was published, on the subject of measurement and capital adequacy. The purpose of the amendment is to clarify the method of treating the salary tax component in all matters related to the calculation of the capital requirements and the deduction from capital in respect of deferred tax asset. According to the clarification, when a banking corporation reaches the conclusion that, under the circumstances present at the time of the report, it is virtually certain that the deferred tax asset equals the sum of the salary tax included in the books of the Bank, it is permissible not to apply the threshold tax deduction included in Section 13 of the directive on this portion of the deferred tax asset. For this purpose, the Bank will be permitted to implement the test of threshold deduction on the net sum of deferred taxes, after deducting salary tax as stated above. The deferred tax asset, as stated, which is not deducted from the capital, will be weighted as a risk asset at a rate of 250%. The Bank is implementing the directives with effect from the date of their publication and onwards without adjustment to comparative figures and subject to the transitional provisions stipulated in Proper Conduct of Banking Management Directive No.229 of the Banking Supervision Department. This update contributed to an improvement of 0.20% in the Bank's Tier 1 shareholders' equity adequacy and of 0.17% in the overall capital ratio.
The Bank is preparing to meet the capital targets by 1 January 2017, and is taking steps to complete the necessary capital (beyond the increase in the regulatory capital deriving from its current profits less the increase in the risk assets and the effect of the transitional provisions), inter alia, by improving the risk assets (improvement in the collateral, etc.), investing in the nostro assets which require a lower allocation of capital, selective management of credit, including contraction, segments and risk, syndication and reinsurance.

32
In this context, on 28 February 2016, Leumi signed an agreement with Harel for the joint extension of secured housing loans, secured, inter alia, in mortgages and pledges on contractual rights in connection with land. As of this date, not all the applicable conditions have been met for the parties to begin collaborating in accordance with the agreement, and which must be met within 90 days from the date the agreement, and it has not yet been made clear that there is no obstacle, from the point of view of the Capital Market, Insurance and Savings Department, that prevents Harel from engaging in an agreement subject to the fulfillment of the applicable conditions, Harel will participate with the Bank in the joint extension of loans, in which the ratio of the amount of the loan to the value of its asset (LTV) is up to 60% and not in excess of this rate (as long as Harel is not given regulatory approval to participate in loans at a higher financing rate) and the updated expectation for the amount of Harel's participation, in the extension of housing loans in conjunction with the Bank in 2016 and 2017, is a total amount of NIS 4 billion.
It should be noted that from the end of the first quarter until a date close to the publication of this report, the liability for employee rights arising from a decrease in interest rates for discounting liabilities for employee rights, which was partially offset by the performance of the available portfolio and total plan assets, on the basis of preliminary internal estimates, the effect for this date on Tier 1 capital adequacy ratio is a decrease of about 0.12% (given the transitional directives).
Regulatory changes which are likely to impact capital requirements and planning:
Operational efficiency measures
On 12 January 2016, the Banking Supervision Department published a letter regarding "Operational
streamlining of the banking system in Israel". Pursuant to the letter, the board of directors of a banking
corporation must outline a multi-year streamlining program. A banking corporation which meets the
conditions specified in the letter will receive relief according to which it can spread the impact of the
program over five years on a straight-line basis for the purpose of computing the capital adequacy.
The Bank is in the stages of devising a multi-year streamlining program.
Capital requirements in respect of exposures to key counterparties
On 22 October 2015, the Banking Supervision Department published a circular regarding "Capital requirements in respect of exposures to key counterparties" (hereinafter "the circular"). The circular amends the provisions of Proper Conduct of Banking Business Directives Nos. 203 and 204, with the aim of adapting them to the recommendations of the Basel Committee in all matters related to the capital requirements in respect of exposures of banking corporations to central counterparties. The circular sets forth the new directives which will apply to exposures to central counterparties which are caused by OTC derivatives, derivative transactions marketable on the stock exchange and securities financing transactions. The directives differentiate between a central counterparty which is not eligible and an eligible counterparty, with the latter being determined in reduced capital requirements.
Given that the Israeli Stock Exchange will be recognized as an eligible central counterparty by the first half of 2017, the effect of implementing the directive on Leumi, on the basis of 2015 year-end data, is not material. Given that the Israeli Stock Exchange will not be recognized as an eligible central counterparty, the estimated increase in total risk assets in the 2015 year-end data is NIS 3.5 billion, a decrease of 0.11% in Tier 1 shareholders' equity adequacy.
The following is an analysis of the sensitivity to the main factors affecting the capital adequacy of Leumi
Group:
A change in the volume of risk assets – The risk assets of Leumi amounted to NIS 298.4 billion at the end
of March 2016. Every increase of 1% in the risk assets (approx. NIS 3 billion) in future years will reduce
the Tier 1 shareholders' equity capital adequacy ratio by 0.10%, and the overall capital ratio by 0.14%.
Profit that will accrue or a change in the capital reserve – The Tier 1 shareholders' equity of Leumi
amounted to NIS 29.8 billion at the end of March 2016. The overall capital amounted to NIS 42.7 billion.
Every accrual of net profit and/or positive change in the capital reserve amounting to NIS 1 billion will
improve the Tier 1 shareholders' equity adequacy ratio and the overall capital ratio by 0.34%.

33
Accounting standards regarding employee rights – According to these standards, the actuarial liability for
employees is discounted according to the market interest rates which are influenced by the Government of
Israel debenture curve and by the United States AA corporate debenture margin. An increase of 0.1%
across the interest curve for discounting, under the assumption that the curve rises and falls consistently,
and in the absence of hedging transactions which the Bank has carried out until now, means an increase of
0.07% in the Tier 1 shareholders' equity ratio and in the overall capital ratio. (Under the transitional
provisions, the effect is more moderate - only 60% of the impact in 2016, and an additional 20% in each
subsequent year.)
The above information regarding capital adequacy policy and management refers to future activities of the Bank, and is defined as
"forward-looking information". For the meaning of this term, see the chapter, "Forward-Looking Information".
Leverage ratio
On 28 April 2015, the Supervisor of Banks published Proper Conduct of Banking Business /Directive No. 218
"Leverage Ratio".
The directive adopts the instruction of the Basel Committee from January 2014, to add a simple leverage ratio,
which is not based on risk, which will act as a supplementary measurement to the risk-based capital
requirements and will limit the accumulation of the leverage in the banking sector.
The leverage ratio is defined as the measurement of the capital divided by the measurement of the exposure,
with the ratio expressed in percentages. The capital for the purposes of measuring the leverage ratio is Tier 1
capital, as defined in Proper Conduct of Banking Management Directive No. 202, taking into account the
stipulated transitional arrangements. The total measurement of the exposure of a banking corporation is the
amount of the balance sheet exposure, the exposures to derivatives and the exposures to transactions of
financing securities and off-balance sheet items.
Pursuant to the directive, all banking corporations will be required to comply with a minimum leverage ratio
of not less than 5% on a consolidated basis. In addition, a banking corporation, whose total balance sheet
assets on a consolidated basis constitute 20% or more of the total balance sheet assets in the banking system,
will be required to comply with a leverage ratio of not less than 6%. This additional directive applies to
Leumi.
A banking corporation which, on the date of the publication of the directive, does not comply with the
abovementioned leverage ratio requirement must increase the ratio in fixed quarterly rates by 1 January 2018.
A banking corporation which, on the date of publication of the directive, complies with the abovementioned
leverage ratio requirement must not fall below the threshold as provided in the directive.
On the date of publication of the directive, Leumi complied with the threshold provided. The leverage ratio at
31 March 2016 was 6.35%.

34
Operating Segments – Management Approach
The report of the operating segments according to the management's approach presents the Bank's results
according to business lines, in accordance with the Bank's organizational structure.
The business lines specialize in providing service to customer segments having similar characteristics and
needs.
The Bank in Israel is organized into six business lines:
1. Banking – providing banking services to private and small business customers. The business line includes
the mortgage department and private banking department.
2. Commercial - providing banking and financial services to middle-market companies and interested parties
in these companies.
3. Corporate - providing banking and financial services to large companies and international corporations in
the economy, with their activity in Israel and abroad.
4. Real estate - providing banking and financial services to the real estate and construction segment.
5. Capital market – managing the Bank's nostro, managing assets and commitments, and managing
investments and financial assets.
6. Other – activities not attributed to other business lines.
Operational results are attributed to the business line in which the customer's account is managed.
Net interest income - the business line is credited with interest received from loans that it made available,
less the cost of raising the sources (transfer cost). In addition, the business line is credited with the transfer
cost for deposits that were raised less the interest that was paid to the customer.
Noninterest incomes (financing incomes that are not from interest, commissions and other income) – are
attributed to the business line according to the customer's activity.
Business line expenses – include the direct expenses of the business line, and also expenses of
headquarters' units providing services are charged to the business line.
The results of the business lines' activity, both on the side of the balance sheet and on the profit and loss side,
are regularly examined by the management. Examination of the results is done using targets set within the
framework of the annual work plan and against data from the corresponding period in the previous year.
In addition, an examination is carried out of a variety of additional metrics relating to the business line's
activity.
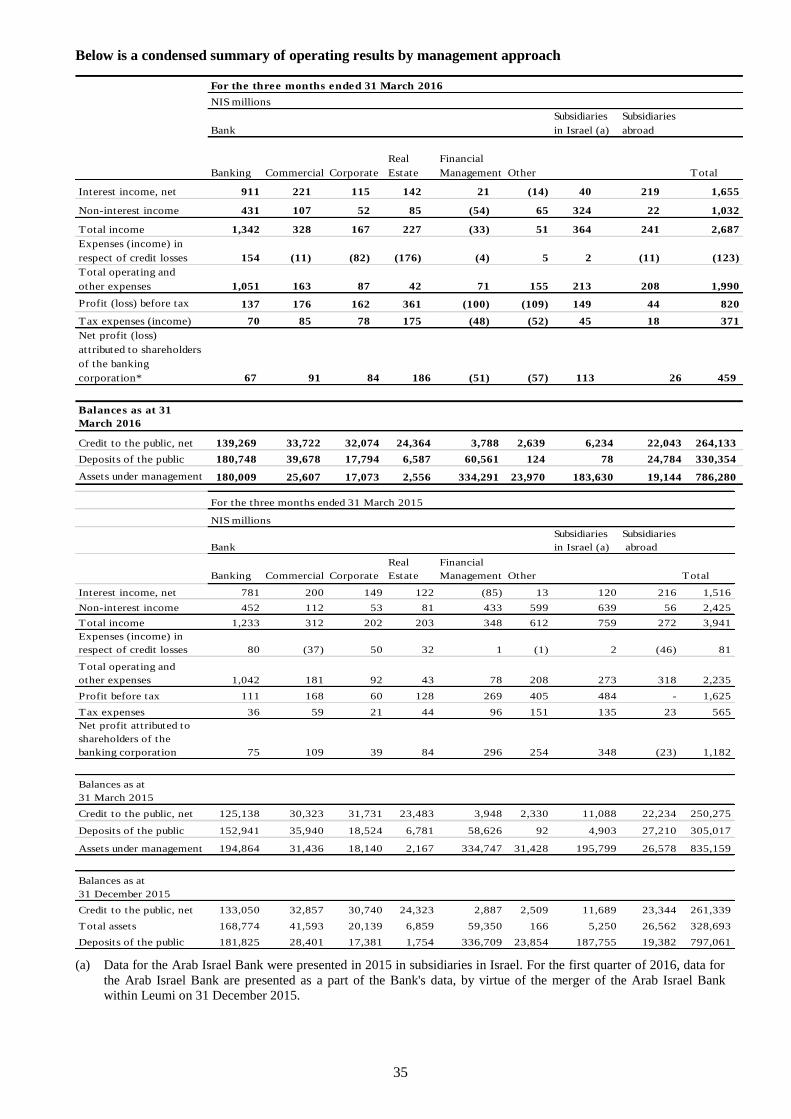
35
Below is a condensed summary of operating results by management approach
For the three months ended 31 March 2016
Bank
Subsidiaries
in Israel (a)
Subsidiaries
abroad
Banking Commercial Corporate
Real
Estate
Financial
Management Other Total
Interest income, net 911 221 115 142 21 (14) 40 219 1,655
Non-interest income 431 107 52 85 (54) 65 324 22 1,032
Total income 1,342 328 167 227 (33) 51 364 241 2,687
Expenses (income) in
respect of credit losses 154 (11) (82) (176) (4) 5 2 (11) (123)
Total operating and
other expenses 1,051 163 87 42 71 155 213 208 1,990
Profit (loss) before tax 137 176 162 361 (100) (109) 149 44 820
Tax expenses (income) 70 85 78 175 (48) (52) 45 18 371
Net profit (loss)
attributed to shareholders
of the banking
corporation* 67 91 84 186 (51) (57) 113 26 459
Balances as at 31
March 2016
Credit to the public, net 139,269 33,722 32,074 24,364 3,788 2,639 6,234 22,043 264,133
Deposits of the public 180,748 39,678 17,794 6,587 60,561 124 78 24,784 330,354
Assets under management 180,009 25,607 17,073 2,556 334,291 23,970 183,630 19,144 786,280
NIS millions
For the three months ended 31 March 2015
NIS millions
Bank
Subsidiaries
in Israel (a)
Subsidiaries
abroad
Banking Commercial Corporate
Real
Estate
Financial
Management Other Total
Interest income, net 781 200 149 122 (85) 13 120 216 1,516
Non-interest income 452 112 53 81 433 599 639 56 2,425
Total income 1,233 312 202 203 348 612 759 272 3,941
Expenses (income) in
respect of credit losses 80 (37) 50 32 1 (1) 2 (46) 81
Total operating and
other expenses 1,042 181 92 43 78 208 273 318 2,235
Profit before tax 111 168 60 128 269 405 484 - 1,625
Tax expenses 36 59 21 44 96 151 135 23 565
Net profit attributed to
shareholders of the
banking corporation 75 109 39 84 296 254 348 (23) 1,182
Balances as at
31 March 2015
Credit to the public, net 125,138 30,323 31,731 23,483 3,948 2,330 11,088 22,234 250,275
Deposits of the public 152,941 35,940 18,524 6,781 58,626 92 4,903 27,210 305,017
Assets under management 194,864 31,436 18,140 2,167 334,747 31,428 195,799 26,578 835,159
Balances as at
31 December 2015
Credit to the public, net 133,050 32,857 30,740 24,323 2,887 2,509 11,689 23,344 261,339
Total assets 168,774 41,593 20,139 6,859 59,350 166 5,250 26,562 328,693
Deposits of the public 181,825 28,401 17,381 1,754 336,709 23,854 187,755 19,382 797,061
(a) Data for the Arab Israel Bank were presented in 2015 in subsidiaries in Israel. For the first quarter of 2016, data for
the Arab Israel Bank are presented as a part of the Bank's data, by virtue of the merger of the Arab Israel Bank
within Leumi on 31 December 2015.

36
Regulatory operating segments
On 3 November 2014, a circular regarding reporting on operating segments and a file of questions and answers
for implementation was published. On 10 September 2015, an update to the file of questions and answers was
published.
The circular updates the Public Reporting Directives in all matters related to the reporting requirements for
regulatory operating segments, and, inter alia, includes a change in certain definitions and instructions
according to which the banks will be required to categorize customers to regulatory segments and update their
reports.
The new rules will apply from the financial statements for 2015 and thereafter in the manner set forth below:
In the financial statements for 2015, there is a disclosure requirement in connection with the balance sheet
data in relation to the regulatory operating segments as defined in the new provisions. In accordance with
the new provisions, it is permissible not to provide disclosure of comparative figures for balance sheet data
of regulatory operating segments, but rather to include comparative figures, in accordance with the Public
Reporting Directives which were in effect prior to the introduction of the circular. In addition, disclosure is
not required of the Financial Management segment.
These disclosure requirements are in addition to the disclosure requirements on operating segments in
accordance with the Public Reporting Directives which were in effect prior to the introduction of the
circular.
With effect from the financial statements for the first quarter of 2016, full disclosure is required according
to the new rules, except for disclosure of the Financial Management segment. Comparative figures should
be retroactively adjusted. It is permitted to present comparative figures of one year only in the 2016
statements, in relation to the note on regulatory operating segments. For the purpose of presenting the
comparative figures, it will be possible to rely on the classification of the customer to the regulatory
operating segments as of 1 January 2016.
Commencing with the financial statements for the first quarter of 2017, the requirements of the circular
must be implemented in full.

37
The following is a description of the main operating segments prescribed by the Bank of Israel
directives:
1. Households segment - The provision of banking services to private individuals, except customers
included in Private Banking.
2. Private Banking segment -The provision of banking services to private individuals whose balance of the
financial asset portfolio they have in the Bank (including monetary deposits, securities portfolio and other
monetary assets) exceeds NIS 3 million.
3. Small and micro-businesses segment - The provision of banking services to businesses whose activity
turnover (annual total sales or annual total income) is less than NIS 50 million.
4. Mid-sized business segment - The provision of banking services to a business whose activity turnover is
greater than or equal to NIS 50 million and less than NIS 250 million.
5. Large businesses segment - The provision of banking services to a business whose activity turnover is
greater than or equal to NIS 250 million.
6. Financial management segment - Includes the following activities:
a. Trading activity – Investment in securities for trading, market-making activity in securities and
derivative instruments, activity in derivative instruments non-designated for hedging and not part of
the management of the assets and liabilities of the banking corporation, repurchase and lending
transactions of securities for trading, short selling of securities, underwriting of securities services.
b. Asset and liability management activity – Including investment in available-for-sale debentures and
debentures held to maturity, that are not attributed to other activity segments (with a borrower having
no indebtedness to the Bank, apart from securities), hedging derivative instruments and derivative
instruments which are part of asset and liability management, deposits in banks and from banks in
Israel and around the world, hedging or protective exchange rate differences of investments in
overseas offices, deposits in and of governments.
c. Non-bank investment activity – Investment in vas shares and investment in companies included on
equity basis of businesses.
d. Other – Management, operating, trust and custody services for banks, consultancy services, selling
activity and credit portfolio management, and financial product development activities.
7. Other segment - Including discontinued activities, designated profits and other results connected to
employee rights not attributed to the other activity segments, activities not attributed to other segments,
and adjustments between the total of all the items attributed to the segments and the total of all the items
in the consolidated financial statements.

38
The following are principal data according to operating segments of the principal balance sheet items:
31 March
2016
31 December
2015 Change
31 March
2016
31 December
2015 Change
NIS millions % NIS millions %
Activity in Israel
Households 113,714 115,645 (1.7) 111,502 110,724 0.7
Private Banking 587 606 (3.1) 28,662 26,028 10.1
Small and micro businesses 58,838 57,662 2.0 40,301 41,634 (3.2)
Mid-sized businesses 25,108 25,053 0.2 27,654 25,859 6.9
Large businesses 45,913 41,262 11.3 37,455 37,057 1.1
Institutional entities 928 713 30.2 57,620 55,889 3.1
Financial management segment and other 171 341 (49.9) 2,376 4,940 (51.9)
Total activity in Israel 245,259 241,282 1.6 305,570 302,131 1.1
Activity abroad
Private individuals 2,130 2,412 (11.7 8,459 10,045 (15.8)
Business activity 20,305 21,363 (5.0) 14,272 15,416 (7.4)
Other 11 13 (15.4) 2,053 1,101 86.5
Total activity abroad 22,446 23,788 (5.6) 24,784 26,562 (6.7)
Total 267,705 265,070 1.0 330,354 328,693 0.5
Credit to the public, before
allowance for credit losses Deposits of the public
(a)
(a) As at 31 March 2016, credit to households also including housing loans (mortgages) increased by NIS 74.8 million, compared
with NIS 75.8 million as at 31 December 2015,a decrease of 1.3%.

39
The following are principal data according to operating segments of off-balance sheet items and data on
customers’ balances in the capital market:
31 March
2016
31 December
2015 Change
31 March
2016
31 December
2015 Change
NIS millions % NIS millions %
Activity in Israel
Households 113,798 115,928 (1.8) 79,351 85,409 (7.1)
Private Banking 608 613 (0.8) 50,002 51,254 (2.4)
Small and micro businesses 58,179 57,216 1.7 37,569 35,845 4.8
Mid-sized businesses 26,218 25,416 3.2 20,238 20,001 1.2
Large businesses 45,867 41,399 10.8 73,229 76,011 (3.7)
Institutional entities 1,663 1,299 28.0 287,329 284,806 0.9
Financial management segment and
other 144,730 139,504 3.7 219,418 224,356 (2.2)
Total activity in Israel 391,063 381,375 2.5 767,136 777,682 (1.4)
Activity abroad
Private individuals 2,807 3,248 (13.6) 13,601 15,102 (9.9)
Business activity 20,238 21,262 (4.8) 2,687 2,007 33.9
Other 11,449 10,614 7.9 2,856 2,270 25.8
Total activity abroad 34,494 35,124 (1.8) 19,144 19,379 (1.2)
Total 425,557 416,499 2.2 786,280 797,061 (1.4)
Securities portfolios, including mutual
fundsTotal assets
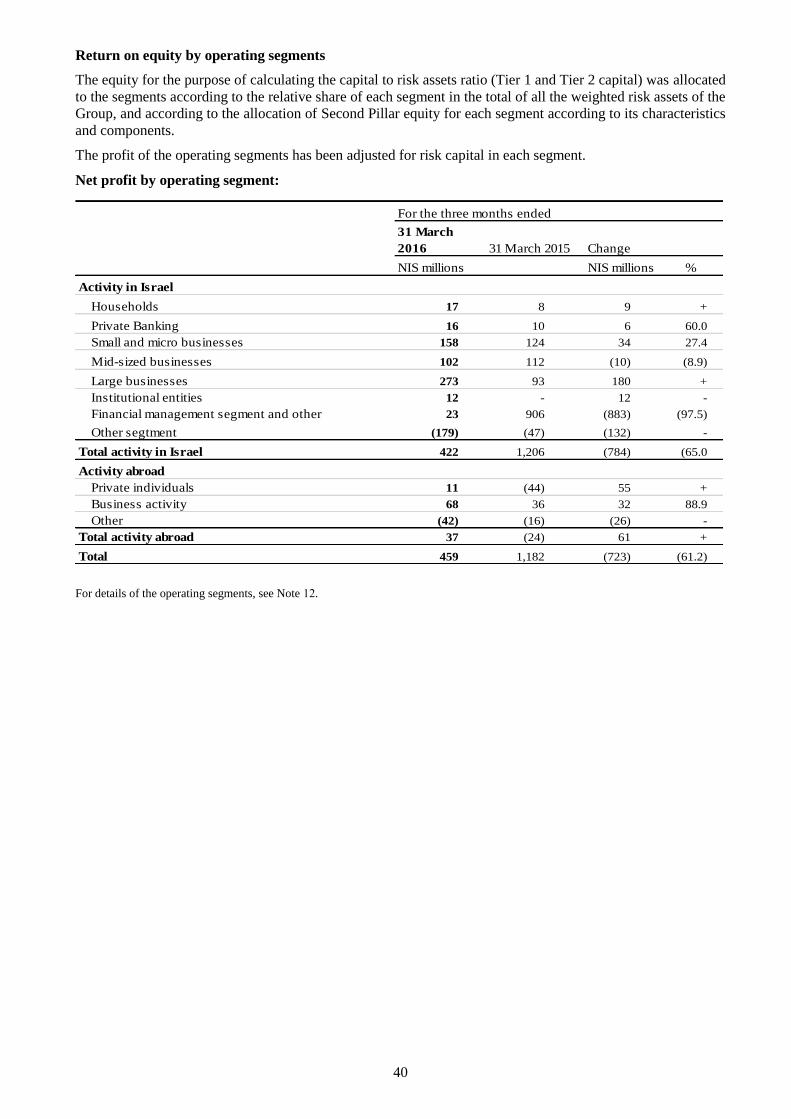
40
Return on equity by operating segments
The equity for the purpose of calculating the capital to risk assets ratio (Tier 1 and Tier 2 capital) was allocated
to the segments according to the relative share of each segment in the total of all the weighted risk assets of the
Group, and according to the allocation of Second Pillar equity for each segment according to its characteristics
and components.
The profit of the operating segments has been adjusted for risk capital in each segment.
Net profit by operating segment:
For the three months ended
31 March
2016 31 March 2015 Change
NIS millions NIS millions %
Activity in Israel
Households 17 8 9 +
Private Banking 16 10 6 60.0
Small and micro businesses 158 124 34 27.4
Mid-sized businesses 102 112 (10) (8.9)
Large businesses 273 93 180 +
Institutional entities 12 - 12 -
Financial management segment and other 23 906 (883) (97.5)
Other segtment (179) (47) (132) -
Total activity in Israel 422 1,206 (784) (65.0
Activity abroad
Private individuals 11 (44) 55 +
Business activity 68 36 32 88.9
Other (42) (16) (26) -
Total activity abroad 37 (24) 61 +
Total 459 1,182 (723) (61.2)
For details of the operating segments, see Note 21.

41
A. Household segment in Israel
Below is a summary of the results of operations of the Household Segment in Israel:
2016 2015 Change
NIS millions %
Net interest income 608 612 (4) (0.7)
Non-interest income 426 424 2 0.5
Total income 1,034 1,036 (2) (0.2)
Expenses in respect of credit losses 85 45 40 88.9
Total operating and other expenses 918 973 (55) (5.7
Profit before tax 31 18 13 72.2
Tax expenses 4 4 - -
Net profit attributed to shareholders of the
banking corporation 17 8 9 +
Average balances for the first quarter
2016 2015 Change
Credit to the public 114,640 107,146 7,494 7.0
Total assets 116,256 108,356 7,900 7.3
Deposits of the public 110,415 97,668 12,747 13.1
Assets under management 79,443 91,308 (11,865) (13.0)
Three months end 31 March
Main changes in the volume of activity
Total credit to households on 31 March 2016 amounted to about NIS 113.7 billion, compared with NIS 115.6
billion at the end of 2015, a reduction of 1.7%. Of this, consumer credit totaled NIS 38.9 billion, accounting
for 34.2%, and credit for housing totaled NIS 74.8 billion, accounting for 65.8%. Deposits of the public
decreased from NIS 110.7 billion at the end of 2015 to NIS 111.5 billion at 31 March 2016, a decrease of
0.7%.
Main changes in the net profit
The profit in the household segment in the first quarter of 2016 totaled NIS 17 million, compared with a loss
of NIS 8 million in the corresponding period last year, an increase amounting to NIS 9 million.
It is to be clarified with regard to the method of attribution of noninterest income in a 'credit card' product that
a situation of inter-segmental exists when Leumi Card clears a card issued by the Bank. In such a case, the
clearing commission collected from the merchant is recorded as income in the small businesses segment or in
the corporate segment and the interchange commission is recorded in the same segment as an expense, and at
the same time, as income in the household segment.
Housing loans
The net profit in housing loan activity amounted in 2016 to NIS 74 million, compared with NIS 76 million in
the corresponding period in 2015, a decrease of NIS 2 million.
Pension counseling
The balances of the pension assets held by customers receiving consultation in the Leumi Group which are
known to be held at 31 March 2016, including advance training funds in respect of which consultancy is
provided in the framework of pension consulting and/or investment consulting, amounts to some NIS 25.4
billion.

42
B. Private banking segment in Israel
Below is a summary of the results of operations of the private banking segment in Israel:
2016 2015 Change
NIS millions %
Net interest income 21 13 8 61.5
Non-interest income 43 49 (6) (12.2)
Total income 64 62 2 3.2
Expenses in respect of credit losses 3 5 (2) (40.0)
Total operating and other expenses 38 41 (3) (7.3)
Profit before tax 23 16 7 43.8
Tax expense 7 6 1 16.7
Net profit attributed to shareholders of the
banking corporation 16 10 6 60.0
Average balances for the first quarter
2016 2015 Change
NIS millions %
Credit to the public 549 447 102 22.8
Total assets 589 477 112 23.5
Deposits of the public 29,996 24,820 5,176 20.9
Assets under management 53,781 55,491 (1,710) (3.1)
For the three months ended 31 March
Main changes in volume of activity
On 31 March 2016, credit to the public, net, amounted to NIS 0.6 billion, similar to the end of 2015. Deposits
of the public totaled NIS 28.7 billion, an increase of NIS 2.7 billion, 10.1% compared with the end of 2015.
Main changes in the net profit
The profit in the private banking segment in the first quarter of 2016 amounted to about NIS 16 million,
compared with NIS 10 million in the corresponding period last year, an increase 0f 60.0%.

43
C. Small and micro business segment in Israel
Below is a summary of the results of operations of the small and micro business segment in Israel:
2016 2015 Change
NIS millions %
Net interest income 451 391 60 15.3
Non-interest income 204 216 (12) (5.6)
Total income 655 607 48 7.9
Expenses in respect of credit losses 63 47 16 34.0
Total operating and other expenses 345 360 (15) (4.2)
Profit before tax 247 200 47 23.5
Tax expenses 88 75 13 17.3
Net profit attributed to shareholders of the
banking corporation 158 124 34 27.4
Average balances for the first quarter
2016 2015
NIS millions Change %
Credit to the public 55,809 52,244 3,565 6.8
Total assets 56,394 52,565 3,829 7.3
Deposits of the public 37,638 32,369 5,269 16.3
Assets under management 32,779 39,051 (6,272) (16.1)
For the three months ended 31 March
Main changes in the volume of activity
Total credit to the small and micro-business segment in Israel amounted to NIS 58.8 billion at 31 March 2016,
compared with NIS 57.7 billion at the end of 2015, an increase of 2.0%. Deposits of the public amounted to
NIS 40.3 billion, compared with NIS 41.6 at the end of 2015, a decrease of 3.2%
Main changes in the net profit
Net profit in the small and micro business segment in the first quarter of 2016 amounted to NIS 158 million,
compared with NIS 124 million in the corresponding period last year, an increase of 27.4%.
The increase in the segment derives from, on the one hand, an increase in net interest income amounting to
NIS 60 million, and on the other hand, a decrease in operating and other expenses amounting to NIS 15
million.
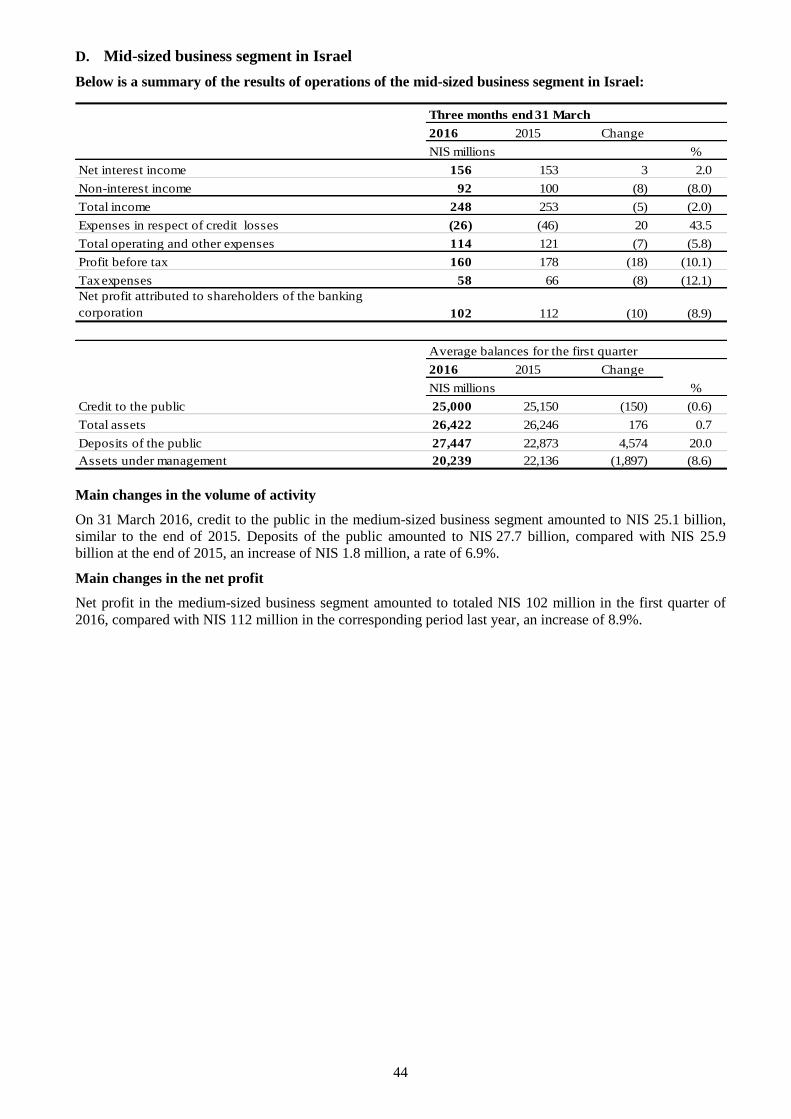
44
D. Mid-sized business segment in Israel
Below is a summary of the results of operations of the mid-sized business segment in Israel:
Three months end 31 March
2016 2015 Change
NIS millions %
Net interest income 156 153 3 2.0
Non-interest income 92 100 (8) (8.0)
Total income 248 253 (5) (2.0)
Expenses in respect of credit losses (26) (46) 20 43.5
Total operating and other expenses 114 121 (7) (5.8)
Profit before tax 160 178 (18) (10.1)
Tax expenses 58 66 (8) (12.1)
Net profit attributed to shareholders of the banking
corporation 102 112 (10) (8.9)
Average balances for the first quarter
2016 2015 Change
NIS millions %
Credit to the public 25,000 25,150 (150) (0.6)
Total assets 26,422 26,246 176 0.7
Deposits of the public 27,447 22,873 4,574 20.0
Assets under management 20,239 22,136 (1,897) (8.6)
Main changes in the volume of activity
On 31 March 2016, credit to the public in the medium-sized business segment amounted to NIS 25.1 billion,
similar to the end of 2015. Deposits of the public amounted to NIS 27.7 billion, compared with NIS 25.9
billion at the end of 2015, an increase of NIS 1.8 million, a rate of 6.9%.
Main changes in the net profit
Net profit in the medium-sized business segment amounted to totaled NIS 102 million in the first quarter of
2016, compared with NIS 112 million in the corresponding period last year, an increase of 8.9%.
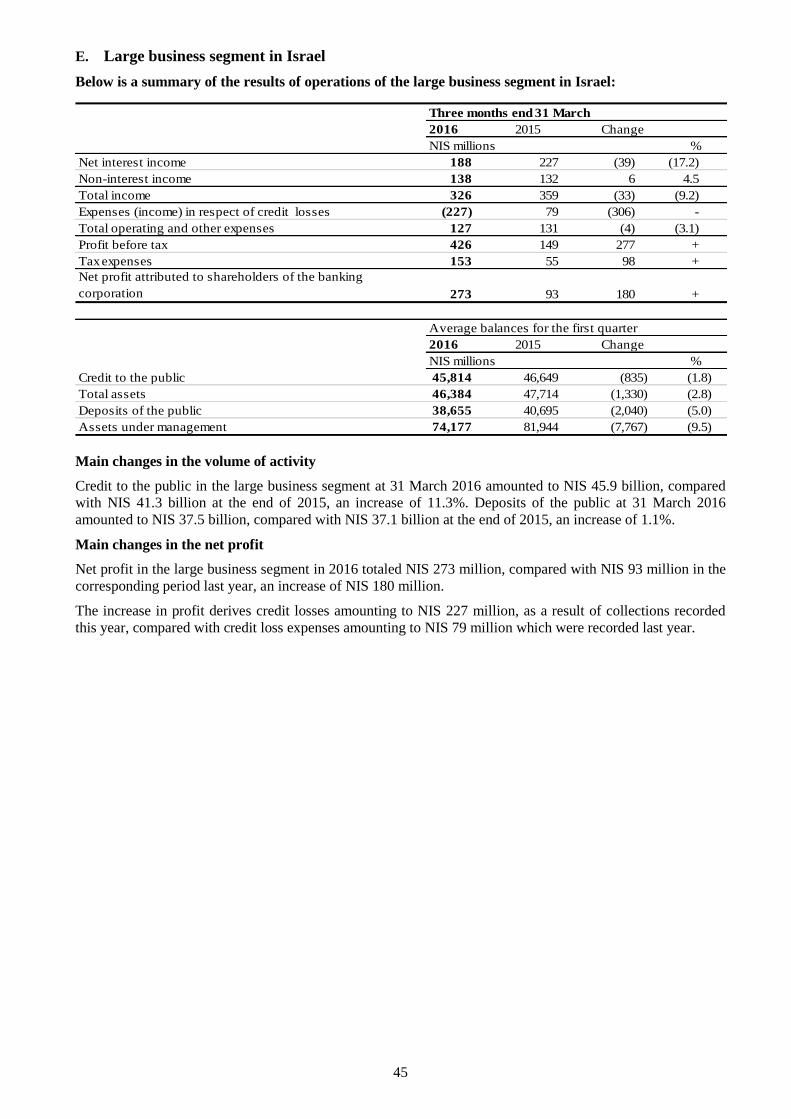
45
E. Large business segment in Israel
Below is a summary of the results of operations of the large business segment in Israel:
2016 2015 Change
NIS millions %
Net interest income 188 227 (39) (17.2)
Non-interest income 138 132 6 4.5
Total income 326 359 (33) (9.2)
Expenses (income) in respect of credit losses (227) 79 (306) -
Total operating and other expenses 127 131 (4) (3.1)
Profit before tax 426 149 277 +
Tax expenses 153 55 98 +
Net profit attributed to shareholders of the banking
corporation 273 93 180 +
Average balances for the first quarter
2016 2015 Change
NIS millions %
Credit to the public 45,814 46,649 (835) (1.8)
Total assets 46,384 47,714 (1,330) (2.8)
Deposits of the public 38,655 40,695 (2,040) (5.0)
Assets under management 74,177 81,944 (7,767) (9.5)
Three months end 31 March
Main changes in the volume of activity
Credit to the public in the large business segment at 31 March 2016 amounted to NIS 45.9 billion, compared
with NIS 41.3 billion at the end of 2015, an increase of 11.3%. Deposits of the public at 31 March 2016
amounted to NIS 37.5 billion, compared with NIS 37.1 billion at the end of 2015, an increase of 1.1%.
Main changes in the net profit
Net profit in the large business segment in 2016 totaled NIS 273 million, compared with NIS 93 million in the
corresponding period last year, an increase of NIS 180 million.
The increase in profit derives credit losses amounting to NIS 227 million, as a result of collections recorded
this year, compared with credit loss expenses amounting to NIS 79 million which were recorded last year.
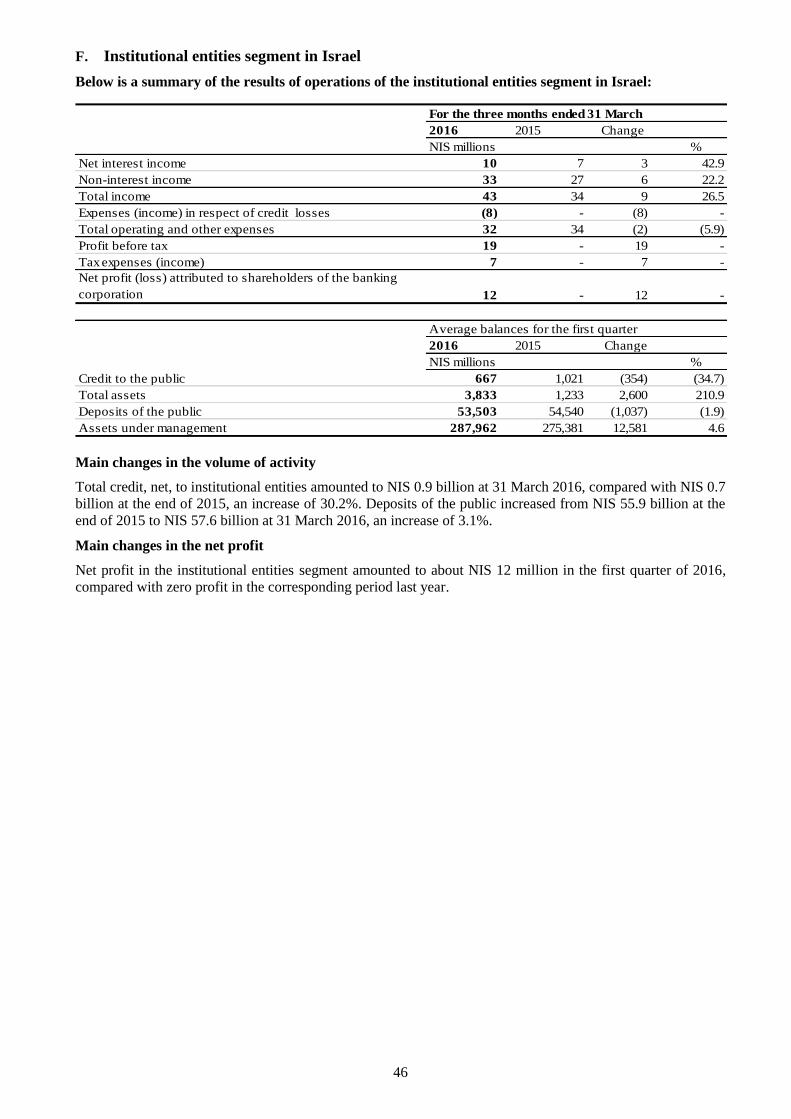
46
F. Institutional entities segment in Israel
Below is a summary of the results of operations of the institutional entities segment in Israel:
2016 2015 Change
NIS millions %
Net interest income 10 7 3 42.9
Non-interest income 33 27 6 22.2
Total income 43 34 9 26.5
Expenses (income) in respect of credit losses (8) - (8) -
Total operating and other expenses 32 34 (2) (5.9)
Profit before tax 19 - 19 -
Tax expenses (income) 7 - 7 -
Net profit (loss) attributed to shareholders of the banking
corporation 12 - 12 -
Average balances for the first quarter
2016 2015 Change
NIS millions %
Credit to the public 667 1,021 (354) (34.7)
Total assets 3,833 1,233 2,600 210.9
Deposits of the public 53,503 54,540 (1,037) (1.9)
Assets under management 287,962 275,381 12,581 4.6
For the three months ended 31 March
Main changes in the volume of activity
Total credit, net, to institutional entities amounted to NIS 0.9 billion at 31 March 2016, compared with NIS 0.7
billion at the end of 2015, an increase of 30.2%. Deposits of the public increased from NIS 55.9 billion at the
end of 2015 to NIS 57.6 billion at 31 March 2016, an increase of 3.1%.
Main changes in the net profit
Net profit in the institutional entities segment amounted to about NIS 12 million in the first quarter of 2016,
compared with zero profit in the corresponding period last year.
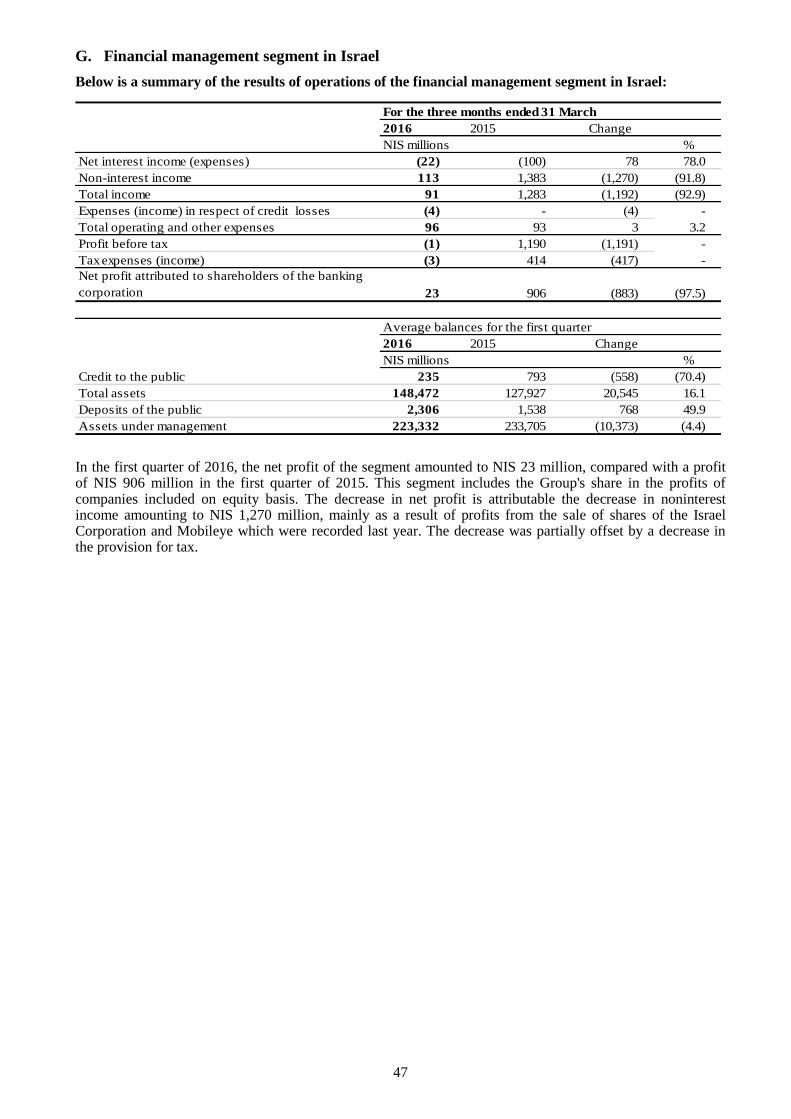
47
G. Financial management segment in Israel
Below is a summary of the results of operations of the financial management segment in Israel:
2016 2015 Change
NIS millions %
Net interest income (expenses) (22) (100) 78 78.0
Non-interest income 113 1,383 (1,270) (91.8)
Total income 91 1,283 (1,192) (92.9)
Expenses (income) in respect of credit losses (4) - (4) -
Total operating and other expenses 96 93 3 3.2
Profit before tax (1) 1,190 (1,191) -
Tax expenses (income) (3) 414 (417) -
Net profit attributed to shareholders of the banking
corporation 23 906 (883) (97.5)
Average balances for the first quarter
2016 2015 Change
NIS millions %
Credit to the public 235 793 (558) (70.4)
Total assets 148,472 127,927 20,545 16.1
Deposits of the public 2,306 1,538 768 49.9
Assets under management 223,332 233,705 (10,373) (4.4)
For the three months ended 31 March
In the first quarter of 2016, the net profit of the segment amounted to NIS 23 million, compared with a profit of NIS 906 million in the first quarter of 2015. This segment includes the Group's share in the profits of companies included on equity basis. The decrease in net profit is attributable the decrease in noninterest income amounting to NIS 1,270 million, mainly as a result of profits from the sale of shares of the Israel Corporation and Mobileye which were recorded last year. The decrease was partially offset by a decrease in the provision for tax.

48
H. Foreign operations
Below is a summary of the results of foreign operations:
2016 2015 Change
NIS millions %
Net interest income 236 212 24 11.3
Non-interest income 22 56 (34) (60.7)
Total income 258 268 (10) (3.7)
Expenses (income) in respect of credit losses (11) (46) 35 76.1
Total operating and other expenses 210 316 (106) (33.5)
Profit before tax 59 (2) 61 +
Tax expenses 22 22 - -
Net profit (loss) attributed to shareholders of the banking
corporation 37 (24) 61 +
Average balances for the first quarter
2016 2015 Change
NIS millions %
Credit to the public 21,358 23,434 (2,076) (0.1)
Total assets 34,810 35,889 (1,079) (0.0)
Deposits of the public 23,532 27,209 (3,677) (12.8)
Assets under management 17,829 32,166 (14,337) (0.4)
For the three months ended 31 March
Main changes in the volume of activity
Total credit, net, for foreign operations, amounted to NIS 22.4 billion at 31 March 2016, compared with
NIS 23.8 billion at the end of 2015, a decrease of 5.6%. Deposits of the public fell from NIS 26.6 billion to
NIS 24.8 billion, a decrease of 6.7%.
Main changes in the net profit
Net profit in the foreign operations segment in 2016 amounted NIS 37 million, compared with NIS 24 million
in the corresponding period last year, an increase of NIS 61 million.
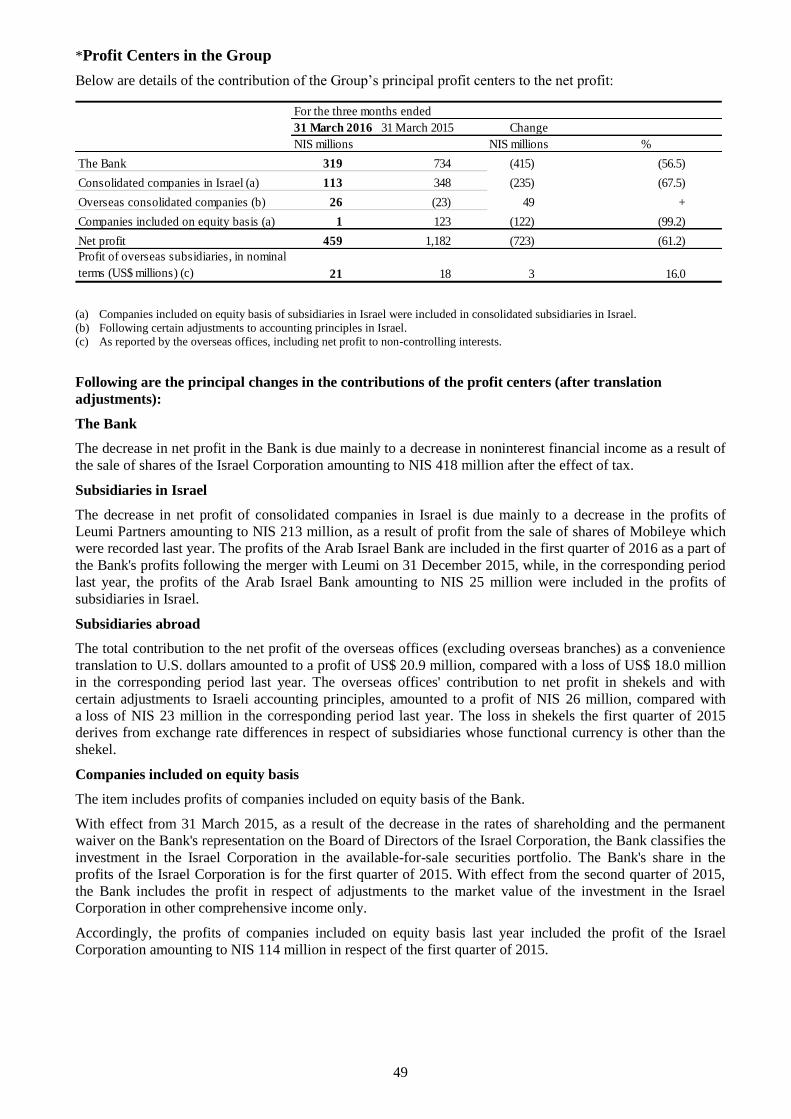
49
*Profit Centers in the Group
Below are details of the contribution of the Group’s principal profit centers to the net profit:
For the three months ended
31 March 2016 31 March 2015 Change
NIS millions NIS millions %
The Bank 319 734 (415) (56.5)
Consolidated companies in Israel (a) 113 348 (235) (67.5)
Overseas consolidated companies (b) 26 (23) 49 +
Companies included on equity basis (a) 1 123 (122) (99.2)
Net profit 459 1,182 (723) (61.2)
Profit of overseas subsidiaries, in nominal
terms (US$ millions) (c) 21 18 3 16.0
(a) Companies included on equity basis of subsidiaries in Israel were included in consolidated subsidiaries in Israel.
(b) Following certain adjustments to accounting principles in Israel.
(c) As reported by the overseas offices, including net profit to non-controlling interests.
Following are the principal changes in the contributions of the profit centers (after translation
adjustments):
The Bank
The decrease in net profit in the Bank is due mainly to a decrease in noninterest financial income as a result of
the sale of shares of the Israel Corporation amounting to NIS 418 million after the effect of tax.
Subsidiaries in Israel
The decrease in net profit of consolidated companies in Israel is due mainly to a decrease in the profits of
Leumi Partners amounting to NIS 213 million, as a result of profit from the sale of shares of Mobileye which
were recorded last year. The profits of the Arab Israel Bank are included in the first quarter of 2016 as a part of
the Bank's profits following the merger with Leumi on 31 December 2015, while, in the corresponding period
last year, the profits of the Arab Israel Bank amounting to NIS 25 million were included in the profits of
subsidiaries in Israel.
Subsidiaries abroad
The total contribution to the net profit of the overseas offices (excluding overseas branches) as a convenience
translation to U.S. dollars amounted to a profit of US$ 20.9 million, compared with a loss of US$ 18.0 million
in the corresponding period last year. The overseas offices' contribution to net profit in shekels and with
certain adjustments to Israeli accounting principles, amounted to a profit of NIS 26 million, compared with
a loss of NIS 23 million in the corresponding period last year. The loss in shekels the first quarter of 2015
derives from exchange rate differences in respect of subsidiaries whose functional currency is other than the
shekel.
Companies included on equity basis
The item includes profits of companies included on equity basis of the Bank.
With effect from 31 March 2015, as a result of the decrease in the rates of shareholding and the permanent
waiver on the Bank's representation on the Board of Directors of the Israel Corporation, the Bank classifies the
investment in the Israel Corporation in the available-for-sale securities portfolio. The Bank's share in the
profits of the Israel Corporation is for the first quarter of 2015. With effect from the second quarter of 2015,
the Bank includes the profit in respect of adjustments to the market value of the investment in the Israel
Corporation in other comprehensive income only.
Accordingly, the profits of companies included on equity basis last year included the profit of the Israel
Corporation amounting to NIS 114 million in respect of the first quarter of 2015.

50
Major Investee Companies
The Leumi Group operates in Israel and abroad through subsidiaries which are: banks, finance companies and
financial services companies. The Group also invests in non-banking corporations operating in non-banking
activity.
The Bank's total investments in consolidated companies (including investment in capital notes) amounted to NIS 11.8 billion on 31 March 2016, compared with NIS 12.5 billion on 31 December 2015, and their contribution to the Group net operating profit amounted to some NIS 140 million, compared with a profit NIS 448 million in the corresponding period last year.
Consolidated companies in Israel
The Bank's total investments in consolidated companies in Israel amounted to NIS 5,638 million on 31 March 2016, compared with NIS 6,260 million on 31 December 2015. Their contribution to the Group net operating profit amounted to some NIS 113 million in the first quarter of 2016, compared with NIS 348 million in the corresponding period last year, a decrease of 67.6%. The Group’s return on its investment in the consolidated companies in Israel was 7.4% in the first quarter of 2016 compared with 25.0% in the corresponding period last year.
Arab Israel Bank
Following letters of complaint sent by a senior office holder in the Arab Israel Bank in November 2015, it was decided to appoint an external entity to conduct an independent review in order to examine the complaint ("the external examiner").The letters of complaint deal mainly with the allegedly improper conduct of a small number of branches of the Arab Israel Bank , including the failure to report transactions which were suspected to be money laundering, the intervention of customers in the activity of these branches, the extension of credit in excess of generally accepted procedures, a number of violent incidents on the part of customers which occurred in those branches and the non-intervention of senior factors in the Arab Israel Bank into what took place in these branch.
The external examiner has submitted a partial report to the Audit Committee, according to which all of the reports on the suspicious actions regarding money laundering were made as required, while the other subjects which were raised are specific.
Below is the contribution of the principal investee companies in Israel to the net profit of the Group:
2016 2015 2016 2015 Change
% NIS millions %
Arab Israel Bank © - 16.4 - 25.1 -
Leumi Card 11.7 12.1 37.4 36.0 3.9
Leumi Partners (b) 22.9 142.9 68.2 281.0 (75.7)
Maalot 38.8 46.2 4.0 3.2 25.0
Others 1.0 0.5 3.2 2.5 28.0
Total consolidated companies in
Israel 7.4 25.0 112.8 347.8 (67.6)
For the three months ended 31 March
Return on Group investment Contribution (a) to Group net profit (a)(a)
(a) The profit (loss) shown is according to the company's share in the Group's results.
(b) Including the profit and/or loss companies included on equity basis of Leumi Partners.
(c) Arab Israel Bank merged with and in Bank Leumi on 31 December 2015.
Consolidated companies abroad
The Bank's total investment in overseas units on 31 March 2016 amounted to NIS 4,252 million, compared
with NIS 4,295 million at the end of 2015.
The contribution of the overseas offices to net profit in shekels of the Group in the first quarter of 2016
amounted to a profit of NIS 26 million compared with a loss of NIS 23 million in the corresponding period last
year.
Leumi Luxembourg
On 2 February 2016, the sale of the activity of Leumi Luxembourg to Banque J. Safra Sarasin (Luxembourg)
was completed, following the receipt of the approvals which were required for completion of the transaction.
The completion of the transaction is not expected to have a material effect on the results of the Group's
operations.
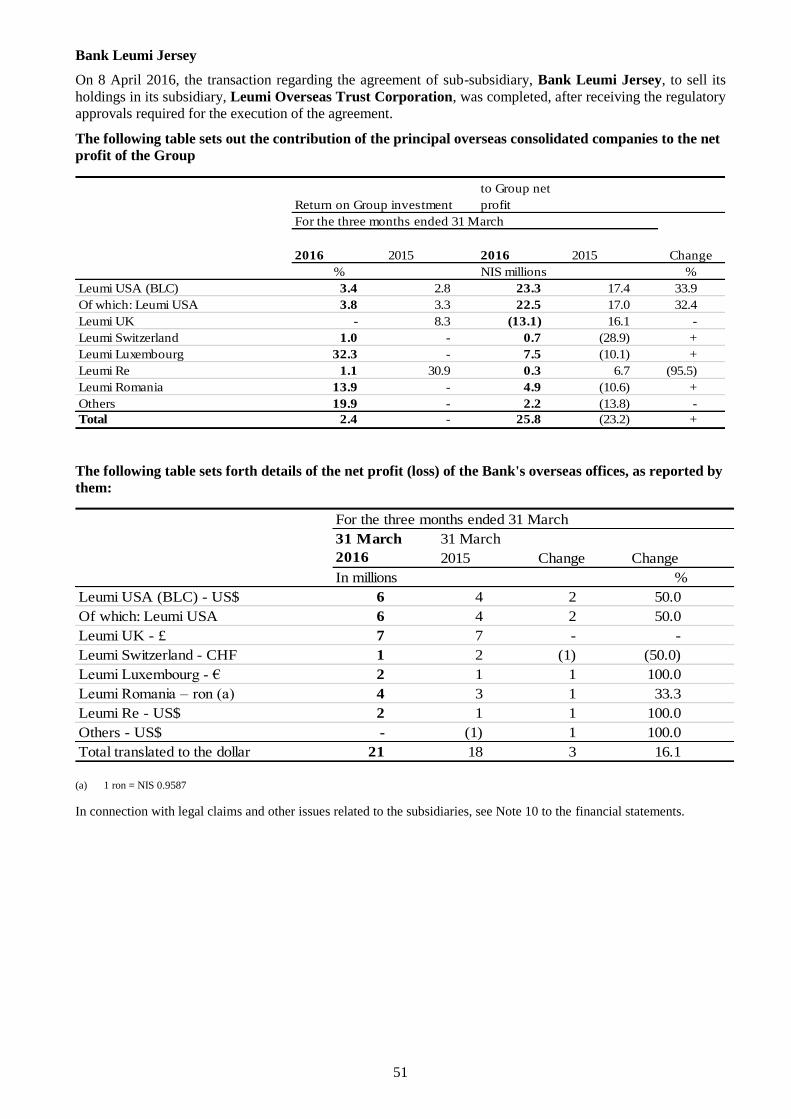
51
Bank Leumi Jersey
On 8 April 2016, the transaction regarding the agreement of sub-subsidiary, Bank Leumi Jersey, to sell its
holdings in its subsidiary, Leumi Overseas Trust Corporation, was completed, after receiving the regulatory
approvals required for the execution of the agreement.
The following table sets out the contribution of the principal overseas consolidated companies to the net
profit of the Group Contribution
to Group net
profit
2016 2015 2016 2015 Change
% NIS millions %
Leumi USA (BLC) 3.4 2.8 23.3 17.4 33.9
Of which: Leumi USA 3.8 3.3 22.5 17.0 32.4
Leumi UK - 8.3 (13.1) 16.1 -
Leumi Switzerland 1.0 - 0.7 (28.9) +
Leumi Luxembourg 32.3 - 7.5 (10.1) +
Leumi Re 1.1 30.9 0.3 6.7 (95.5)
Leumi Romania 13.9 - 4.9 (10.6) +
Others 19.9 - 2.2 (13.8) -
Total 2.4 - 25.8 (23.2) +
For the three months ended 31 March
Return on Group investment
The following table sets forth details of the net profit (loss) of the Bank's overseas offices, as reported by
them:
For the three months ended 31 March
31 March
2016
31 March
2015 Change Change
In millions %
Leumi USA (BLC) - US$ 6 4 2 50.0
Of which: Leumi USA 6 4 2 50.0
Leumi UK - £ 7 7 - -
Leumi Switzerland - CHF 1 2 (1) (50.0)
Leumi Luxembourg - € 2 1 1 100.0
Leumi Romania – ron )a( 4 3 1 33.3
Leumi Re - US$ 2 1 1 100.0
Others - US$ - (1) 1 100.0
Total translated to the dollar 21 18 3 16.1 (a) 1 ron = NIS 0.9587
In connection with legal claims and other issues related to the subsidiaries, see Note 10 to the financial statements.

52
Activities of Companies Included on Equity Basis
Total investments of the Group in companies included on equity basis amounted to NIS 899 million as at
31 March 2016, compared with NIS 924 million as at 31 December 2015. The contribution to net profit of the
companies included on equity basis in the first quarter of 2016 amounted to NIS 19 million, compared with a
total of NIS 131 million in the corresponding period last year.

53
Exposure to Risk and Methods of Risk Management
This chapter is written in greater detail in the 2015 Annual Report (pages 105 to 154) and in the Report on Risks. The chapter below
should therefore be read in conjunction with those reports.
Main changes in the risk environment and their impact on the Group
During the first quarter of 2016, volatility in the local and global markets intensified, with the first part of the
quarter being characterized by sharp decreases in financial markets, particularly in the global banking sector.
The main concerns related to a trend of slowdown in growth in China and its effect on the world economy, the
continuing fall in oil prices and worries regarding a change in the route for raising interest rates in the United
States. The volatility affected, among other things, share prices, debenture margins and CDS margins. From
the end of February, there was a correction in market trends, an improvement in debenture margins and CDS
margins, and even the price of oil rose.
In Israel, the macro-data indicate a decline in the rate of growth and a continuation of the low inflation rate.
From publications of the monetary committee, it appears that there is high probability that the interest
environment is expected to remain low in the near term, in light of these macro-data.
The escalation in the security situation, which appears to more than a passing wave, is also liable to have an
adverse effect.
Around the world, the trend of several regulatory changes continued, affecting the business model of the
global banking system, while a similar phenomenon is evident in Israel.
We have witnessed to a continual increase in the frequency and power of cyber threats, both around the world
and within Israel, in particular. There has been an increase in motivation to attack various financial bodies.
Most of the risks in the technological innovation relate to raising the risk level of cyber attackers to the
exposure of information on customers of the Bank and impairing the availability of the services.
In relation to the capital targets, Leumi continues to be prepared to strengthen capital adequacy and reach the
capital targets required by the regulatory authorities, even in view of the standard on employee rights, whose
impact on the Bank's capital in the low and volatile interest environment is significant.
Table of severity of risk factors
There were no changes in the severity of the risk factors in relation to the table published in the 2015 Annual
Report.
Credit risk
This chapter is written in greater detail in the 2015 Annual Report (pages 114 to 130) and in the Report on Risks. The chapter below
should therefore be read in conjunction with those reports.
Credit risk is the Bank's risk of a loss as a result of the possibility that a counterparty does not fulfill its
obligations vis-à-vis the banking corporation, as agreed. The Bank implements an overall policy for credit risk
management, in accordance with the provisions of Proper Conduct of Banking Management Regulation
no. 311.
The credit is the main core activity of the Bank and the Group and the credit risk is managed respectively
through three lines of defense. The central principles in the management of credit risk are laid out in the
document "Credit Policy and Credit Risk" which is scanned each year and updated as necessary with the
approval of the Bank management.
During the first quarter of the year, there was no material change in the risk profile of the credit portfolio.

54
Problem Credit Risk
31 March 2016
Balance sheet Off-balance sheet Total
NIS millions
1. Problem credit risk: (a)
Impaired credit risk 3,711 257 3,968
Subordinate credit risk 1,310 183 1,493
Credit risk under special supervision (b) 2,923 1,244 4,167
Total problem credit 7,944 1,684 9,628
Of which: Unimpaired debts in arrears 90 days or more (b) 857 - -
2. Non-performing assets:
Impaired debts 3,253 - -
Assets received in respect of credit cleared 12 - -
Total non-performing assets 3,265 - -
31 March 2015
Balance sheet Off-balance sheet Total
NIS millions
1. Problem credit risk: (a)
Impaired credit risk 4,875 295 5,170
Subordinate credit risk 1,722 633 2,355
Credit risk under special supervision (b) 3,742 535 4,277
Total problem credit 10,339 1,463 11,802
Of which: Unimpaired debts in arrears 90 days or more (b) 928 - -
2. Non-performing assets:
Impaired debts 4,530 - -
Assets received in respect of credit cleared 15 - -
Total non-performing assets 4,545 - -
31 December 2015
Balance sheet Off-balance sheet Total
NIS millions
1. Problem credit risk: (a)
Impaired credit risk 3,940 295 4,235
Subordinate credit risk 1,413 235 1,648
Credit risk under special supervision (b) 2,995 886 3,881
Total problem credit 8,348 1,416 9,764
Of which: Unimpaired debts in arrears 90 days or more (b) 942 - -
2. Non-performing assets:
Impaired debts 3,485 - -
Assets received in respect of credit cleared 7 - -
Total non-performing assets 3,492 - -
Note: Balance sheet and off-balance sheet credit risk is presented before the effect of the allowances for credit losses and before the
effect of deductible collateral for the indebtedness of a borrower and a group of borrowers.
(a) Credit risk, impaired, subordinate or under special supervision.
(b) Including in respect of housing loans in respect of which there is an allowance according to the extent of arrears and in respect of
housing loans in respect of which there is no allowance according to the extent of arrears which are in arrears of 90 days or more.
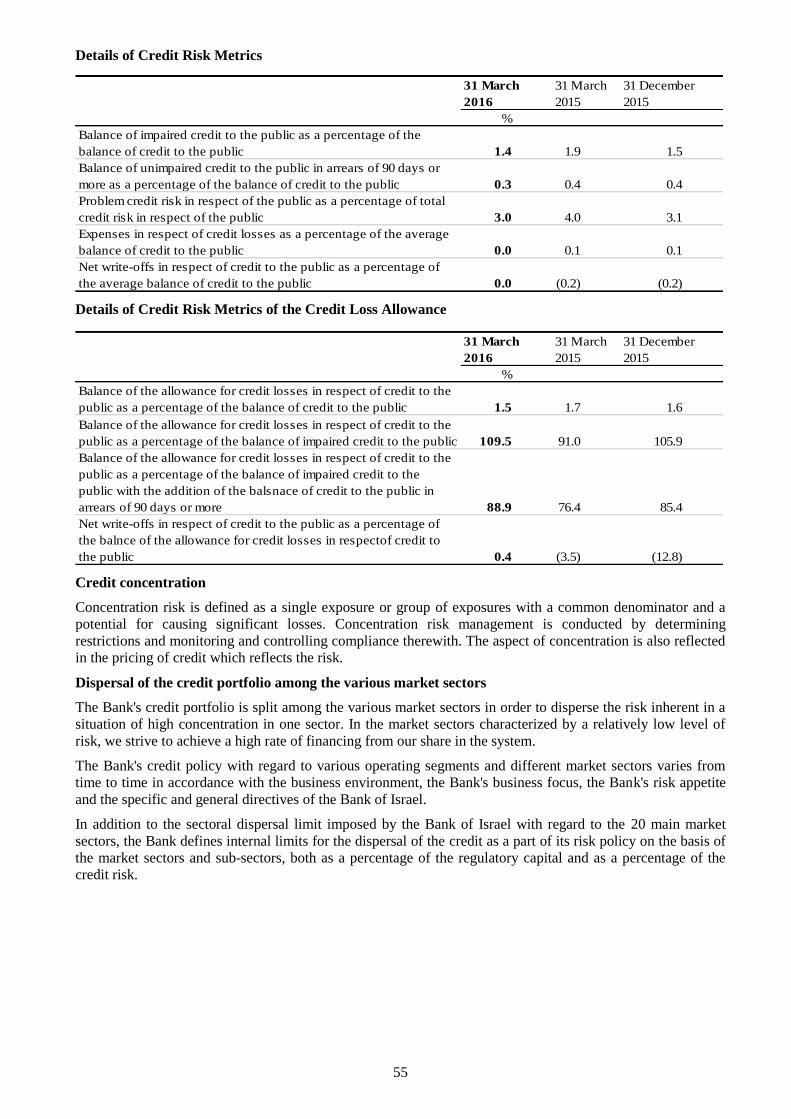
55
Details of Credit Risk Metrics
31 March
2016
31 March
2015
31 December
2015
%
Balance of impaired credit to the public as a percentage of the
balance of credit to the public 1.4 1.9 1.5
Balance of unimpaired credit to the public in arrears of 90 days or
more as a percentage of the balance of credit to the public 0.3 0.4 0.4
Problem credit risk in respect of the public as a percentage of total
credit risk in respect of the public 3.0 4.0 3.1
Expenses in respect of credit losses as a percentage of the average
balance of credit to the public 0.0 0.1 0.1
Net write-offs in respect of credit to the public as a percentage of
the average balance of credit to the public 0.0 (0.2) (0.2)
Details of Credit Risk Metrics of the Credit Loss Allowance
31 March
2016
31 March
2015
31 December
2015
%
Balance of the allowance for credit losses in respect of credit to the
public as a percentage of the balance of credit to the public 1.5 1.7 1.6
Balance of the allowance for credit losses in respect of credit to the
public as a percentage of the balance of impaired credit to the public 109.5 91.0 105.9
Balance of the allowance for credit losses in respect of credit to the
public as a percentage of the balance of impaired credit to the
public with the addition of the balsnace of credit to the public in
arrears of 90 days or more 88.9 76.4 85.4
Net write-offs in respect of credit to the public as a percentage of
the balnce of the allowance for credit losses in respectof credit to
the public 0.4 (3.5) (12.8)
Credit concentration
Concentration risk is defined as a single exposure or group of exposures with a common denominator and a
potential for causing significant losses. Concentration risk management is conducted by determining
restrictions and monitoring and controlling compliance therewith. The aspect of concentration is also reflected
in the pricing of credit which reflects the risk.
Dispersal of the credit portfolio among the various market sectors
The Bank's credit portfolio is split among the various market sectors in order to disperse the risk inherent in a
situation of high concentration in one sector. In the market sectors characterized by a relatively low level of
risk, we strive to achieve a high rate of financing from our share in the system.
The Bank's credit policy with regard to various operating segments and different market sectors varies from
time to time in accordance with the business environment, the Bank's business focus, the Bank's risk appetite
and the specific and general directives of the Bank of Israel.
In addition to the sectoral dispersal limit imposed by the Bank of Israel with regard to the 20 main market
sectors, the Bank defines internal limits for the dispersal of the credit as a part of its risk policy on the basis of
the market sectors and sub-sectors, both as a percentage of the regulatory capital and as a percentage of the
credit risk.
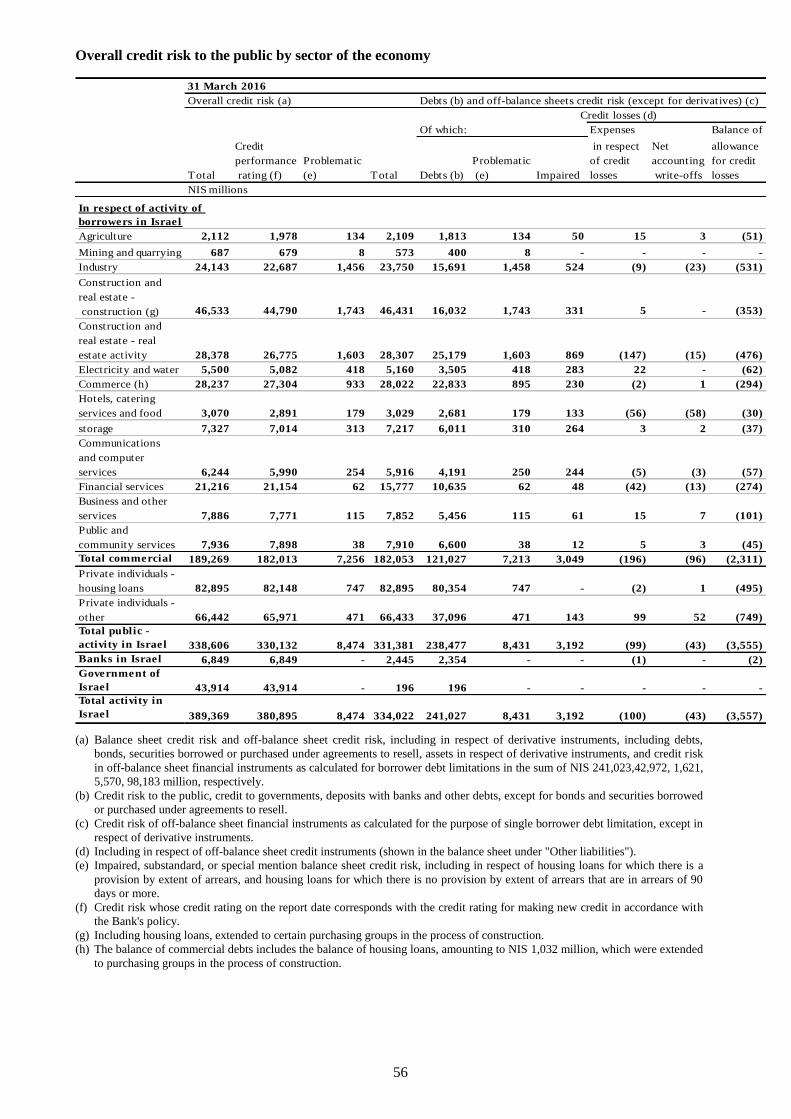
56
Overall credit risk to the public by sector of the economy
Overall credit risk (a)
Credit losses (d)
Expenses Balance of
Total
Credit
performance
rating (f)
Problematic
(e) Total Debts (b)
Problematic
(e) Impaired
in respect
of credit
losses
Net
accounting
write-offs
allowance
for credit
losses
NIS millions
Agriculture 2,112 1,978 134 2,109 1,813 134 50 15 3 (51)
Mining and quarrying 687 679 8 573 400 8 - - - -
Industry 24,143 22,687 1,456 23,750 15,691 1,458 524 (9) (23) (531)
Construction and
real estate -
construction (g) 46,533 44,790 1,743 46,431 16,032 1,743 331 5 - (353)
Construction and
real estate - real
estate activity 28,378 26,775 1,603 28,307 25,179 1,603 869 (147) (15) (476)
Electricity and water 5,500 5,082 418 5,160 3,505 418 283 22 - (62)
Commerce (h) 28,237 27,304 933 28,022 22,833 895 230 (2) 1 (294)
Hotels, catering
services and food 3,070 2,891 179 3,029 2,681 179 133 (56) (58) (30)Transport and
storage 7,327 7,014 313 7,217 6,011 310 264 3 2 (37)
Communications
and computer
services 6,244 5,990 254 5,916 4,191 250 244 (5) (3) (57)
Financial services 21,216 21,154 62 15,777 10,635 62 48 (42) (13) (274)
Business and other
services 7,886 7,771 115 7,852 5,456 115 61 15 7 (101)
Public and
community services 7,936 7,898 38 7,910 6,600 38 12 5 3 (45)
Total commercial 189,269 182,013 7,256 182,053 121,027 7,213 3,049 (196) (96) (2,311)
Private individuals -
housing loans 82,895 82,148 747 82,895 80,354 747 - (2) 1 (495)
Private individuals -
other 66,442 65,971 471 66,433 37,096 471 143 99 52 (749)
Total public -
activity in Israel 338,606 330,132 8,474 331,381 238,477 8,431 3,192 (99) (43) (3,555)
Banks in Israel 6,849 6,849 - 2,445 2,354 - - (1) - (2)
Government of
Israel 43,914 43,914 - 196 196 - - - - -
Total activity in
Israel 389,369 380,895 8,474 334,022 241,027 8,431 3,192 (100) (43) (3,557)
31 March 2016
Debts (b) and off-balance sheets credit risk (except for derivatives) (c)
Of which:
In respect of activity of
borrowers in Israel
(a) Balance sheet credit risk and off-balance sheet credit risk, including in respect of derivative instruments, including debts,
bonds, securities borrowed or purchased under agreements to resell, assets in respect of derivative instruments, and credit risk
in off-balance sheet financial instruments as calculated for borrower debt limitations in the sum of NIS 241,023,42,972, 1,621,
5,570, 98,183 million, respectively.
(b) Credit risk to the public, credit to governments, deposits with banks and other debts, except for bonds and securities borrowed
or purchased under agreements to resell.
(c) Credit risk of off-balance sheet financial instruments as calculated for the purpose of single borrower debt limitation, except in
respect of derivative instruments.
(d) Including in respect of off-balance sheet credit instruments (shown in the balance sheet under "Other liabilities").
(e) Impaired, substandard, or special mention balance sheet credit risk, including in respect of housing loans for which there is a
provision by extent of arrears, and housing loans for which there is no provision by extent of arrears that are in arrears of 90
days or more.
(f) Credit risk whose credit rating on the report date corresponds with the credit rating for making new credit in accordance with
the Bank's policy.
(g) Including housing loans, extended to certain purchasing groups in the process of construction.
(h) The balance of commercial debts includes the balance of housing loans, amounting to NIS 1,032 million, which were extended
to purchasing groups in the process of construction.

57
Overall risk of credit to the public by sector of the economy (contd.)
Overall credit risk (a)
Credit losses (d)
Expenses Balance of
Total
Credit
performance
rating (f)
Problematic
(e) Total1 Debts (b)
Problematic
(e) Impaired
in respect
of credit
losses
Net
accounting
write-offs
allowance
for credit
losses
)NIS millions(
In respect of activity
of borrowers abroad
Agriculture 61 60 1 61 53 1 1 (1) - (2)
Mining and
quarrying 38 38 - 36 29 - - - - -
Industry 8,519 8,292 227 7,098 4,719 227 59 (26) 10 (53)
Construction and
real estate (g) 12,424 11,881 543 12,039 9,203 543 378 (8) (3) (215)
Electricity and water 312 312 - 78 47 - - - - -
Commerce 7,481 7,413 68 7,366 4,890 68 68 7 1 (87)
Hotels, catering
services and food 1,476 1,448 28 1,476 1,392 28 21 - - (10)
Transport and storage 242 178 64 225 199 64 64 6 19 (16)
Communications and
computer services 2,343 2,343 - 2,031 799 - - - - (1)
Financial services 17,360 17,271 89 2,491 1,631 89 89 (6) (1) (46)
Business and other
services 5,440 5,391 49 5,353 4,522 49 2 5 - (19)
Public and
community services 478 471 7 467 356 7 - - - (18)
Total commercial 56,174 55,098 1,076 38,721 27,840 1,076 682 (23) 26 (467)
Private individuals -
housing loans 1,130 1,081 49 1,131 1,126 48 45 - 1 (15)
Private individuals -
other 426 397 29 415 262 29 28 - - (6)
Total public -
activity abroad 57,730 56,576 1,154 40,267 29,228 1,153 755 (23) 27 (488)
Banks abroad 23,318 23,318 - 10,609 8,969 - - - - -
Governments
abroad 15,052 15,052 - 460 216 - - - - -
Total activity
abroad 96,100 94,946 1,154 51,336 38,413 1,153 755 (23) 27 (488)
Total 485,469 475,841 9,628 385,358 279,440 9,584 3,947 (123) (16) (4,045)
Of which:
31 March 2016
Debts (b) and off-balance sheets credit risk (except for derivatives) (c)
(a) Balance sheet credit risk and off-balance sheet credit risk, including in respect of derivative instruments, including debts,
bonds, securities borrowed or purchased under agreements to resell, assets in respect of derivative instruments, and credit risk
in off-balance sheet financial instruments as calculated for borrower debt limitations in the sum of NIS 38,414, 33,144, -,
7,556, 16,986 million, respectively.
(b) Credit risk to the public, credit to governments, deposits with banks and other debts, except for bonds and securities borrowed
or purchased under agreements to resell.
(c) Credit risk of off-balance sheet financial instruments as calculated for the purpose of single borrower debt limitation, except in
respect of derivative instruments.
(d) Including in respect of off-balance sheet credit instruments (shown in the balance sheet under "Other liabilities").
(e) Impaired, substandard, or special mention balance sheet credit risk, including in respect of housing loans for which there is a
provision by extent of arrears, and housing loans for which there is no provision by extent of arrears that are in arrears of 90
days or more.
(f) Credit risk whose credit rating on the report date corresponds with the credit rating for making new credit in accordance with
the Bank's policy.
(g) Including housing loans, extended to certain purchasing groups in the process of construction.
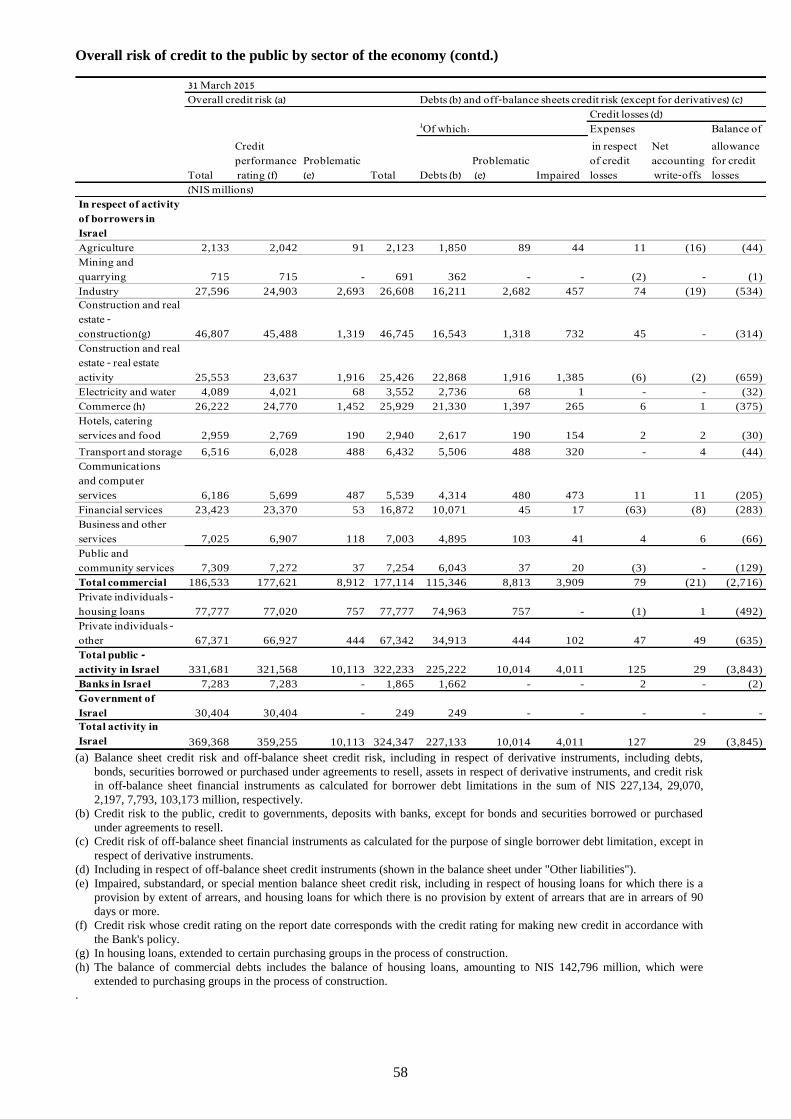
58
Overall risk of credit to the public by sector of the economy (contd.)
Overall credit risk (a)
Credit losses (d)
Expenses Balance of
Total
Credit
performance
rating (f)
Problematic
(e) Total Debts (b)
Problematic
(e) Impaired
in respect
of credit
losses
Net
accounting
write-offs
allowance
for credit
losses
)NIS millions(
In respect of activity
of borrowers in
Israel
Agriculture 2,133 2,042 91 2,123 1,850 89 44 11 (16) (44)
Mining and
quarrying 715 715 - 691 362 - - (2) - (1)
Industry 27,596 24,903 2,693 26,608 16,211 2,682 457 74 (19) (534)
Construction and real
estate -
construction(g) 46,807 45,488 1,319 46,745 16,543 1,318 732 45 - (314)
Construction and real
estate - real estate
activity 25,553 23,637 1,916 25,426 22,868 1,916 1,385 (6) (2) (659)
Electricity and water 4,089 4,021 68 3,552 2,736 68 1 - - (32)
Commerce (h) 26,222 24,770 1,452 25,929 21,330 1,397 265 6 1 (375)
Hotels, catering
services and food 2,959 2,769 190 2,940 2,617 190 154 2 2 (30)
Transport and storage 6,516 6,028 488 6,432 5,506 488 320 - 4 (44)
Communications
and computer
services 6,186 5,699 487 5,539 4,314 480 473 11 11 (205)
Financial services 23,423 23,370 53 16,872 10,071 45 17 (63) (8) (283)
Business and other
services 7,025 6,907 118 7,003 4,895 103 41 4 6 (66)
Public and
community services 7,309 7,272 37 7,254 6,043 37 20 (3) - (129)
Total commercial 186,533 177,621 8,912 177,114 115,346 8,813 3,909 79 (21) (2,716)
Private individuals -
housing loans 77,777 77,020 757 77,777 74,963 757 - (1) 1 (492)
Private individuals -
other 67,371 66,927 444 67,342 34,913 444 102 47 49 (635)
Total public -
activity in Israel 331,681 321,568 10,113 322,233 225,222 10,014 4,011 125 29 (3,843)
Banks in Israel 7,283 7,283 - 1,865 1,662 - - 2 - (2)
Government of
Israel 30,404 30,404 - 249 249 - - - - -
Total activity in
Israel 369,368 359,255 10,113 324,347 227,133 10,014 4,011 127 29 (3,845)
31 March 2015
Debts (b) and off-balance sheets credit risk (except for derivatives) (c)
1Of which:
(a) Balance sheet credit risk and off-balance sheet credit risk, including in respect of derivative instruments, including debts,
bonds, securities borrowed or purchased under agreements to resell, assets in respect of derivative instruments, and credit risk
in off-balance sheet financial instruments as calculated for borrower debt limitations in the sum of NIS 227,134, 29,070,
2,197, 7,793, 103,173 million, respectively.
(b) Credit risk to the public, credit to governments, deposits with banks, except for bonds and securities borrowed or purchased
under agreements to resell.
(c) Credit risk of off-balance sheet financial instruments as calculated for the purpose of single borrower debt limitation, except in
respect of derivative instruments.
(d) Including in respect of off-balance sheet credit instruments (shown in the balance sheet under "Other liabilities").
(e) Impaired, substandard, or special mention balance sheet credit risk, including in respect of housing loans for which there is a
provision by extent of arrears, and housing loans for which there is no provision by extent of arrears that are in arrears of 90
days or more.
(f) Credit risk whose credit rating on the report date corresponds with the credit rating for making new credit in accordance with
the Bank's policy.
(g) In housing loans, extended to certain purchasing groups in the process of construction.
(h) The balance of commercial debts includes the balance of housing loans, amounting to NIS 142,796 million, which were
extended to purchasing groups in the process of construction.
.
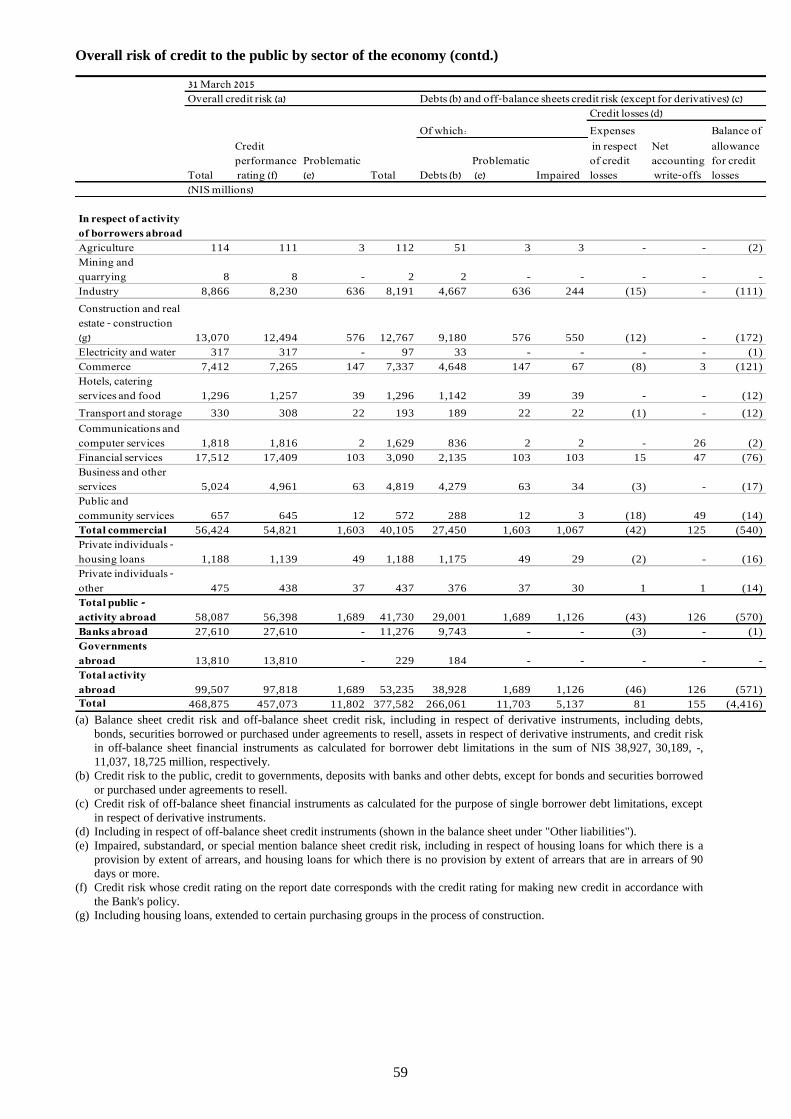
59
Overall risk of credit to the public by sector of the economy (contd.)
Overall credit risk (a)
Credit losses (d)
Expenses Balance of
Total
Credit
performance
rating (f)
Problematic
(e) Total Debts (b)
Problematic
(e) Impaired
in respect
of credit
losses
Net
accounting
write-offs
allowance
for credit
losses
)NIS millions(
In respect of activity
of borrowers abroad
Agriculture 114 111 3 112 51 3 3 - - (2)
Mining and
quarrying 8 8 - 2 2 - - - - -
Industry 8,866 8,230 636 8,191 4,667 636 244 (15) - (111)
Construction and real
estate - construction
(g) 13,070 12,494 576 12,767 9,180 576 550 (12) - (172)
Electricity and water 317 317 - 97 33 - - - - (1)
Commerce 7,412 7,265 147 7,337 4,648 147 67 (8) 3 (121)
Hotels, catering
services and food 1,296 1,257 39 1,296 1,142 39 39 - - (12)
Transport and storage 330 308 22 193 189 22 22 (1) - (12)
Communications and
computer services 1,818 1,816 2 1,629 836 2 2 - 26 (2)
Financial services 17,512 17,409 103 3,090 2,135 103 103 15 47 (76)
Business and other
services 5,024 4,961 63 4,819 4,279 63 34 (3) - (17)
Public and
community services 657 645 12 572 288 12 3 (18) 49 (14)
Total commercial 56,424 54,821 1,603 40,105 27,450 1,603 1,067 (42) 125 (540)
Private individuals -
housing loans 1,188 1,139 49 1,188 1,175 49 29 (2) - (16)
Private individuals -
other 475 438 37 437 376 37 30 1 1 (14)
Total public -
activity abroad 58,087 56,398 1,689 41,730 29,001 1,689 1,126 (43) 126 (570)
Banks abroad 27,610 27,610 - 11,276 9,743 - - (3) - (1)
Governments
abroad 13,810 13,810 - 229 184 - - - - -
Total activity
abroad 99,507 97,818 1,689 53,235 38,928 1,689 1,126 (46) 126 (571)
Total 468,875 457,073 11,802 377,582 266,061 11,703 5,137 81 155 (4,416)
31 March 2015
Debts (b) and off-balance sheets credit risk (except for derivatives) (c)
Of which:
(a) Balance sheet credit risk and off-balance sheet credit risk, including in respect of derivative instruments, including debts,
bonds, securities borrowed or purchased under agreements to resell, assets in respect of derivative instruments, and credit risk
in off-balance sheet financial instruments as calculated for borrower debt limitations in the sum of NIS 38,927, 30,189, -,
11,037, 18,725 million, respectively.
(b) Credit risk to the public, credit to governments, deposits with banks and other debts, except for bonds and securities borrowed
or purchased under agreements to resell.
(c) Credit risk of off-balance sheet financial instruments as calculated for the purpose of single borrower debt limitations, except
in respect of derivative instruments.
(d) Including in respect of off-balance sheet credit instruments (shown in the balance sheet under "Other liabilities").
(e) Impaired, substandard, or special mention balance sheet credit risk, including in respect of housing loans for which there is a
provision by extent of arrears, and housing loans for which there is no provision by extent of arrears that are in arrears of 90
days or more.
(f) Credit risk whose credit rating on the report date corresponds with the credit rating for making new credit in accordance with
the Bank's policy.
(g) Including housing loans, extended to certain purchasing groups in the process of construction.
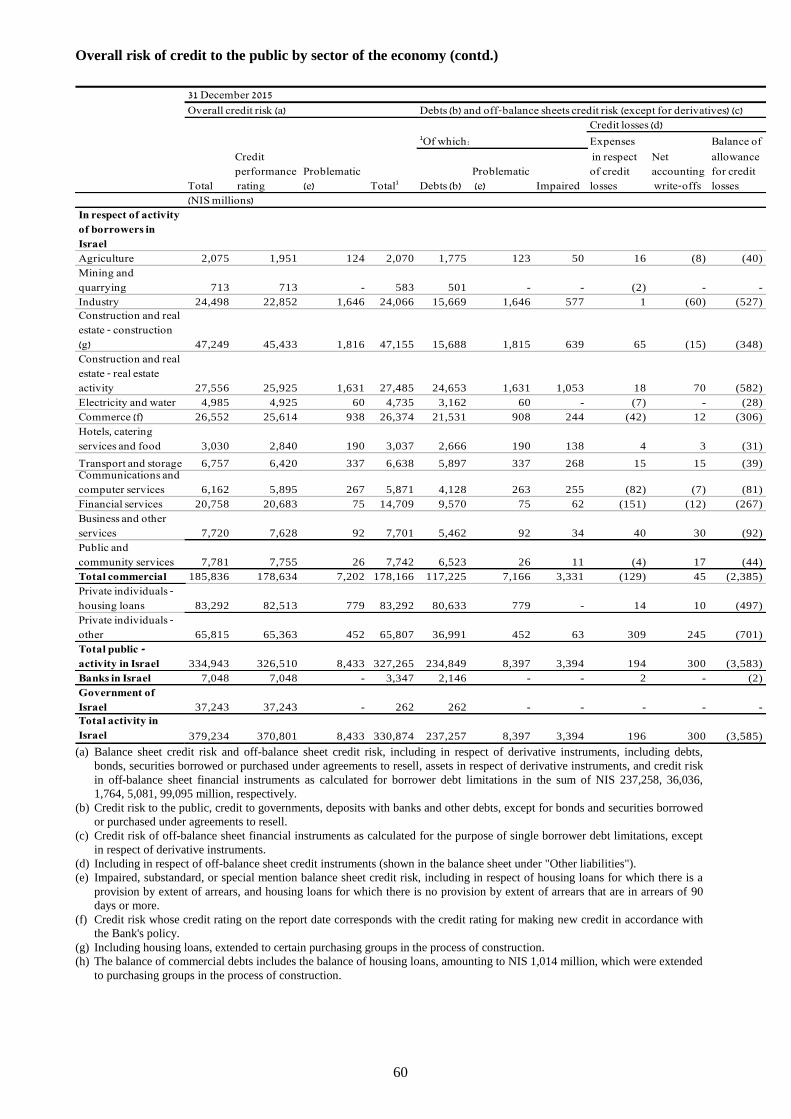
60
Overall risk of credit to the public by sector of the economy (contd.)
Overall credit risk (a)
Credit losses (d)
Expenses Balance of
Total
Credit
performance
rating
Problematic
(e) Total1 Debts (b)
Problematic
(e) Impaired
in respect
of credit
losses
Net
accounting
write-offs
allowance
for credit
losses
)NIS millions(
In respect of activity
of borrowers in
Israel
Agriculture 2,075 1,951 124 2,070 1,775 123 50 16 (8) (40)
Mining and
quarrying 713 713 - 583 501 - - (2) - -
Industry 24,498 22,852 1,646 24,066 15,669 1,646 577 1 (60) (527)
Construction and real
estate - construction
(g) 47,249 45,433 1,816 47,155 15,688 1,815 639 65 (15) (348)
Construction and real
estate - real estate
activity 27,556 25,925 1,631 27,485 24,653 1,631 1,053 18 70 (582)
Electricity and water 4,985 4,925 60 4,735 3,162 60 - (7) - (28)
Commerce (f) 26,552 25,614 938 26,374 21,531 908 244 (42) 12 (306)
Hotels, catering
services and food 3,030 2,840 190 3,037 2,666 190 138 4 3 (31)
Transport and storage 6,757 6,420 337 6,638 5,897 337 268 15 15 (39)Communications and
computer services 6,162 5,895 267 5,871 4,128 263 255 (82) (7) (81)
Financial services 20,758 20,683 75 14,709 9,570 75 62 (151) (12) (267)
Business and other
services 7,720 7,628 92 7,701 5,462 92 34 40 30 (92)
Public and
community services 7,781 7,755 26 7,742 6,523 26 11 (4) 17 (44)
Total commercial 185,836 178,634 7,202 178,166 117,225 7,166 3,331 (129) 45 (2,385)
Private individuals -
housing loans 83,292 82,513 779 83,292 80,633 779 - 14 10 (497)
Private individuals -
other 65,815 65,363 452 65,807 36,991 452 63 309 245 (701)
Total public -
activity in Israel 334,943 326,510 8,433 327,265 234,849 8,397 3,394 194 300 (3,583)
Banks in Israel 7,048 7,048 - 3,347 2,146 - - 2 - (2)
Government of
Israel 37,243 37,243 - 262 262 - - - - -
Total activity in
Israel 379,234 370,801 8,433 330,874 237,257 8,397 3,394 196 300 (3,585)
31 December 2015
Debts (b) and off-balance sheets credit risk (except for derivatives) (c)
1Of which:
(a) Balance sheet credit risk and off-balance sheet credit risk, including in respect of derivative instruments, including debts,
bonds, securities borrowed or purchased under agreements to resell, assets in respect of derivative instruments, and credit risk
in off-balance sheet financial instruments as calculated for borrower debt limitations in the sum of NIS 237,258, 36,036,
1,764, 5,081, 99,095 million, respectively.
(b) Credit risk to the public, credit to governments, deposits with banks and other debts, except for bonds and securities borrowed
or purchased under agreements to resell.
(c) Credit risk of off-balance sheet financial instruments as calculated for the purpose of single borrower debt limitations, except
in respect of derivative instruments.
(d) Including in respect of off-balance sheet credit instruments (shown in the balance sheet under "Other liabilities").
(e) Impaired, substandard, or special mention balance sheet credit risk, including in respect of housing loans for which there is a
provision by extent of arrears, and housing loans for which there is no provision by extent of arrears that are in arrears of 90
days or more.
(f) Credit risk whose credit rating on the report date corresponds with the credit rating for making new credit in accordance with
the Bank's policy.
(g) Including housing loans, extended to certain purchasing groups in the process of construction.
(h) The balance of commercial debts includes the balance of housing loans, amounting to NIS 1,014 million, which were extended
to purchasing groups in the process of construction.

61
Overall risk of credit to the public by sector of the economy (contd.)
Overall credit risk (a)
Credit losses (d)
Expenses Balance of
Total
Credit
performance
rating
Problematic
(e) Total1 Debts (b)
Problematic
(e) Impaired
in respect
of credit
losses
Net
accounting
write-offs
allowance
for credit
losses
)NIS millions(
In respect of activity
of borrowers abroad
Agriculture 128 126 2 127 72 2 2 2 1 (2)
Mining and
quarrying 77 77 - 38 29 - - - - -
Industry 8,295 7,965 330 7,041 4,638 330 98 (4) 27 (92)
Construction and real
estate (g) 13,503 12,866 637 12,973 9,783 637 434 10 79 (230)
Electricity and water 371 371 - 88 56 - - - - -
Commerce 7,818 7,786 32 7,729 5,123 32 31 (2) 85 (79)
Hotels, catering
services and food 1,577 1,549 28 1,577 1,441 28 24 (1) - (10)
Transport and storage 241 155 86 223 198 86 86 (2) 9 (31)
Communications and
computer services 2,093 2,093 - 1,782 677 - - (1) - (1)
Financial services 17,027 16,935 92 2,801 1,619 92 92 45 7 (68)
Business and other
services 5,630 5,579 51 5,560 4,613 51 2 (2) (1) (16)
Public and
community services 516 515 1 504 391 1 1 (39) 14 (19)
Total commercial 57,276 56,017 1,259 40,443 28,640 1,259 770 6 221 (548)
Private individuals -
housing loans 1,176 1,126 50 1,176 1,172 50 29 - 2 (16)
Private individuals -
other 531 509 22 522 409 22 22 - 8 (6)
Total public -
activity abroad 58,983 57,652 1,331 42,141 30,221 1,331 821 6 231 (570)
Banks abroad 22,269 22,269 - 10,119 8,170 - - (3) - (1)
Governments
abroad 11,667 11,667 - 480 191 - - - - -
Total activity
abroad 92,919 91,588 1,331 52,740 38,582 1,331 821 3 231 (571)
Total 472,153 462,389 9,764 383,614 275,839 9,728 4,215 199 531 (4,156)
1Of which:
31 December 2015
Debts (b) and off-balance sheets credit risk (except for derivatives) (c)
(a) Balance sheet credit risk and off-balance sheet credit risk, including in respect of derivative instruments, including debts,
bonds, securities borrowed or purchased under agreements to resell, assets in respect of derivative instruments, and credit risk
in off-balance sheet financial instruments as calculated for borrower debt limitations in the sum of NIS 38,581, 30,120, -,
6,169, 18,049 million, respectively.
(b) Credit risk to the public, credit to governments, deposits with banks and other debts, except for bonds and securities borrowed
or purchased under agreements to resell.
(c) Credit risk of off-balance sheet financial instruments as calculated for the purpose of single borrower debt limitations, except
in respect of derivative instruments.
(d) Including in respect of off-balance sheet credit instruments (shown in the balance sheet under "Other liabilities").
(e) Impaired, substandard, or special mention balance sheet credit risk, including in respect of housing loans for which there is a
provision by extent of arrears, and housing loans for which there is no provision by extent of arrears that are in arrears of 90
days or more.
(f) Credit risk whose credit rating on the report date corresponds with the credit rating for making new credit in accordance with
the Bank's policy.
(g) Including housing loans, extended to certain purchasing groups in the process of construction.

62
Group of borrowers
Limits on indebtedness of a borrower or group of borrowers
1. As at 31 March 2016, the Group had no exposure to a group of borrowers whose indebtedness exceeds
15% of the Bank's capital (as defined in Proper Conduct of Banking Business Directive No. 313).
2. As at 31 March 2016, the Group had no credit exposure to large borrowers, groups of borrowers and
banking groups of borrowers whose debt exceeds 10% of the Bank's capital. The regulatory limit is 120%
of the Bank's capital.

63
Exposure to foreign countries
Part A – Information on total exposure to foreign countries and on exposure to countries whose total
individual exposure exceeds 1% of total assets or exceeds 20% of total equity for the purpose of calculating
capital ratios, whichever the lower.
Balance sheet exposure (a)
To
governments
(c) To banks To others
Balance sheet
exposure before
deducting local
liabilities
Deduction for
local liabilities
Balance sheet
exposure net
after deducting
local liabilities
Country
United States 13,181 3,532 8,698 22,003 10,986 11,017
United Kingdom - 3,488 3,620 6,762 1,946 4,816
France 558 549 965 - - -
Switzerland - 463 959 561 86 475
Germany - 1,490 967 - - -
Others 397 3,777 4,879 1,169 605 564
Total exposure to foreign
countries 14,136 13,299 20,088 30,495 13,623 16,872
Total exposure to LDC
countries 234 916 564 1,157 605 552
Total exposure to GIIPS
countries (d) 102 14 243 - - -
31 March 2016
Cross-border balance sheet exposure
Balance sheet exposure of foreign offices of the
banking corporation to local residents
)NIS millions(
31 March 2016
Balance sheet exposure (a) Off-balance sheet exposure (a) (b)
Total Of which:
Of which:
problematic
balance
sheet
exposure
Problematic
balance sheet
credit risk
balance of
impaired
debts
off-balance
sheet credit
risk
Up to
one year
Over
one year
Country
United States 36,428 681 287 6,294 - 11,790 13,621
United Kingdom 11,924 237 233 3,621 - 2,952 4,156
France 2,072 18 17 1,097 - 972 1,100
Switzerland 1,897 - - 401 - 917 505
Germany 2,457 - - 194 - 1,256 1,201
Others 9,617 258 249 2,467 - 4,510 4,543
Total exposure to foreign
countries 64,395 1,194 786 14,074 - 22,397 25,126
Total exposure to LDC
countries 2,266 199 189 1,794 - 388 1,326
Total off-
balance
sheet
exposure
)NIS millions(
Repayment period
Cross-border balance sheet
exposure
(c (
(c (
(c (
(c (
(c
(c
(c
(c
(c (
(c (
(c (
(c (
(c
(c
(c
(c
(a) Balance sheet and off-balance sheet risk, problem commercial credit risk and impaired debts are stated before the effect of a
credit loss allowance and before the effect of collateral permitted for deduction for the purpose of indebtedness of a borrower and
a group of borrowers. Not including off-balance sheet risk components.
(b) Credit risk in off-balance sheet financial derivatives as computed for the purpose of the indebtedness of a borrower.
(c) Including governments, formal institutions and central banks.
(d) Exposure to GIIPS includes the countries: Portugal, Ireland, Italy, Greece and Spain.
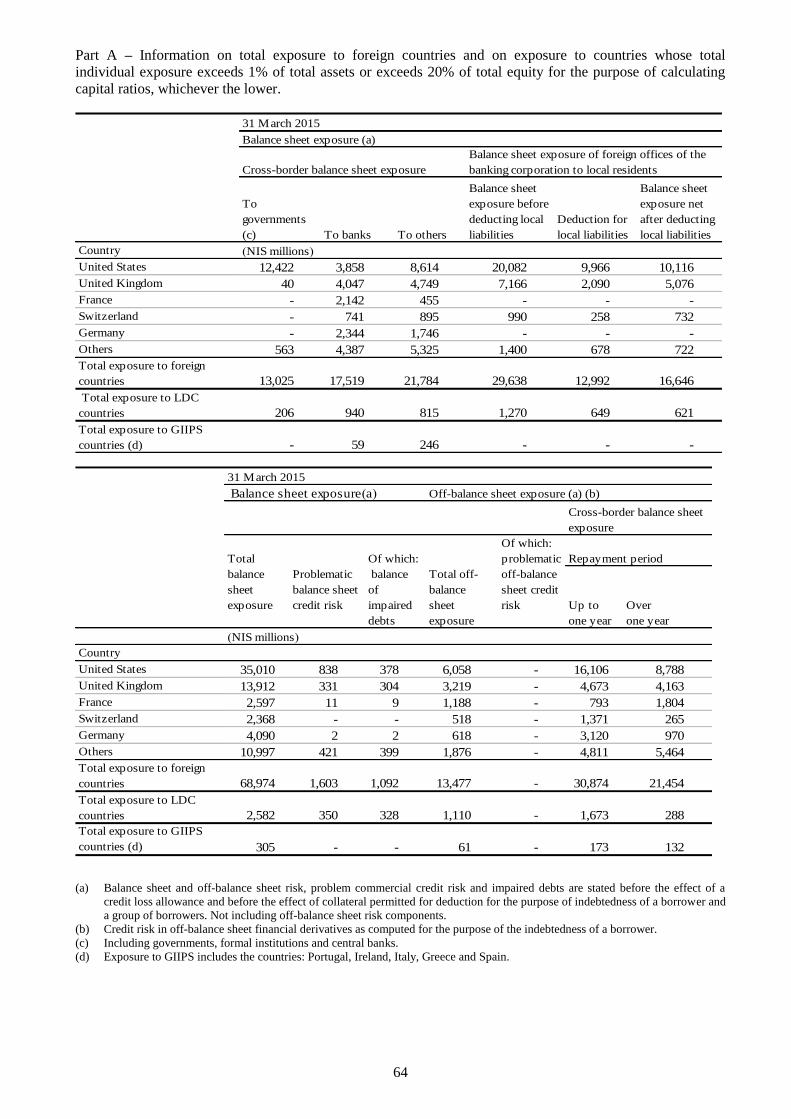
64
Part A – Information on total exposure to foreign countries and on exposure to countries whose total
individual exposure exceeds 1% of total assets or exceeds 20% of total equity for the purpose of calculating
capital ratios, whichever the lower.
Balance sheet exposure (a)
To
governments
(c) To banks To others
Balance sheet
exposure before
deducting local
liabilities
Deduction for
local liabilities
Balance sheet
exposure net
after deducting
local liabilities
Country )NIS millions(
United States 12,422 3,858 8,614 20,082 9,966 10,116
United Kingdom 40 4,047 4,749 7,166 2,090 5,076
France - 2,142 455 - - -
Switzerland - 741 895 990 258 732
Germany - 2,344 1,746 - - -
Others 563 4,387 5,325 1,400 678 722
Total exposure to foreign
countries 13,025 17,519 21,784 29,638 12,992 16,646
Total exposure to LDC
countries 206 940 815 1,270 649 621
Total exposure to GIIPS
countries (d) - 59 246 - - -
31 March 2015
Cross-border balance sheet exposure
Balance sheet exposure of foreign offices of the
banking corporation to local residents
(c (
(c (
(c (
(c (
(c)
(c)
(c)
(c)
(c (
(c (
(c (
(c (
(c)
(c)
(c)
(c)
31 March 2015
Balance sheet exposure)a( Off-balance sheet exposure (a) (b)
Total Of which:
Of which:
problematic
balance
sheet
exposure
Problematic
balance sheet
credit risk
balance
of
impaired
debts
Total off-
balance
sheet
exposure
off-balance
sheet credit
risk Up to
one year
Over
one year
Country
United States 35,010 838 378 6,058 - 16,106 8,788
United Kingdom 13,912 331 304 3,219 - 4,673 4,163
France 2,597 11 9 1,188 - 793 1,804
Switzerland 2,368 - - 518 - 1,371 265
Germany 4,090 2 2 618 - 3,120 970
Others 10,997 421 399 1,876 - 4,811 5,464
Total exposure to foreign
countries 68,974 1,603 1,092 13,477 - 30,874 21,454
Total exposure to LDC
countries 2,582 350 328 1,110 - 1,673 288
Total exposure to GIIPS
countries (d) 305 - - 61 - 173 132
)NIS millions(
Cross-border balance sheet
exposure
Repayment period
(c (
(c (
(c (
(c (
(c
(c
(c
(c
(c (
(c (
(c (
(c (
(c
(c
(c
(c
(c (
(c (
(c (
(c (
(c
(c
(c
(c
(c (
(c (
(c (
(c (
(c
(c
(c
(c
(c (
(c (
(c (
(c (
(c
(c
(c
(c
(c (
(c (
(c (
(c (
(c
(c
(c
(c
(a) Balance sheet and off-balance sheet risk, problem commercial credit risk and impaired debts are stated before the effect of a
credit loss allowance and before the effect of collateral permitted for deduction for the purpose of indebtedness of a borrower and
a group of borrowers. Not including off-balance sheet risk components.
(b) Credit risk in off-balance sheet financial derivatives as computed for the purpose of the indebtedness of a borrower.
(c) Including governments, formal institutions and central banks.
(d) Exposure to GIIPS includes the countries: Portugal, Ireland, Italy, Greece and Spain.

65
Part A – Information on total exposure to foreign countries and on exposure to countries whose total
individual exposure exceeds 1% of total assets or exceeds 20% of total equity for purposes of calculating
capital ratios, whichever the lower (cont'd).
Balance sheet exposure (a)
To
governments
(c) To banks To others
Balance sheet
exposure before
deducting local
liabilities
Deduction for
local liabilities
Balance sheet
exposure net
after deducting
local liabilities
Country
United States 9,652 2,577 10,748 22,020 11,310 10,710
United Kingdom 39 2,942 3,022 7,015 2,143 4,872
France 552 635 942 - - -
Switzerland - 334 1,194 535 101 434
Germany - 1,519 1,583 - - -
Others 389 4,001 5,218 1,272 651 621
Total exposure to foreign
countries 10,632 12,008 22,707 30,842 14,205 16,637
Total exposure to LDC
countries 212 943 719 1,180 647 533
Total exposure to GIIPS
countries (d) 97 57 408 - - -
Cross-border balance sheet exposure
Balance sheet exposure of foreign offices of the
banking corporation to local residents
31 December 2015
)NIS millions(
(c (
(c (
(c (
(c (
(c)
(c)
(c)
(c)
31 December 2015
Balance sheet exposure)a( Off-balance sheet exposure (a) (b)
Of which:
Total
balance
sheet
exposure
Problematic
balance sheet
credit risk
Of which:
balance of
impaired
debts
Total off-
balance sheet
exposure
problematic
off-balance
sheet credit
risk
Up to
one year
Over
one year
Country
United States 33,687 733 299 6,153 - 6,941 16,036
United Kingdom 10,875 247 229 3,846 - 1,717 4,286
France 2,129 10 8 1,126 - 872 1,257
Switzerland 1,962 - - 412 - 962 566
Germany 3,102 - - 259 - 1,882 1,220
Others 10,229 294 282 3,068 - 2,389 7,219
Total exposure to foreign
countries 61,984 1,284 818 14,864 - 14,763 30,584
Cross-border balance sheet
exposure
Repayment period
)NIS millions(
(c (
(c (
(c (
(c
(c
(c
(c (
(c (
(c (
(c
(c
(c
(c (
(c (
(c (
(c
(c
(c
(c (
(c (
(c (
(c
(c
(c
(c (
(c (
(c (
(c
(c
(c
(c (
(c (
(c (
(c
(c
(c
(a) Balance sheet and off-balance sheet risk, problem commercial credit risk and impaired debts are stated before the effect of a
credit loss allowance and before the effect of collateral permitted for deduction for the purpose of indebtedness of a borrower and
a group of borrowers. Not including off-balance sheet risk components.
(b) Credit risk in off-balance sheet financial derivatives as computed for the purpose of the indebtedness of a borrower.
(c) Including governments, formal institutions and central banks.
(d) Exposure to GIIPS includes the countries: Portugal, Ireland, Italy, Greece and Spain.
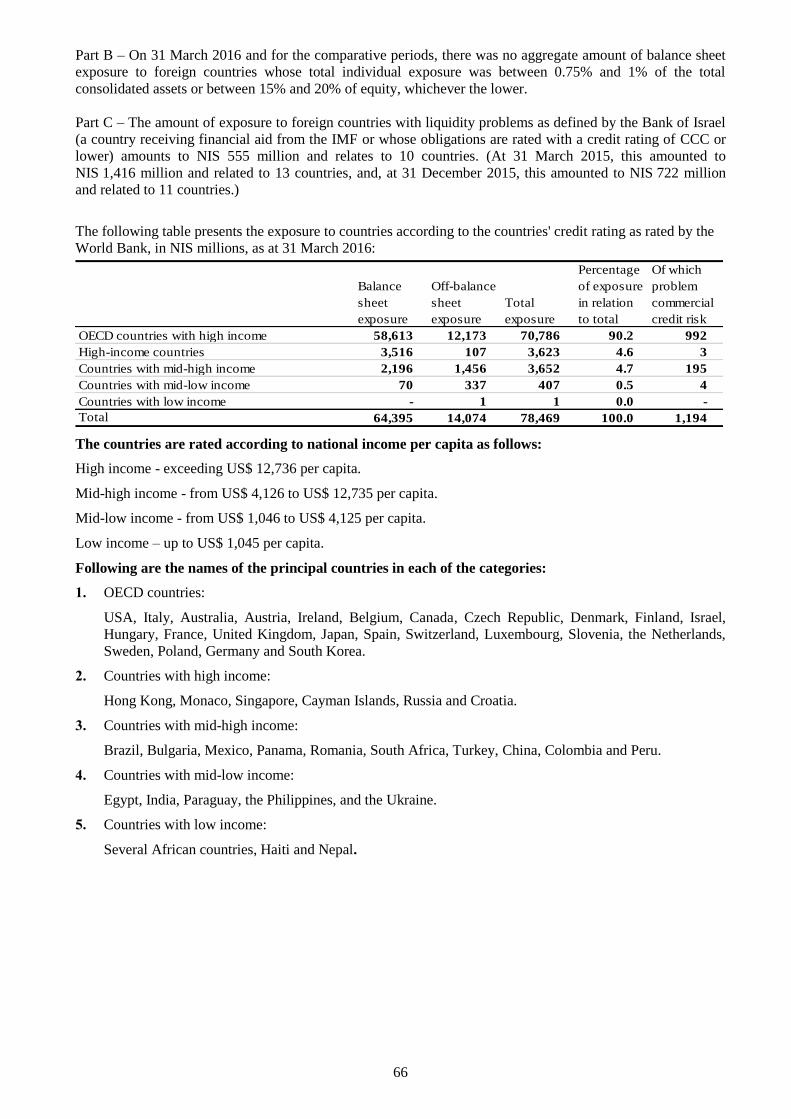
66
Part B – On 31 March 2016 and for the comparative periods, there was no aggregate amount of balance sheet
exposure to foreign countries whose total individual exposure was between 0.75% and 1% of the total
consolidated assets or between 15% and 20% of equity, whichever the lower.
Part C – The amount of exposure to foreign countries with liquidity problems as defined by the Bank of Israel
(a country receiving financial aid from the IMF or whose obligations are rated with a credit rating of CCC or
lower) amounts to NIS 555 million and relates to 10 countries. (At 31 March 2015, this amounted to
NIS 1,416 million and related to 13 countries, and, at 31 December 2015, this amounted to NIS 722 million
and related to 11 countries.)
The following table presents the exposure to countries according to the countries' credit rating as rated by the
World Bank, in NIS millions, as at 31 March 2016:
Balance
sheet
exposure
Off-balance
sheet
exposure
Total
exposure
Percentage
of exposure
in relation
to total
Of which
problem
commercial
credit risk
OECD countries with high income 58,613 12,173 70,786 90.2 992
High-income countries 3,516 107 3,623 4.6 3
Countries with mid-high income 2,196 1,456 3,652 4.7 195
Countries with mid-low income 70 337 407 0.5 4
Countries with low income - 1 1 0.0 -
Total 64,395 14,074 78,469 100.0 1,194
The countries are rated according to national income per capita as follows:
High income - exceeding US$ 12,736 per capita.
Mid-high income - from US$ 4,126 to US$ 12,735 per capita.
Mid-low income - from US$ 1,046 to US$ 4,125 per capita.
Low income – up to US$ 1,045 per capita.
Following are the names of the principal countries in each of the categories:
1. OECD countries:
USA, Italy, Australia, Austria, Ireland, Belgium, Canada, Czech Republic, Denmark, Finland, Israel,
Hungary, France, United Kingdom, Japan, Spain, Switzerland, Luxembourg, Slovenia, the Netherlands,
Sweden, Poland, Germany and South Korea.
2. Countries with high income:
Hong Kong, Monaco, Singapore, Cayman Islands, Russia and Croatia.
3. Countries with mid-high income:
Brazil, Bulgaria, Mexico, Panama, Romania, South Africa, Turkey, China, Colombia and Peru.
4. Countries with mid-low income:
Egypt, India, Paraguay, the Philippines, and the Ukraine.
5. Countries with low income:
Several African countries, Haiti and Nepal.

67
Credit exposure to foreign financial institutions
Credit exposure to foreign financial institutions refers to commercial banks, bank holding companies,
investment banks, insurance companies and institutional bodies.
The exposure includes mainly deposits in overseas banks for short periods of up to one week, and debentures,
usually for a period of up to five years. The Bank closely monitors the condition of banks worldwide, and
makes frequent analyses of their financial stability. The Bank maintains a shortlist of quality banks with which
the Bank and its overseas subsidiaries make deposits.
The following table sets out the credit exposure to overseas financial institutions(a)
:
As at 31 March 2016
Balance sheet
credit risk (b)
Current off-
balance sheet
credit risk (c) Current credit exposure
NIS millions
Current credit exposure to foreign
financial institutions (d)
AAA to AA- 14,346 2,334 16,680
A+ to A- 2,743 100 2,843
BBB+ to BBB- 301 387 688
BB+ to B- 3 2 5
Below B- 33 4 37
Unrated 252 1 253
Total current credit exposure to foreign financial
institutions 17,678 2,828 20,506
Problem debt balances - - -
Balance sheet
credit risk (b) Securities (c) Current credit exposure
NIS millions
Current credit exposure to foreign
financial institutions (d)
AAA to AA- 13,048 2,789 15,837
A+ to A- 2,323 54 2,377
BBB+ to BBB- 440 241 681
BB+ to B- 1 2 3
Below B- 35 - 35
Unrated 173 8 181
Total current credit exposure to foreign financial
institutions 16,020 3,094 19,114
Problem debt balances - - -
As at 31 December 2015
(a) Overseas financial institutions include banks, investment banks, insurance companies and institutional bodies.
(b) Deposits in banks, credit to the public, securities that were borrowed or purchased in the context of buy-back (resale) agreements
and other assets in respect of derivatives (fair value of derivatives) and investments in debentures including subordinated bank
debentures amounting to NIS 495 million as at 31 March 2016 and NIS 595 million as at 31 December 2015.
(c) Mainly guarantees and undertakings for the provision of credit (excluding off-balance sheet derivatives).
(d) The bank only uses the rating of Moody’s and S&P credit rating agencies to rate the foreign financial institutions to which there is
a credit exposure.
Notes:
Credit exposures do not include investments in asset-backed securities. (See Note 5).
Some of the banks have received government support of various types, including direct investment in the Bank's capital, government
guarantees of certain asset portfolios of the banks, guarantees enabling the banks to raise sources of financing, etc.
For further information regarding the composition of the credit exposure in respect of derivatives vis-à-vis banks and broker/dealers
(local and overseas), see Note 11 to the financial statements.
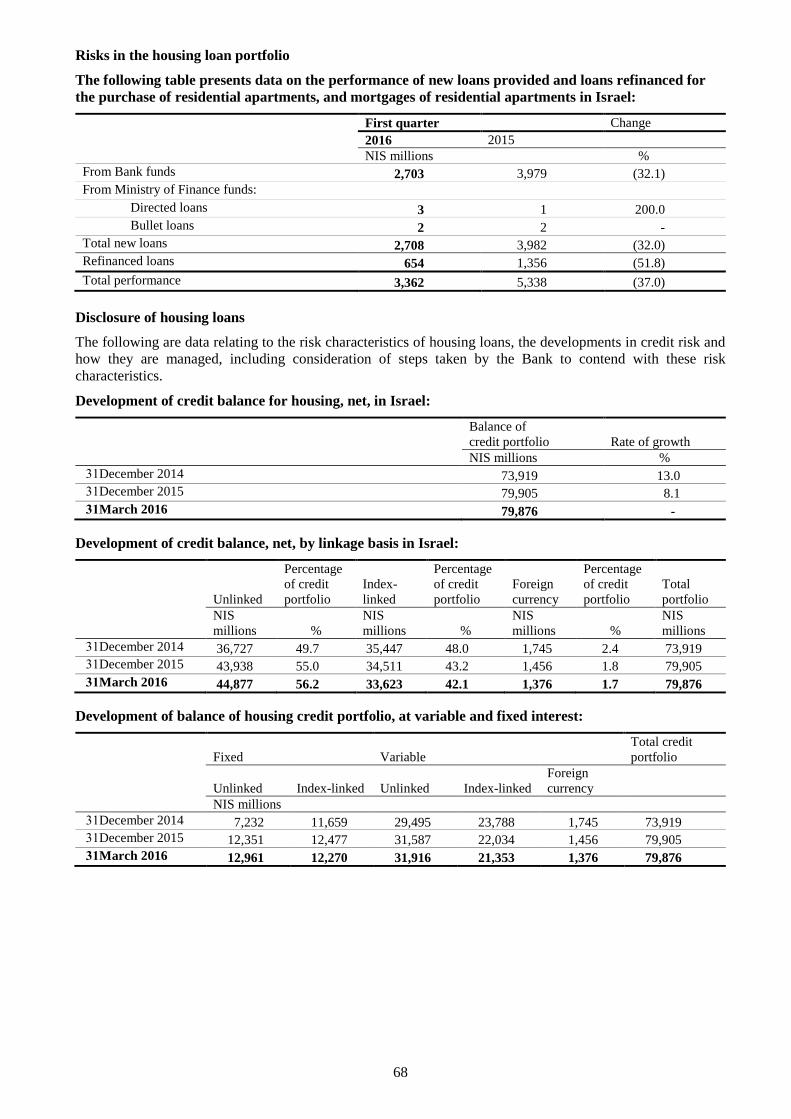
68
Risks in the housing loan portfolio
The following table presents data on the performance of new loans provided and loans refinanced for
the purchase of residential apartments, and mortgages of residential apartments in Israel:
First quarter Change
2016 2015
NIS millions %
From Bank funds 2,703 3,979 (32.1)
From Ministry of Finance funds:
Directed loans 3 1 200.0
Bullet loans 2 2 -
Total new loans 2,708 3,982 (32.0)
Refinanced loans 654 1,356 (51.8)
Total performance 3,362 5,338 (37.0)
Disclosure of housing loans
The following are data relating to the risk characteristics of housing loans, the developments in credit risk and
how they are managed, including consideration of steps taken by the Bank to contend with these risk
characteristics.
Development of credit balance for housing, net, in Israel:
Balance of
credit portfolio Rate of growth
NIS millions %
12 December 2014 73,919 13.0
12 December 2015 79,905 8.1
31 March 2016 79,876 -
Development of credit balance, net, by linkage basis in Israel:
Unlinked
Percentage
of credit
portfolio
Index-
linked
Percentage
of credit
portfolio
Foreign
currency
Percentage
of credit
portfolio
Total
portfolio
NIS
millions %
NIS
millions %
NIS
millions %
NIS
millions
12 December 2014 36,727 49.7 35,447 48.0 1,745 2.4 73,919
12 December 2015 43,938 55.0 34,511 43.2 1,456 1.8 79,905
31 March 2016 44,877 56.2 33,623 42.1 1,376 1.7 79,876
Development of balance of housing credit portfolio, at variable and fixed interest:
Fixed Variable
Total credit
portfolio
Unlinked Index-linked Unlinked Index-linked
Foreign
currency
NIS millions
12 December 2014 7,232 11,659 29,495 23,788 1,745 73,919
12 December 2015 12,351 12,477 31,587 22,034 1,456 79,905
31 March 2016 12,961 12,270 31,916 21,353 1,376 79,876

69
Development of new housing credit balance by interest track in Israel:
The development of new credit according to variable and fixed interest tracks (a variable interest loan is a loan
where the interest that it bears is likely to change over the life of the loan) is as follows:
2016 2015 2014
First
quarter
Fourth
quarter
Third
quarter
Second
quarter
First
quarter
Annual
average
Percentage of loans granted
%
Fixed – index-linked 19.4 9.7 19.9 19.8 23.0 22.9
Variable every 5 years and above –
index-linked 13.9 15.7 13.5 11.6 13.1 17.2
Variable up to 5 years – index-linked 1.2 1.3 1.5 1.0 1.2 2.0
Fixed – unlinked 29.0 32.8 30.5 35.8 28.9 21.5
Variable every 5 years and above –
unlinked 6.8 6.8 5.4 5.5 6.6 6.6
Variable up to 5 years – unlinked 29.4 33.3 28.8 25.8 26.6 28.5
Variable – foreign currency 0.3 0.4 0.4 0.5 0.6 1.3
The percentage of new credit extended by the Bank in variable interest housing loans during the first quarter of
2016 stood at 52%, compared with 49% in 2015. The figures relate to all of the various interest paths and
linkage segments, including loans in which the interest varies each period of five years and more. Excluding
loans (which the directive of the Banking Supervision Department excludes from the definition of variable
interest), the percentage of housing credit at variable interest stood at 31% during the first quarter of 2016,
compared with 30% in 2015.
The balance of the past due portfolio in housing loans more than 90 days in arrears is as follows, in
Israel:
Balance of recorded
debt Amount in arrears
Percentage of
amount in arrears
NIS millions %
31 December 2014 74,410 800 1.1
31 December 2015 80,402 768 1.0
31 March 2016 80,639 750 0.9
The allowance for credit losses as at 31 March 2016, including the collective allowance on housing loans
(hereinafter: "the overall allowance") was NIS 492 million, representing 0.62% of the housing credit balance,
compared with the balance of the allowance as at 31 December 2015, amounting to NIS 497 million,
representing 0.62% of the housing credit balance.
Data relating to new housing credit in Israel:
In the first quarter of 2016, the Bank extended new housing loans amounting to NIS 2.7 billion from the
Bank's funds.
Development of the rate of financing, in new credit, above 60%, in Israel:
The development of new credit extended by Leumi Mortgage Bank at a rate of financing higher than 60% is as
follows: (The rate of financing is the ratio between the rate of credit approved for a borrower, (even if all or
part thereof has not yet been actually extended) and the value of the asset mortgaged, at the time of extending
the credit facility.)
2016 2015 2014
1st
quarter
4th
quarter
3rd
quarter
2nd
quarter
1st
quarter
Annual
average
Rate of financing %
Between 60% and 70% (inclusive) 15.5 18.6 18.6 18.8 19.2 18.5
Between 70% and 80% (inclusive) 13.5 14.6 17.1 18.1 16.5 14.5
Above 80% 0.2 0.4 0.7 1.0 2.4 0.4

70
Development of the rate of financing, Balance of credit portfolio in Israel
The average rate of financing of the balance of the credit portfolio as of 31 March 2016 stands at 47.8%,
compared with 47.1% in 2015.
Development of new credit, in which the repayment ratio is lower than 2.5 in Israel:
Loans made in `the first quarter of 2016 in which the repayment ratio is lower that 2.5 to income-earners of
NIS 10,000 and below, at the date of approval of the credit, stood at 0.19% of the total new extensions of new
credit.
This calculation complies with the Bank of Israel directives for the purposes of reporting pursuant to Proper
Conduct of Banking Business Management Regulation no. 876.
Development of new credit, in which the repayment dates extend beyond 25 years:
The percentage of the new credit of housing loans in the first quarter of 2016, in which repayment dates
according to loan contracts longer than 25 years, stood on average at 36% of the total of new credit extended,
compared to 30% in 2015.
Developments in credit risks
Against a background of increasing demand for housing units, both for residential purposes and for the
purpose of investment, and against a background of a rising trend in housing prices, in addition to the low
interest environment, the extent of housing credit has increased in recent years.
As a result of these developments, and as part of the risk management, closer adherence to the management
restrictions continued in 2016, mainly in the following characteristics: the rate of financing, monthly
repayment capacity, credit rating according to the Bank's internal statistical model. In this context, the features
of transactions in respect of apartments as part of the "Affordable Housing" program were examined,
(including the expected implications of the directives of the Bank of Israel and the Ministries of Finance and
Housing on this subject).
The average loan extended by the Bank in the first quarter of 2016 was NIS 578 thousand, compared with
NIS 623 thousand in 2015 and NIS 585 thousand in 2014.
71
Market Risk
This chapter is written in greater detail in the 2015 Annual Report (pages 131 to 140) and in the Report on Risks. The chapter below
should therefore read in conjunction with those reports.
Market risk is defined as the risk of a loss in balance sheet and off-balance sheet positions arising from a
change in the fair value of a financial instrument as a result of a change in market conditions (a change in price
levels in various markets, fluctuations in interest rates, exchange rate, inflation, the prices of shares and
commodities and other economic indices). Exposure to market risks is reflected in the business results, the fair
value of assets and liabilities, shareholders’ equity and cash flows.
For further information, see Report on Risks on the Bank's website.
The Bank applies the directives of the Supervisor of Banks on the subject of the Group's market and liquidity
risk management, pursuant to which basic principles for the method of risk management and control are
provided, including the responsibility of the management and the Board of Directors, the definition of the
means of control and the tools for measuring the risks and the means of control and supervision of these risks,
implementing corporate governance which includes the three "lines of defense".
Market risk management policy
Market risk management policy reflects the Group's market risk strategy. This is alongside the existing
procedures for detecting, measuring monitoring developing and controlling the market risks. The policy for
managing market risks is intended, on the one hand, to support the achievement of business goals by assessing
the risks and the prospects that can result from exposure to risks, in comparison with the forecast profit from
them, and on the other hand, to reduce the level of risk deriving from the Bank's ongoing activity, including
maintaining a high liquidity level.
The policy represents an important tool in defining the Bank's risk appetite in the nostro field, dealing rooms
and market exposure, in the whole Bank Leumi Group. The policy defines the corporate governance, the
allocation of organizational responsibility and escalation mechanisms.
Exposures to market risks are managed on a routine basis at Group level. Overseas subsidiaries determine
policy for the management of market risks in compliance with the Group policy and risk frameworks approved
therein. Information on the actual state of the exposures in accordance with the frameworks determined is
received from subsidiaries and taken into account in the overall management of the exposures in the Group.
Management of market risks is handled by two main risk centers – the banking portfolio and the trading
portfolio. Definition of the trading portfolio is derived from the Basel directives and includes the securities
trading portfolio of the Bank and derivative transactions in trading activity. The banking portfolio includes
transactions that are not included in the trading portfolio.
The Bank has implemented United States generally accepted accounting principles regarding employee rights,
as stipulated by the Bank of Israel, chief of which is a change in the rate of financing of the pension liabilities.
Market risk management in respect of the commitment to employees is executed partly within the framework
of the banking portfolio and partly managed separately and independently as a part of the "plan assets", which
are intended to carry a yield over the long-term, with the aim of servicing the liability value. The pension
liability is the flow which is affected by changes in demographic parameters, such as inflation, the pension
determining salary, etc. The actuarial commitment for employees has a long duration, and is significantly
affected by changes in the capitalization interest. The impact of these changes on the Bank's capital is material.
On the other hand, the investment in the "plan assets" is intended to service some of this commitment, and it is
effected by investing in diverse and dispersed assets, such as shares and debt assets. The investment is subject
to regulatory restrictions and limitations set by the funds.
For further information regarding activity according to portfolio, see Report on Risks on the Bank's website.
Market risk management policy
Market risk management reflects the Group's market risk strategy. This is alongside the existing procedures for
detecting, measuring monitoring developing and controlling the market risks. The policy for managing market
risks is intended, on the one hand, to support the achievement of business goals by assessing the risks and the
prospects that can result from exposure to risks, in comparison with the forecast profit from them, and on the
other hand, to reduce the level of risk deriving from the Bank's ongoing activity, including maintaining a high
liquidity level. All this is after taking into account the volume of activity, limitations, and the costs of hedging
activity, the changes occurring in the business environment in Israel and throughout the world, directives and
requirements of the Bank of Israel, and developments occurring worldwide with regard to measurements and
methods of managing risks and adapting them to the needs of the Group and the Bank.
72
The policy represents an important tool in defining the Bank's risk appetite in the nostro field, dealing rooms
and market exposure, in the whole Bank Leumi Group. The policy defines the corporate governance, the
allocation of organizational responsibility and escalation mechanisms. As part of the market risk management
policy, restrictions of the Board of Directors have been determined for every material market risk factor. In
addition, restrictions have been set at the level of the Chief Risk Officer and additional restrictions which
complement these restrictions. These restrictions are intended to limit the damage that could be incurred as a
result of unforeseen changes in the existing various risk factors in the markets, such as, interest rates, inflation,
exchange rates, tradable credit margins and share prices.
Management of market risks is handled by two main risk centers – the banking portfolio and the trading
portfolio. Definition of the trading portfolio is derived from the Basel directives and includes the securities
trading portfolio of the Bank and derivative transactions in trading activity. The banking portfolio includes
transactions that are not included in the trading portfolio.
The Bank has implemented United States generally accepted accounting principles regarding employee rights,
as stipulated by the Bank of Israel, chief of which is a change in the rate of financing of the pension liabilities.
Market risk management in respect of the commitment to employees is executed partly within the framework
of the banking portfolio and partly managed separately and independently as a part of the "plan assets", which
are intended to carry a yield over the long-term, with the aim of servicing the liability value. The pension
liability is the flow which is affected by changes in demographic parameters, such as inflation, the pension
determining salary, etc. The actuarial commitment for employees has a long duration, and is significantly
affected by changes in the capitalization interest. The impact of these changes on the Bank's capital is material.
On the other hand, the investment in the "plan assets" is intended to service some of this commitment, and it is
effected by investing in diverse and dispersed assets, such as shares and debt assets. The investment is subject
to regulatory restrictions and limitations set by the funds.
For further information regarding activity according to portfolio, see Report on Risks on the Bank's website.
A. Interest exposure
Interest risk is the risk of a loss as a result of changes in risk-free interest rates of credit in the various
currencies, due to differences between the dates of changes in interest rates or the repayment date of the
assets and liabilities in each of the linkage segments, whichever is earlier.
The interest exposure policy restricts the extent of exposure to possible changes in interest on the
potential erosion of economic value1 and financing profit for the coming year. Exposure of the profit to
interest is influenced by the activity in derivative transactions and the trading security portfolio.
The interest risk is actually measured and managed on the basis of various behavioral assumptions with
regard to the repayment times of the assets and liabilities. In accordance with past experience the Bank
considers part of the current account balances as a long-term liability. In addition, there are assumptions
relating to early repayments in mortgages. These assessments are crucial in interest risk management,
due to the significant increase in balances in recent years.
The measurement of exposure to changes in interest is carried out for both an increase and a decrease in
interest rates in each linkage segment. This measurement is intended to examine the sensitivity of the
existing asset and liability structure to changes in interest, and therefore, the computation is made
without altering the asset and liability structure. In the event that interest rates are significantly negative,
the structure of the assets and liabilities will essentially change.
With the implementation of the standard on employee rights and the capitalization of the actuarial
commitment to employees according to market interest rates, the Bank's capital sensitivity to changes in
interest increased. In order to limit the volatility in capital, Leumi hedges part of this exposure.
In addition during April 2016, limits on exposure to interest were approved in the Board of Directors,
reflecting the implications of the implementation of the employee rights standard, giving emphasis to
the sensitivity of capital adequacy to interest.
1 The economic value of the capital is defined as the difference between the current value of assets and liabilities. In calculating
present value, cash flows are deducted from the risk-free credit yield curve and the foreign currency LIBOR flows.

73
The summary of exposures to unexpected changes in interest at Group level (before tax and in NIS
millions)* - the potential change in economic value as a result of a scenario - is as follows:
31 March 2016 31 March 2015 31 December 2015
Scenario
Increase
of 1%
Decrease
of 1%
Change
of 0.1%
Increase
of 1%
Decrease
of 1%
Change
of 0.1%
Increase
of 1%
Decrease
of 1%
Change
of 0.1%
In Israeli
currency:
Banking portfolio (460) 591 (51) (424) 437 (42) (641) 708 (67)
Trading portfolio (56) 45 (6) (121) 125 (12) (87) 111 (7)
In foreign
currency:
Banking portfolio 45 (90) 5 4 (94) - (32) (74) (3)
Trading portfolio (79) (18) (2) (46) 36 (5) 7 (33) 2
Potential erosion in annual profit
31 March 2016 31 March 2015 31 December 2015
Actual
Total
501 62 379
* The extent of exposure does not take into account the existence of an interest rate floor of 0% on the deposits. The further the
interest falls and approximates to zero, the higher the impairment in financial margin – as all of the interest reduction by the Bank
of Israel is reflected only in the lowering of the interest rate on the credit and therefore, in the reduction of margins and the erosion
of profits in the Bank.
The exposure of capital to an immediate increase/decrease in interest (before the effect of tax) is as
follows:
Exposure in Israeli currency Exposure in foreign currency
31 March 2016
Increase
of 1%
Decrease
of 1%
Change of
0.1%
Decrease
of 1%
Increase
of 1%
Change of
0.1%
Exposure of capital to an immediate
increase/decrease in interest* 868 (1,218) 104 (445) 320 (39)
31 December 2015
Increase
of 1%
Decrease
of 1%
Change of
0.1%
Decrease
of 1%
Increase
of 1%
Change of
0.1%
Exposure of capital to an immediate
increase/decrease in interest* 1,472 (1,895) 145 (292) 182 (25)
* This measurement includes the exposure to an immediate change in the interest of the nostro portfolios which have been
remeasured at market value and the actuarial commitment to employees. This does not include the effect of the sensitivity of the
plan assets to changes in interest which at 31 March 2016 is estimated to be a decrease in the value of the assets amounting to
NIS 100 million (NIS 120 million on 31 December 2015) in the scenario of a 1% increase in interest. In addition, the measurement
does not include the effects of the transitional provisions of the standard on employee rights, according to which the capital
adequacy ratio is computed.
For further information, see the Report on Risks on the Bank's website.

74
Sensitivity of the fair value of assets and liabilities to interest
The effect of potential changes in interest rates on the fair value of the financial instruments of the Bank and
its consolidated subsidiaries, except for non-monetary items, according to accounting principles, is as follows:
The net fair value of financial instruments, before the effect of changes in interest rates:
31 March 2016
Unlinked CPI-linked Dollar Euro Others Total
NIS millions
Financial assets 262,457 51,807 67,221 8,239 9,312 399,036
Amounts receivable in respect of
derivative financial and off-balance sheet
instruments 276,002 7,255 204,098 54,114 25,567 567,036
Financial liabilities (a) 215,246 62,121 86,736 13,462 9,254 386,819
Amounts payable in respect of derivative
financial and off-balance sheet
instruments 298,419 8,363 185,357 49,606 26,376 568,121
Net fair value of financial instruments 24,794 (11,422) (774) (715) (751) 11,132
Israeli currency
Foreign currency, including Israeli
currency linked to foreign currency
31 March 2015
Unlinked CPI-linked Dollar Euro Others Total
NIS millions
Financial assets 225,938 54,617 68,019 7,115 9,754 365,443
Amounts receivable in respect of
derivative financial and off-balance sheet
instruments 322,340 7,810 207,739 61,911 39,417 639,217
Financial liabilities 191,732 46,390 82,286 14,958 9,029 344,395
Amounts payable in respect of derivative
financial and off-balance sheet
instruments 339,800 9,423 194,033 54,153 40,576 637,985
Net fair value of financial instruments 16,746 6,614 (561) (85) (434) 22,280
Israeli currency
Foreign currency, including Israeli
currency linked to foreign currency
31 December 2015
Unlinked CPI-linked Dollar Euro Others Total
NIS millions
Financial assets 257,444 52,070 64,294 7,598 9,709 391,115
Amounts receivable in respect of
derivative financial and off-balance sheet
instruments 258,434 7,256 193,030 57,823 24,915 541,458
Financial liabilities (a) 211,447 59,362 87,666 13,889 9,199 381,563
Amounts payable in respect of derivative
financial and off-balance sheet
instruments283,626 8,796 170,470 52,076 26,125 541,093
Net fair value of financial instruments 20,805 (8,832) (812) (544) (700) 9,917
Israeli currency
Foreign currency, including Israeli
currency linked to foreign currency
(a) Including the fair value of the actuarial liabilities to employees and does not include the value of the plan's assets.
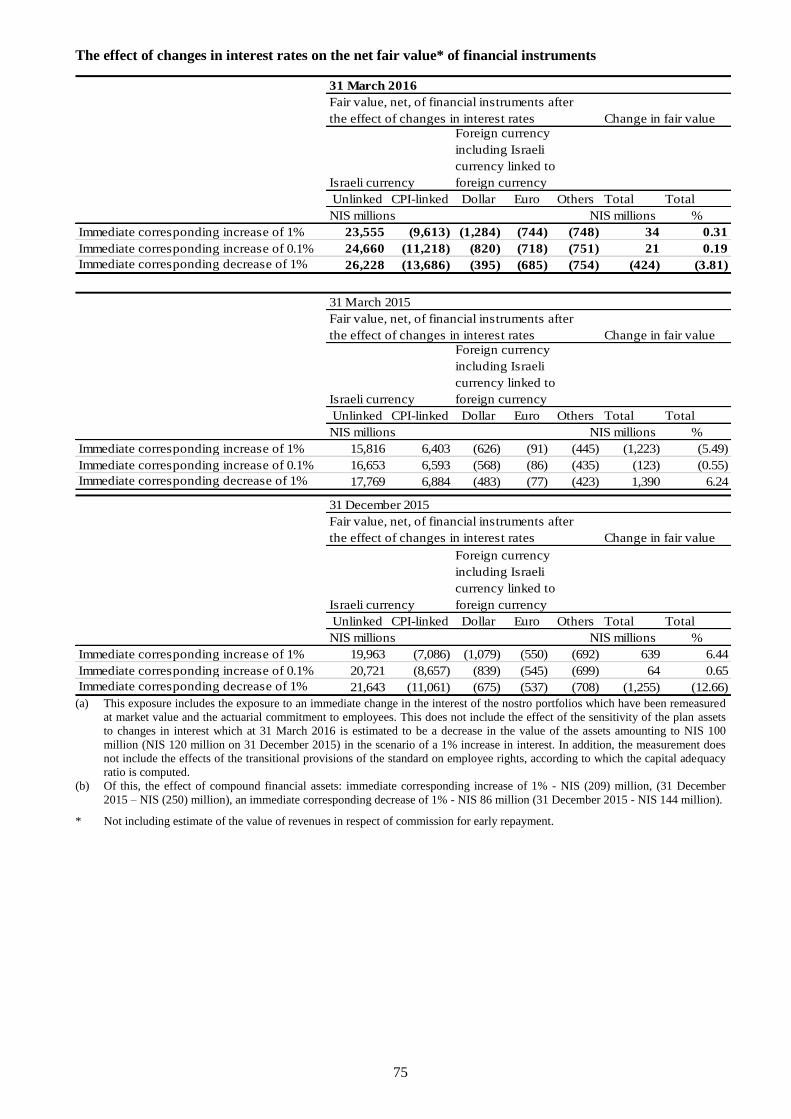
75
The effect of changes in interest rates on the net fair value* of financial instruments
31 March 2016
Change in fair value
Israeli currency
Unlinked CPI-linked Dollar Euro Others Total Total
NIS millions NIS millions %
Immediate corresponding increase of 1% 23,555 (9,613) (1,284) (744) (748) 34 0.31
Immediate corresponding increase of 0.1% 24,660 (11,218) (820) (718) (751) 21 0.19
Immediate corresponding decrease of 1% 26,228 (13,686) (395) (685) (754) (424) (3.81)
Fair value, net, of financial instruments after
the effect of changes in interest rates
Foreign currency
including Israeli
currency linked to
foreign currency
31 March 2015
Change in fair value
Israeli currency
Unlinked CPI-linked Dollar Euro Others Total Total
NIS millions NIS millions %
Immediate corresponding increase of 1% 15,816 6,403 (626) (91) (445) (1,223) (5.49)
Immediate corresponding increase of 0.1% 16,653 6,593 (568) (86) (435) (123) (0.55)
Immediate corresponding decrease of 1% 17,769 6,884 (483) (77) (423) 1,390 6.24
Foreign currency
including Israeli
currency linked to
foreign currency
Fair value, net, of financial instruments after
the effect of changes in interest rates
31 December 2015
Change in fair value
Israeli currency
Unlinked CPI-linked Dollar Euro Others Total Total
NIS millions NIS millions %
Immediate corresponding increase of 1% 19,963 (7,086) (1,079) (550) (692) 639 6.44
Immediate corresponding increase of 0.1% 20,721 (8,657) (839) (545) (699) 64 0.65
Immediate corresponding decrease of 1% 21,643 (11,061) (675) (537) (708) (1,255) (12.66)
Foreign currency
including Israeli
currency linked to
foreign currency
Fair value, net, of financial instruments after
the effect of changes in interest rates
(a) This exposure includes the exposure to an immediate change in the interest of the nostro portfolios which have been remeasured
at market value and the actuarial commitment to employees. This does not include the effect of the sensitivity of the plan assets
to changes in interest which at 31 March 2016 is estimated to be a decrease in the value of the assets amounting to NIS 100
million (NIS 120 million on 31 December 2015) in the scenario of a 1% increase in interest. In addition, the measurement does
not include the effects of the transitional provisions of the standard on employee rights, according to which the capital adequacy
ratio is computed.
(b) Of this, the effect of compound financial assets: immediate corresponding increase of 1% - NIS (209) million, (31 December
2015 – NIS (250) million), an immediate corresponding decrease of 1% - NIS 86 million (31 December 2015 - NIS 144 million).
* Not including estimate of the value of revenues in respect of commission for early repayment.
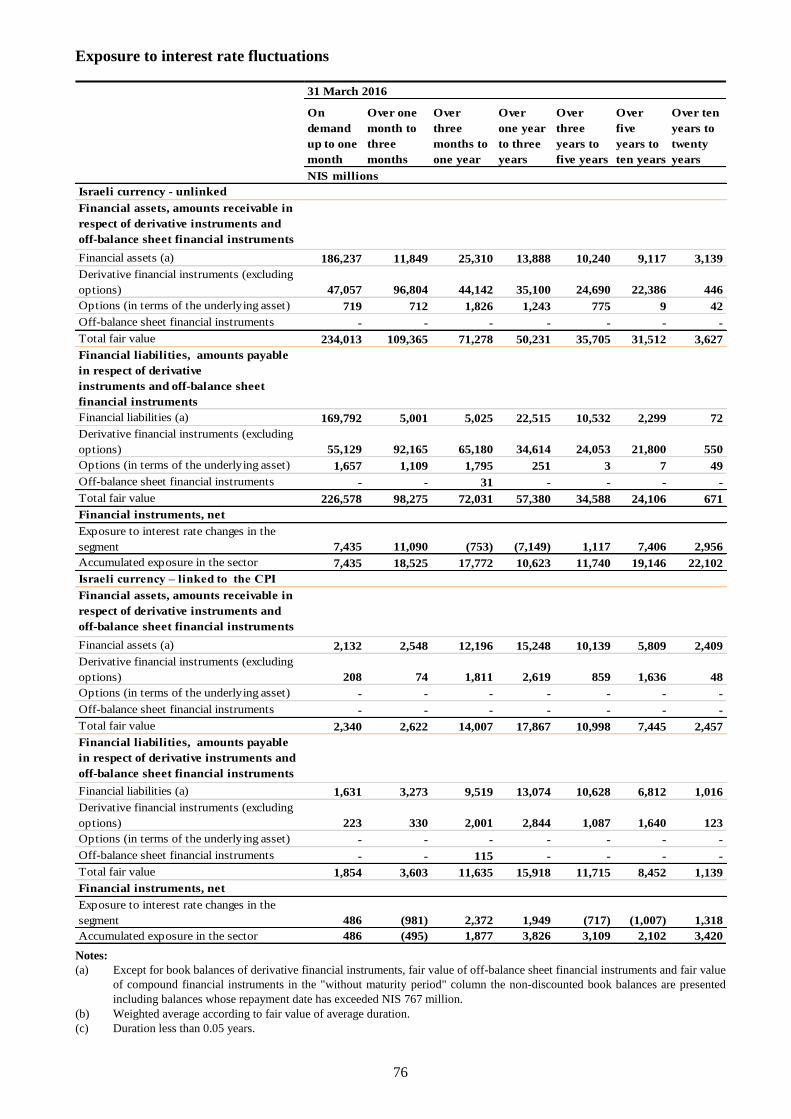
76
Exposure to interest rate fluctuations
On
demand
up to one
month
Over one
month to
three
months
Over
three
months to
one year
Over
one year
to three
years
Over
three
years to
five years
Over
five
years to
ten years
Over ten
years to
twenty
years
NIS millions
Israeli currency - unlinked
Financial assets, amounts receivable in
respect of derivative instruments and
off-balance sheet financial instruments
Financial assets (a) 186,237 11,849 25,310 13,888 10,240 9,117 3,139
Derivative financial instruments (excluding
options) 47,057 96,804 44,142 35,100 24,690 22,386 446
Options (in terms of the underlying asset)
(c)
719 712 1,826 1,243 775 9 42
Off-balance sheet financial instruments - - - - - - -
Total fair value 234,013 109,365 71,278 50,231 35,705 31,512 3,627
Financial liabilities, amounts payable
in respect of derivative
instruments and off-balance sheet
financial instruments
Financial liabilities (a) 169,792 5,001 5,025 22,515 10,532 2,299 72
Derivative financial instruments (excluding
options) 55,129 92,165 65,180 34,614 24,053 21,800 550
Options (in terms of the underlying asset)
(c)
1,657 1,109 1,795 251 3 7 49
Off-balance sheet financial instruments - - 31 - - - -
Total fair value 226,578 98,275 72,031 57,380 34,588 24,106 671
Financial instruments, net
Exposure to interest rate changes in the
segment 7,435 11,090 (753) (7,149) 1,117 7,406 2,956
Accumulated exposure in the sector 7,435 18,525 17,772 10,623 11,740 19,146 22,102
Israeli currency – linked to the CPI
Financial assets, amounts receivable in
respect of derivative instruments and
off-balance sheet financial instruments
Financial assets (a) 2,132 2,548 12,196 15,248 10,139 5,809 2,409
Derivative financial instruments (excluding
options) 208 74 1,811 2,619 859 1,636 48
Options (in terms of the underlying asset)
(c)
- - - - - - -
Off-balance sheet financial instruments - - - - - - -
Total fair value 2,340 2,622 14,007 17,867 10,998 7,445 2,457
Financial liabilities, amounts payable
in respect of derivative instruments and
off-balance sheet financial instruments
Financial liabilities (a) 1,631 3,273 9,519 13,074 10,628 6,812 1,016
Derivative financial instruments (excluding
options) 223 330 2,001 2,844 1,087 1,640 123
Options (in terms of the underlying asset)
(c)
- - - - - - -
Off-balance sheet financial instruments - - 115 - - - -
Total fair value 1,854 3,603 11,635 15,918 11,715 8,452 1,139
Financial instruments, net
Exposure to interest rate changes in the
segment 486 (981) 2,372 1,949 (717) (1,007) 1,318
Accumulated exposure in the sector 486 (495) 1,877 3,826 3,109 2,102 3,420
31 March 2016
Notes:
(a) Except for book balances of derivative financial instruments, fair value of off-balance sheet financial instruments and fair value
of compound financial instruments in the "without maturity period" column the non-discounted book balances are presented
including balances whose repayment date has exceeded NIS 767 million.
(b) Weighted average according to fair value of average duration.
(c) Duration less than 0.05 years.
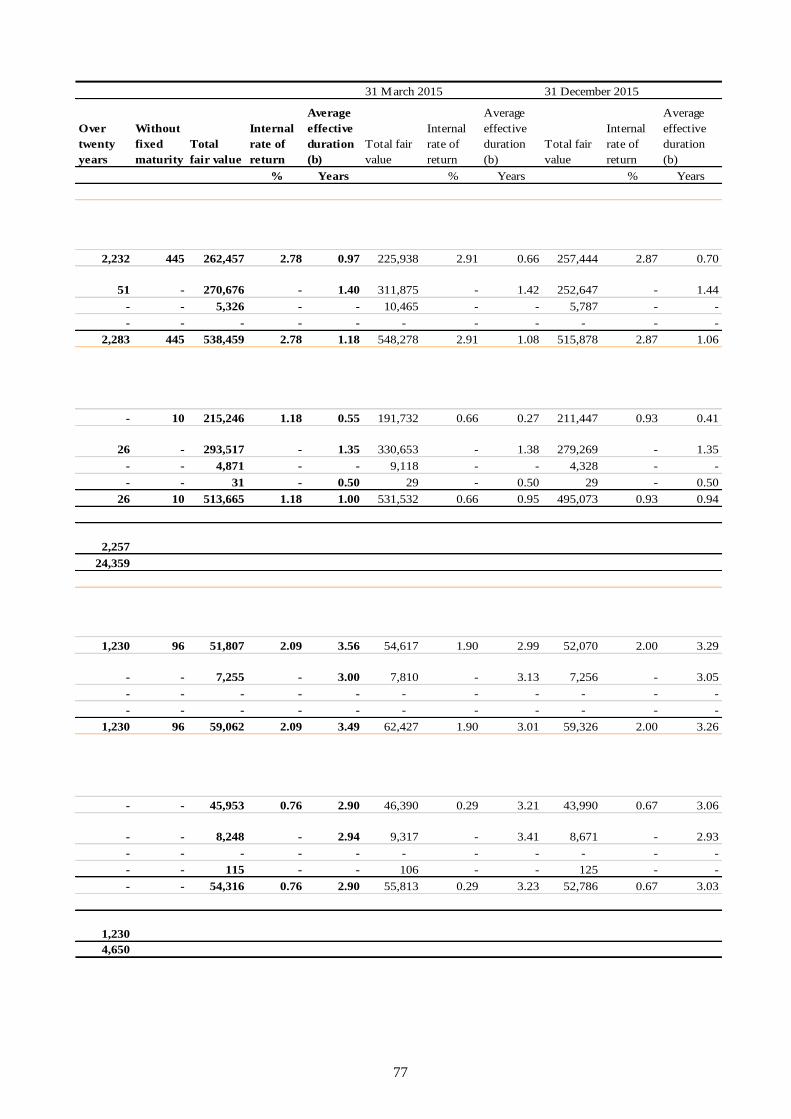
77
interest rate fluctuations (cont.)
Over
twenty
years
Without
fixed
maturity
Total
fair value
Internal
rate of
return
Average
effective
duration
(b)
Total fair
value
Internal
rate of
return
Average
effective
duration
(b)
Total fair
value
Internal
rate of
return
Average
effective
duration
(b)
% Years % Years % Years
2,232 445 262,457 2.78 0.97 225,938 2.91 0.66 257,444 2.87 0.70
51 - 270,676 - 1.40 311,875 - 1.42 252,647 - 1.44
- - 5,326 - - 10,465 - - 5,787 - -
- - - - - - - - - - -
2,283 445 538,459 2.78 1.18 548,278 2.91 1.08 515,878 2.87 1.06
- 10 215,246 1.18 0.55 191,732 0.66 0.27 211,447 0.93 0.41
26 - 293,517 - 1.35 330,653 - 1.38 279,269 - 1.35
- - 4,871 - - 9,118 - - 4,328 - -
- - 31 - 0.50 29 - 0.50 29 - 0.50
26 10 513,665 1.18 1.00 531,532 0.66 0.95 495,073 0.93 0.94
2,257
24,359
1,230 96 51,807 2.09 3.56 54,617 1.90 2.99 52,070 2.00 3.29
- - 7,255 - 3.00 7,810 - 3.13 7,256 - 3.05
- - - - - - - - - - -
- - - - - - - - - - -
1,230 96 59,062 2.09 3.49 62,427 1.90 3.01 59,326 2.00 3.26
- - 45,953 0.76 2.90 46,390 0.29 3.21 43,990 0.67 3.06
- - 8,248 - 2.94 9,317 - 3.41 8,671 - 2.93
- - - - - - - - - - -
- - 115 - - 106 - - 125 - -
- - 54,316 0.76 2.90 55,813 0.29 3.23 52,786 0.67 3.03
1,230
4,650
31 March 2015 31 December 2015
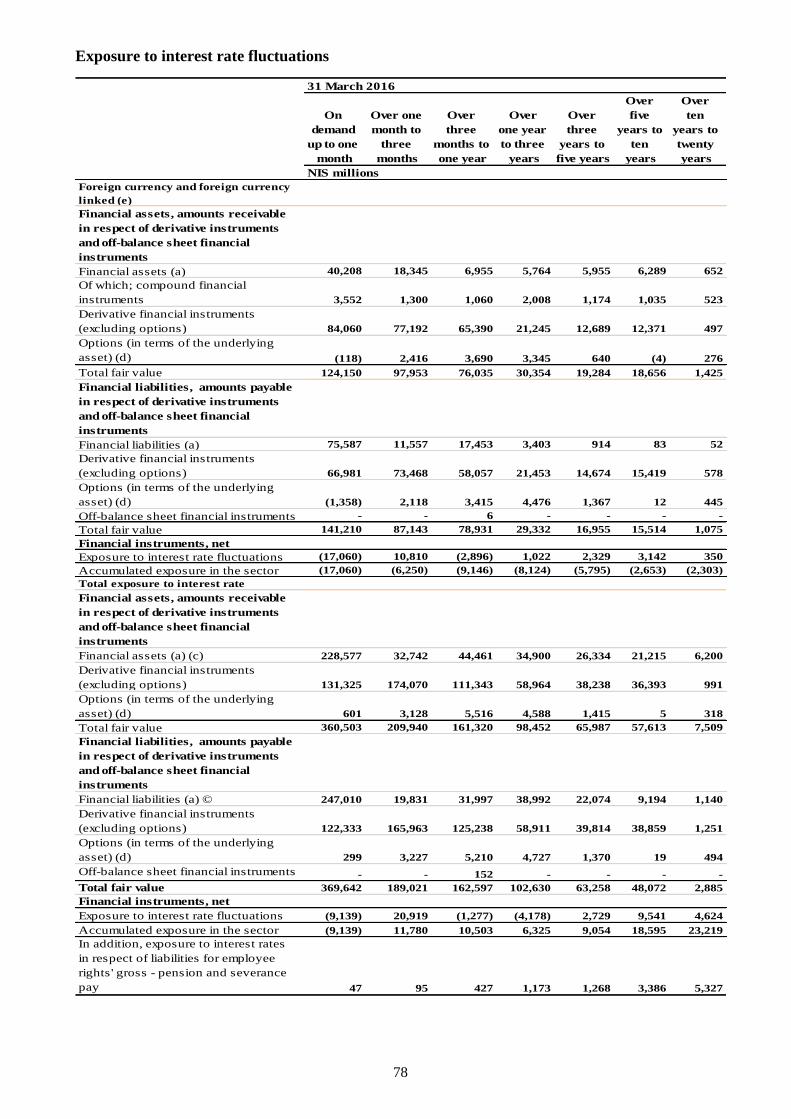
78
Exposure to interest rate fluctuations
On
demand
up to one
month
Over one
month to
three
months
Over
three
months to
one year
Over
one year
to three
years
Over
three
years to
five years
Over
five
years to
ten
years
Over
ten
years to
twenty
years
NIS millions
Foreign currency and foreign currency
linked (e)
Financial assets, amounts receivable
in respect of derivative instruments
and off-balance sheet financial
instruments
Financial assets (a) 40,208 18,345 6,955 5,764 5,955 6,289 652
Of which; compound financial
instruments 3,552 1,300 1,060 2,008 1,174 1,035 523
Derivative financial instruments
(excluding options) 84,060 77,192 65,390 21,245 12,689 12,371 497
Options (in terms of the underlying
asset) (d) (118) 2,416 3,690 3,345 640 (4) 276
Total fair value 124,150 97,953 76,035 30,354 19,284 18,656 1,425
Financial liabilities, amounts payable
in respect of derivative instruments
and off-balance sheet financial
instruments
Financial liabilities (a) 75,587 11,557 17,453 3,403 914 83 52
Derivative financial instruments
(excluding options) 66,981 73,468 58,057 21,453 14,674 15,419 578
Options (in terms of the underlying
asset) (d) (1,358) 2,118 3,415 4,476 1,367 12 445
Off-balance sheet financial instruments - - 6 - - - -
Total fair value 141,210 87,143 78,931 29,332 16,955 15,514 1,075
Financial instruments, net
Exposure to interest rate fluctuations (17,060) 10,810 (2,896) 1,022 2,329 3,142 350
Accumulated exposure in the sector (17,060) (6,250) (9,146) (8,124) (5,795) (2,653) (2,303)
Total exposure to interest rate
Financial assets, amounts receivable
in respect of derivative instruments
and off-balance sheet financial
instruments
Financial assets (a) (c) 228,577 32,742 44,461 34,900 26,334 21,215 6,200
Derivative financial instruments
(excluding options) 131,325 174,070 111,343 58,964 38,238 36,393 991
Options (in terms of the underlying
asset) (d) 601 3,128 5,516 4,588 1,415 5 318
Total fair value 360,503 209,940 161,320 98,452 65,987 57,613 7,509
Financial liabilities, amounts payable
in respect of derivative instruments
and off-balance sheet financial
instruments
Financial liabilities (a) © 247,010 19,831 31,997 38,992 22,074 9,194 1,140
Derivative financial instruments
(excluding options) 122,333 165,963 125,238 58,911 39,814 38,859 1,251
Options (in terms of the underlying
asset) (d) 299 3,227 5,210 4,727 1,370 19 494
Off-balance sheet financial instruments - - 152 - - - -
Total fair value 369,642 189,021 162,597 102,630 63,258 48,072 2,885
Financial instruments, net
Exposure to interest rate fluctuations (9,139) 20,919 (1,277) (4,178) 2,729 9,541 4,624
Accumulated exposure in the sector (9,139) 11,780 10,503 6,325 9,054 18,595 23,219
In addition, exposure to interest rates
in respect of liabilities for employee
rights' gross - pension and severance
pay 47 95 427 1,173 1,268 3,386 5,327
31 March 2016
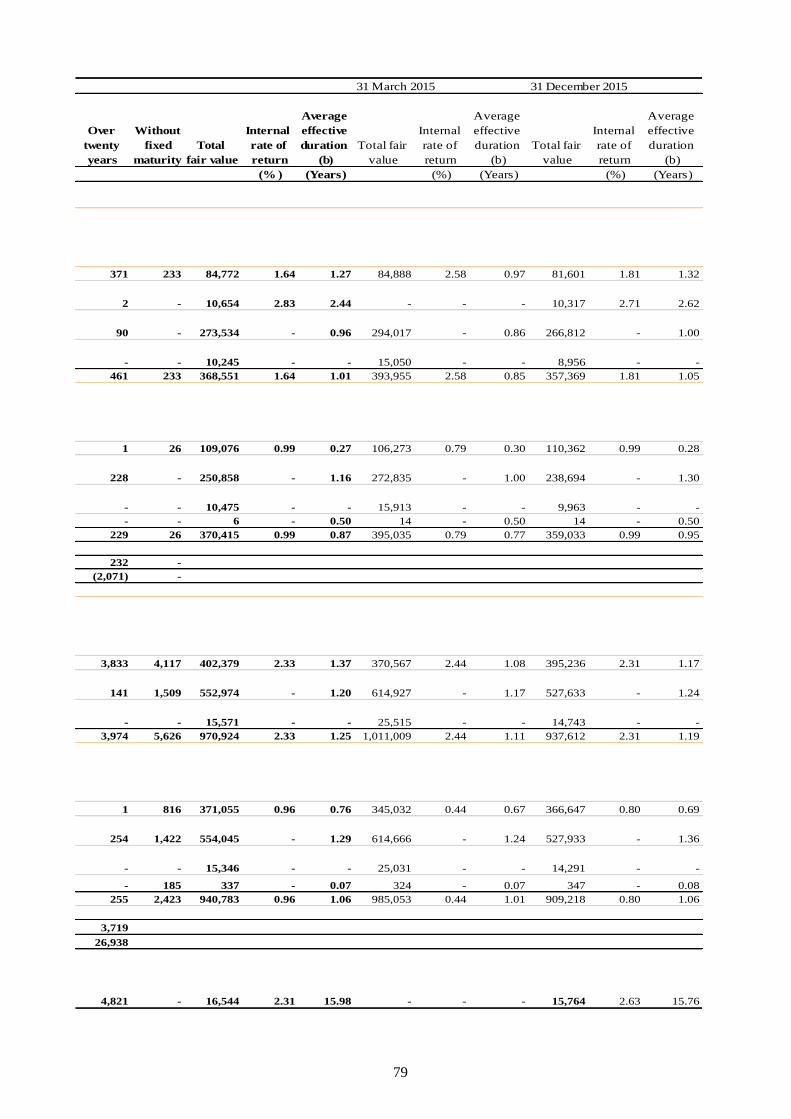
79
Over
twenty
years
Without
fixed
maturity
Total
fair value
Internal
rate of
return
Average
effective
duration
(b)
Total fair
value
Internal
rate of
return
Average
effective
duration
(b)
Total fair
value
Internal
rate of
return
Average
effective
duration
(b)
(% ) (Years) (%) (Years) (%) (Years)
371 233 84,772 1.64 1.27 84,888 2.58 0.97 81,601 1.81 1.32
2 - 10,654 2.83 2.44 - - - 10,317 2.71 2.62
90 - 273,534 - 0.96 294,017 - 0.86 266,812 - 1.00
- - 10,245 - - 15,050 - - 8,956 - -
461 233 368,551 1.64 1.01 393,955 2.58 0.85 357,369 1.81 1.05
1 26 109,076 0.99 0.27 106,273 0.79 0.30 110,362 0.99 0.28
228 - 250,858 - 1.16 272,835 - 1.00 238,694 - 1.30
- - 10,475 - - 15,913 - - 9,963 - -
- - 6 - 0.50 14 - 0.50 14 - 0.50
229 26 370,415 0.99 0.87 395,035 0.79 0.77 359,033 0.99 0.95
232 -
(2,071) -
3,833 4,117 402,379 2.33 1.37 370,567 2.44 1.08 395,236 2.31 1.17
141 1,509 552,974 - 1.20 614,927 - 1.17 527,633 - 1.24
- - 15,571 - - 25,515 - - 14,743 - -
3,974 5,626 970,924 2.33 1.25 1,011,009 2.44 1.11 937,612 2.31 1.19
1 816 371,055 0.96 0.76 345,032 0.44 0.67 366,647 0.80 0.69
254 1,422 554,045 - 1.29 614,666 - 1.24 527,933 - 1.36
- - 15,346 - - 25,031 - - 14,291 - -
- 185 337 - 0.07 324 - 0.07 347 - 0.08
255 2,423 940,783 0.96 1.06 985,053 0.44 1.01 909,218 0.80 1.06
3,719
26,938
4,821 - 16,544 2.31 15.98 - - - 15,764 2.63 15.76
31 March 2015 31 December 2015

80
Notes:
(a) Except for book balances of derivative financial instruments, fair value of off-balance sheet financial instruments and fair value
of compound financial instruments in the "without maturity period" column the non-discounted book balances are presented
including balances whose repayment date has exceeded totaling NIS 767 million.
(b) Weighted average according to fair value of effective duration.
(c) Including non-monetary items shown in the "Without maturity period" column.
(d) Duration less than 0.05 years.
(e) Including Israeli currency linked to foreign currency.
General notes:
1. In this table, the data by periods represent the present value of future cash flows, discounted at the internal rate of return used
for discounting to the fair value included in respect of the financial instrument, consistent with the assumptions used in
calculating the fair value of the financial instrument. For further details regarding the assumptions used in the calculation of the
fair value of the financial instruments, see Note 15A.
2. The internal rate of return is the interest rate for discounting the cash flows expected from a financial instrument to the fair
value included in respect of it.
3. The effective duration of a group of financial instruments constitutes an approximation of the percentage change in the fair
value of the group of financial instruments that would be caused as a result of a small change (an increase of 0.1%) in the
internal rate of return of each of the financial instruments.
4. The effect of hedging transactions is included in total assets or total liabilities, as applicable.
5. In calculating the duration of assets and liabilities in the CPI-linked segment an estimate was taken into account of early
redemptions and withdrawals at exit points in savings plans, in accordance with a model estimating expected early redemptions
based on the behavior of savers. The duration of total assets according to the original cash flow of the savings plans is higher
and reached 3.75 years, the duration of total liabilities reaches 2.93 years, and the gap in the internal rate of return (hereinafter
– IRR) amounts to 1.04%. The change in fair value in total assets is a decrease of NIS 38 million and in total liabilities,
an increase of NIS 20 million.
6 Further details of the exposure to interest rate fluctuations for each segment of financial assets and financial liabilities by the
various balance sheet headings, will be supplied on request.

81
Exposure to interest rates and compliance with limits
The status of exposure to interest changes at the Group level, which is calculated according to accounting
principles, is set forth below.
Unlinked
CPI-
linked
Foreign
currency and
foreign
currency linked Unlinked
CPI-
linked
Foreign
currency and
foreign
currency linked
Average duration in years:
Average duration of assets (a) 1.18 3.49 1.01 1.06 3.26 1.05
Average duration of liabilities (a) 1.00 2.90 0.87 0.94 3.03 0.95
Duration gap in years 0.18 0.59 0.14 0.12 0.23 0.10
IRR gap (%) 1.60 1.33 0.65 1.94 1.33 0.82
31 March 2016 31 December 2015
(a) Including forward transactions and options, and based on fair value data of financial instruments.
In calculating the average duration of the liabilities in the index-linked segment, an estimate regarding early
repayments and withdrawals at exit points in the savings programs is taken into account, in accordance with a
model which estimates the expected early repayments on the basis of the savers' behavior. An average duration
of the total liabilities according to the original cash flow of the savings programs is higher, reaching
2.93 years, and the internal rate of return gap (hereinafter "IRR") amounts to 1.04%.
Early repayments of mortgages are taken into account in the figures set forth above. The average duration of
the assets at the end of the reported period, according to the original cash flow which does not take into
account early repayments, is longer, reaching 3.75 years, and the IRR gap amounts to 1.04%.
The exposure to changes in interest rates presents current account balances according to the Bank of Israel
directives on deposits with demand of up to a month. On the other hand, for the purpose of exposure to
interest, a certain rate from the current account balances in shekels and foreign currency was spread for
repayment periods up to 10 years. This is in accordance with the model of behavior, the basic assumptions of
which are regularly updated. Taking these assumptions into account, the average duration of the liability is
higher, reaching in unlinked shekels, 1.18 years, and in foreign currency, 0.92 years, and the difference in the
IRR amounts to 1.70% and 0.59%, respectively.
B. Basis/exchange rate risk
According to accounting principles, capital is defined as an unlinked shekel source. Thus, an investment
of capital in a segment other than the unlinked shekel segment is defined as basis exposure. Exposure to
basis risk is measured as a percentage of the Group's exposed capital. The exposed capital, at the Bank
level, includes shareholders' equity and certain reserves, less fixed assets and investments in investee
companies, excluding investments in subsidiaries abroad that are financed from foreign currency sources
and are therefore not deducted from capital. At the Group level, the exposed capital includes shareholders'
equity and certain reserves, less fixed assets and investments in companies included on equity basis.
Exposure limits approved by the Board of Directors are decided in accordance with considerations of
expected return and risk and are allocated among the trading rooms, ALM and subsidiary companies.
This chapter is written in greater detail in the 2015 Annual Report (pages 139 to 140). The chapter below should therefore be
read in conjunction with the Annual Report.
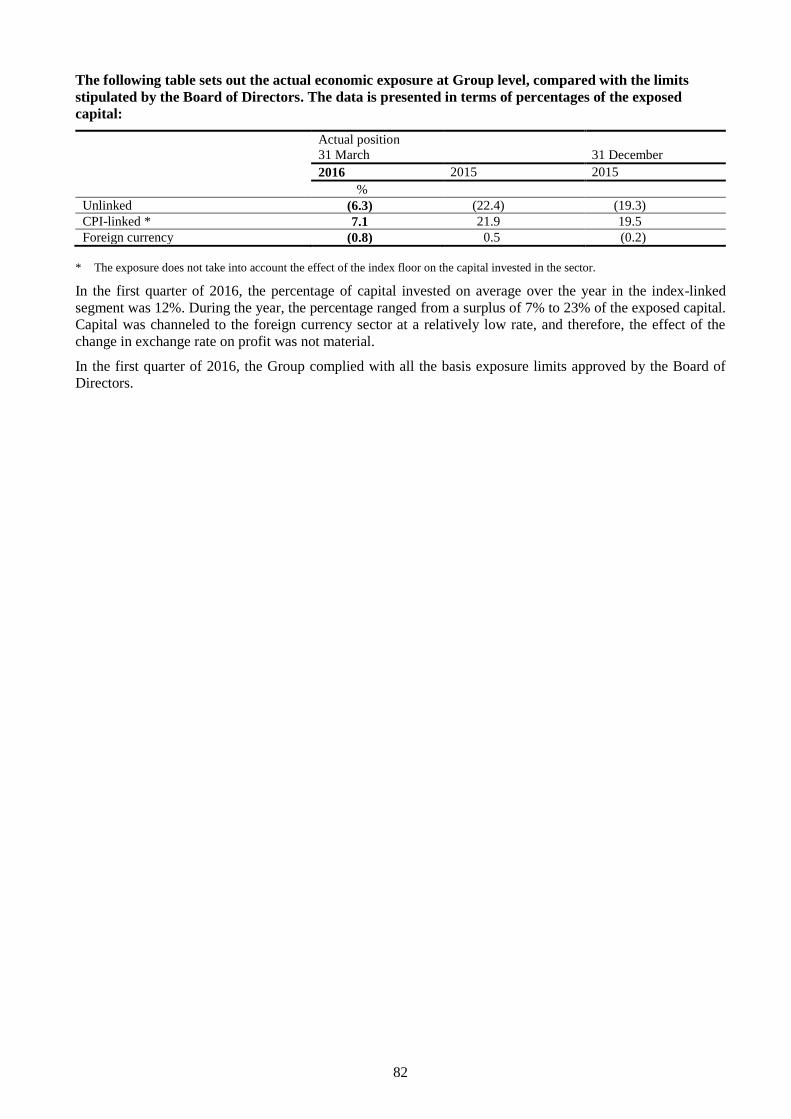
82
The following table sets out the actual economic exposure at Group level, compared with the limits
stipulated by the Board of Directors. The data is presented in terms of percentages of the exposed
capital:
Actual position
31 March 31 December
2016 2015 2015
%
Unlinked (6.3) (22.4) (19.3)
CPI-linked * 7.1 21.9 19.5
Foreign currency (0.8) 0.5 (0.2)
* The exposure does not take into account the effect of the index floor on the capital invested in the sector.
In the first quarter of 2016, the percentage of capital invested on average over the year in the index-linked
segment was 12%. During the year, the percentage ranged from a surplus of 7% to 23% of the exposed capital.
Capital was channeled to the foreign currency sector at a relatively low rate, and therefore, the effect of the
change in exchange rate on profit was not material.
In the first quarter of 2016, the Group complied with all the basis exposure limits approved by the Board of
Directors.
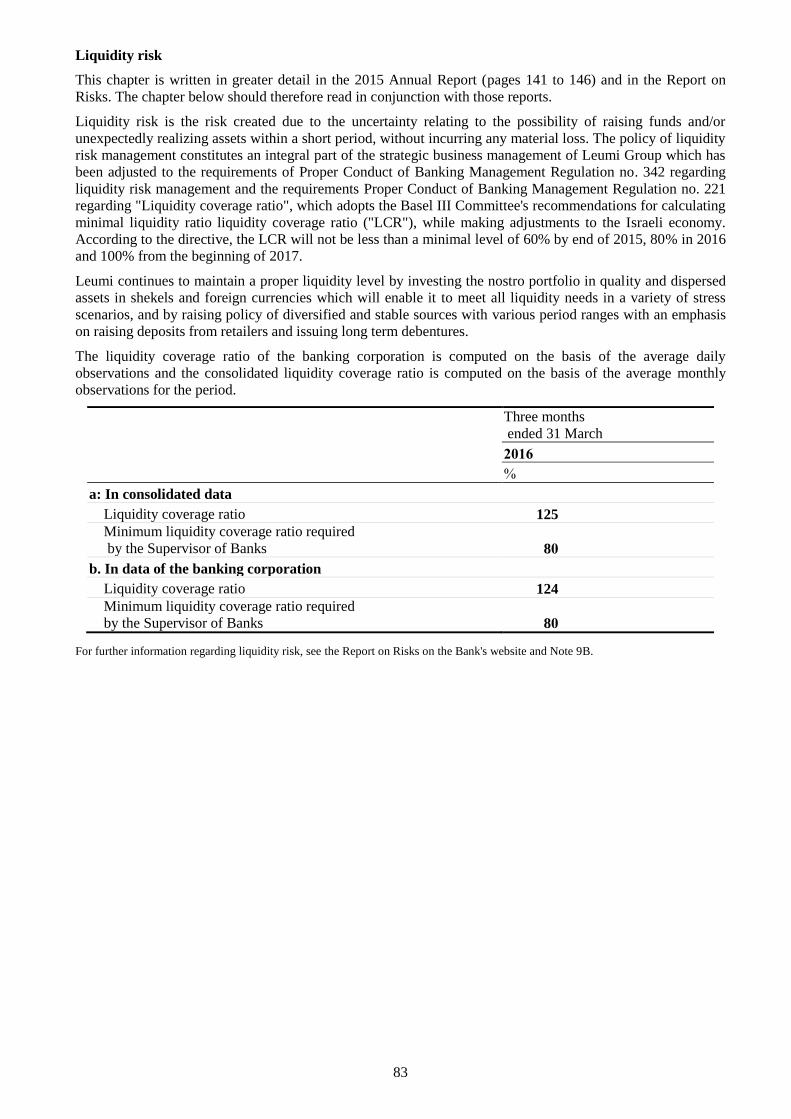
83
Liquidity risk
This chapter is written in greater detail in the 2015 Annual Report (pages 141 to 146) and in the Report on
Risks. The chapter below should therefore read in conjunction with those reports.
Liquidity risk is the risk created due to the uncertainty relating to the possibility of raising funds and/or
unexpectedly realizing assets within a short period, without incurring any material loss. The policy of liquidity
risk management constitutes an integral part of the strategic business management of Leumi Group which has
been adjusted to the requirements of Proper Conduct of Banking Management Regulation no. 342 regarding
liquidity risk management and the requirements Proper Conduct of Banking Management Regulation no. 221
regarding "Liquidity coverage ratio", which adopts the Basel III Committee's recommendations for calculating
minimal liquidity ratio liquidity coverage ratio ("LCR"), while making adjustments to the Israeli economy.
According to the directive, the LCR will not be less than a minimal level of 60% by end of 2015, 80% in 2016
and 100% from the beginning of 2017.
Leumi continues to maintain a proper liquidity level by investing the nostro portfolio in quality and dispersed
assets in shekels and foreign currencies which will enable it to meet all liquidity needs in a variety of stress
scenarios, and by raising policy of diversified and stable sources with various period ranges with an emphasis
on raising deposits from retailers and issuing long term debentures.
The liquidity coverage ratio of the banking corporation is computed on the basis of the average daily
observations and the consolidated liquidity coverage ratio is computed on the basis of the average monthly
observations for the period.
Three months
ended 31 March
2016
%
a: In consolidated data
Liquidity coverage ratio 125
Minimum liquidity coverage ratio required
by the Supervisor of Banks 80
b. In data of the banking corporation Liquidity coverage ratio 124
Minimum liquidity coverage ratio required
by the Supervisor of Banks 80
For further information regarding liquidity risk, see the Report on Risks on the Bank's website and Note 9B.
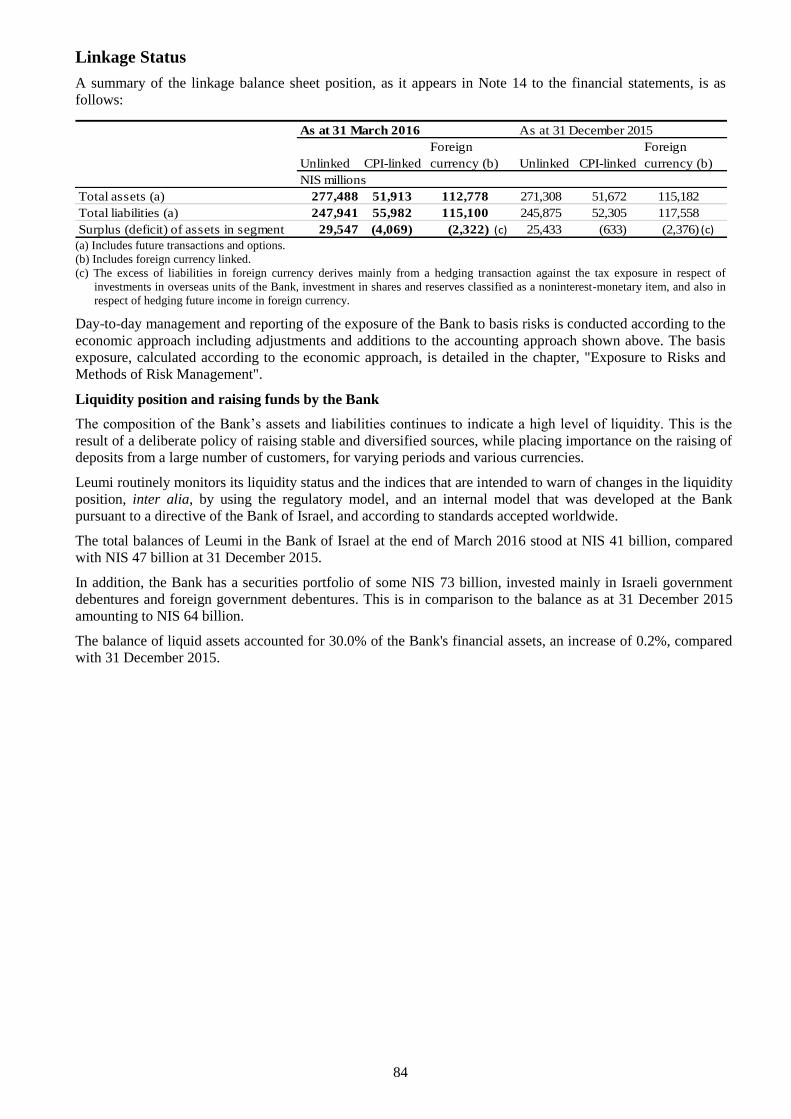
84
Linkage Status
A summary of the linkage balance sheet position, as it appears in Note 14 to the financial statements, is as
follows:
As at 31 March 2016 As at 31 December 2015
Unlinked CPI-linked
Foreign
currency (b) Unlinked CPI-linked
Foreign
currency (b)
NIS millions
Total assets (a) 277,488 51,913 112,778 271,308 51,672 115,182
Total liabilities (a) 247,941 55,982 115,100 245,875 52,305 117,558
Surplus (deficit) of assets in segment 29,547 (4,069) (2,322) 25,433 (633) (2,376) (c)(c) (a) Includes future transactions and options.
(b) Includes foreign currency linked.
(c) The excess of liabilities in foreign currency derives mainly from a hedging transaction against the tax exposure in respect of
investments in overseas units of the Bank, investment in shares and reserves classified as a noninterest-monetary item, and also in
respect of hedging future income in foreign currency.
Day-to-day management and reporting of the exposure of the Bank to basis risks is conducted according to the
economic approach including adjustments and additions to the accounting approach shown above. The basis
exposure, calculated according to the economic approach, is detailed in the chapter, "Exposure to Risks and
Methods of Risk Management".
Liquidity position and raising funds by the Bank
The composition of the Bank’s assets and liabilities continues to indicate a high level of liquidity. This is the
result of a deliberate policy of raising stable and diversified sources, while placing importance on the raising of
deposits from a large number of customers, for varying periods and various currencies.
Leumi routinely monitors its liquidity status and the indices that are intended to warn of changes in the liquidity
position, inter alia, by using the regulatory model, and an internal model that was developed at the Bank
pursuant to a directive of the Bank of Israel, and according to standards accepted worldwide.
The total balances of Leumi in the Bank of Israel at the end of March 2016 stood at NIS 41 billion, compared
with NIS 47 billion at 31 December 2015.
In addition, the Bank has a securities portfolio of some NIS 73 billion, invested mainly in Israeli government
debentures and foreign government debentures. This is in comparison to the balance as at 31 December 2015
amounting to NIS 64 billion.
The balance of liquid assets accounted for 30.0% of the Bank's financial assets, an increase of 0.2%, compared
with 31 December 2015.
85
Operational Risks
This chapter is written in greater detail in the 2015 Annual Report (pages 147 to 150 and in the Report on Risks. The chapter below
should therefore read in conjunction with those reports.
Leumi Group operates in a wide range of financial activities and, accordingly, is exposed to operating risks,
including, inter alia, the risks of fraud and embezzlement, information technology, business continuity, and
cyber and data security.
Operational risks in Leumi Group are managed with systemic vision by three lines of defense. Operational risk
management relies on a proactive process of identifying, evaluating, measuring, monitoring, reporting and
controlling/reducing material risks, which is carried out in all divisions of the Bank.
An important point of risk among the operating risks is information technology risk. The Bank is a progressive
bank, leading in technological innovation. In order to create advanced services for its customers, along with
business opportunities created with advanced technology, the level of exposure to data security risks and
system failure increases, which are liable to expose the Bank to impairment in business activity and
impairment in goodwill.
Leumi maintains strict scrutiny over the quality and proper functioning of the computer information systems
and invests many resources therein, including appropriate data security system management. The data security
risk market in Leumi is maintained on the basis of organized policy for mapping risk management, the
application of controls and the hedging of the risks.
Bank Leumi, as a leading financial organization, is an attractive target for various attackers. The computer systems, communication networks and our customers' devices have come under attack and will continue to be vulnerable to cyber-attack, viruses, malware, phishing, and other exposures intended to cause damage to service, or steal or corrupt data.
There are focal points in Leumi for monitoring unusual activity and cyber attacks. Leumi continues to improve
is ability to defend itself against the cyber threats.
86
Compliance risks
This chapter is written in greater detail in the 2015 Annual Report (pages 151- to 153). The chapter below should therefore read in
conjunction with the Annual Report.
A. Compliance, prohibition of money laundering and the financing of terrorism
The complexity and development of the banking activity, requires the Bank to strictly comply with all
duties applied to the banking corporation, relations with its customers, by virtue of primary legislation,
bylaws, orders, permits and Bank of Israel's directives.
For the effective management of the subject, a compliance and enforcement department was set up in
Leumi headed by the Chief Compliance Officer, and subject to the Chief Legal Counsel.
The Chief Compliance Officer is responsible for fulfilling the obligations pursuant to the legislative
directives regarding the prohibition of money laundering and the financing of terrorism, is responsible for
the enforcement in the area of the Securities Laws and is the officer responsible on the subject of FATCA,
as set forth below.
The governance of risk management is based on three lines of defense, with the Compliance and
Enforcement Department included in the second line of defense and its main function is the responsibility
for the management and control of the risk, independent of the activities that it reviews, i.e., the
department is an leading professional anchor, providing guidance in the management of compliance risk,
takes steps to assimilate a proper compliance culture, provides guidelines (for example: risk assessment
policy and methodology documents, broad work procedures, working processes, assimilation materials,
broad automated requirements) for the activity of the Bank and the Group and is responsible for raising
significant compliance risks with the management and the Board of Directors.
The activity of the Compliance Department is performed by a professional team with extensive
knowledge and understanding in the field of compliance, and based on work processes, control and
automated systems.
A multi-year work-program of the Compliance Department is risk-oriented program which is intended to
examine the effectiveness of the compliance risk management.
The Chief Compliance Officer of Bank Leumi also fulfils the role of Chief Compliance Officer of Leumi
Group. Accordingly, the compliance risks are managed independently by each of the companies in the
Group, maintaining supervision and professional guidance from a group perspective.
B. Internal enforcement of Securities Laws
The internal enforcement program of the Securities Laws formulated by the Bank is based on the
Efficiency of Enforcement Procedures in the Securities Authority Law (Legislative Amendments), 2011,
and the criteria for recognition in an effective enforcement program published by the Israel Securities
Authority.
The plan was approved by the Board of Directors, after being validated by an outside specialist, and after
the main enforcement procedures had been reviewed by him, after an external specialist validated the plan
and reviewed the main enforcement procedures.
C. Foreign Account Tax Compliance Act – FATCA
In March 2010, the Internal Revenue Code in the United States (the U.S. Income Tax Law) was amended,
so as to bring into effect a reporting regime, which aims to compel foreign financial institutions (FFI) to
transfer information regarding accounts held by U.S. customers.
In order to ensure the compliance of Leumi Group (hereinafter – Leumi) and individuals therein, with the
provisions of the FATCA legislation, as adopted by the State of Israel in the inter-governmental
agreement, and pursuant to a specific agreement between Leumi Group and the United States Department
of Justice, the Bank is taking steps on a number of levels, the most important which are: the appointment
of a compliance officer to assume the function of "responsible officer", the adoption of appropriate policy
and work procedures, the development of automated tools supporting the working processes, the
formulation of training and assimilation, inspection control and operation mechanisms which are required
for complying with the directives and instructing the relevant subsidiaries in the Group.
87
Legal Risks
This chapter is set out in greater detail in the Annual Financial Statements for 2015 (pages 451-455), and the chapter should be
read in conjunction with that stated in the Annual Report.
There is a general exposure, which cannot be estimated or quantified, resulting from, inter alia, the
complexity of the services provided by the Bank and its consolidated companies to their customers. The
complexity of these services involves, among other things, a potential for interpretive and other claims,
which relate to many commercial and regulatory conditions. It is not possible to anticipate all the kinds of
claims raised in this field and the exposure relating to these and other claims in connection with the
services of the Bank and its consolidated companies that are raised, inter alia, through the procedural
mechanism stipulated in the Class Actions Law.
In addition, there is an exposure due to regulatory changes and guidelines of the Supervisor of Banks.
Contracts with customers are, in part, engagements lasting for many years, during which changes may
occur in policy, regulations and trends in the law, including court rulings. The Bank and its consolidated
companies operate through complex automated systems, which in light of the aforesaid, have to be
adjusted regularly. All these create increased operational and legal exposure.
Furthermore, there is a general exposure resulting from complaints against the Bank and its consolidated
companies submitted from time to time to the Supervisor of Banks, which may in certain circumstance
lead to legal action being taken against the Bank. At this time, it is impossible to assess whether there is
an exposure for such complaints and it cannot be estimated if the Banking Supervision Department will
make an across-the-board decision on complaints as above and/or if class actions or others will be filed as
a result of such processes, and it is not possible to estimate the potential exposure as above. Accordingly,
no provision is included for this exposure.

88
Accounting Policies and Estimates on Critical Subjects
General
The financial statements have been prepared in accordance with generally accepted accounting principles and
the directives of the Supervisor of Banks and his guidelines relating to the preparation of the annual and
quarterly financial statements of a banking corporation, as detailed in Note 1 to the annual financial statements
as at 31 December 2015.
The preparation of consolidated financial statements, in accordance with generally accepted accounting
principles and the directives of the Supervisor of Banks, requires Management to make estimates and
assessments that affect the reported amounts of assets and liabilities and the amounts of income and expenses.
The actual results relating to these items may differ from the estimates and/or the assessments.
The estimates and assessments are generally based on economic forecasts, assessments regarding the various
markets and past experience, while exercising discretion, which management believes to be reasonable at the
time of signing of the financial statements.
The principal critical accounting subjects referred to in the Annual Report as at 31 December 2015 were as
follows: allowance for credit losses and the classification of problem debts, derivative financial instruments,
securities, obligations regarding employee rights, obligations in respect of legal claims, buildings and
equipment, taxes on income and deferred taxes.
Obligations regarding Employee Rights
The amounts of the obligations for pension and long-service grants are calculated according to actuarial
models. The calculation of the Bank's act liability is made according to the capitalization rate based on the
return of government debentures in Israel plus an international margin which is fixed according to the
difference between the return to redemption, according to the period to redemption, on corporate debentures
rated AA and above in the United States, and the rates of return on redemption for those periods to the
repayment of U.S. government debentures.
In addition, the actuarial computations take into account the forecast real increase in pay on the basis of past
experience, which varies according to the age of the employee.
The actuarial models include assumptions regarding life expectancy tables, disability rates, leaving rates, the
rate of leaving with preferred conditions, the rate of utilization of pension rights, the rate of withdrawal of
severance pay and provident fund monies, etc. Although the parameters have been determined with
appropriate care and professional expertise, a change in any or some of the actuarial parameters and/or the
capitalization rate and/or the rate of increase in pay will cause a change in the level of the Bank’s obligations.
The actuary’s valuation of the employees’ rights may be found on the Israel Securities Authority’s website:
www.magna.isa.gov.il.
As of 31 March 2016, the balance of accumulated other comprehensive income in respect of employee
benefits amounted to NIS 2.034 million, after the effect of tax, a decrease of NIS 544 million after the effect of
tax compared with 31 December 2015.
The balance of the liability for employee benefits as of 31 March 2016 at the discounting rate on the basis of
corporate debentures in Israel ("deep market for the approach of the Israel Securities Authority") is NIS 461
million less than the actual balance of liability.
89
Controls and Procedures regarding Disclosure in the Financial Statements
The directives of the Supervisor of Banks apply the requirements of Sections 302 and 404 of the SOX Act
to banking corporations. With regard to these sections, the SEC and the Public Company Accounting
Oversight Board have provided directives as to management’s responsibility for the determination and
existence of controls and procedures with regard to disclosure and existence of internal control over
financial reporting and the external auditors’ opinion with regard to the audit of the internal control over
financial reporting.
The Supervisor’s directives provide that:
a. Banking corporations shall apply the requirements of Sections 302 and 404 and also the SEC’s
directives that were published by virtue thereof.
b Proper internal control requires the existence of a control system in accordance with a defined and
recognized framework, and the COSO (Committee of Sponsoring Organizations of the
Treadway Commission) 1992 model meets the requirements and can be used to assess the internal
control.
The Bank implements the directives in the Leumi Group on a day-to-day basis.
In 2016, the Bank carried out a validation and update of material control processes and checks of the
effectiveness of the entire internal control system on financial reporting.
Assessment of controls and procedures with regard to disclosure
The management of the Bank, together with the President and Chief Executive Officer, the Head of the
Finance Division and the Chief Accounting Officer, has evaluated, as at the end of the period covered by
this report, the effectiveness of the disclosure controls and procedures of the Bank. On the basis of this
evaluation, the President and Chief Executive Officer of the Bank, the Head of the Finance Division and
the Chief Accounting Officer have concluded that, as at the end of the said period, the disclosure controls
and procedures of the Bank are effective for the recording, processing, summarizing and reporting of the
information that the Bank is required to disclose in its financial statements, in accordance with the
directives of the Supervisor of Banks on reporting to the public and at the time required in these directives.
As a result of to the start of use of the NAHAL system for managing the Bank's impaired debts in the first
quarter of 2016, there were changes in the automation of the processes of categorization of problematic
debts and calculation of the cost for credit losses, and therefore, there was a change in the Bank's internal
control on the financial report. In order to obtain the signatures of the Bank's CEO, the Head of the Finance
division and the Chief Accountant on the declaration regarding the internal control on the Financial Report
for the First Quarter, during the course of preparation of Financial Report for this quarter a form of
composition will be implemented relating to the completeness of the data and the reasonableness of the
results. In the event that discrepancies are discovered in them, the Bank takes steps to correct them as
quickly as possible.
Changes in internal control
Apart from that said above, during the quarter ended 31 March 2016, no material change to the internal
control over financial reporting of the Bank occurred which had a material effect, or which could
reasonably be expected to have a material effect, on the Bank’s internal control over the financial reporting.

90
Board of Directors
During the period January-March 2016, the Board of Directors held 13 plenary meetings and 22 committee
meetings.
At the Meeting of the Board of Directors that took place on 18 May 2016, it was decided to approve and
publish the audited consolidated financial statements of the Group as at 31 March 2016 and for the period
ended on that date.
The Board of Directors of the Bank expresses its appreciation and gratitude to the employees and managers of
the Bank and Group companies in Israel and abroad for their dedicated work and their contribution to the
promotion of the Group's business.
David Brodet
Chairman of the Board of Directors
Rakefet Russak-Aminoach
President and Chief Executive Officer
18 May 2016

91
92
Certification
I, Rakefet Russak-Aminoach, certify that:
1. I have reviewed the Quarterly Report of Bank Leumi le-Israel B.M. (the "Bank") for the quarter ended on 31
March 2016 (the "Report").
2. Based on my knowledge, the Report does not contain any untrue statement of a material fact or omit the
statement of a material fact that is necessary so that the statements included therein, in light of the
circumstances under which such statements were included, are not misleading with reference to the period
covered by the Report.
3. Based on my knowledge, the quarterly financial statements, and other financial information included in the
Report, fairly present in all material respects the financial condition, results of operations and changes in
shareholders' equity and cash flows of the Bank for the dates and periods covered by the Report.
4. I and the Bank's other certifying officers are responsible for establishing and maintaining controls and
procedures with regard to the Bank's disclosure and internal control of financial reporting (as defined in the
Public Reporting Directives concerning "The Directors' Report"), and also:
(a) We have established such controls and procedures, or caused such controls and procedures to be
determined under our supervision, so as to ensure that material information relating to the Bank,
including its consolidated corporations, is made known to us by others within the Bank and in those
corporations, particularly during the period of preparation of the Report;
(b) We have established such internal control over financial reporting, or caused such internal control to be
established under our supervision, so as to provide a reasonable level of confidence regarding the
reliability of financial reporting and so that the financial statements for external purposes are prepared
in accordance with accepted accounting principles and the directives of the Supervisor of Banks and
his instructions;
(c) We have evaluated the effectiveness of the Bank's disclosure controls and procedures and presented in
this Report our conclusions about the effectiveness of the disclosure controls and procedures, as of the
end of the period covered by the Report, based on our evaluation; and
(d) We have disclosed in the Report any change in the Bank's internal control over financial reporting that
occurred during this quarter that has materially affected, or is reasonably likely to materially affect, the
Bank's internal control over financial reporting; and 5. I and the Bank's other certifying officers have disclosed to the Joint Auditors, the Board of Directors, the
Audit Committee and the Financial Statements Review Committee of the Board of Directors of the Bank,
based on our most recent evaluation of internal control over financial reporting:
(a) All significant deficiencies and material weaknesses in the establishment or operation of internal
control over financial reporting which are reasonably likely to adversely affect the Bank's ability to
record, process, summarize and report financial information; and
(b) Any fraud, whether material or immaterial, in which Management was involved or in which other
employees were involved who have a significant role in the Bank's internal control over financial
reporting.
The above does not derogate from my responsibility or the responsibility of any other person, pursuant to any law.
18 May 2016
___________________
Rakefet Russak-Aminoach
President and Chief Executive Officer

93
Certification
I, Ron Fainaro, certify that:
1. I have reviewed the Quarterly Report of Bank Leumi le-Israel B.M. (the "Bank") for the quarter ended on 31
March 2016 (the "Report").
2. Based on my knowledge, the Report does not contain any untrue statement of a material fact or omit the
statement of a material fact that is necessary so that the statements included therein, in light of the
circumstances under which such statements were included, are not misleading with reference to the period
covered by the Report.
3. Based on my knowledge, the quarterly financial statements, and other financial information included in the
Report, fairly present in all material respects the financial condition, results of operations and changes in
shareholders' equity and cash flows of the Bank for the dates and periods covered by the Report.
4. I and the Bank's other certifying officers are responsible for establishing and maintaining controls and
procedures with regard to the Bank's disclosure and internal control of financial reporting (as defined in the
Public Reporting Directives concerning "The Directors' Report"), and also:
(a) We have established such controls and procedures, or caused such controls and procedures to be
determined under our supervision, so as to ensure that material information relating to the Bank,
including its consolidated corporations, is made known to us by others within the Bank and in those
corporations, particularly during the period of preparation of the Report;
(b) We have established such internal control over financial reporting, or caused such internal control to be
established under our supervision, so as to provide a reasonable level of confidence regarding the
reliability of financial reporting and so that the financial statements for external purposes are prepared
in accordance with accepted accounting principles and the directives of the Supervisor of Banks and
his instructions;
(c) We have evaluated the effectiveness of the Bank's disclosure controls and procedures and presented in
this Report our conclusions about the effectiveness of the disclosure controls and procedures, as of the
end of the period covered by the Report, based on our evaluation; and
(d) We have disclosed in the Report any change in the Bank's internal control over financial reporting that
occurred during this quarter that has materially affected, or is reasonably likely to materially affect, the
Bank's internal control over financial reporting; and 5. I and the Bank's other certifying officers have disclosed to the Joint Auditors, the Board of Directors, the
Audit Committee and the Financial Statements Review Committee of the Board of Directors of the Bank,
based on our most recent evaluation of internal control over financial reporting:
(a) All significant deficiencies and material weaknesses in the establishment or operation of internal
control over financial reporting which are reasonably likely to adversely affect the Bank's ability to
record, process, summarize and report financial information; and
(b) Any fraud, whether material or immaterial, in which Management was involved or in which other
employees were involved who have a significant role in the Bank's internal control over financial
reporting.
The above does not derogate from my responsibility or the responsibility of any other person, pursuant to any law.
18 May 2016
___________________
Ron Fainaro Executive Vice President,
Head of Economics and Finance Division
94
Certification
I, Shlomo Goldfarb, certify that:
1. I have reviewed the Quarterly Report of Bank Leumi le-Israel B.M. (the "Bank") for the quarter ended on 31
March 2016 (the "Report").
2. Based on my knowledge, the Report does not contain any untrue statement of a material fact or omit the
statement of a material fact that is necessary so that the statements included therein, in light of the
circumstances under which such statements were included, are not misleading with reference to the period
covered by the Report.
3. Based on my knowledge, the quarterly financial statements, and other financial information included in the
Report, fairly present in all material respects the financial condition, results of operations and changes in
shareholders' equity and cash flows of the Bank for the dates and periods covered by the Report.
4. I and the Bank's other certifying officers are responsible for establishing and maintaining controls and
procedures with regard to the Bank's disclosure and internal control of financial reporting (as defined in the
Public Reporting Directives concerning "The Directors' Report"), and also:
(a) We have established such controls and procedures, or caused such controls and procedures to be
determined under our supervision, so as to ensure that material information relating to the Bank,
including its consolidated corporations, is made known to us by others within the Bank and in those
corporations, particularly during the period of preparation of the Report;
(b) We have established such internal control over financial reporting, or caused such internal control to be
established under our supervision, so as to provide a reasonable level of confidence regarding the
reliability of financial reporting and so that the financial statements for external purposes are prepared
in accordance with accepted accounting principles and the directives of the Supervisor of Banks and
his instructions;
(c) We have evaluated the effectiveness of the Bank's disclosure controls and procedures and presented in
the Report our conclusions about the effectiveness of the disclosure controls and procedures, as of the
end of the period covered by the Report, based on our evaluation; and
(d) We have disclosed in the Report any change in the Bank's internal control over financial reporting that
occurred during this quarter that has materially affected, or is reasonably likely to materially affect, the
Bank's internal control over financial reporting; and 5. I and the Bank's other certifying officers have disclosed to the Joint Auditors, the Board of Directors, the
Audit Committee and the Financial Statements Review Committee of the Board of Directors of the Bank,
based on our most recent evaluation of internal control over financial reporting:
(a) All significant deficiencies and material weaknesses in the establishment or operation of internal
control over financial reporting which are reasonably likely to adversely affect the Bank's ability to
record, process, summarize and report financial information; and
(b) Any fraud, whether material or immaterial, in which Management was involved or in which other
employees were involved who have a significant role in the Bank's internal control over financial
reporting.
The above does not derogate from my responsibility or the responsibility of any other person, pursuant to any law.
18 May 2016
___________________
Shlomo Goldfarb
Executive Vice President
Chief Accounting Officer
Head of Accounting Division
95
Joint Auditors' Review Report to the Shareholders of Bank Leumi le-Israel B.M.
Introduction
We have reviewed the accompanying financial information of Bank Leumi le-Israel B.M. and its subsidiaries
(hereinafter: "the Bank"), comprising the condensed consolidated interim balance sheet as of 31 March, 2016 and
the related condensed consolidated interim statements of profit and loss, comprehensive income, changes in equity
and cash flows for the three month period ended on that date. The Board of Directors and Management are
responsible for the preparation and presentation of financial information for this interim period in accordance with
generally accepted accounting principles in Israel (Israeli GAAP) for financial reporting of interim periods and in
accordance with directives and guidelines of the Supervisor of Banks. Our responsibility is to express a conclusion
on financial information for this interim period based on our review.
We did not review the condensed financial information for the interim period of certain consolidated companies,
whose assets included on consolidation constitute approximately 0.17% of total consolidated assets at 31 March,
2016 and whose net interest income before credit loss expenses included in the consolidated statements of profit
and loss constitute some 0.26% of the total consolidated net interest income before credit loss expenses for the
three month period ended on that date. The condensed financial information for the interim period of those
companies was reviewed by other auditors, whose review reports have been furnished to us, and our conclusion,
insofar as it relates to amounts emanating from the financial information of such companies, is based solely on the
said review reports of the other auditors.
Scope of review
We conducted our review in accordance with Standard on Review Engagements 1 "Review of Interim Financial
Information Performed by the Independent Auditor of the Entity" of the Institute of Certified Public Accountants in
Israel, and a review standard applied in the review of banking institutions according to the instructions and
directives of the Supervisor of Banks. A review of interim financial information consists of making inquiries,
primarily of persons responsible for financial and accounting matters, and applying analytical and other review
procedures. A review is substantially less in scope than an audit conducted in accordance with generally accepted
auditing standards in Israel and consequently does not enable us to obtain assurance that we would become aware
of all significant matters that might be identified in an audit. Accordingly, we do not express an audit opinion.
Conclusion
Based on our review and the review reports of other auditors, nothing has come to our attention that causes us to
believe that the accompanying financial information was not prepared, in all material respects, in accordance with
generally accepted accounting principles in Israel (Israeli GAAP) for interim accounting periods and in accordance
with the directives and guidelines of the Supervisor of Banks.
Without qualifying our above opinion, we draw attention to:
1. that stated in Note 10B, paragraphs 2 and 4, regarding claims made against the Bank including petitions for
their approval as class actions.
2. that stated in Note 10C, paragraph 1B, regarding an investigation carried out against the Group by the US
Securities and Exchange Commission in connection with the Group's activity with US persons.
The Bank is unable to estimate the implications of the above-mentioned matters on the Bank, if any, on its financial
position and operating results, and whether or not they will be material.
Somekh Chaikin Kost Forer Gabbay & Kasierer
Certified Public Accountants (Isr.) Certified Public Accountants (Isr.)
18 May 2016
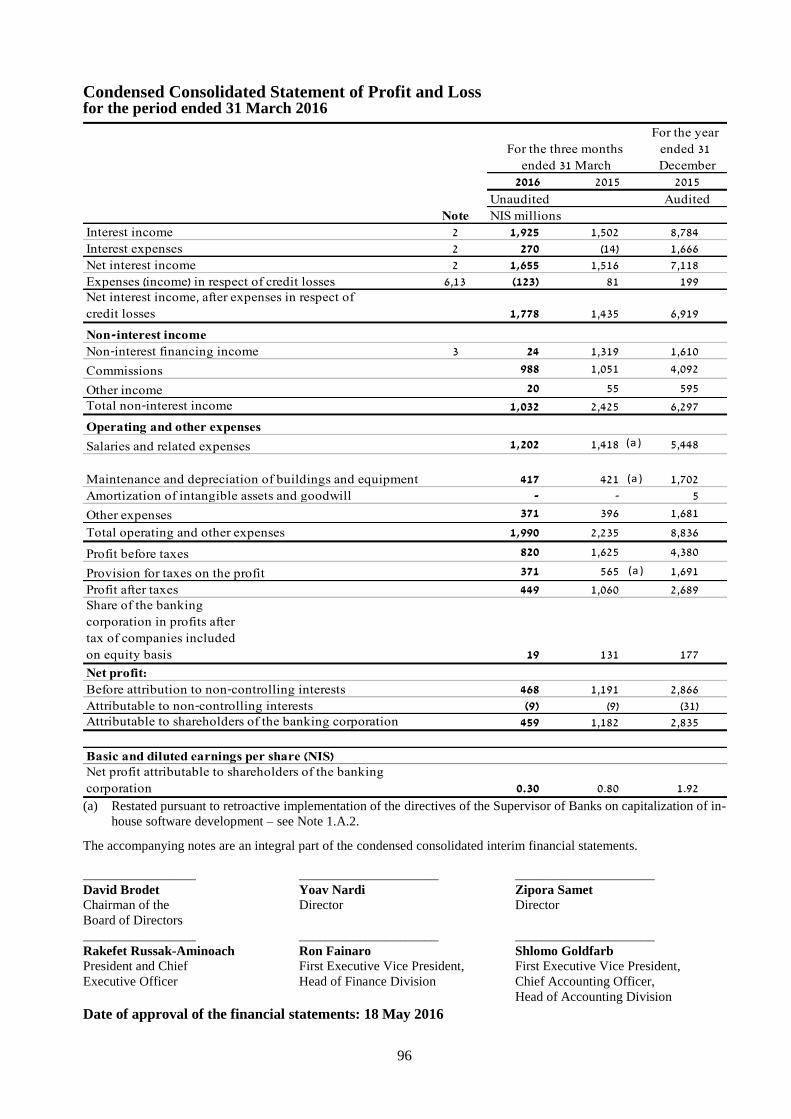
96
Condensed Consolidated Statement of Profit and Loss for the period ended 31 March 2016
For the year
ended 31
December
2016 2015 2015
Audited
Note NIS millions
Interest income 2 1,925 1,502 8,784
Interest expenses 2 270 (14) 1,666
Net interest income 2 1,655 1,516 7,118
Expenses (income) in respect of credit losses 6,13 (123) 81 199Net interest income, after expenses in respect of
credit losses 1,778 1,435 6,919
Non-interest income
Non-interest financing income 3 24 1,319 1,610
Commissions 988 1,051 4,092
Other income 20 55 595
Total non-interest income 1,032 2,425 6,297
Operating and other expenses
Salaries and related expenses 1,202 1,418 5,448
Maintenance and depreciation of buildings and equipment 417 421 1,702
Amortization of intangible assets and goodwill - - 5
Other expenses 371 396 1,681
Total operating and other expenses 1,990 2,235 8,836
Profit before taxes 820 1,625 4,380
Provision for taxes on the profit 371 565 1,691
Profit after taxes 449 1,060 2,689Share of the banking
corporation in profits after
tax of companies included
on equity basis 19 131 177
Net profit:
Before attribution to non-controlling interests 468 1,191 2,866
Attributable to non-controlling interests (9) (9) (31)Attributable to shareholders of the banking corporation 459 1,182 2,835
Net profit attributable to shareholders of the banking
corporation 0.30 0.80 1.92
For the three months
ended 31 March
Unaudited
Basic and diluted earnings per share (NIS)
(a)
(a)
(a )
(a )
(a) Restated pursuant to retroactive implementation of the directives of the Supervisor of Banks on capitalization of in-
house software development – see Note 1.A.2.
The accompanying notes are an integral part of the condensed consolidated interim financial statements.
_________________ David Brodet
Chairman of the
Board of Directors
_________________
Rakefet Russak-Aminoach
President and Chief
Executive Officer
_____________________
Yoav Nardi
Director
_____________________
Ron Fainaro First Executive Vice President,
Head of Finance Division
_____________________
Zipora Samet
Director
_____________________
Shlomo Goldfarb
First Executive Vice President,
Chief Accounting Officer,
Head of Accounting Division
Date of approval of the financial statements: 18 May 2016
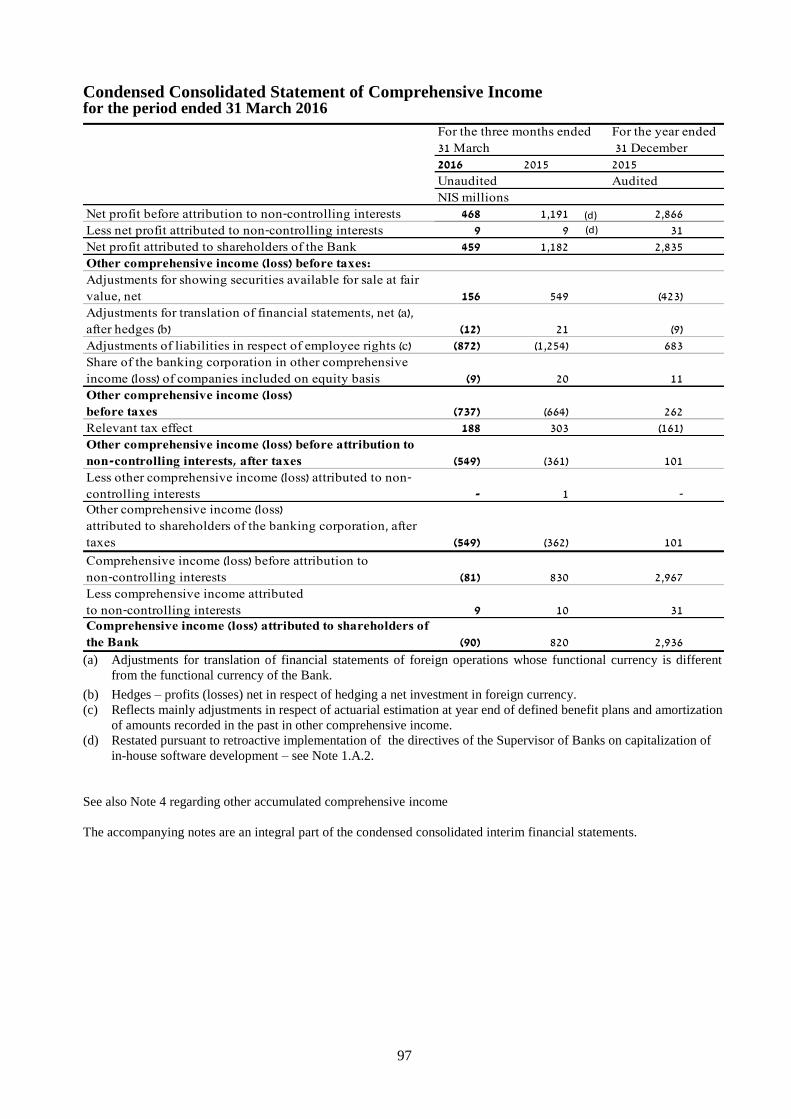
97
Condensed Consolidated Statement of Comprehensive Income for the period ended 31 March 2016
For the year ended
31 December
2016 2015 2015
Audited
NIS millions
Net profit before attribution to non-controlling interests 468 1,191 2,866
Less net profit attributed to non-controlling interests 9 9 31
Net profit attributed to shareholders of the Bank 459 1,182 2,835
Other comprehensive income (loss) before taxes:
Adjustments for showing securities available for sale at fair
value, net 156 549 (423)
Adjustments for translation of financial statements, net (a),
after hedges (b) (12) 21 (9)
Adjustments of liabilities in respect of employee rights (c) (872) (1,254) 683
Share of the banking corporation in other comprehensive
income (loss) of companies included on equity basis (9) 20 11
Other comprehensive income (loss)
before taxes (737) (664) 262
Relevant tax effect 188 303 (161)
Other comprehensive income (loss) before attribution to
non-controlling interests, after taxes (549) (361) 101
Less other comprehensive income (loss) attributed to non-
controlling interests - 1 - Other comprehensive income (loss)
attributed to shareholders of the banking corporation, after
taxes (549) (362) 101
Comprehensive income (loss) before attribution to
non-controlling interests (81) 830 2,967
Less comprehensive income attributed
to non-controlling interests 9 10 31 Comprehensive income (loss) attributed to shareholders of
the Bank (90) 820 2,936
For the three months ended
31 March
Unaudited
(d)
(d)
(a) Adjustments for translation of financial statements of foreign operations whose functional currency is different
from the functional currency of the Bank.
(b) Hedges – profits (losses) net in respect of hedging a net investment in foreign currency.
(c) Reflects mainly adjustments in respect of actuarial estimation at year end of defined benefit plans and amortization
of amounts recorded in the past in other comprehensive income.
(d) Restated pursuant to retroactive implementation of the directives of the Supervisor of Banks on capitalization of
in-house software development – see Note 1.A.2.
See also Note 4 regarding other accumulated comprehensive income
The accompanying notes are an integral part of the condensed consolidated interim financial statements.
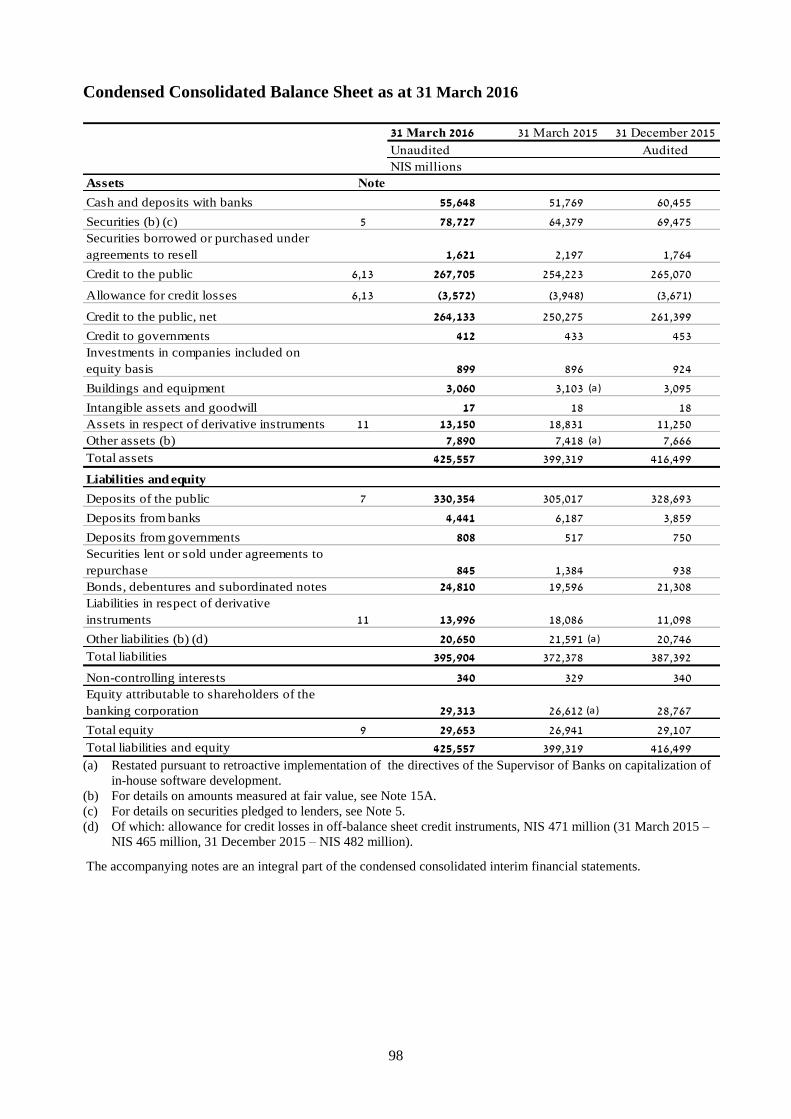
98
Condensed Consolidated Balance Sheet as at 31 March 2016
31 March 2016 31 March 2015 31 December 2015
Unaudited Audited
NIS millions
Assets Note
Cash and deposits with banks 55,648 51,769 60,455
Securities (b) (c) 5 78,727 64,379 69,475
Securities borrowed or purchased under
agreements to resell 1,621 2,197 1,764
Credit to the public 6,13 267,705 254,223 265,070
Allowance for credit losses 6,13 (3,572) (3,948) (3,671)
Credit to the public, net 264,133 250,275 261,399
Credit to governments 412 433 453
Investments in companies included on
equity basis 899 896 924
Buildings and equipment 3,060 3,103 3,095
Intangible assets and goodwill 17 18 18
Assets in respect of derivative instruments 11 13,150 18,831 11,250
Other assets (b) 7,890 7,418 7,666
Total assets 425,557 399,319 416,499
Liabilities and equity
Deposits of the public 7 330,354 305,017 328,693
Deposits from banks 4,441 6,187 3,859
Deposits from governments 808 517 750
Securities lent or sold under agreements to
repurchase 845 1,384 938
Bonds, debentures and subordinated notes 24,810 19,596 21,308
Liabilities in respect of derivative
instruments 11 13,996 18,086 11,098
Other liabilities (b) (d) 20,650 21,591 20,746
Total liabilities 395,904 372,378 387,392
Non-controlling interests 340 329 340
Equity attributable to shareholders of the
banking corporation 29,313 26,612 28,767
Total equity 9 29,653 26,941 29,107
Total liabilities and equity 425,557 399,319 416,499
(a)
(a)
(a)
(a)
(a) Restated pursuant to retroactive implementation of the directives of the Supervisor of Banks on capitalization of
in-house software development.
(b) For details on amounts measured at fair value, see Note 15A.
(c) For details on securities pledged to lenders, see Note 5.
(d) Of which: allowance for credit losses in off-balance sheet credit instruments, NIS 471 million (31 March 2015 –
NIS 465 million, 31 December 2015 – NIS 482 million).
The accompanying notes are an integral part of the condensed consolidated interim financial statements.
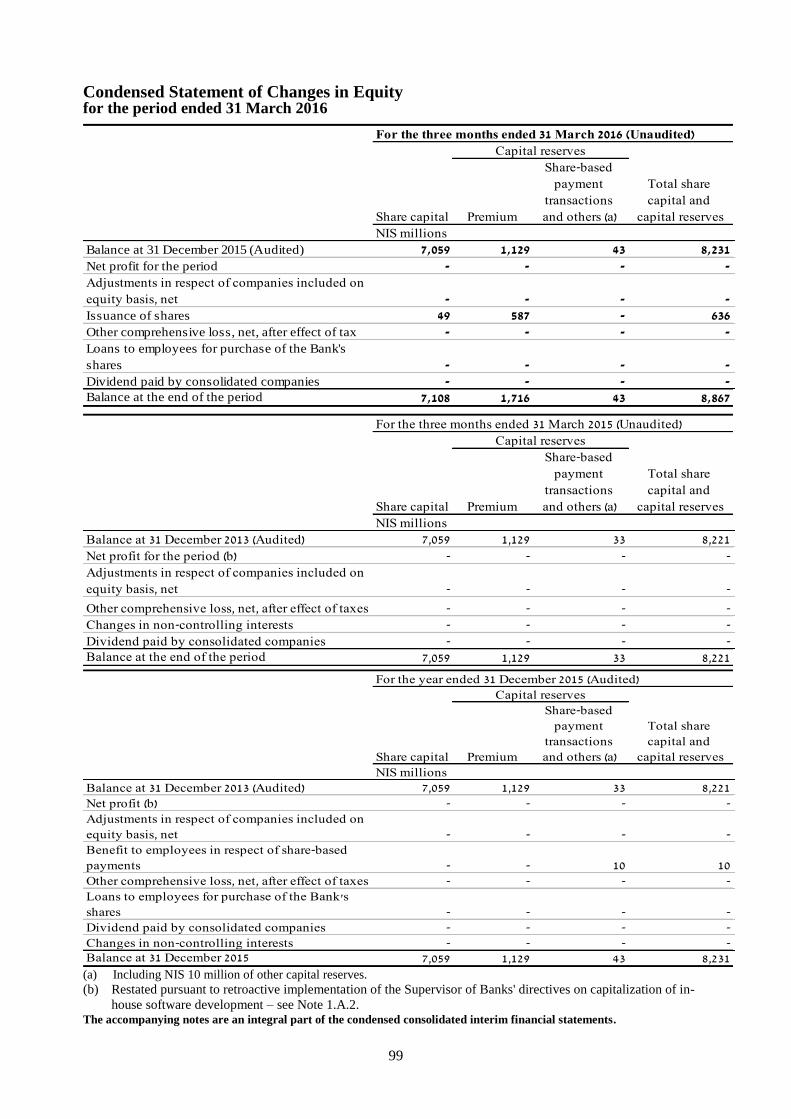
99
Condensed Statement of Changes in Equity for the period ended 31 March 2016
For the three months ended 31 March 2016 (Unaudited)
Share capital Premium
Share-based
payment
transactions
and others (a)
Total share
capital and
capital reserves
NIS millions
Balance at 31 December 2015 (Audited) 7,059 1,129 43 8,231
Net profit for the period - - - -
Adjustments in respect of companies included on
equity basis, net - - - -
Issuance of shares 49 587 - 636
Other comprehensive loss, net, after effect of tax - - - -
Loans to employees for purchase of the Bank's
shares - - - -
Dividend paid by consolidated companies - - - -Balance at the end of the period 7,108 1,716 43 8,867
Capital reserves
For the three months ended 31 March 2015 (Unaudited)
Share capital Premium
Share-based
payment
transactions
and others (a)
Total share
capital and
capital reserves
NIS millions
Balance at 31 December 2013 (Audited) 7,059 1,129 33 8,221
Net profit for the period (b) - - - -
Adjustments in respect of companies included on
equity basis, net - - - -
Other comprehensive loss, net, after effect of taxes - - - -
Changes in non-controlling interests - - - -
Dividend paid by consolidated companies - - - -Balance at the end of the period 7,059 1,129 33 8,221
Capital reserves
For the year ended 31 December 2015 (Audited)
Share capital Premium
Share-based
payment
transactions
and others (a)
Total share
capital and
capital reserves
NIS millions
Balance at 31 December 2013 (Audited) 7,059 1,129 33 8,221
Net profit (b) - - - -
Adjustments in respect of companies included on
equity basis, net - - - -
Benefit to employees in respect of share-based
payments - - 10 10
Other comprehensive loss, net, after effect of taxes - - - -
Loans to employees for purchase of the Bank's
shares - - - -
Dividend paid by consolidated companies - - - -
Changes in non-controlling interests - - - -Balance at 31 December 2015 7,059 1,129 43 8,231
Capital reserves
(a) Including NIS 10 million of other capital reserves.
(b) Restated pursuant to retroactive implementation of the Supervisor of Banks' directives on capitalization of in-
house software development – see Note 1.A.2. The accompanying notes are an integral part of the condensed consolidated interim financial statements.

100
Condensed Consolidated Statement of Changes in Equity for the period ended 31 March 2016
Accumulated other
comprehensive
income (loss)
Retained
earnings
Loans to
employees for
purchase of the
Bank's shares Total
Non-
controlling
interests Total capital
(1,448) 21,984 - 28,767 340 29,107
- 459 - 459 9 468
- - - - - -
- - - 636 - 636
(549) - - (549) - (549)
- - - - - -
- - - - (9) (9)
(1,997) 22,443 - 29,313 340 29,653
Accumulated other
comprehensive
income (loss)
Retained
earnings
Loans to
employees for
purchase of the
Bank's shares Total
Non-
controlling
interests Total capital
(1,549) 19,168 (42) 25,798 340 26,138
- 1,182 - 1,182 9 1,191
- (5) - (5) - (5)
(362) - - (362) 1 (361)
- (1) - (1) (21) (22)
- - - - - -
(1,911) 20,344 (42) 26,612 329 26,941
Accumulated other
comprehensive
income (loss)
Retained
earnings
Loans to
employees for
purchase of the
Bank's shares Total
Non-
controlling
interests Total capital
(1,549) 19,168 (42) 25,798 340 26,138
- 2,835 - 2,835 31 2,866
- (19) - (19) - (19)
- - - 10 - 10
101 - - 101 - 101
- - 42 42 - 42
- - - - (10) (10)
- - - - (21) (21)
(1,448) 21,984 - 28,767 340 29,107

101
Condensed Consolidated Statement of Cash Flows for the period ended 31 March 2016
For the year
ended
31 December
2016 2015 2015
(Audited)
(NIS millions)
Cash flows generated by operating activity
Net profit for the period 468 1,191 2,866
Adjustments:
Group share in undistributed losses (profits) of companies included on equity basis
(a) 6 703 666
Depreciation of buildings and equipment (including impairment) 145 162 655
Amortization - 35 45
Expenses (income) in respect of credit losses (123) 81 199
Losses (profits) on assets transferred to Group ownership - - 3
Profit from sale of credit portfolio - - (11)
Profits on sale of securities available for sale (including impairment) (91) (606) (1,075)
Realized and unrealized gain from adjustment to fair value of securities held for
trading 14 (269) (62)
Gain on realization of investment in companies included on equity basis - (522) (522)
Gain on realization of buildings and equipment 1 (4) (485)
Provision for impairment of shares available for sale 1 - 283
Expenses deriving from share-based payment transactions - - 10
Deferred taxes , net (173) (117) (278)
Change in plan assets, net, in respect of employee rights 101 191 491
Interest received in excess of accumulated interest (not yet received) for debentures
available for sale 160 95 118
Interest not yet paid for debentures and subordinated notes 88 (43) 722
Effect of exchange-rate differences on balances of cash and cash equivalents 227 (84) 6
Other, net 11 (21) 13
Net change in current assets:
Deposits in banks (1,508) 240 2,773
Credit to the public (3,166) 2,380 (9,307)
Credit to governments 41 96 76
Securities borrowed or purchased under
agreements to resell 143 (197) 236
Assets in respect of derivative instruments (1,901) (1,916) 5,664
Securities held for trading 2,163 1,111 1,112
Other assets 62 (513) (807)
Net change in current liabilities:
Deposits from banks 651 1,611 (708)
Deposits of the public 2,343 966 24,931
Deposits from governments 78 42 275
Securities lent or sold under agreements to repurchase (93) 146 (300)
Liabilities in respect of derivative instruments 2,848 2,418 (4,538)
Other liabilities (847) (1,222) (869)
Net cash generated by operating activity 1,649 5,954 22,182
For the three months
ended 31 March
(Unaudited)
(b)
(b)
(c)
(b)
c
(b)
(b)
(b)
(b)
(a) Less dividend received.
(b) Restated pursuant to retroactive implementation of the directives of the Supervisor of Banks on capitalization of
in-house software development – see Note 1.A.2.
The accompanying notes are an integral part of the condensed consolidated interim financial statements.
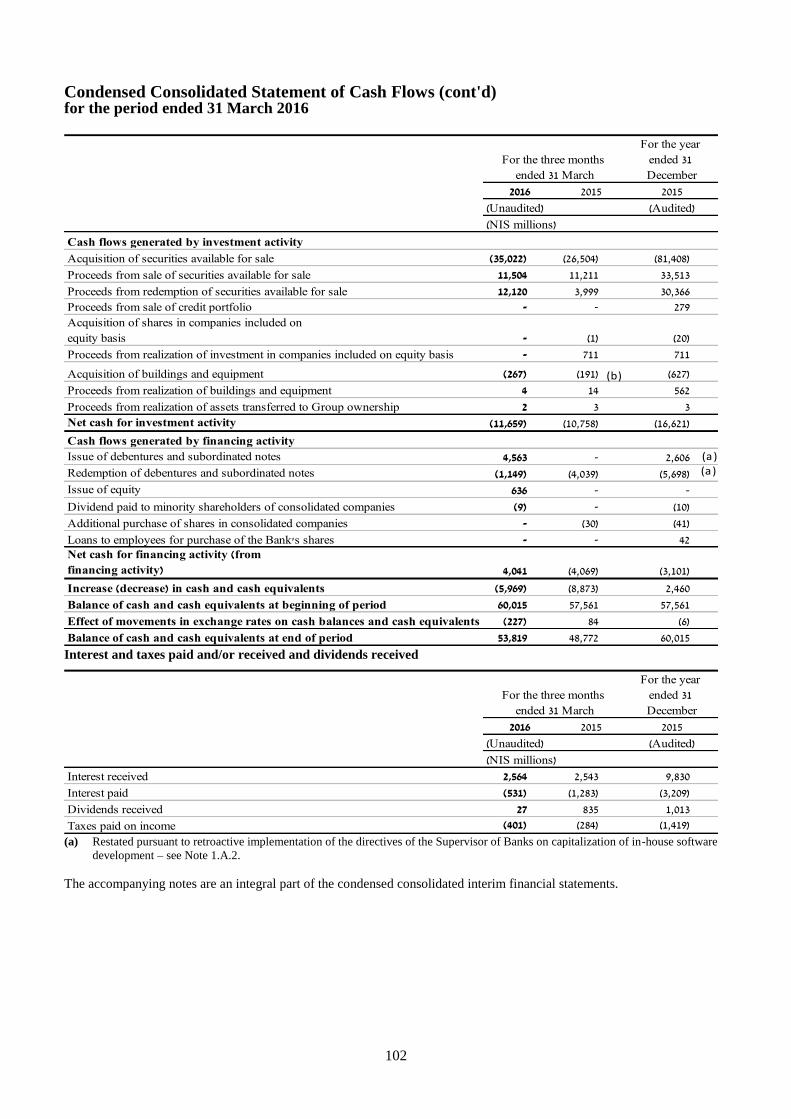
102
Condensed Consolidated Statement of Cash Flows (cont'd) for the period ended 31 March 2016
For the year
ended 31
December
2016 2015 2015
(Audited)
(NIS millions)
Cash flows generated by investment activity
Acquisition of securities available for sale (35,022) (26,504) (81,408)
Proceeds from sale of securities available for sale 11,504 11,211 33,513
Proceeds from redemption of securities available for sale 12,120 3,999 30,366
Proceeds from sale of credit portfolio - - 279
Acquisition of shares in companies included on
equity basis - (1) (20)
Proceeds from realization of investment in companies included on equity basis - 711 711
Acquisition of buildings and equipment (267) (191) (627)
Proceeds from realization of buildings and equipment 4 14 562
Proceeds from realization of assets transferred to Group ownership 2 3 3
Net cash for investment activity (11,659) (10,758) (16,621)
Cash flows generated by financing activity
Issue of debentures and subordinated notes 4,563 - 2,606
Redemption of debentures and subordinated notes (1,149) (4,039) (5,698)
Issue of equity 636 - -
Dividend paid to minority shareholders of consolidated companies (9) - (10)
Additional purchase of shares in consolidated companies - (30) (41)
Loans to employees for purchase of the Bank's shares - - 42Net cash for financing activity (from
financing activity) 4,041 (4,069) (3,101)
Increase (decrease) in cash and cash equivalents (5,969) (8,873) 2,460
Balance of cash and cash equivalents at beginning of period 60,015 57,561 57,561
Effect of movements in exchange rates on cash balances and cash equivalents (227) 84 (6)
Balance of cash and cash equivalents at end of period 53,819 48,772 60,015
For the three months
ended 31 March
(Unaudited)
(a )
(b)
(a)
Interest and taxes paid and/or received and dividends received
For the year
ended 31
December
2016 2015 2015
(Audited)
(NIS millions)
Interest received 2,564 2,543 9,830
Interest paid (531) (1,283) (3,209)
Dividends received 27 835 1,013
Taxes paid on income (401) (284) (1,419)
(Unaudited)
For the three months
ended 31 March
(a) Restated pursuant to retroactive implementation of the directives of the Supervisor of Banks on capitalization of in-house software
development – see Note 1.A.2.
The accompanying notes are an integral part of the condensed consolidated interim financial statements.

103
Condensed Consolidated Statement of Cash Flows (cont'd) for the period ended 31 March 2016
Appendix A – Investment and financing activities not in cash:
For the year ended 31 December 2015:
During the year, fixed assets were acquired against a liability to suppliers in the amount of NIS 37 million.
The accompanying notes are an integral part of the condensed consolidated interim financial statements.

104
Index to Notes Page
1 Significant accounting policies 113
2 Interest income and expenses 119
3 Non-interest financing income 120
4 Accumulated other comprehensive income (loss) 121
5 Securities 123
6 Credit risk, credit to the public and allowance for credit losses 136
7 Deposits of the public 140
8 Employee rights 141
9A Capital 151
9B Capital adequacy, Leverage and Liquidity 153
10 Contingent liabilities and special commitments 160
11 Activity in derivative instruments – total, credit risks and maturities 169
12A Regulatory operating segments 179
12B Operating segments – Management Approach 185
13 Additional information on credit risk, credit to the public and the allowance for credit losses 187
14 Assets and liabilities by linkage basis 205
15 Balances and fair value estimates of financial instruments 208
16 Events after the balance sheet date 226

105
Note 1 - Significant Accounting Policies
A. Basis for preparation of the financial statements
1. Reporting principles
The condensed consolidated interim financial statements as at 30 September 2015 have been
prepared in accordance with generally accepted accounting principles in Israel (Israeli GAAP)
for financial reporting of interim periods and in accordance with the directives and instructions
of the Supervisor of Banks regarding the preparation of quarterly financial statements of a
banking corporation.
In most matters, these directives are based on US GAAP. In other subjects that are less material,
the directives are based on certain International Financial Reporting Standards (IFRS),
interpretations of the International Financial Reporting Interpretations Committee (IFRIC) and
Israeli GAAP.
When International Financial Reporting Standards (IFRS) allow a number of alternatives, or do
not include a specific reference to a certain situation, specific instructions for implementation
have been determined in the directives of the Supervisor of Banks that are based mainly on US
GAAP.
The accounting principles used in preparing the interim reports are consistent with those
used in preparing the audited financial statements as at 31 December 2015, except for that
stated in paragraph B below. These statements should be read in conjunction with the annual
financial statements as at 31 December 2015 and the accompanying notes. The condensed
consolidated interim financial statements were approved for publication by the Board of
Directors on 18 May 2016.
2. Use of estimates
When preparing the financial statements, in accordance with generally accepted accounting
principles in Israel (Israeli GAAP) and directives and guidelines of the Supervisor of Banks,
management is required to use estimates, evaluations and their discretion affecting the reported
amounts of assets and liabilities, the disclosure relating to contingent assets and liabilities and
amounts of income and expenses during the reporting period. It should be made clear that
actual results may differ from such estimates.
When formulating accounting estimates used in preparing the Bank’s financial statements, Bank
management has to make assumptions concerning circumstances and events which involve
significant uncertainty. In its consideration of the estimates, Bank management bases itself on
past experience, various facts, external factors, and on reasonable assumptions in accordance
with circumstances appropriate to each estimate.
Changes in estimates
The estimates and the assumptions on which they are based are reviewed on a routine basis.
Changes in accounting estimates are recognized in the period in which the estimates were
amended and for each period affected in the future.

106
Restatement
As mentioned in Note 1.D.2 to the 2015 financial statements, the Bank implemented the
instructions of the Supervisor of Banks regarding capitalization of in-house software
development costs, as set forth in his letter of 2 June 2015.
Below is the effect of implementation as at 31 March 2016:
NIS millions
Buildings and equipment 3,651 (548) 3,103
Other assets 7,216 202 7,418
Retained earnings 20,690 (346) 20,344Capital attributed to shareholders of the Bank 26,958 (346) 26,612
Unaudited
As at 31 March 2015
Pursuant to
the previous
reporting
directives (a)
Pursuant to
the new
rules on
employee
rights and
capital-
ization of
software
costs
Effect of the
new rules
on capital-
ization of
software
costs
NIS millions
Profit and loss
Salaries and related expenses 1,403 15 1,418
Maintenance and depreciation of buildings and
equipment 455 (34) 421
Provision for taxes on the profit 557 8 565
Profit attributed to shareholders of the Bank 1,171 11 1,182Basic and diluted profit per share 0.80 - 0.80
For the three months ended
31 March 2015Pursuant to
the new
rules on
employee
rights and
capital-
ization of
software
Unaudited
Pursuant to
the previous
reporting
directives (a)
Effect of the
new rules
on capital-
ization of
software
costs
(a) Including non-material amounts in respect of first time adoption of the Standard on employee rights.

107
B. First-time Implementation of Accounting Standards, Updates to Accounting Standards, and
Directives of the Banking Supervision Department
For reporting periods commencing 1 January 2016, the Bank implements the accounting standards
and directives set out below:
1. Regulatory Operating Segments and Geographical Areas
On 3 November 2014 a circular was published concerning the reporting on operating segments and
an FAQ for implementation. On 10 September 2015, an update was published of the FAQ.
The circular updates the Public Reporting Directives including changing some definitions and
guidelines, according to which banks are required to classify customers in regulatory segments and
update their reports.
The amendments to the directives were intended to require reporting on operating segments in
accordance with the uniform and comparable format prescribed by the Banking Supervision
Department. In addition, the circular states that the disclosure of "operating segments in accordance
with the management approach" will be provided in accordance with generally accepted accounting
principles in US banks on operating segments (included in ASC 280) if there is a fundamental
difference between the management approach and reporting segments according to the guidelines
of the Supervisor.
In the 2015 financial statements, there is a disclosure applying to regulatory operational segments
related to balance sheet data only as required in the directive. As of the financial statements for
the first quarter of 2016, full disclosure is given under the new rules, except for the disclosure of
the financial management sector. Comparative figures have been adjusted retroactively.
For purposes of presenting comparative figures, it is possible to use the customer classification into
regulatory segments as of 1 January 2016.
From the financial statements for the first quarter of 2017, the requirements of the circular are
required to be implemented in their entirety.
Implementation of the directive is not expected to have a material effect on the financial statements
except for the manner of presentation and disclosure.
2. The application of generally accepted accounting principles in the US related to business
combinations, consolidation of financial statements and investments in investee companies
On 10 June 2015, a circular was issued on "Reporting by Banking Corporations and Credit Card
Companies in Israel under US GAAP relating to Business Combinations, Consolidation of
Financial Statements and Investments in Investee Companies".
Pursuant to the circular, US GAAP is to be implemented on the following issues:
• Rules for the presentation, measurement and disclosure set out in the provisions of
Codification Topic 805 on "Business Combinations".
• Provisions of Codification Topic 810 on "Consolidation of Financial Statements".
Below are the main points of the directive:
Potential rights - potential rights are not to be taken into account
Uniform accounting policies – the Group's financial statements should be prepared in
accordance with US GAAP.
Non-controlling interests - should be measured at fair value, are included in equity and
presented separately from the equity attributable to the parent company.

108
• Provisions of Topic 350-20 on the subject of "Intangible Assets - Goodwill and Other Assets"
in connection with the accounting treatment of impairment of goodwill acquired in a business
combination.
For purposes of assessing impairment, it should be examined if there is a difference between
the book value of the reporting unit in respect of which the goodwill was created and its fair
value. If there is a gap, the impairment in respect of goodwill will be recognized in the amount
of the difference between the fair value and book value up to the canceling out of the value of
goodwill in the books.
• US GAAP on the subject of investee companies, including rules for the presentation,
measurement and disclosure and guidelines relating to impairment set out in the provisions of
Codification Topic 323, "Investments - Equity Method and Joint Investments."
Measurement - the entity can choose to handle the investments in investees at fair value rather
than by the equity method.
Below are the main points of the directive:
A decrease in the percentage holding - when there is a decrease in the holding, irrespective of
the question if the company has lost significant influence or not, the amount of the difference
between the proceeds of sale to pro rata share of amortized cost that was sold should be
recognized in profit or loss. When there is a loss of significant influence, the rights remaining
in the investment will be shown at the book value of the investment prior to the change.
Impairment - the excess of the amortized cost of the investment over its fair value. An other
than temporary impairment recognized will not be cancelled in future periods.
Losses - as a general rule, the investor is to stop implementing the equity method after
recognizing losses in the investee up to the canceling out of the investment, while in
subsequent periods the investor will again apply the equity method only after canceling out the
losses not recognized. However, the investor is to recognize further loss when the investee's
return to profitability in the near future is guaranteed.
Uniform accounting policies – the investor and investee should apply US GAAP.
• Pursuant to the transitional directives, it is permitted in the years 2016-2017 not to carry out
adjustments to the accounting policy adopted by a non-banking company included on equity
basis that prepares its financial statements according to IFRS.
• Pursuant to the transitional directives, it is permitted in the years 2016-2017 not to carry out
adjustments to the accounting policy adopted by a non-banking company included on equity
basis that prepares its financial statements according to IFRS.
Initial implementation was carried out in accordance with the transitional provisions set out in the
same subjects in US GAAP.
The Bank applies the directive as of 1 January 2016 by way of retroactive implementation.
Implementation of the directive had no material effect on the financial statements.
3. US GAAP on intangible assets
On 22 October 2015, a circular was published on "Implementation of US GAAP on intangible
assets". Pursuant to the circular, a banking corporation will implement US GAAP on the subject,
and inter alia the rules for presentation, measurement and disclosure set out in the directives of
Codification Topic 350 on "Intangible assets – goodwill and others".
Below are the main points of the directive:
Impairment of intangible assets with a finite life – the test will be made at the level of a group of
assets (a very limited level of a group of assets that generates cash flow separately).

109
It should be examined if the book value of the asset group is higher than the sum of non-discounted
cash flows expected from it. If so, impairment is to be recognized equal to the difference between
the book value and the fair value of the asset group.
Impairment of intangible assets with an indefinite useful life – the test will be made at least
annually. If the book value exceeds its fair value, impairment is to be recognized in the amount that
the book value exceeds the fair value.
Reversal of impairment loss - as a general rule, losses cannot be cancelled from impairment of
intangible assets.
Capitalization of costs in creating an intangible asset – as a general rule, these will be recognized as
an expense when incurred except in cases where there are other specific guidelines such as
regarding software development costs for internal use.
The Bank applies the directive as of 1 January 2016, by way of retroactive implementation.
Implementation of the directive had no material effect on the financial statements.
C. New Accounting Standards and New Directives of the Supervisor of Banks in the period prior to
their implementation
1. Recognition of income from contracts with customers
On 11 January 2015, a circular was issued on the adoption of updated accounting rules on the
subject of income from contracts with customers. The circular updates the Public Reporting
Directives in light of publishing ASU 2014-09, which adopts in US GAAP a new Standard on
recognition of income. The Standard states that income will be recognized in the amount expected
to be received in exchange for the transfer of goods or services to the customer.
Banks are required to implement the amendments to the Public Reporting Directives pursuant to
the transitional provisions as of 1 January 2018.
In accordance with the transitional provisions, determined for purposes of initial adoption, it is
possible to choose between the alternative of retrospective implementation while restating
comparative figures and the alternative of prospective application while recording the cumulative
effect on equity at the time of initial application.
The new Standard does not apply, inter alia, to financial instruments and rights or contractual
obligations within the scope of Codification Chapter 310. It is explained in the Bank of Israel
directives that as a general rule, the provisions of the new Standard will not apply to the accounting
treatment of interest income and expenses and non-interest financing income.
The Bank has not yet begun to examine the impact of the Standard on its financial statements and
has not yet chosen the alternative for implementation of the transitional provisions.
2. Implementation of US GAAP on taxes on income
On 22 October 2015, a circular was published on "Implementation of US GAAP on taxes on
income". Pursuant to the circular, a banking corporation will implement US GAAP on the subject,
and inter alia the rules for presentation, measurement and disclosure set out in the directives of
Codification Topic 740 on "Taxes on income" and Codification Topic 740-830 on "Foreign
Currency Issues - Taxes on Income".
The instructions of the circular are to be implemented as of 1 January 2017 including retroactive
adjustment of the comparative figures.
The Bank is examining the effect of adopting the above rules on the financial statements.
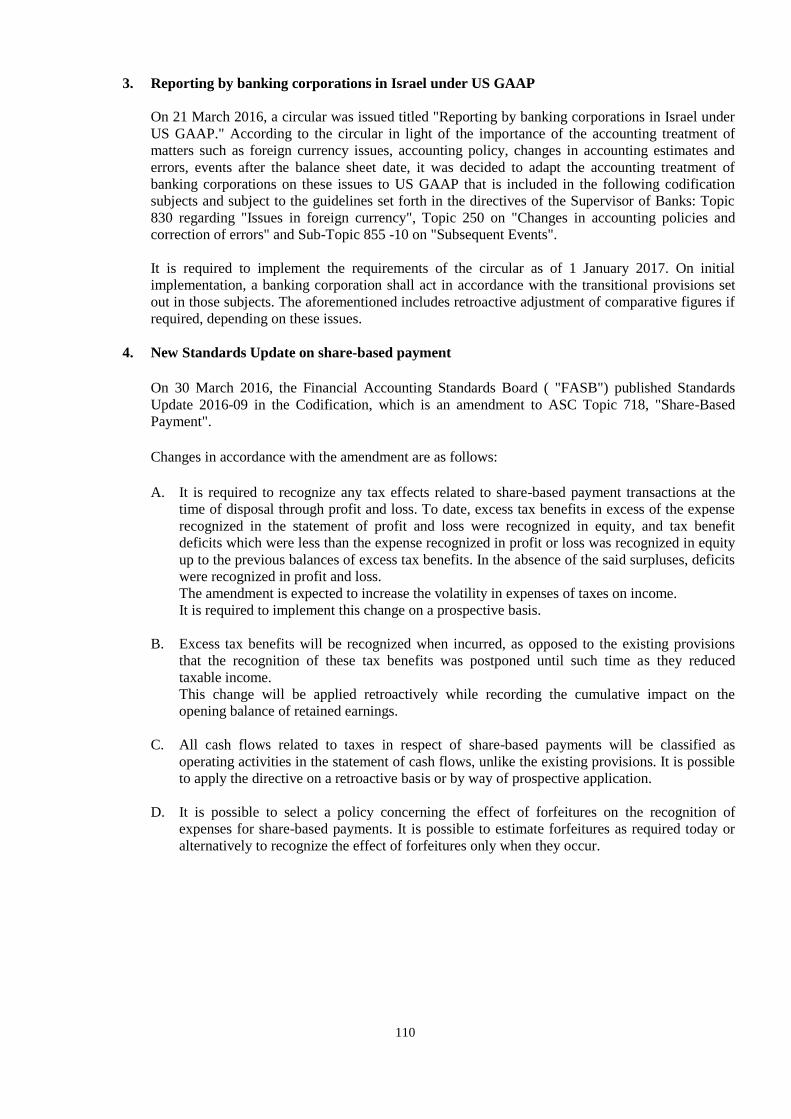
110
3. Reporting by banking corporations in Israel under US GAAP
On 21 March 2016, a circular was issued titled "Reporting by banking corporations in Israel under
US GAAP." According to the circular in light of the importance of the accounting treatment of
matters such as foreign currency issues, accounting policy, changes in accounting estimates and
errors, events after the balance sheet date, it was decided to adapt the accounting treatment of
banking corporations on these issues to US GAAP that is included in the following codification
subjects and subject to the guidelines set forth in the directives of the Supervisor of Banks: Topic
830 regarding "Issues in foreign currency", Topic 250 on "Changes in accounting policies and
correction of errors" and Sub-Topic 855 -10 on "Subsequent Events".
It is required to implement the requirements of the circular as of 1 January 2017. On initial
implementation, a banking corporation shall act in accordance with the transitional provisions set
out in those subjects. The aforementioned includes retroactive adjustment of comparative figures if
required, depending on these issues.
4. New Standards Update on share-based payment
On 30 March 2016, the Financial Accounting Standards Board ( "FASB") published Standards
Update 2016-09 in the Codification, which is an amendment to ASC Topic 718, "Share-Based
Payment".
Changes in accordance with the amendment are as follows:
A. It is required to recognize any tax effects related to share-based payment transactions at the
time of disposal through profit and loss. To date, excess tax benefits in excess of the expense
recognized in the statement of profit and loss were recognized in equity, and tax benefit
deficits which were less than the expense recognized in profit or loss was recognized in equity
up to the previous balances of excess tax benefits. In the absence of the said surpluses, deficits
were recognized in profit and loss.
The amendment is expected to increase the volatility in expenses of taxes on income.
It is required to implement this change on a prospective basis.
B. Excess tax benefits will be recognized when incurred, as opposed to the existing provisions
that the recognition of these tax benefits was postponed until such time as they reduced
taxable income.
This change will be applied retroactively while recording the cumulative impact on the
opening balance of retained earnings.
C. All cash flows related to taxes in respect of share-based payments will be classified as
operating activities in the statement of cash flows, unlike the existing provisions. It is possible
to apply the directive on a retroactive basis or by way of prospective application.
D. It is possible to select a policy concerning the effect of forfeitures on the recognition of
expenses for share-based payments. It is possible to estimate forfeitures as required today or
alternatively to recognize the effect of forfeitures only when they occur.
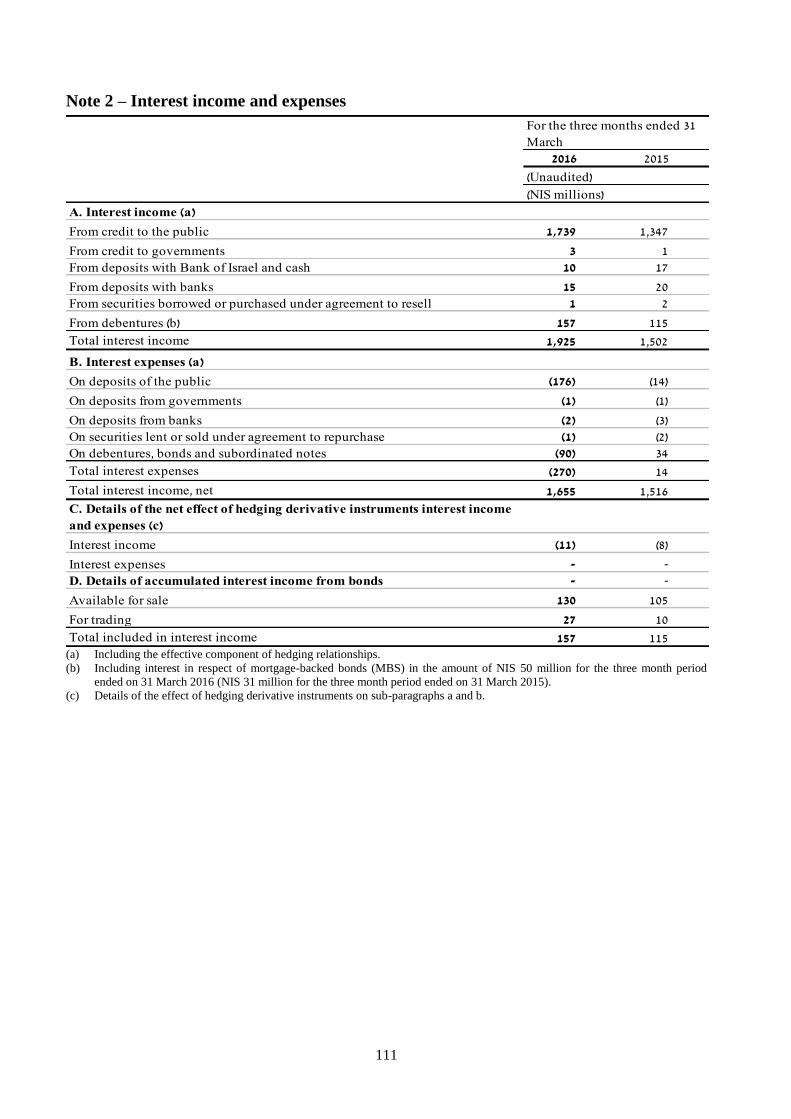
111
Note 2 – Interest income and expenses
2016 2015
(Unaudited)
(NIS millions)
A. Interest income (a)
From credit to the public 1,739 1,347
From credit to governments 3 1
From deposits with Bank of Israel and cash 10 17
From deposits with banks 15 20
From securities borrowed or purchased under agreement to resell 1 2
From debentures (b) 157 115
Total interest income 1,925 1,502
B. Interest expenses (a)
On deposits of the public (176) (14)
On deposits from governments (1) (1)
On deposits from banks (2) (3)
On securities lent or sold under agreement to repurchase (1) (2)
On debentures, bonds and subordinated notes (90) 34
Total interest expenses (270) 14
Total interest income, net 1,655 1,516
C. Details of the net effect of hedging derivative instruments interest income
and expenses (c)
Interest income (11) (8)
Interest expenses - -
D. Details of accumulated interest income from bonds - -
Available for sale 130 105
For trading 27 10
Total included in interest income 157 115
For the three months ended 31
March
(a) Including the effective component of hedging relationships.
(b) Including interest in respect of mortgage-backed bonds (MBS) in the amount of NIS 50 million for the three month period
ended on 31 March 2016 (NIS 31 million for the three month period ended on 31 March 2015).
(c) Details of the effect of hedging derivative instruments on sub-paragraphs a and b.
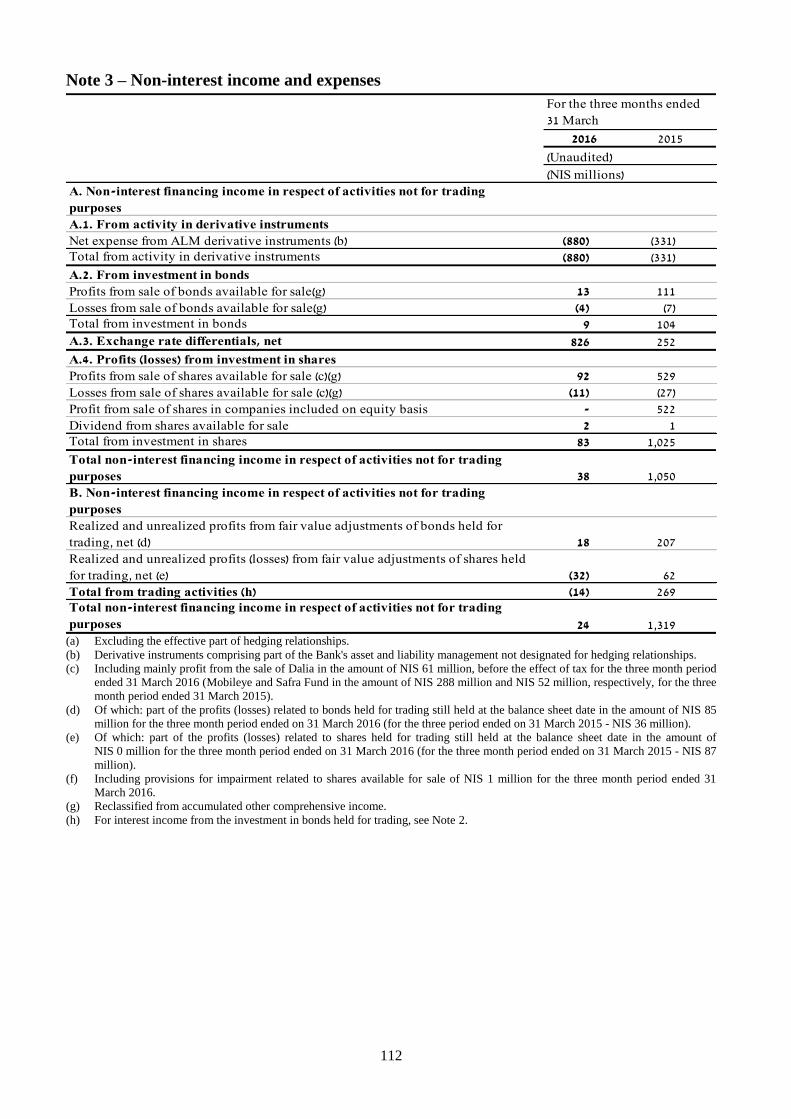
112
Note 3 – Non-interest income and expenses
2016 2015
(Unaudited)
(NIS millions)
A. Non-interest financing income in respect of activities not for trading
purposes
A.1. From activity in derivative instruments
Net expense from ALM derivative instruments (b) (880) (331)Total from activity in derivative instruments (880) (331)
A.2. From investment in bonds
Profits from sale of bonds available for sale(g) 13 111
Losses from sale of bonds available for sale(g) (4) (7)Total from investment in bonds 9 104
A.3. Exchange rate differentials, net 826 252
A.4. Profits (losses) from investment in shares
Profits from sale of shares available for sale (c)(g) 92 529
Losses from sale of shares available for sale (c)(g) (11) (27)
Profit from sale of shares in companies included on equity basis - 522
Dividend from shares available for sale 2 1Total from investment in shares 83 1,025
Total non-interest financing income in respect of activities not for trading
purposes 38 1,050
B. Non-interest financing income in respect of activities not for trading
purposes
Realized and unrealized profits from fair value adjustments of bonds held for
trading, net (d) 18 207
Realized and unrealized profits (losses) from fair value adjustments of shares held
for trading, net (e) (32) 62
Total from trading activities (h) (14) 269Total non-interest financing income in respect of activities not for trading
purposes 24 1,319
For the three months ended
31 March
(a) Excluding the effective part of hedging relationships.
(b) Derivative instruments comprising part of the Bank's asset and liability management not designated for hedging relationships.
(c) Including mainly profit from the sale of Dalia in the amount of NIS 61 million, before the effect of tax for the three month period
ended 31 March 2016 (Mobileye and Safra Fund in the amount of NIS 288 million and NIS 52 million, respectively, for the three
month period ended 31 March 2015).
(d) Of which: part of the profits (losses) related to bonds held for trading still held at the balance sheet date in the amount of NIS 85
million for the three month period ended on 31 March 2016 (for the three period ended on 31 March 2015 - NIS 36 million).
(e) Of which: part of the profits (losses) related to shares held for trading still held at the balance sheet date in the amount of
NIS 0 million for the three month period ended on 31 March 2016 (for the three month period ended on 31 March 2015 - NIS 87
million).
(f) Including provisions for impairment related to shares available for sale of NIS 1 million for the three month period ended 31
March 2016.
(g) Reclassified from accumulated other comprehensive income.
(h) For interest income from the investment in bonds held for trading, see Note 2.

113
Note 4 – Accumulated Other Comprehensive Income (Loss)
A. Changes in accumulated other comprehensive income (loss), after effect of tax
1. Changes in accumulated other comprehensive income (loss) for the three month period ended
31 March 2016 and 2015
Other comprehensive income (loss) before attribution to non-controlling interests
Adjustments
for
presentation
of securities
available for
sale at fair
value
Translation
adjustments
(a), net
after effect
of hedges
(b)
Banking
corporation's
share in other
comprehensive
income of
investee
companies
dealt with
under the
equity method
Adjustments
in respect of
employee
benefits Total
Other
comprehensive
income
attributed to
non-
controlling
interests
Other
comprehensive
income
attributed to
shareholders
of the Bank
(NIS millions)
Balance at 31 December 2014 394 (65) 22 (1,904) (1,553) (4) (1,549)
Net change in the period 355 40 25 (781) (361) 1 (362)
Balance at 31 March 2015 749 (25) 47 (2,685) (1,914) (3) (1,911)
Balance at 31 December 2015 67 (67) 38 (1,490) (1,452) (4) (1,448)
Net change in the period 96 (44) (9) (592) (549) - (549)
Balance at 31 March 2016 163 (111) 29 (2,082) (2,001) (4) (1,997)
2. Changes in accumulated other comprehensive income (loss) for the year ended 31 December
2015
Other comprehensive income (loss) before attribution to non-controlling interests
Adjustments
for
presentation
of securities
available for
sale at fair
value
Translation
adjustments
(a), net
after effect
of hedges
(b)
Banking
corporation's
share in other
comprehensive
income of
investee
companies
dealt with
under the
equity method
Adjustments
in respect of
employee
benefits Total
Other
comprehensive
income
attributed to
non-
controlling
interests
Other
comprehensive
income
attributed to
shareholders
of the Bank
(NIS millions)
Balance at 31 December 2014 394 (65) 22 (1,904) (1,553) (4) (1,549)
Net change in the period (327) (2) 16 414 101 - 101
Balance at 31 December 2015 67 (67) 38 (1,490) (1,452) (4) (1,448) (a) Adjustments from translation of financial statements of foreign operations whose functional currency differs from the functional
currency of the banking corporation, including adjustments for companies included on equity basis.
(b) Profits (losses), net in respect of a net hedge of investment in foreign currency.

114
Note 4 – Accumulated Other Comprehensive Income (Loss) (cont'd)
B. Changes in components of accumulated other comprehensive income (loss),
before and after effect of tax
Before
tax
Tax
effect
After
tax
Before
tax
Tax
effect
After
tax
Before
tax
Tax
effect
After
tax
(NIS millions)
Changes in components of other
comprehensive income (loss) before
attribution to non-controlling interests:
Adjustments for presentation of securities
available for sale at fair value
Unrealized profits (losses) from adjustments to
fair value 246 (92) 154 1,155 (279) 876 369 (203) 166
(Profits) losses in respect of securities available
for sale reclassified to the statement of profit and
loss (a) (90) 32 (58) (606) 85 (521) (792) 299 (493)
Net change in the period 156 (60) 96 549 (194) 355 (423) 96 (327)
Translation adjustments (b)
Adjustments for translation of financial statements (99) - (99) 71 - 71 9 - 9
Hedges (c) 87 (32) 55 (50) 19 (31) (18) 7 (11)
Net change in the period (12) (32) (44) 21 19 40 (9) 7 (2)
Banking corporation's share in other
comprehensive income of investee companies dealt
with under the equity base method (9) - (9) 20 5 25 11 5 16
Net change in the period (9) - (9) 20 5 25 11 5 16
Employee benefits (c)
Actuarial loss (profit) in the period (926) 299 (627) (1,319) 498 (821) 464 (190) 274
Amortization of actuarial profit (loss) 54 (19) 35 65 (25) 40 219 (79) 140
Net change in the period (d) (872) 280 (592) (1,254) 473 (781) 683 (269) 414
Total net change in the period (737) 188 (549) (664) 303 (361) 262 (161) 101
Changes in components of other comprehensive
income (loss) attributed to non-controlling
interests:
Total net change in the period - - - 1 - 1 - - -
Changes in components of other comprehensive
income (loss) attributed to shareholders of the
banking corporation:
Total net change in the period (737) 188 (549) (665) 303 (362) 262 (161) 101
2016 2015 2015
For the year ended 31
DecemberFor the three months ended 31 March
((d)
(a) The amount before tax is reported in the statement of profit and loss under non-interest financing. See Note 3 – Non-interest
financing income.
(b) Adjustments from translation of financial statements of foreign operations whose functional currency differs from the functional
currency of the Bank, including adjustments for companies included on equity basis.
(c) Profits (losses), net in respect of a net hedge of investment in foreign currency.
(d) The amount before tax is reported in the statement of profit and loss under salaries and related expenses. For further details, see Note
8 – Employee rights.
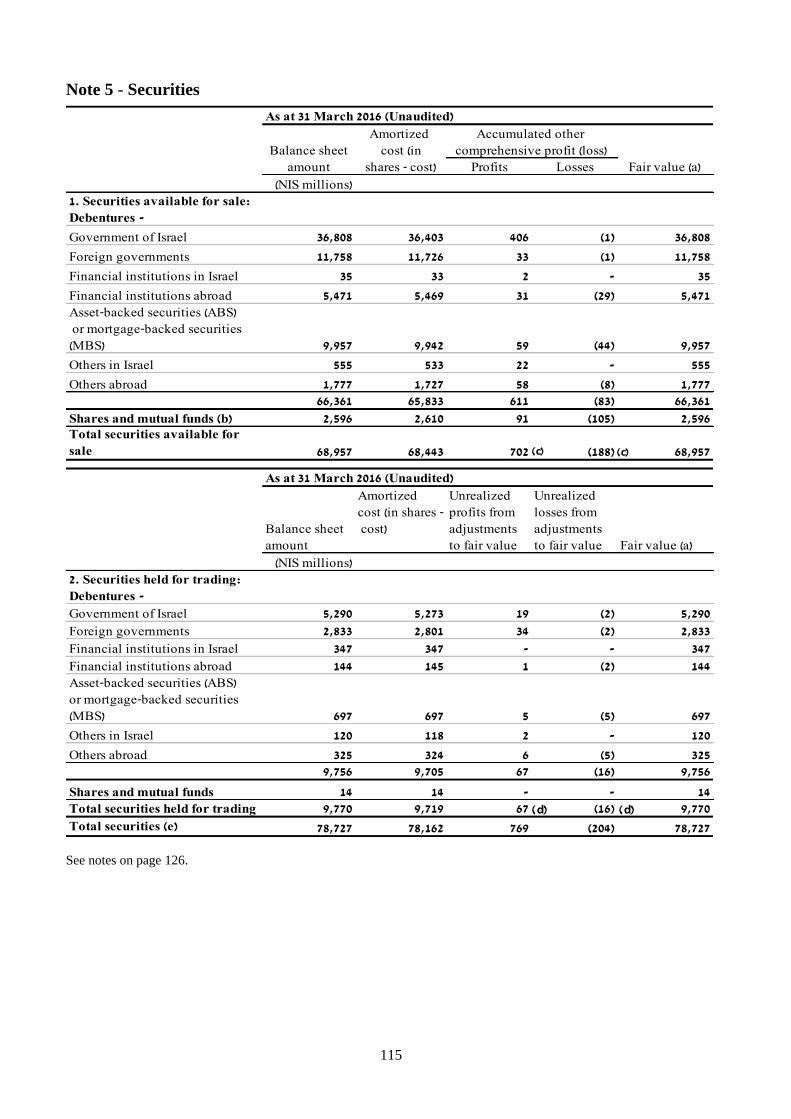
115
Note 5 - Securities
As at 31 March 2016 (Unaudited)
Balance sheet
Amortized
cost (in
amount shares - cost) Profits Losses Fair value (a)
(NIS millions)
1. Securities available for sale:
Debentures -
Government of Israel 36,808 36,403 406 (1) 36,808
Foreign governments 11,758 11,726 33 (1) 11,758
Financial institutions in Israel 35 33 2 - 35
Financial institutions abroad 5,471 5,469 31 (29) 5,471
Asset-backed securities (ABS)
or mortgage-backed securities
(MBS) 9,957 9,942 59 (44) 9,957
Others in Israel 555 533 22 - 555
Others abroad 1,777 1,727 58 (8) 1,777
66,361 65,833 611 (83) 66,361
Shares and mutual funds (b) 2,596 2,610 91 (105) 2,596Total securities available for
sale 68,957 68,443 702 (188) 68,957
As at 31 March 2016 (Unaudited)
Balance sheet
amount
Amortized
cost (in shares -
cost)
Unrealized
profits from
adjustments
to fair value
Unrealized
losses from
adjustments
to fair value Fair value (a)
(NIS millions)
2. Securities held for trading:
Debentures -
Government of Israel 5,290 5,273 19 (2) 5,290
Foreign governments 2,833 2,801 34 (2) 2,833
Financial institutions in Israel 347 347 - - 347
Financial institutions abroad 144 145 1 (2) 144
Asset-backed securities (ABS)
or mortgage-backed securities
(MBS) 697 697 5 (5) 697
Others in Israel 120 118 2 - 120
Others abroad 325 324 6 (5) 325
9,756 9,705 67 (16) 9,756
Shares and mutual funds 14 14 - - 14
Total securities held for trading 9,770 9,719 67 (16) 9,770
Total securities (e) 78,727 78,162 769 (204) 78,727
Accumulated other
comprehensive profit (loss)
c
d d
c
See notes on page 126.
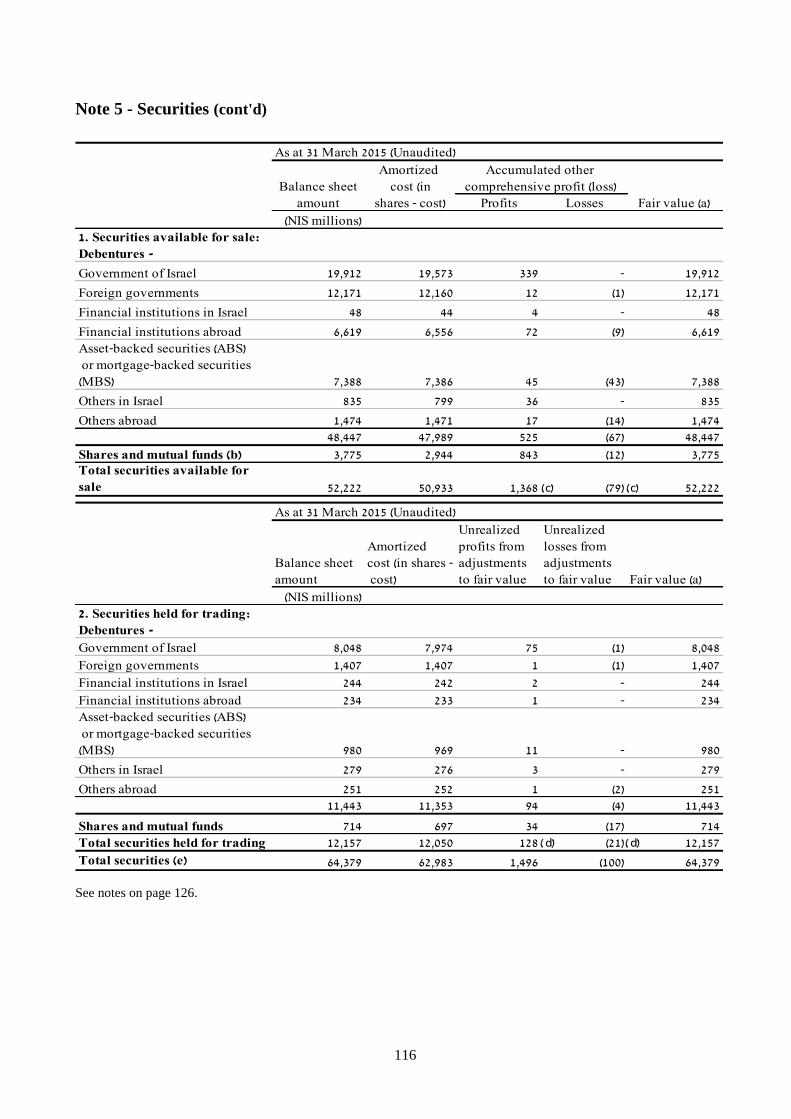
116
Note 5 - Securities (cont'd)
As at 31 March 2015 (Unaudited)
Balance sheet
Amortized
cost (in
amount shares - cost) Profits Losses Fair value (a)
(NIS millions)
1. Securities available for sale:
Debentures -
Government of Israel 19,912 19,573 339 - 19,912
Foreign governments 12,171 12,160 12 (1) 12,171
Financial institutions in Israel 48 44 4 - 48
Financial institutions abroad 6,619 6,556 72 (9) 6,619
Asset-backed securities (ABS)
or mortgage-backed securities
(MBS) 7,388 7,386 45 (43) 7,388
Others in Israel 835 799 36 - 835
Others abroad 1,474 1,471 17 (14) 1,474
48,447 47,989 525 (67) 48,447
Shares and mutual funds (b) 3,775 2,944 843 (12) 3,775Total securities available for
sale 52,222 50,933 1,368 (79) 52,222
As at 31 March 2015 (Unaudited)
Balance sheet
amount
Amortized
cost (in shares -
cost)
Unrealized
profits from
adjustments
to fair value
Unrealized
losses from
adjustments
to fair value Fair value (a)
(NIS millions)
2. Securities held for trading:
Debentures -
Government of Israel 8,048 7,974 75 (1) 8,048
Foreign governments 1,407 1,407 1 (1) 1,407
Financial institutions in Israel 244 242 2 - 244
Financial institutions abroad 234 233 1 - 234
Asset-backed securities (ABS)
or mortgage-backed securities
(MBS) 980 969 11 - 980
Others in Israel 279 276 3 - 279
Others abroad 251 252 1 (2) 251
11,443 11,353 94 (4) 11,443
Shares and mutual funds 714 697 34 (17) 714
Total securities held for trading 12,157 12,050 128 (21) 12,157
Total securities (e) 64,379 62,983 1,496 (100) 64,379
Accumulated other
comprehensive profit (loss)
c c
d d
See notes on page 126.

117
Note 5 - Securities (cont'd)
As at 31 December 2015 (Audited)
Balance sheet
Amortized
cost (in
amount shares - cost) Profits Losses Fair value (a)
(NIS millions)
1. Securities available for sale:
Debentures -
Government of Israel 28,553 28,359 201 (7) 28,553
Foreign governments 8,128 8,127 5 (4) 8,128
Financial institutions in Israel 35 33 2 - 35
Financial institutions abroad 6,262 6,257 31 (26) 6,262
Asset-backed securities (ABS)
or mortgage-backed securities
(MBS) 9,566 9,630 24 (88) 9,566
Others in Israel 586 562 25 (1) 586
Others abroad 1,694 1,706 12 (24) 1,694
54,824 54,674 300 (150) 54,824
Shares and mutual funds (b) 2,703 2,559 158 (14) 2,703Total securities available for
sale 57,527 57,233 458 (164) 57,527
As at 31 December 2015 (Audited)
Balance sheet
amount
Amortized
cost (in shares -
cost)
Unrealized
profits from
adjustments
to fair value
Unrealized
losses from
adjustments
to fair value Fair value (a)
(NIS millions)
2. Securities held for trading:
Debentures -
Government of Israel 6,664 6,657 17 (10) 6,664
Foreign governments 3,058 3,087 - (29) 3,058
Financial institutions in Israel 238 238 1 (1) 238
Financial institutions abroad 148 149 - (1) 148
Asset-backed securities (ABS)
or mortgage-backed securities
(MBS) 751 754 4 (7) 751
Others in Israel 152 150 2 - 152
Others abroad 320 326 1 (7) 320
11,331 11,361 25 (55) 11,331
Shares and mutual funds 617 687 10 (80) 617
Total securities held for trading 11,948 12,048 35 (135) 11,948
Total securities (e) 69,475 69,281 493 (299) 69,475
Accumulated other
comprehensive profit (loss)
(c) (c)
d d
See notes on page 126.
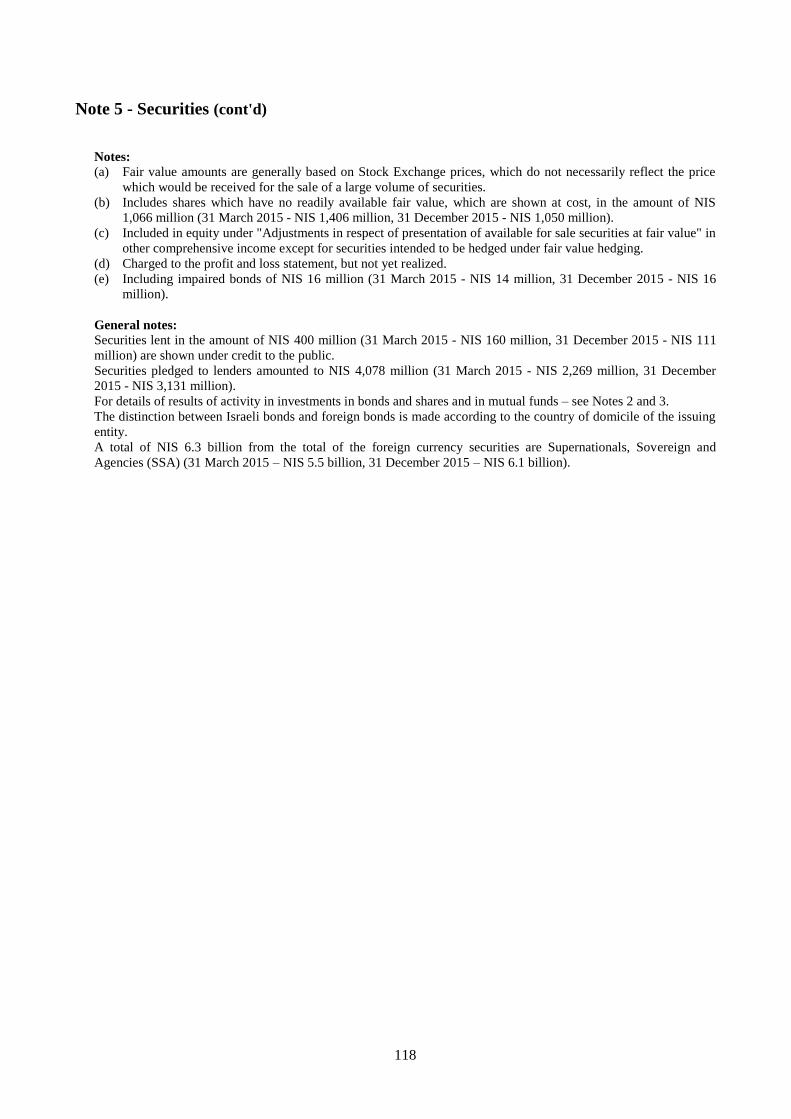
118
Note 5 - Securities (cont'd)
Notes:
(a) Fair value amounts are generally based on Stock Exchange prices, which do not necessarily reflect the price
which would be received for the sale of a large volume of securities.
(b) Includes shares which have no readily available fair value, which are shown at cost, in the amount of NIS
1,066 million (31 March 2015 - NIS 1,406 million, 31 December 2015 - NIS 1,050 million).
(c) Included in equity under "Adjustments in respect of presentation of available for sale securities at fair value" in
other comprehensive income except for securities intended to be hedged under fair value hedging.
(d) Charged to the profit and loss statement, but not yet realized.
(e) Including impaired bonds of NIS 16 million (31 March 2015 - NIS 14 million, 31 December 2015 - NIS 16
million).
General notes:
Securities lent in the amount of NIS 400 million (31 March 2015 - NIS 160 million, 31 December 2015 - NIS 111
million) are shown under credit to the public.
Securities pledged to lenders amounted to NIS 4,078 million (31 March 2015 - NIS 2,269 million, 31 December
2015 - NIS 3,131 million).
For details of results of activity in investments in bonds and shares and in mutual funds – see Notes 2 and 3.
The distinction between Israeli bonds and foreign bonds is made according to the country of domicile of the issuing
entity.
A total of NIS 6.3 billion from the total of the foreign currency securities are Supernationals, Sovereign and
Agencies (SSA) (31 March 2015 – NIS 5.5 billion, 31 December 2015 – NIS 6.1 billion).

119
Note 5 - Securities (cont'd)
Additional details in respect of fair value and unrealized losses, by period and rate of impairment, of
securities available for sale in an unrealized loss position
31 March 2016 (Unaudited)
Fair
value 0-20% 20%-35%
More
than
35% Total
Fair
value 0-20% 20%-35%
More
than
35% Total
(NIS millions)
Bonds
Government of Israel 9,172 1 - - 1 - - - - -
Foreign governments 3,085 1 - - 1 - - - - -
Financial institutions in
Israel - - - - - - - - - -
Financial institutions
abroad 3,211 22 - - 22 30 3 4 - 7
Asset-backed securities
(ABS) or mortgage-
backed securities (MBS) 4,642 36 - - 36 541 8 - - 8
Others in Israel 88 - - - - - - - - -
Others abroad 59 8 - - 8 38 - - - -
Shares 249 80 - - 80 216 6 19 - 25
Total securities
available for sale 20,506 148 - - 148 825 17 23 - 40
Less than 12 months 12 months and above
Unrealized losses Unrealized losses
31 March 2015 (Unaudited)
Fair
value 0-20% 20%-35%
More
than
35% Total
Fair
value 0-20% 20%-35%
More
than
35% Total
(NIS millions)
Bonds
Government of Israel 257 - - - - - - - - -
Foreign governments 8,512 1 - - 1 - - - - -
Financial institutions in
Israel - - - - - - - - - -
Financial institutions
abroad 2,134 5 - - 5 256 4 - - 4
Asset-backed securities
(ABS) or mortgage-
backed securities (MBS) 1,048 2 - - 2 2,931 41 - - 41
Others in Israel 135 - - - - - - - - -
Others abroad 171 3 - - 3 393 11 - - 11
Shares - - - - - 175 12 - - 12
Total securities
available for sale 12,257 11 - - 11 3,755 68 - - 68
Less than 12 months 12 months and above
Unrealized losses Unrealized losses
(-) Losses less than NIS 1million.

120
Note 5 - Securities (cont'd)
Additional details in respect of fair value and unrealized losses, by period and rate of impairment, of
securities available for sale in an unrealized loss position (cont'd)
31 December 2015 (Audited)
Fair
value 0-20% 20%-35%
More
than
35% Total
Fair
value 0-20% 20%-35%
More
than
35% Total
(NIS millions)
Bonds
Government of Israel 15,057 7 - - 7 - - - - -
Foreign governments 5,730 4 - - 4 - - - - -
Financial institutions in
Israel - - - - - - - - - -
Financial institutions
abroad 3,961 23 - - 23 34 3 - - 3
Asset-backed securities
(ABS) or mortgage-
backed securities (MBS) 6,863 63 - - 63 742 25 - - 25
Others in Israel 126 1 - - 1 - - - - -
Others abroad 778 15 9 - 24 39 - - - -
Shares 136 8 - - 8 91 6 - - 6
Total securities
available for sale 32,651 121 9 - 130 906 34 - - 34
Less than 12 months 12 months and above
Unrealized losses Unrealized losses
(-) Losses less than NIS 1million.

121
Note 5 - Securities (cont'd)
Additional details in respect of mortgage-backed and asset-backed securities available for sale in an
unrealized loss position
Up to 12 months Total
Fair value
Unrealized
losses from
adjustments
to fair value
Fair
value
Unrealized
losses from
adjustments
to fair value
Fair
value
Unrealized
losses from
adjustments
to fair value
(NIS millions)
Mortgage-backed securities (MBS) 1,559 (12) 61 (1) 1,620 (13)
Other mortgage-backed securities
(including REMIC, CMO and
STRIPPED MBS) 1,487 (7) 405 (6) 1,892 (13)
Asset-backed securities (ABS) 1,596 (17) 75 (1) 1,671 (18)
Total 4,642 (36) 541 (8) 5,183 (44)
Up to 12 months Total
Fair value
Unrealized
losses from
adjustments
to fair value
Fair
value
Unrealized
losses from
adjustments
to fair value
Fair
value
Unrealized
losses from
adjustments
to fair value
(NIS millions)
Mortgage-backed securities (MBS) 350 (1) 1,087 (16) 1,437 (17)
Other mortgage-backed securities
(including REMIC, CMO and
STRIPPED MBS) 80 - 1,227 (20) 1,307 (20)
Asset-backed securities (ABS) 618 (1) 617 (5) 1,235 (6)
Total 1,048 (2) 2,931 (41) 3,979 (43)
Up to 12 months Total
Fair value
Unrealized
losses from
adjustments
to fair value
Fair
value
Unrealized
losses from
adjustments
to fair value
Fair
value
Unrealized
losses from
adjustments
to fair value
(NIS millions)
Mortgage-backed securities (MBS) 1,860 (25) 87 (2) 1,947 (27)
Other mortgage-backed securities
(including REMIC, CMO and
STRIPPED MBS) 3,321 (22) 558 (21) 3,879 (43)
Asset-backed securities (ABS) 1,682 (16) 97 (2) 1,779 (18)
Total 6,863 (63) 742 (25) 7,605 (88)
31 December 2015 (Audited)
Over 12 months
Over 12 months
31 March 2016 (Unaudited)
Over 12 months
31 March 2015 (Unaudited)
(-) Losses less than NIS 1 million.

122
Note 5 - Securities (cont'd)
Additional information on mortgage-backed and asset-backed securities available for sale
As at 31 March 2016 (Unaudited)
Amortized Fair
cost Profits Losses value
(NIS millions)
1. Debentures available for sale (Pass-
through securities)
Securities guaranteed by GNMA 399 2 - 401
Securities issued by FNMA and FHLMC 1,139 1 (4) 1,136
Other securities 744 - (9) 735
Total 2,282 3 (13) 2,272
Other mortgage-backed securities (including
CMO and STRIPPED MBS)
Securities issued by FNMA, FHLMC, or
GNMA, or guaranteed by these entities 5,325 40 (10) 5,355
Other mortgage-backed securities 303 1 (3) 301
Total other mortgage-backed securities 5,628 41 (13) 5,656
Total 7,910 44 (26) 7,928
Asset-backed securities (ABS)
Credit card receivables 90 - (1) 89
Other credit to private persons 4 - - 4
Credit not to private persons 1 - - 1
CLO-type debentures 1,937 15 (17) 1,935
Total 2,032 15 (18) 2,029Total mortgage-backed and asset-backed
debentures available for sale 9,942 59 (44) 9,957
Accumulated other
comprehensive income (loss) (a)
(a) Amounts charged to capital reserve as part of other comprehensive income, net, after effect of taxes.

123
Note 5 - Securities (cont'd)
Additional information on mortgage-backed and asset-backed securities available for sale (cont'd)
As at 31 March 2015 (Unaudited)
Amortized Fair
cost Profits Losses value
(NIS millions)1. Debentures available for sale (Pass-
through securities)
Securities guaranteed by GNMA 16 - - 16
Securities issued by FNMA and FHLMC 1,188 1 (16) 1,173
Other securities 458 1 (1) 458
Total 1,662 2 (17) 1,647
Other mortgage-backed securities (including
CMO and STRIPPED MBS)
Securities issued by FNMA, FHLMC, or
GNMA, or guaranteed by these entities 3,456 16 (20) 3,452
Other mortgage-backed securities 220 4 - 224
Total other mortgage-backed securities 3,676 20 (20) 3,676
Total 5,338 22 (37) 5,323
Asset-backed securities (ABS)
Credit card receivables 96 - (1) 95
Lines of credit for any purpose secured
by dwelling 2 - - 2
Other credit to private persons 4 - - 4
Credit not to private persons 1 - - 1
CLO-type debentures 1,945 23 (5) 1,963
Total 2,048 23 (6) 2,065Total mortgage-backed and asset-backed
debentures available for sale 7,386 45 (43) 7,388
Accumulated other
comprehensive income (loss) (a)
(a) These profits (losses) were charged to profit and loss.

124
Note 5 - Securities (cont'd)
Additional information on mortgage-backed and asset-backed securities available for sale (cont'd)
As at 31 December 2015 (Audited)
Amortized Fair
cost Profits Losses value
(NIS millions)1. Debentures available for sale
(Pass-through securities)
Securities guaranteed by GNMA 11 - - 11
Securities issued by FNMA and FHLMC 1,245 - (21) 1,224
Securities issued by others 796 - (6) 790
Total 2,052 - (27) 2,025
Other mortgage-backed securities (including
CMO and STRIPPED MBS)
Securities issued by FNMA, FHLMC, or
GNMA, or guaranteed by these entities 4,987 5 (42) 4,950
Other mortgage-backed securities 494 1 (1) 494
Total other mortgage-backed securities 5,481 6 (43) 5,444
Total mortgage-backed securities (MBS) 7,533 6 (70) 7,469
Asset-backed securities (ABS)
Credit card receivables 94 - (2) 92
Other credit to private persons 4 - - 4
Credit not to private persons 1 - - 1
CLO-type debentures 1,998 18 (16) 2,000
Total 2,097 18 (18) 2,097Total mortgage-backed and asset-backed
debentures available for sale 9,630 24 (88) 9,566
Accumulated other
comprehensive income (loss) (a)
(a) Amounts charged to capital reserve as part of other comprehensive income, net after effect of tax.
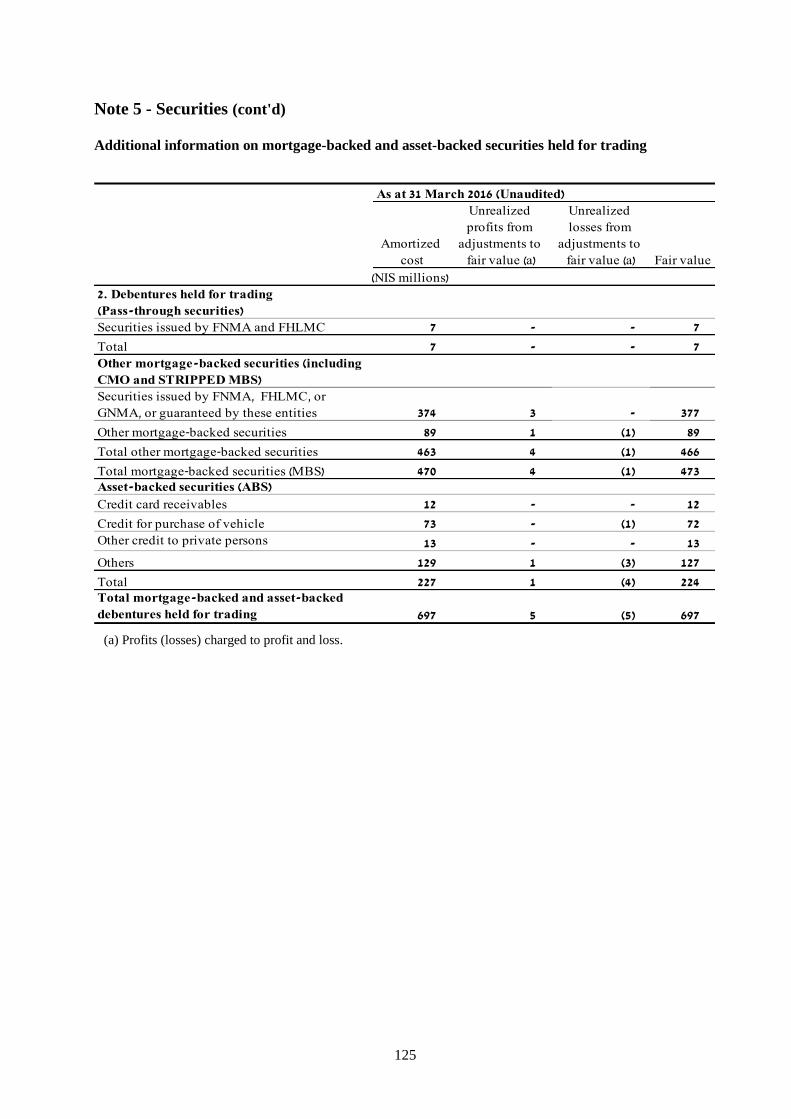
125
Note 5 - Securities (cont'd)
Additional information on mortgage-backed and asset-backed securities held for trading
As at 31 March 2016 (Unaudited)
Amortized
cost
Unrealized
profits from
adjustments to
fair value (a)
Unrealized
losses from
adjustments to
fair value (a) Fair value
(NIS millions)
2. Debentures held for trading
(Pass-through securities)
Securities issued by FNMA and FHLMC 7 - - 7
Total 7 - - 7
Other mortgage-backed securities (including
CMO and STRIPPED MBS)
Securities issued by FNMA, FHLMC, or
GNMA, or guaranteed by these entities 374 3 - 377
Other mortgage-backed securities 89 1 (1) 89
Total other mortgage-backed securities 463 4 (1) 466
Total mortgage-backed securities (MBS) 470 4 (1) 473Asset-backed securities (ABS)
Credit card receivables 12 - - 12
Credit for purchase of vehicle 73 - (1) 72
Other credit to private persons 13 - - 13
Others 129 1 (3) 127
Total 227 1 (4) 224Total mortgage-backed and asset-backed
debentures held for trading 697 5 (5) 697
(a) Profits (losses) charged to profit and loss.
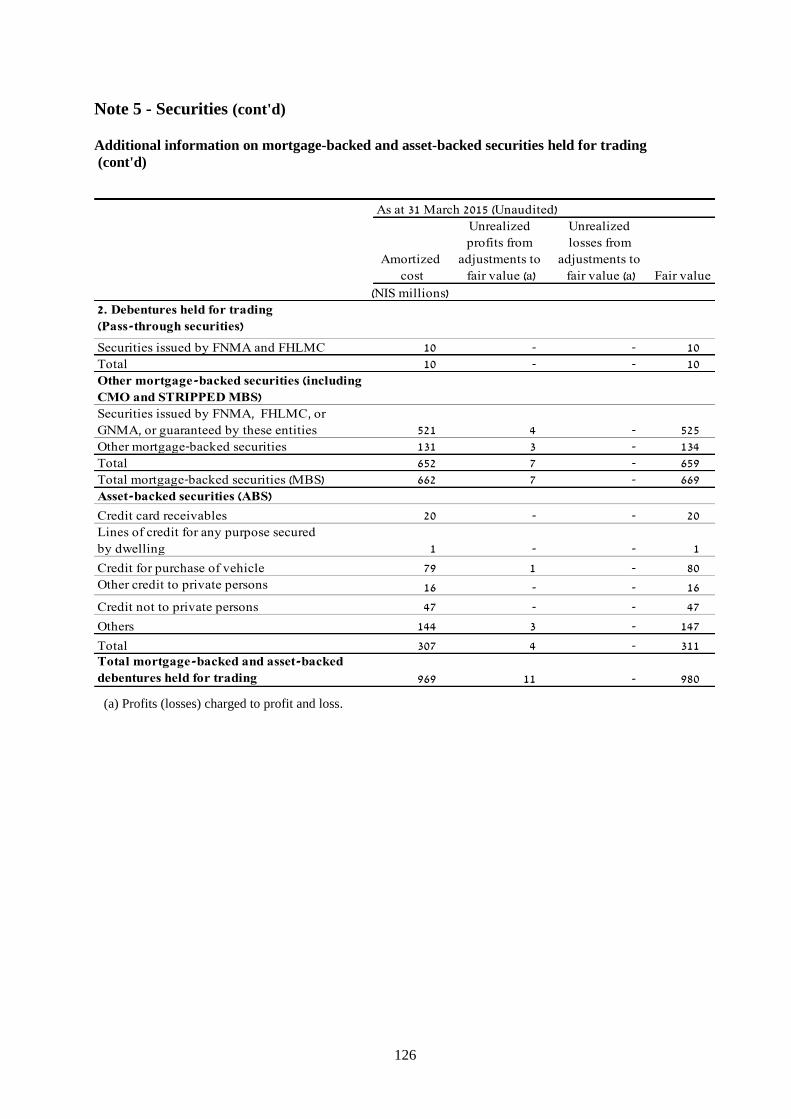
126
Note 5 - Securities (cont'd)
Additional information on mortgage-backed and asset-backed securities held for trading
(cont'd)
As at 31 March 2015 (Unaudited)
Amortized
cost
Unrealized
profits from
adjustments to
fair value (a)
Unrealized
losses from
adjustments to
fair value (a) Fair value
(NIS millions)
2. Debentures held for trading
(Pass-through securities)
Securities issued by FNMA and FHLMC 10 - - 10
Total 10 - - 10
Other mortgage-backed securities (including
CMO and STRIPPED MBS)
Securities issued by FNMA, FHLMC, or
GNMA, or guaranteed by these entities 521 4 - 525
Other mortgage-backed securities 131 3 - 134
Total 652 7 - 659
Total mortgage-backed securities (MBS) 662 7 - 669
Asset-backed securities (ABS)
Credit card receivables 20 - - 20
Lines of credit for any purpose secured
by dwelling 1 - - 1
Credit for purchase of vehicle 79 1 - 80
Other credit to private persons 16 - - 16
Credit not to private persons 47 - - 47
Others 144 3 - 147
Total 307 4 - 311Total mortgage-backed and asset-backed
debentures held for trading 969 11 - 980
(a) Profits (losses) charged to profit and loss.
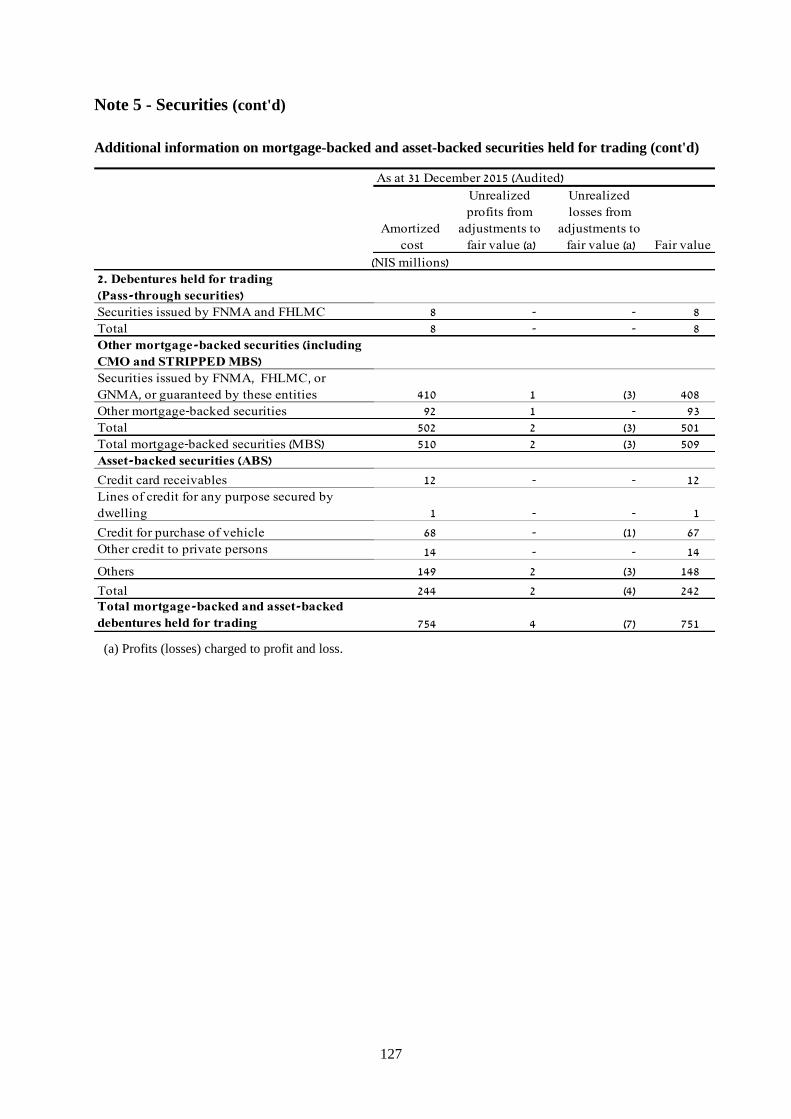
127
Note 5 - Securities (cont'd)
Additional information on mortgage-backed and asset-backed securities held for trading (cont'd)
As at 31 December 2015 (Audited)
Amortized
cost
Unrealized
profits from
adjustments to
fair value (a)
Unrealized
losses from
adjustments to
fair value (a) Fair value
(NIS millions)
2. Debentures held for trading
(Pass-through securities)
Securities issued by FNMA and FHLMC 8 - - 8
Total 8 - - 8
Other mortgage-backed securities (including
CMO and STRIPPED MBS)
Securities issued by FNMA, FHLMC, or
GNMA, or guaranteed by these entities 410 1 (3) 408
Other mortgage-backed securities 92 1 - 93
Total 502 2 3 501
Total mortgage-backed securities (MBS) 510 2 (3) 509
Asset-backed securities (ABS)
Credit card receivables 12 - - 12
Lines of credit for any purpose secured by
dwelling 1 - - 1
Credit for purchase of vehicle 68 - (1) 67
Other credit to private persons 14 - - 14
Others 149 2 (3) 148
Total 244 2 (4) 242Total mortgage-backed and asset-backed
debentures held for trading 754 4 (7) 751
(a) Profits (losses) charged to profit and loss.
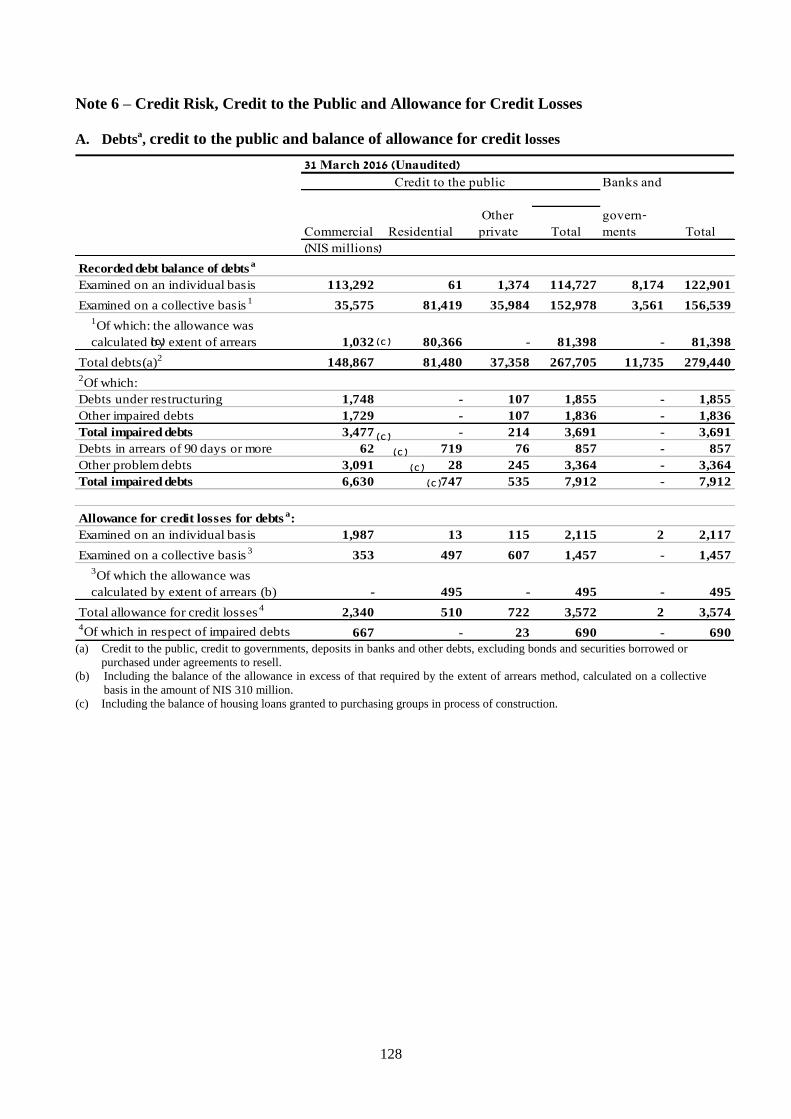
128
Note 6 – Credit Risk, Credit to the Public and Allowance for Credit Losses
A. Debtsa, credit to the public and balance of allowance for credit losses
31 March 2016 (Unaudited)
Banks and
Commercial Residential
Other
private Total
govern-
ments Total
(NIS millions)
Recorded debt balance of debtsa
Examined on an individual basis 113,292 61 1,374 114,727 8,174 122,901
Examined on a collective basis1
35,575 81,419 35,984 152,978 3,561 156,539
1Of which: the allowance was
calculated by extent of arrears 1,032 80,366 - 81,398 - 81,398
Total debts(a)2
148,867 81,480 37,358 267,705 11,735 279,440
2Of which:
Debts under restructuring 1,748 - 107 1,855 - 1,855
Other impaired debts 1,729 - 107 1,836 - 1,836
Total impaired debts 3,477 - 214 3,691 - 3,691
Debts in arrears of 90 days or more 62 719 76 857 - 857
Other problem debts 3,091 28 245 3,364 - 3,364
Total impaired debts 6,630 747 535 7,912 - 7,912
Allowance for credit losses for debtsa:
Examined on an individual basis 1,987 13 115 2,115 2 2,117
Examined on a collective basis3
353 497 607 1,457 - 1,457
3Of which the allowance was
calculated by extent of arrears (b) - 495 - 495 - 495
Total allowance for credit losses4
2,340 510 722 3,572 2 3,5744Of which in respect of impaired debts 667 - 23 690 - 690
Credit to the public
c c
c
c
c
c
(a) Credit to the public, credit to governments, deposits in banks and other debts, excluding bonds and securities borrowed or
purchased under agreements to resell.
(b) Including the balance of the allowance in excess of that required by the extent of arrears method, calculated on a collective
basis in the amount of NIS 310 million.
(c) Including the balance of housing loans granted to purchasing groups in process of construction.

129
Note 6 – Credit Risk, Credit to the Public and Allowance for Credit Losses (cont.)
A. Debtsa, credit to the public and balance of allowance for credit losses (cont.)
31 March 2015 (Unaudited)
Banks and
Commercial Residential
Other
private Total
govern-
ments Total
(NIS millions)
Recorded debt balance of debtsa
Examined on an individual basis 106,882 46 872 107,800 10,056 117,856
Examined on a collective basis1
35,914 76,092 34,417 146,423 1,782 148,205
1Of which: the allowance was
calculated by extent of arrears 1,269 73,679 - 74,948 - 74,948
Total debts(a)2
142,796 76,138 35,289 254,223 11,838 266,061
2Of which:
Debts under restructuring 2,441 - 100 2,541 - 2,541
Other impaired debts 2,245 - 61 2,306 - 2,306
Total impaired debts 4,686 - 161 4,847 - 4,847
Debts in arrears of 90 days or more 69 766 93 928 - 928
Other problem debts 4,237 8 268 4,513 - 4,513
Total impaired debts 8,992 774 522 10,288 - 10,288
Allowance for credit losses for debtsa:
Examined on an individual basis 2,542 14 80 2,636 3 2,639
Examined on a collective basis3
288 494 530 1,312 - 1,312
3Of which the allowance was
calculated by extent of arrears (b) 1 491 - 492 - 492
Total allowance for credit losses4
2,830 508 610 3,948 3 3,9514Of which in respect of impaired debts 1,074 - 83 1,157 - 1,157
Credit to the public
c
c
c
c
(a) Credit to the public, credit to governments, deposits in banks and other debts, excluding bonds and securities borrowed or
purchased under agreements to resell.
(b) Including the balance of the allowance in excess of that required by the extent of arrears method, calculated on a collective
basis in the amount of NIS 296 million.
(c) Restated.

130
Note 6 – Credit Risk, Credit to the Public and Allowance for Credit Losses (cont.)
A. Debtsa, credit to the public and balance of allowance for credit losses (cont.)
Banks and
Commercial Residential
Other
private Total
govern-
ments Total
(NIS millions)
Recorded debt balance of debtsa
Examined on an individual basis 107,768 45 852 108,665 7,515 116,180
Examined on a collective basis1
38,097 81,760 36,548 156,405 3,254 159,659
1Of which: the allowance was
calculated by extent of arrears 1,014 80,616 - 81,630 - 81,630
Total debts(a)2
145,865 81,805 37,400 265,070 10,769 275,839
2Of which:
Debts under restructuring 2,192 - 86 2,278 - 2,278
Other impaired debts 1,617 - 26 1,643 - 1,643
Total impaired debts 3,809 - 112 3,921 - 3,921
Debts in arrears of 90 days or more 67 770 105 942 - 942
Other problem debts 3,151 11 299 3,461 - 3,461
Total impaired debts 7,027 781 516 8,324 - 8,324
Allowance for credit losses for debtsa:
Examined on an individual basis 2,177 15 93 2,285 3 2,288
Examined on a collective basis3
307 498 581 1,386 - 1,386
3Of which the allowance was
calculated by extent of arrears (b) 1 497 - 498 - 498
Total allowance for credit losses4
2,484 513 674 3,671 3 3,6744Of which in respect of impaired debts 824 - 43 867 - 867
Credit to the public
31 December 2015 (Audited)
c
d
d
c
d
(a) Credit to the public, credit to governments, deposits in banks and other debts, excluding bonds and securities borrowed or
purchased under agreements to resell.
(b) Including the balance of the allowance in excess of that required by the extent of arrears method, calculated on a collective
basis in the amount of NIS 310 million.
(c) Including the balance of housing loans granted to purchasing groups in process of construction.
(d) Restated.
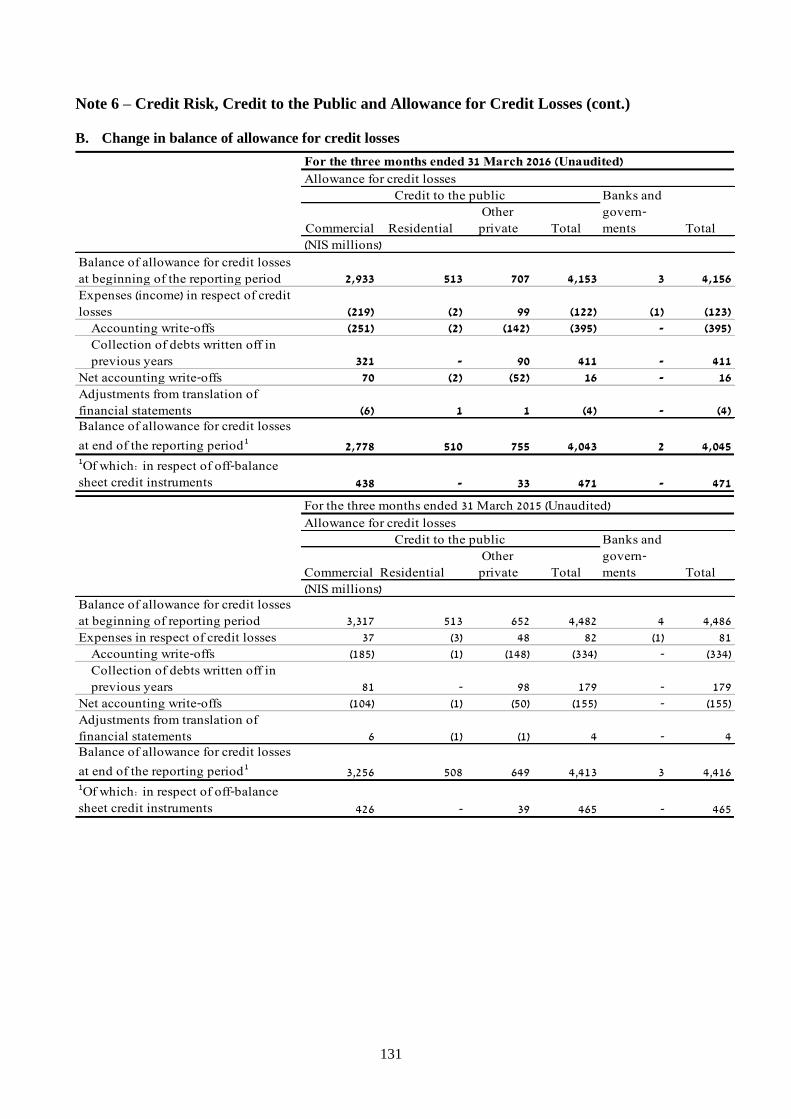
131
Note 6 – Credit Risk, Credit to the Public and Allowance for Credit Losses (cont.)
B. Change in balance of allowance for credit losses
For the three months ended 31 March 2016 (Unaudited)
Allowance for credit losses
Banks and
Commercial Residential
Other
private Total
govern-
ments Total
(NIS millions)
Balance of allowance for credit losses
at beginning of the reporting period 2,933 513 707 4,153 3 4,156
Expenses (income) in respect of credit
losses (219) (2) 99 (122) (1) (123)
Accounting write-offs (251) (2) (142) (395) - (395)
Collection of debts written off in
previous years 321 - 90 411 - 411
Net accounting write-offs 70 (2) (52) 16 - 16
Adjustments from translation of
financial statements (6) 1 1 (4) - (4)Balance of allowance for credit losses
at end of the reporting period12,778 510 755 4,043 2 4,045
1Of which: in respect of off-balance
sheet credit instruments 438 - 33 471 - 471
Credit to the public
For the three months ended 31 March 2015 (Unaudited)
Allowance for credit losses
Banks and
Commercial Residential
Other
private Total
govern-
ments Total
(NIS millions)Balance of allowance for credit losses
at beginning of reporting period 3,317 513 652 4,482 4 4,486
Expenses in respect of credit losses 37 (3) 48 82 (1) 81
Accounting write-offs (185) (1) (148) (334) - (334)
Collection of debts written off in
previous years 81 - 98 179 - 179
Net accounting write-offs (104) (1) (50) (155) - (155)
Adjustments from translation of
financial statements 6 (1) (1) 4 - 4Balance of allowance for credit losses
at end of the reporting period13,256 508 649 4,413 3 4,416
1Of which: in respect of off-balance
sheet credit instruments 426 - 39 465 - 465
Credit to the public

132
Note 7 – Deposits of the Public
A. Types of deposits by location raised and type of depositor
31 March 2016 31 March 2015 31 December 2015
(Unaudited) (Audited)
(NIS millions)
In Israel
On demand
Non-interest bearing 69,624 63,099 72,060
Interest bearing 82,158 69,470 80,521
Total on demand 151,782 132,569 152,581
Fixed term 153,794 145,405 149,697
Total deposits in Israel1 305,576 277,974 302,278
Outside Israel
On demand
Non-interest bearing 8,844 9,917 9,872
Interest bearing 3,426 2,775 3,693
Total on demand 12,270 12,692 13,565
Fixed term 12,508 14,351 12,850
Total deposits outside Israel 24,778 27,043 26,415
Total deposits of the public 330,354 305,017 328,6931Of which:
Deposits of private persons 138,638 125,648 135,595
Deposits of institutional entities 57,620 55,250 55,889
Deposits of corporations and others 109,318 97,076 110,794
a a
a a
B. Deposits of the public by size
31 March 2016 31 March 2015 31 December 2015
(Unaudited) (Audited)
(NIS millions)
Up to 1 95,200 86,624 95,789
From 1 to 10 86,700 78,491 83,813
From 10 to 100 56,951 53,290 58,268
From 100 to 500 34,933 29,141 30,868
Above 500 56,570 57,471 59,955
Total 330,354 305,017 328,693
(a) Reclassified.

133
Note 8 – Employee Rights
A. Signing of collective labor agreement
On 17 February 2016, a special collective agreement was signed by the representatives of the
Bank's employees and the Bank, for conversion of the rights that accrued in favor of the Bank's
employees into shares of the Bank to be issued to employees for the same amount as the rights,
based on the amount in which those rights are recorded in the books of the Bank, and as described
below.
The issuance of the shares was carried out at the market price of the shares on the date determined
in the outline plan, which was published for purposes of carrying out the issuance. The issuance of
the shares was carried out in exchange for a waiver by the employees on the rights that were
converted that were recorded in the books of the Bank, for an amount of the value of the shares to
be issued. The shares issued will be blocked for two years.
The Bank dealt with the issuance of the shares in settlement of the relevant liabilities.
The rights that were converted into shares:
1.1 Annual bonus for the year 2015. This conversion applied for all the employees, including
office holders in the subsidiaries of the Bank who are employees of the subsidiaries.
1.2 Voluntary conversion of up to 25% of pension rights ("non-contributory pension"),
accumulating in favor of the employees entitled to the same, to shares of the Bank, in
exchange for a waiver of rights to that amount, as recorded in favor of the employee in the
books of the Bank, as at 31 December 2015, except for utilizing a discount rate of 3.5%,
instead of a discount rate of about 2.68%, which was utilized pursuant to the directives of the
Bank of Israel. Every employee under a "first generation" arrangement entitled to a "non-
contributory pension" was entitled to choose the percentage of the rights to be converted into
the shares of the bank. Employees whose salary for purposes of social contributions did not
exceed NIS 10,000 for the month of December 2015, were not entitled to convert the
aforementioned rights. The reduction in liabilities was charged to other comprehensive
income.
1.3 The conversion of the eligibility recorded in the books of the Bank to "Jubilee" bonuses and
"Jubilee" vacations that were accrued in favor of the employees entitled to "Jubilee" bonuses,
whose date of payment is from 1 January 2017. This conversion was carried out for all the
employees eligible for "Jubilee" bonuses, except for employees entitled to "Jubilee" bonuses
in 2016. The reduction in liabilities was charged to other comprehensive income. The Bank applied the conversion of the relevant rights also to managers employed by the Bank
under personal contracts.
On 18 February 2016, the Bank published an outline plan for issuance of shares to the employees,
to carry out that stated in the special collective agreement. Pursuant to the outline plan, employees
were able to convert rights as set out in paragraph 1.2 above from 8 March 2016 and at the end of
the response period determined, the issuance of shares took place.
The results of the offer to employees and corporate officers pursuant to the outline were published
in an Immediate Report on 20 March 2016, as follows:

134
Note 8 – Employee Rights (cont.)
1. The total amount of employees’ rights and the rights of the corporate officers that were
converted into Bank shares pursuant to the Outline amounts to some NIS 636 million, divided
as follows: (a) with respect to employees’ rights to receive jubilee bonuses - some NIS 259
million; (b) with respect to the rights of employees and corporate officers to receive their 2015
bonus - some NIS 292 million; and (c) with respect to social security rights – some NIS 85
million.
2. The value of a Bank share, for the purpose of the conversion of rights, is NIS 13.0 (the closing
price for the Bank’s shares on 6 March 2016). Accordingly, the board of directors approved
the issue of 48,938,037 shares, which constitute some 3.21% of the Bank’s issued and paid-up
capital (after the issue). In accordance with the Outline’s provisions, the shares will be
allocated to the Trustee, who will hold the shares in trust for the employees, in accordance
with the provisions of section 102 of the Income Tax Ordinance.
3. The total amount of shares issued pursuant to the Outline, as described above, includes
1,955,016 shares which were issued to the Bank’s corporate officers.
B. Remuneration Law for Office Holders in Financial Corporations (Special Approval and
Disallowance of Expenditure for Tax Purposes for Exceptional Remuneration), 2016
On 12 April 2016, the Remuneration Law for Office holders in Financial Corporations (Special
Approval and Disallowance of Expenditure for Tax Purposes for Exceptional Remuneration) 2016
was published (henceforth: "The Remuneration Limitation Law") . The Law sets the limitations on
remuneration for office holders or other employees in financial corporations (hereinafter: "the
remuneration"), as follows:
The method of approving remuneration was set: with the expected cost being estimated at NIS
2.5 million per year.
No agreement will be approved where the expected cost will exceed NIS 2.5 million per year,
unless the ratio between the expected cost for full time position under this remuneration and
the cost of the lowest remuneration, according to the cost of a full time position that the
Financial Corporation paid directly or indirectly to an employee in the corporation, (including
a contractor's employee), in the year previous to the date of the agreement, is less than 35.
The sum of the remuneration of the same employee/office holder will be calculated on a group
basis, i.e. it will also include remuneration from corporations connected by definition to this
law.
For the purpose of calculating the financial institutions' taxable income it is defined that an
expense that exceeds the ceiling defined in the Law will not be eligible for deduction as a
recognized expense. The ceiling defined in the Law is not more than NIS 2.5 million per year
and if the remuneration exceeds NIS 2.5 million per year, the ceiling will be reduced by the
difference between the remuneration and NIS 2.5 million (hereinafter: "the ceiling")
Rules are defined for reporting to the tax authorities on details of remuneration that exceed the
ceiling.
Sanction is defined; according to which a corporation that does not comply with the rules, the
agreement will be regarded as invalid (in accordance with section 280 of the Companies Law).

135
Note 8 – Employee Rights (cont.)
Regarding new agreements from the date of publication of the Law and thereafter, limitations on
salary will apply at the time of the Law's publication, and the effect on taxable income of the
financial corporation and reporting to the Taxes Authority will apply from 1 January 2017.
Regarding existing agreements approved before the date of publication, limitations on salary and
then effect on taxable income of the financial corporation and reporting to the Taxes Authority will
apply six months after the Law's publication.
On 7 April 2016, the Supervisor of Banks published a letter to the Chairmen and CEO's of the
banking corporations, according to which the banking corporations are required to estimate the
possible impact and risks to the Bank from the time the Law becomes effective, including an
examination of the possibilities of departure of key personnel, and the effects on the Bank's long-
term plans including the ability to undertake significant efficiency programs, in accordance with
the Banking Supervision Department's requirements.
In addition the banking corporations are required to examine the necessity to revise the obligations
to employees' rights in the banks' next financial reports against the background of the changes that
occurred under the circumstances that may affect the estimates on retirement in the banking
corporations.
The coming into force of the Remuneration Restriction Law will oblige the Bank to negatively
impact the terms of employment of office holders and in this connection the Bank's Remuneration
Committee is studying the adoption of a new Remuneration Policy. In addition, the Law's entry
into force is expected to negatively impact, in a more limited manner, certain employment
conditions of key Bank personnel, who are employed under personal contracts. This expected
impact in employment conditions is anticipated to entitle office holders and key personnel to give
notice of their termination of their duties in the Bank, under eligibility to terms of dismissal, as
defined in the terms of employment in the Bank, and given them various entitlements, including
increased severance pay or early pension rights, until they reach retirement age.
As set forth in Note 23.3.C to the Bank's 2015 annual financial statements, the Bank makes a
provision for liabilities deriving from the termination of employer-employee relationships, in
accordance with an assessment of the likelihood of realization of the exposure to payment of the
said amounts, based, inter alia, on past experience and the expectation that most of the senior
managers will continue working in the bank until retirement age. Against the background of the
enactment of the Salary Remuneration Law, the Management of the Bank has made a renewed
estimate of the likelihood of realization of the exposure to payment of the entitlements of office
holders and key personnel in connection with termination of employer-employee relationships,
under terms of dismissal, against the backdrop of the new legal situation created, and based on
various parameters examined.
Against the background of the significant increase in the probability of members of management
ending their term of office in the relatively near future because of the deterioration in the
conditions expected for them following the Law become effective, the Board of Directors of Bank
Leumi, in view of the management's estimation and in accordance with a legal opinion, approved
updating the provision for the termination of employee-employer relationships, according to the
accumulated rights, in accordance with the terms of employment of members of the management
and other managers employed under personal contracts.
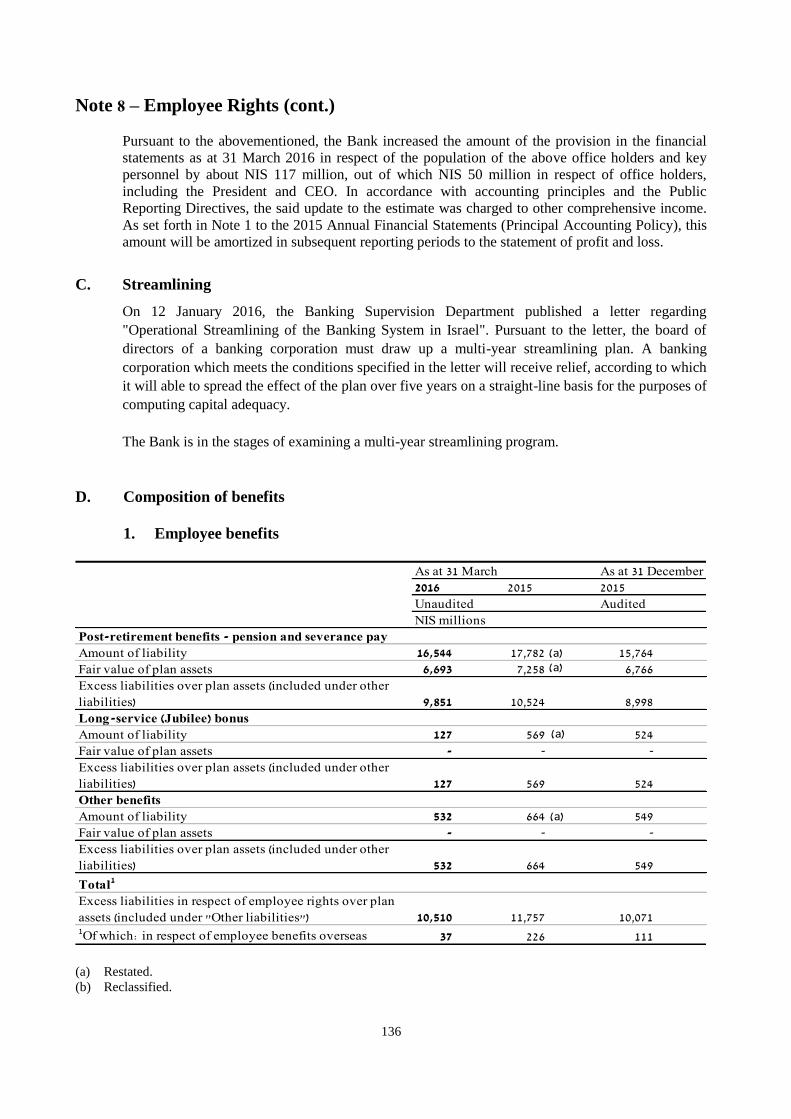
136
Note 8 – Employee Rights (cont.)
Pursuant to the abovementioned, the Bank increased the amount of the provision in the financial
statements as at 31 March 2016 in respect of the population of the above office holders and key
personnel by about NIS 117 million, out of which NIS 50 million in respect of office holders,
including the President and CEO. In accordance with accounting principles and the Public
Reporting Directives, the said update to the estimate was charged to other comprehensive income.
As set forth in Note 1 to the 2015 Annual Financial Statements (Principal Accounting Policy), this
amount will be amortized in subsequent reporting periods to the statement of profit and loss.
C. Streamlining
On 12 January 2016, the Banking Supervision Department published a letter regarding
"Operational Streamlining of the Banking System in Israel". Pursuant to the letter, the board of
directors of a banking corporation must draw up a multi-year streamlining plan. A banking
corporation which meets the conditions specified in the letter will receive relief, according to which
it will able to spread the effect of the plan over five years on a straight-line basis for the purposes of
computing capital adequacy.
The Bank is in the stages of examining a multi-year streamlining program.
D. Composition of benefits
1. Employee benefits
As at 31 December
2016 2015 2015
Unaudited Audited
NIS millions
Post-retirement benefits - pension and severance pay
Amount of liability 16,544 17,782 15,764
Fair value of plan assets 6,693 7,258 6,766
Excess liabilities over plan assets (included under other
liabilities) 9,851 10,524 8,998
Long-service (Jubilee) bonus
Amount of liability 127 569 524
Fair value of plan assets - - -
Excess liabilities over plan assets (included under other
liabilities) 127 569 524
Other benefits
Amount of liability 532 664 549
Fair value of plan assets - - -
Excess liabilities over plan assets (included under other
liabilities) 532 664 549
Total1
Excess liabilities in respect of employee rights over plan
assets (included under "Other liabilities") 10,510 11,757 10,0711Of which: in respect of employee benefits overseas 37 226 111
As at 31 March
a a
a
a
(a) Restated.
(b) Reclassified.

137
Note 8 – Employee Rights (cont.)
D. Composition of benefits (cont.)
2. Defined benefit pension plan
A. Commitment and state of funding
1. Change in commitment in respect of forecast benefit
As at 31 December
2016 2015 2015
Unaudited Audited
NIS millions
Commitment in respect of forecast benefit at the
beginning of the period 15,764 16,256 16,256
Service cost 42 54 198
Interest cost 172 193 735
Deposits of plan participants 12 11 46
Actuarial loss (profit) 772 1,422 (701)
Changes in foreign currency exchange rates (17) 2 (9)
Benefits paid (205) (156) (641)
Amendments to plan including structural amendments - - (22)
Reductions, disposals, special contractual benefits in
respect of dismissal - - (98)
Other 4 - -
Commitment in respect of forecast benefit at the end of
the period 16,544 17,782 15,764Commitment in respect of accumulated benefit at the
end of the period 15,654 16,890 15,074
As at 31 March
b
a
a
a
a
.
2. Change in fair value of plan assets and state of funding of the plan
As at 31 December
2016 2015 (a) 2015
Unaudited Audited
NIS millions
Fair value of plan assets at the beginning of the period 6,766 7,041 7,041
Actual return on plan assets: (48) 236 53
Deposits in the plan by the banking corporation 32 31 169
Deposits by plan participants 12 11 46
Changes in foreign currency exchange rates (17) - (11)
Benefits paid (52) (61) (403)
Amendments to plan including structual changes - - (22)
Reductions, disposals, special contractual benefits in
respect of dismissal - - (107)
Fair value of plan assets at the end of the period 6,693 7,258 6,766State of funding - net liability recognized at the end of
the period (included in other liabilities) 9,851 10,524 8,998
As at 31 March
(a) Reclassified
(b) Restated.
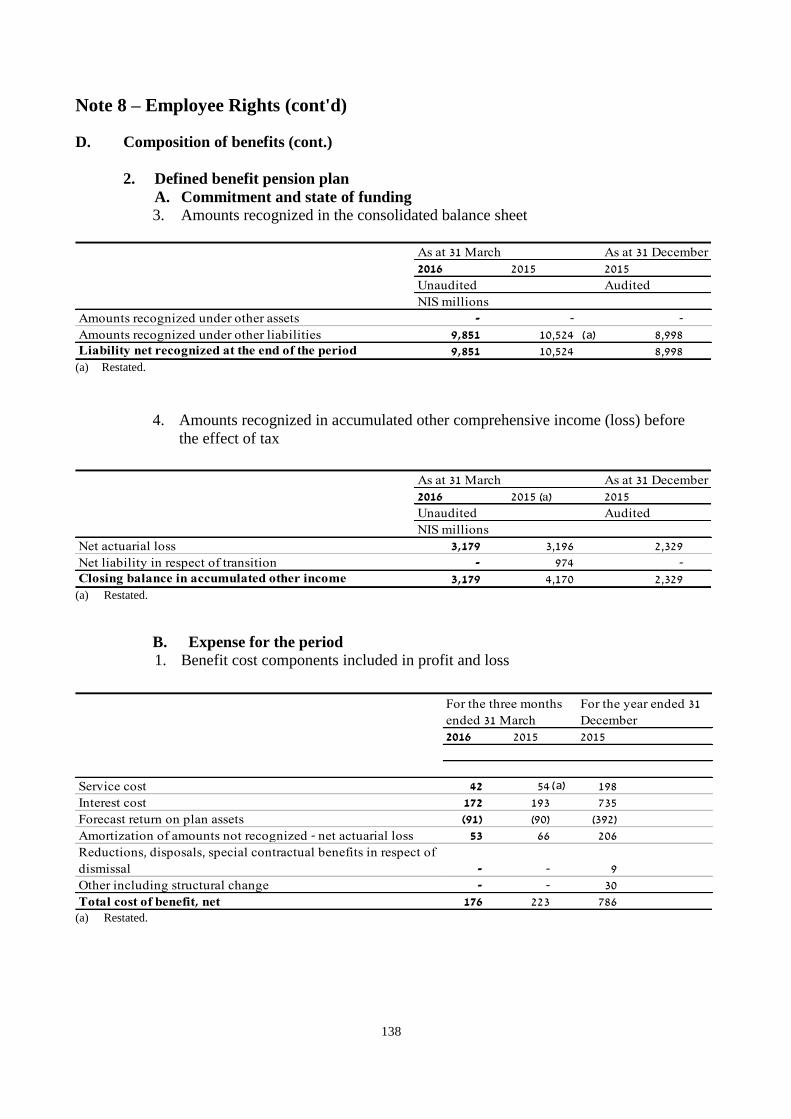
138
Note 8 – Employee Rights (cont'd)
D. Composition of benefits (cont.)
2. Defined benefit pension plan
A. Commitment and state of funding
3. Amounts recognized in the consolidated balance sheet
As at 31 December
2016 2015 2015
Unaudited Audited
NIS millions
Amounts recognized under other assets - - -
Amounts recognized under other liabilities 9,851 10,524 8,998Liability net recognized at the end of the period 9,851 10,524 8,998
As at 31 March
a
(a) Restated.
4. Amounts recognized in accumulated other comprehensive income (loss) before
the effect of tax
As at 31 December
2016 2015 (a) 2015
Unaudited Audited
NIS millions
Net actuarial loss 3,179 3,196 2,329
Net liability in respect of transition - 974 -Closing balance in accumulated other income 3,179 4,170 2,329
As at 31 March
(a) Restated.
B. Expense for the period
1. Benefit cost components included in profit and loss
2016 2015 2015
Service cost 42 54 198
Interest cost 172 193 735
Forecast return on plan assets (91) (90) (392)
Amortization of amounts not recognized - net actuarial loss 53 66 206
Reductions, disposals, special contractual benefits in respect of
dismissal - - 9
Other including structural change - - 30
Total cost of benefit, net 176 223 786
For the year ended 31
December
For the three months
ended 31 March
a
(a) Restated.

139
Note 8 – Employee Rights (cont'd)
D. Composition of benefits (cont.)
2. Defined benefit pension plan (cont'd)
B. Expense for the period
2. Changes in plan assets and commitment for benefit recognized in other
comprehensive income (loss) before the effect of tax
2016 2015 2015
Net actuarial loss (profit) for the period 911 1,276 (362)
Amortization of amounts not recognized - net actuarial profit (53) (66) (206)
Changes in foreign currency exchange rates (8) 3 (5)
Other including structural change - - (30)
Total recognized in other comprehensive income 850 1,213 (603)
Net cost of benefit 176 223 786Total recognized in cost of benefit, net, for the period and in
other comprehensive income 1,026 1,436 183
For the year ended 31
December
For the three months
ended 31 March
a a
(a) Reclassified.
3. Estimate of amounts included in accumulated other comprehensive income that
are expected to be deducted from accumulated other comprehensive income to
appear as an expense in the statement of profit and loss in 2016 before the effect
of tax
For the nine
months ended
31 December
2016
Unaudited
NIS million
Net actuarial loss 218
Total expected to be amortized from accumulated other comprehensive income 218
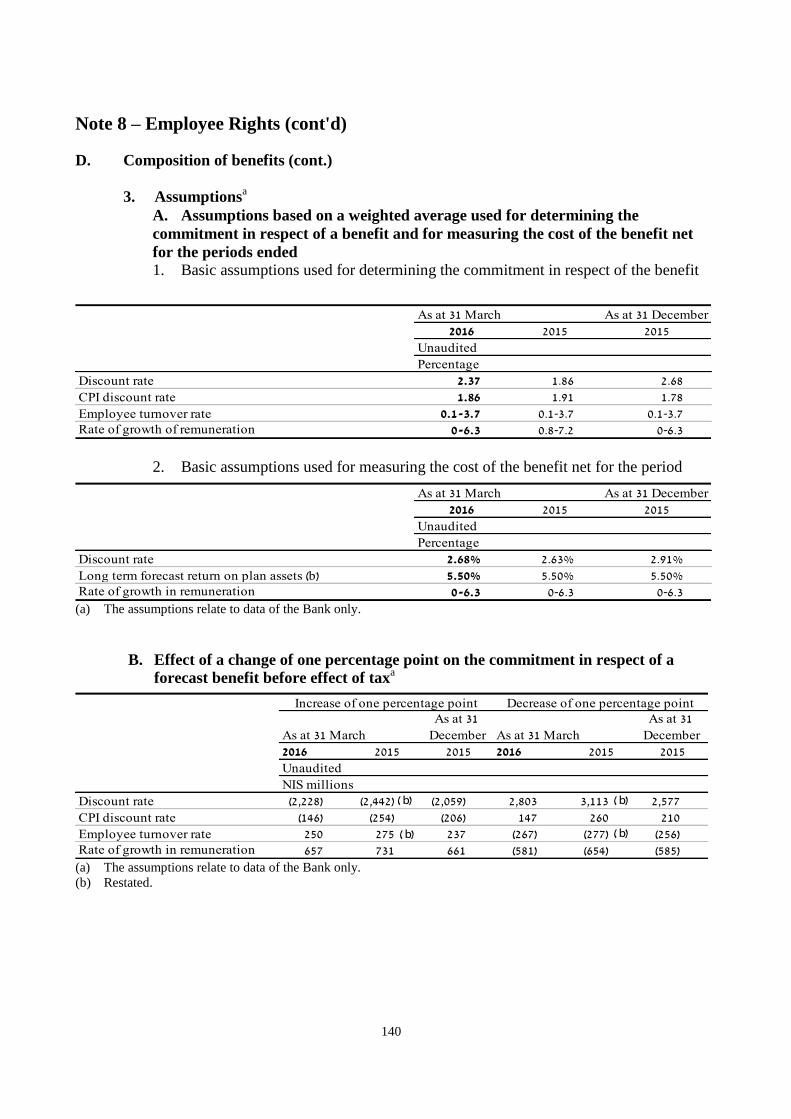
140
Note 8 – Employee Rights (cont'd)
D. Composition of benefits (cont.)
3. Assumptionsa
A. Assumptions based on a weighted average used for determining the
commitment in respect of a benefit and for measuring the cost of the benefit net
for the periods ended
1. Basic assumptions used for determining the commitment in respect of the benefit
As at 31 December
2016 2015 2015
Unaudited
Percentage
Discount rate 2.37 1.86 2.68
CPI discount rate 1.86 1.91 1.78
Employee turnover rate 0.1-3.7 0.1-3.7 0.1-3.7Rate of growth of remuneration 0-6.3 0.8-7.2 0-6.3
As at 31 March
2. Basic assumptions used for measuring the cost of the benefit net for the period
As at 31 December
2016 2015 2015
Unaudited
Percentage
Discount rate 2.68% 2.63% 2.91%
Long term forecast return on plan assets (b) 5.50% 5.50% 5.50%Rate of growth in remuneration 0-6.3 0-6.3 0-6.3
As at 31 March
(a) The assumptions relate to data of the Bank only.
B. Effect of a change of one percentage point on the commitment in respect of a
forecast benefit before effect of taxa
2016 2015 2015 2016 2015 2015
Unaudited
NIS millions
Discount rate (2,228) (2,442) (2,059) 2,803 3,113 2,577
CPI discount rate (146) (254) (206) 147 260 210
Employee turnover rate 250 275 237 (267) (277) (256)Rate of growth in remuneration 657 731 661 (581) (654) (585)
Increase of one percentage point Decrease of one percentage point
As at 31 March As at 31 March
As at 31
December
As at 31
December
b
b
b
b
(a) The assumptions relate to data of the Bank only.
(b) Restated.

141
Note 8 – Employee Rights (cont'd)
The level of the liability for employee rights is affected by several key variables that include market
variables (rates of interest for discounting the liability over various periods) and actuarial variables as
mentioned, with some of the actuarial variables being behavioral variables of employees. It is possible that
there will be a link between changes in market variables and changes in actuarial behavioral variables. For
example, it is possible that if there is a sharp increase in interest rates in the Israeli economy, and in its
wake government bond yields will also rise (which will decrease the level of pension liabilities), the
percentage of employees electing for a pension track will also decrease (a decision which will also reduce
the level of the Bank's liability for pensions).
4. Plan assets
A. Composition of the fair value of plan assets
As at 31 March
As at 31
December
2016 2015 2015
Unaudited
NIS millions
Cash and deposits in banks 136 252 183
Shares 2,607 2,437 2,363
Government bonds 1,505 1,905 1,895
Corporate bonds 2,096 2,187 1,838
Other 349 477 487
Total 6,693 7,258 6,766
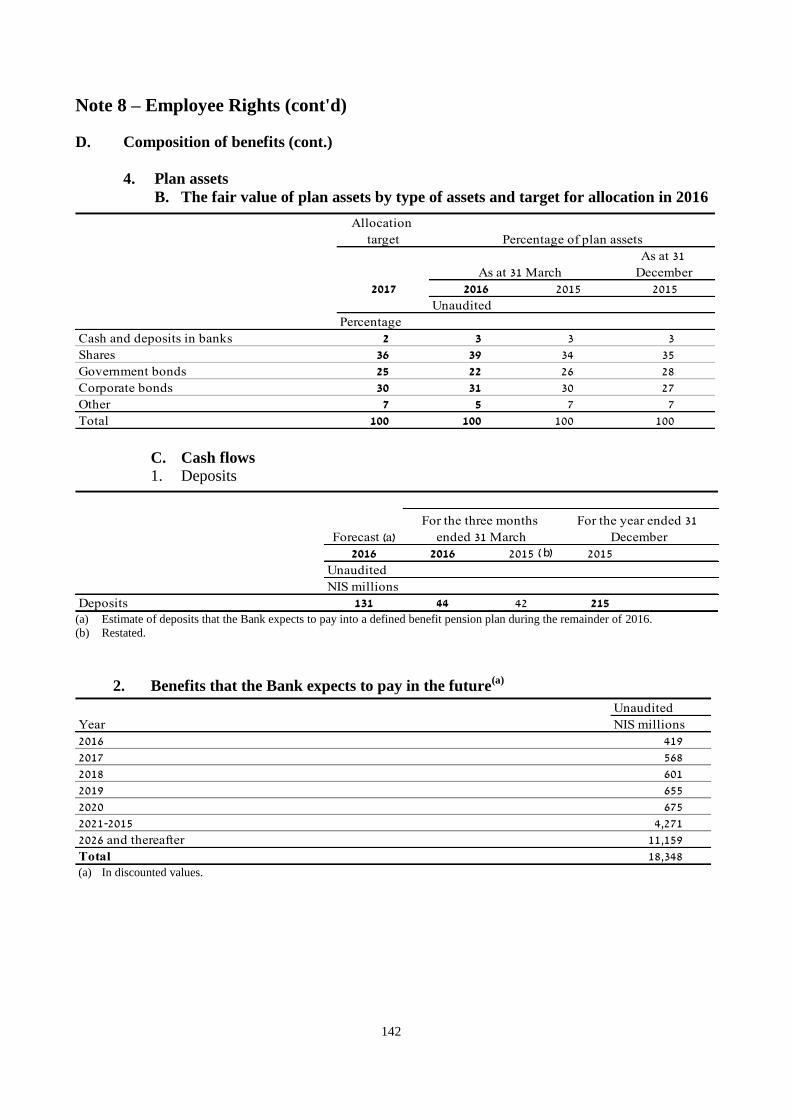
142
Note 8 – Employee Rights (cont'd)
D. Composition of benefits (cont.)
4. Plan assets
B. The fair value of plan assets by type of assets and target for allocation in 2016
Allocation
target
As at 31
December
2017 2016 2015 2015
Unaudited
Percentage
Cash and deposits in banks 2 3 3 3
Shares 36 39 34 35
Government bonds 25 22 26 28
Corporate bonds 30 31 30 27
Other 7 5 7 7
Total 100 100 100 100
Percentage of plan assets
As at 31 March
C. Cash flows
1. Deposits
Forecast (a)
2016 2016 2015 2015
Unaudited
NIS millions
Deposits 131 44 42 215
For the three months
ended 31 March
For the year ended 31
December b
(a) Estimate of deposits that the Bank expects to pay into a defined benefit pension plan during the remainder of 2016. (b) Restated.
2. Benefits that the Bank expects to pay in the future(a)
Unaudited
Year NIS millions
2016 419
2017 568
2018 601
2019 655
2020 675
2021-2015 4,271
2026 and thereafter 11,159
Total 18,348 (a) In discounted values.

143
Note 9A – Capital
Changes in the Bank's equity
The cumulative terms set in the remuneration policy were met for the vesting into shares of the second third
of the PSU units (that were allocated to the Chairman of the Board of Directors, the President and Chief
Executive Officer, and other office-holders in the Bank as part of the approval of the performance-based
annual bonus to office holders in the Bank, in respect of half of the bonus for 2013) (henceforth: "2014
PSU units"), and the second third of the 2014 PSU units vested into shares. Accordingly, on 13 March
2016, office holders in the Bank were allocated blocked shares according to the number of PSU units that
vested on that date. In addition, the terms were met for the vesting of the second third of the RSU units
(allocated in 2013 to two office holders in the Bank) and so the second third of the RSU units vested into
shares. Accordingly, on 14 April 2016, two office holders in the Bank were allocated shares in accordance
with the number of RSU units that vested on that date.
For further details, see Note 24A.B. and 24A.C to the 2015 annual financial statements.
Pursuant to that set forth in the Remuneration Policy, the shares allocated due to the vesting of the 2014
PSU units and RSU units mentioned above, were deposited with the Remuneration Plan Trustee.
The first of the three tranches, of the shares allocated in respect of the vesting of 2014 PSU units, that
vested as stated on 31 March 2015, was blocked for a period of one more year until 13 April 2016
(henceforth: "the blocking period of the first tranche"). In addition, the second of the three tranches was
blocked until the end of the blocking period of the first tranche.
The first of the three tranches, of the shares allocated in respect of the vesting of RSU units, that vested as
stated on 14 April 2015, was blocked until 13 April 2016. The second of the three tranches that vested as
mentioned on 14 April 2016, is not blocked.
For further details, see Note 23.I and 24A.B to the 2015 annual financial statements.
Pursuant to the provisions of the Bank's Remuneration Policy, on 15 March 2016, the Bank issued 938,657
new PSU units (henceforth: "2016 PSU units"), in the name of the Trustee, ESOP Management and Trust
Services Ltd., to the Chairman of the Board of Directors, the President and Chief Executive Officer, and
other office holders in the Bank in respect of half of the bonus for the year 2015. If all the terms are met for
exercising the said 2016 PSU units at each of the vesting dates, as stated in detail in the Report of the
Private Offering published by the Bank on 29 February 2016 (Reference 2016-01-037192) (including
clarifications published on 13 March 2016) (henceforth: "the Private Offering Report"), the said PSU
units will vest into 938,657 ordinary shares of NIS 1 par value each of the Bank, which will constitute
about 0.064% of the issued and paid-up capital of the Bank at the date of issuance of the units.
If the terms set for the vesting of the 2016 PSU units into shares are not met at any of the vesting dates, the
units which were to have been vested at that date will expire and become void, and all their associated
rights will expire and become void.
The 2016 PSU units allocated as above are not marketable, and pursuant to the approval of the Tel-Aviv
Stock Exchange Ltd. (henceforth: "the Stock Exchange"), the shares deriving from the vesting of the
above units will be listed for trading on the Stock Exchange in the name of the nominee company of Bank
Leumi Le-Israel B.M.
For further details, see Note 23.G to the 2015 annual financial statements.

144
Note 9A – Capital (cont.)
Changes in the Bank's equity (cont.)
On 20 March 2016, the Board of Directors decided to issue 48,938,037 ordinary shares of NIS 1 par value
of the Bank, representing approximately 3.21% of the issued and paid-up capital of the Bank after the
allocation, in the name of the Trustee, Tamir Fishman Trusts 2004 Ltd., in respect of the results of the offer
to employees and office holders reported by the Bank on 16 March (Reference No. 2016-01-007473) and
on 20 March 2016 (Reference No. 2016-01-010026) in accordance with an outline published by the Bank
on 18 February 2016, (Conversion of employees and office holders' rights) (Reference 2016-01-030790), as
amended on 23 February 2016 (Reference 2016-01-033361).
For more details in connection with the outline of the issuance to employees and office holders, see Note 24A.D. to the annual
financial statements for 2015.
Pursuant to the Shelf Proposal Report dated 20 January 2016, the Bank issued, on 21 January 2016, the
amount of NIS 926 million in Series 400 Subordinated Notes.
The Subordinated Notes are repayable in one amount on 21 January 2026 with an option to the issuer of
early repayment not before 21 January 2021, and not later than 21 February 2021, are not linked to any
linkage base, bear fixed annual interest of 3.25% per annum, until the early repayment. At that time, on the
assumption of non-realization of the right of the Bank to early repayment, the nominal interest of the Note
will be updated according to the difference between Ogen interest (as defined in the Shelf Proposal Report)
on the date of issuance and that at the date of the interest adjustment.
If there are circumstances of a defining event (a defining event of non-sustainability or a defining event for
the absorption of losses of principal, whichever the earlier), the Subordinated Notes will be converted into
shares at the market price of the shares on the date of conversion or at the floor rate determined (NIS 6.78
per share).
The Subordinated Notes are eligible for inclusion in Tier 2 capital as of the date of issuance.
145
Note 9B –Capital Adequacy, Leverage and Liquidity
General
In May 2013, the Supervisor of Banks amended Proper Conduct of Banking Business Directives No. 201-
211 on Measurement and Capital Adequacy, so as to adapt them to the Basel III directives.
It should be emphasized that the Basel III directives set forth significant changes in the calculation of
regulatory capital requirements, inter alia, relating to:
1. Regulatory capital components
2. Deductions from capital and regulatory adjustments
3. Treatment of exposures to financial corporations
4. Treatment of exposures to credit risk in respect of impaired debts
5. Allocation of capital in respect of CVA risk.
The amendments to the above directives came into effect on 1 January 2014, and implementation is gradual
pursuant to the transitional provisions set forth in Proper Conduct of Banking Business Directive No. 299
on Measurement and Capital Adequacy – Regulatory Capital – Transitional Provisions.
Pursuant to the transitional provisions, regulatory adjustments and deductions from capital as well as
minority interests not eligible for inclusion in regulatory capital are gradually deducted from the capital at
the rate of 20% per annum, from 1 January 2014 until 1 January 2018. Capital instruments no loner eligible
as regulatory capital were recognized up to the ceiling of 80% pm 1 January 2014, and ever subsequent
year this ceiling is reduced by an additional 10% until 1 January 2022. As of 2016, the rate of deductions
from regulatory capital is 60% and the ceiling for eligible instruments as regulatory capital is 60%.
In addition, on 29 August 2013, a circular of the Banking Supervision Department was published on Basel
Disclosure Requirements relating to the Composition of Capital, which set forth updated disclosure
requirements that banks will be required to include as part of the adoption of the Basel III directives.
On 22 October 2015, the Banking Supervision Department published a final circular on "Capital Requirements in respect of Exposures to Central Counterparties ((hereinafter: "the circular"). The circular amends Proper Conduct of Banking Business Directives 203 and 204 with the aim of adapting them to the Basel Committee recommendation relating capital requirements of banking corporations to central counterparties. The circular sets out the new instructions that will apply to exposures to central counterparties caused by OTC derivatives, derivative transactions quoted on the Tel Aviv Stock Exchange and securities financing transactions.
The directives define what is a qualified central counterparty and what is not a qualified central counterparty, with reduced capital requirements determined for the former. The main changes relate to calculating the following exposures:
1. As a rule, exposures of a banking corporation that is a member of a clearing house to a central counterparty will be given a risk weighting of 2% compared with a zero exposure value prior to the amendment.
2. Exposures of a banking corporation to a customer active in the Stock Exchange that were calculated according to Stock Exchange rules will be canceled. Pursuant to the amendment, the capital requirement for these exposures is to be calculated as if it were a two-sided transaction, including the allocation of capital in respect of CVA risk.
3. In addition, provisions were set out regarding calculating exposures of a banking corporation to a customer active by means of a member of the clearing house as well as the treatment of collateral

146
deposited by a banking corporation with a member of the clearing house or with a central counterparty.
4. Exposures to a central counterparty that is not qualified will be weighted in accordance with the relevant risk weighting for the counterparty whereas transfers to a risk fund will be weighted at 1250%.
The aforesaid in this circular will come into effect on 1 July 2016. Through 30 June 2017, the Tel Aviv Stock Exchange may be considered a qualified central counterparty. The Bank is taking steps to update the manner of calculating the capital ratios and the leverage ratio in accordance with the update of the said directive. In addition, the Bank is examining the effect of the update of the said directive on its capital planning, capital targets and leverage targets. On the assumption that the Tel Aviv Stock Exchange will be recognized by the middle of 2017 as a qualifying central counterparty, the impact on Leumi's implementation of the directive, based on data from the end of 2015, is not material. If the Tel Aviv Stock Exchange will not be recognized as a qualifying central counterparty, the estimated increase in total risk assets at the end of 2015 is about NIS 3.5 billion, a decrease of 0.11% in the capital adequacy ratio of Tier 1 shareholders' equity.
Insurance for the Portfolio of Guarantees under the Sales Law
On 8 March 2016, agreements were completed with international reinsurers, with a high international
ranking, for the purchase of insurance for the Portfolio of Guarantees under the Sales Law (Apartments)
and obligations to issue such guarantees. The insurance policy guarantees the Bank in the event it is
required to pay due to the realization of the guarantees, under the terms of the policy. Purchasing insurance
enables the reduction in restricted capital for credit risk arising from the issuance of guarantees, using the
policy as a "Credit Risk Mitigator ", in accordance with Proper Conduct of Banking Business Directive No.
203, and contributed to an improvement of approximately 0.23% in the capital adequacy ratio of Tier 1
shareholders' equity.
Capital deduction in respect of deferred tax asset
On 4 April 2016, an updated FAQ was published by the Banking Supervision Department for
implementation of Proper Conduct of Banking Business Directives concerning the measurement and
adequacy of capital adequacy. The aim of the update is to clarify the handling of the salary tax component
with regard to the calculation of capital requirements and deduction from capital in respect of a deferred tax
asset. According to the clarification, a banking corporation which concludes that under the circumstances at
the time of the report, it is virtually certain regarding a deferred tax asset in the amount of salary tax
included in the Bank's books, it will not be possible to apply the deduction threshold contained in Section
13 of the Directive on that part of the deferred tax asset. To this end, the Bank will be entitled to apply the
test of the deduction threshold on the amount of net deferred taxes, after deduction of salary tax as stated
above. The deferred tax asset as stated not deducted from equity will be weighted as a risk asset by 250%.
The Bank implements guidelines from the date of their publication on a prospective basis, without
aadjusting comparative figures and subject to the transitional provisions set forth in Proper Conduct of
Banking Business Directive No. 299 of the Banking Supervision Department. This update contributed to an
improvement of approximately 0.20% in the Bank's capital adequacy ratio of Tier 1 shareholders' equity
and approximately 0.17% in the total capital ratio.
147
Note 9B –Capital Adequacy, Leverage and Liquidity (cont.)
31 March 2016 31 March 2015 (b)
31 December
2015
Unaudited Audited
(NIS millions)
A. Data
Tier 1 capital, after regulatory adjustments and
deductions 29,719 27,416 29,001
Tier 2 capital, after deductions 12,890 13,329 12,593Total capital 42,609 40,745 41,594
Weighted balances of risk assets
Credit risk 272,523 271,585 277,034
Market risk 5,793 5,952 5,167
Operational risk (b) 20,100 20,376 20,432Total weighted balances of risk assets 298,416 297,913 302,633
Ratio of capital to risk components
Ratio of Tier 1 capital to risk components 9.96% 9.20% 9.58%
Ratio of total capital to risk components 14.28% 13.68% 13.74%
Minimum Tier 1 capital ratio required by the
Supervisor of Banks (a) 9.14% 9.00% 9.10%
Minimum total capital ratio required by the
Supervisor of Banks (a) 12.64% 12.50% 12.60%
B. Principal subsidiary companies
Leumi Card Ltd.
Ratio of Tier 1 capital to risk components 16.75% 16.14% 16.89%
Ratio of total capital to risk components 17.68% 17.09% 17.82%
Minimum Tier 1 capital ratio required by the
Supervisor of Banks (c) 9.00% 9.00% 9.00%
Minimum total capital ratio required by the
Supervisor of Banks (c) 12.50% 12.50% 12.50%
Bank Leumi USA (d)
Ratio of Tier 1 capital to risk components 12.45% 11.89% 12.33%
Ratio of total capital to risk components 15.21% 14.58% 15.13%
Minimum Tier 1 shareholders' equity ratio
required by the local authorities 8.00% 8.00% 8.00%Minimum total capital ratio required by the local
authorities 10.00% 10.00% 10.00%
Capital for purposes of calculating capital ratio
(a) Including capital requirements at a rate expressing 0.27% of the balance of housing loans at the reporting date. This
requirement is being implemented gradually in equal quarterly amounts from 1 April 2015 to 1 January 2017.
Accordingly, the minimum Tier 1 shareholders' equity ratio and the minimum total equity ratio required by the Supervisor of
Banks as at 1 January 2017, according to data at the reporting date, are 10.27% and13.77%, respectively.
(b) Restated including implementation of to the directives of the Supervisor of Banks on capitalization of software costs.
General note:
On 31 December 2015, Arab Israel Bank merged with Leumi.
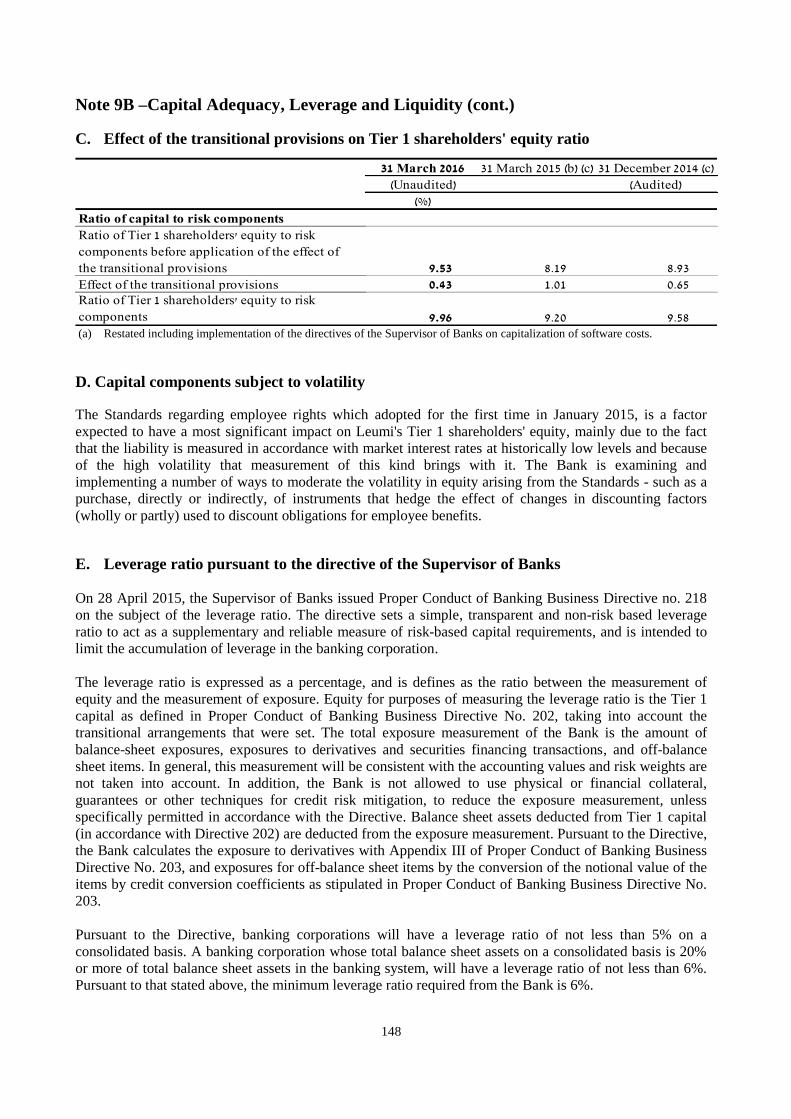
148
Note 9B –Capital Adequacy, Leverage and Liquidity (cont.)
C. Effect of the transitional provisions on Tier 1 shareholders' equity ratio
31 March 2016 31 March 2015 (b) (c) 31 December 2014 (c)
(Unaudited) (Audited)
(%)
Ratio of capital to risk components
Ratio of Tier 1 shareholders' equity to risk
components before application of the effect of
the transitional provisions 9.53 8.19 8.93
Effect of the transitional provisions 0.43 1.01 0.65Ratio of Tier 1 shareholders' equity to risk
components 9.96 9.20 9.58 (a) Restated including implementation of the directives of the Supervisor of Banks on capitalization of software costs.
D. Capital components subject to volatility
The Standards regarding employee rights which adopted for the first time in January 2015, is a factor
expected to have a most significant impact on Leumi's Tier 1 shareholders' equity, mainly due to the fact
that the liability is measured in accordance with market interest rates at historically low levels and because
of the high volatility that measurement of this kind brings with it. The Bank is examining and
implementing a number of ways to moderate the volatility in equity arising from the Standards - such as a
purchase, directly or indirectly, of instruments that hedge the effect of changes in discounting factors
(wholly or partly) used to discount obligations for employee benefits.
E. Leverage ratio pursuant to the directive of the Supervisor of Banks
On 28 April 2015, the Supervisor of Banks issued Proper Conduct of Banking Business Directive no. 218
on the subject of the leverage ratio. The directive sets a simple, transparent and non-risk based leverage
ratio to act as a supplementary and reliable measure of risk-based capital requirements, and is intended to
limit the accumulation of leverage in the banking corporation.
The leverage ratio is expressed as a percentage, and is defines as the ratio between the measurement of
equity and the measurement of exposure. Equity for purposes of measuring the leverage ratio is the Tier 1
capital as defined in Proper Conduct of Banking Business Directive No. 202, taking into account the
transitional arrangements that were set. The total exposure measurement of the Bank is the amount of
balance-sheet exposures, exposures to derivatives and securities financing transactions, and off-balance
sheet items. In general, this measurement will be consistent with the accounting values and risk weights are
not taken into account. In addition, the Bank is not allowed to use physical or financial collateral,
guarantees or other techniques for credit risk mitigation, to reduce the exposure measurement, unless
specifically permitted in accordance with the Directive. Balance sheet assets deducted from Tier 1 capital
(in accordance with Directive 202) are deducted from the exposure measurement. Pursuant to the Directive,
the Bank calculates the exposure to derivatives with Appendix III of Proper Conduct of Banking Business
Directive No. 203, and exposures for off-balance sheet items by the conversion of the notional value of the
items by credit conversion coefficients as stipulated in Proper Conduct of Banking Business Directive No.
203.
Pursuant to the Directive, banking corporations will have a leverage ratio of not less than 5% on a
consolidated basis. A banking corporation whose total balance sheet assets on a consolidated basis is 20%
or more of total balance sheet assets in the banking system, will have a leverage ratio of not less than 6%.
Pursuant to that stated above, the minimum leverage ratio required from the Bank is 6%.

149
A banking corporation is required to comply with the minimum leverage ratio from 1 January 2018. A
banking corporation meeting the minimum leverage ratio applying to it on the date of publication of the
Directive shall not go below the threshold defined. According to the Directive, a banking corporation that
on the date of publication of the Directive does not meet the minimum leverage ratio applying to it, is
required to increase the leverage ratio in fixed quarterly installments until 1 January 2018.

150
Note 9B –Capital Adequacy, Leverage and Liquidity (cont.)
31 March
2016
31 December
2015
Unaudited Audited
NIS millions
A. In consolidated terms
Tier 1 capital 29,719 29,001
Total exposures 467,663 462,680
Leverage ratio
Leverage ratio 6.35% 6.27%
Minimum leverage ratio required by the Supervisor of Banks 6.00% 6.00%
B. Significant subsidiary companies
Leumi Card Ltd.
Leverage ratio 11.52% 11.66%
Minimum leverage ratio required by the Supervisor of Banks 5.00% 5.00%
Bank Leumi USA (a)
Leverage ratio 10.31% 9.98% (a) Implemented in accordance with local regulations, under which there are no requirements for a minimum
leverage ratio.
E. Liquidity coverage ratio pursuant to the directive of the Supervisor of Banks
On 28 September 2014, a circular was issued in which was added Proper Conduct of Banking
Business Directive No. 221 on the liquidity coverage ratio, which adopts the recommendations of the
Basel Committee regarding the liquidity coverage ratio in the banking system in Israel. The liquidity
coverage ratio examines a horizon of 30 days in an extreme scenario and is designed to ensure that the
banking corporation's inventory of high-quality liquid assets that responds to the liquidity needs of the
corporation for this time horizon. As part of the directive, the method is determined for calculating the
liquidity coverage ratio, including setting the characteristics and operational requirements for the
"inventory of high-quality liquid assets" (the numerator) and safety coefficients in respect of them and
the net cash outflow expected in the stress scenario defined in the directive for 30 calendar days (the
denominator).
The stress scenario determined in the directive combines a shock specific to the corporation with
systemic shock in which standard withdrawal rates for cash outflows and deposit rates for cash inflows
have been set out in accordance with the different categories of balances.
The liquidity coverage ratio was introduced as of 1 April 2015.
In accordance with the transitional provisions, with effect from 1 April 2015 the minimum
requirement was set at 60% and will grow to 80% on 1 January 2016 and to 100% in 1 January 2017
and thereafter. However, in a period of financial pressure a banking corporation may fall below these
minimum requirements.

151
Note 9B –Capital Adequacy, Leverage and Liquidity (cont.)
In addition, on 28 September 2014, a circular was issued on the subject of a Temporary Directive -
Implementation of Disclosure Requirements under the Third Pillar of Basel - Disclosure of the
Liquidity Coverage Ratio (hereinafter: the "circular"). In the framework of the circular the Public
Reporting Directives have been amended to incorporate the disclosure requirements that the banks are
required to include as part of the adoption of the liquidity coverage ratio.
Accordingly, it was determined, inter alia, that as of 1 April 2015, disclosure requirements were added
for the liquidity coverage ratio in consolidated and single entity terms (subject to its application) in the
Note to the financial statements, whose name will be changed to "Note on Capital Adequacy and
Liquidity Pursuant to the Directives of the Supervisor of Banks".
The liquidity coverage ratio of the banking corporation is calculated based on average daily
observations and the consolidated liquidity coverage ratio is calculated based on the average of
monthly observations for the period.
For the
three
months
ended 31
March
For the year
ended 31
December
2016 2015
Unaudited Audited
Percentage
A. In consolidated terms
Liquidity cover ratio 125 105
Minimum liquidity cover ratio required by the Supervisor of Banks 80 60
B. In terms of the banking corporation
Liquidity cover ratio 124 103
Minimum liquidity cover ratio required by the Supervisor of Banks 80 60 Leumi Card and Bank Leumi USA have no requirements for a liquidity cover ratio.

152
Note 10 - Contingent Liabilities and Special Commitments
A. Contingent liabilities and special commitments
(1) Long-term rental contracts - Rental of
buildings, equipment and vehicles and
maintenance fees regarding commitments
payable in the following years
First year 274 272 324
Second year 205 210 223
Third year 182 191 197
Fourth year 154 172 164
Fifth year 121 137 138
After five years 1,206 872 1,248
Total 2,142 1,854 2,294
(2) Commitments to purchase securities 709 719 466
(3) Commitments to invest in buildings,
equipment and others 3,669 190 377
31 December 2015
NIS millions
Audited
31 March 2016 31 March 2015
Unaudited
B. Legal claims
In the regular course of business, legal claims have been filed against the Bank and certain consolidated
companies, including petitions for approval of class actions.
In Note 25 to the financial statements of the Bank at 31 December 2015, information was included
regarding the significant claims at the date of the said statements. In the Note below, information is
included regarding material claims submitted in the period of the report and after the reporting period,
and changes that occurred regarding material claims submitted in previous reporting periods, and does
not include information on claims reported in Note 25 to the Annual Report that were filed before the
period of the report and in which there was no change.
In the opinion of the Management of the Bank and the managements of the consolidated companies, the
total additional exposure arising from legal claims filed against the Bank and against the consolidated
companies on various subjects, the amount of each of which exceeds NIS 2 million, and regarding
which the chances of the claims succeeding are not remote, amounts to some NIS 48 million.
1. In the opinion of the Management of the Bank and the managements of the consolidated
companies, based on legal opinions regarding the chances of the claims succeeding, including the
petitions for approval of class actions, appropriate provisions have been recorded in the financial
statements, insofar as required, to cover damages resulting from the said claims.
A. On 12 September 2006, a petition to approve a class action was filed in the Tel Aviv-Jaffa
District Court against the Bank, against Bank Hapoalim and against Israel Discount Bank in
an amount claimed against all respondents of NIS 7 billion, while in the body of the claim, it is
contended that the damage to the group which the claimant wishes to represent amounts to
NIS 10 billion. According to the petitioner, the respondent banks charged their customers with
interest for unlinked shekel credit, a commission for credit allotment and fixed management
fees with regard to debitory current accounts at identical rates and amounts, as a result of a
prohibited restrictive arrangement.

153
Note 10 - Contingent Liabilities and Special Commitments (cont'd)
At the same time, as part of the appeal proceedings against the decision of the Anti-Trust
Commissioner dated 26 April 2009, under the heading "Restrictive Arrangements between
Bank Hapoalim, Bank Leumi, Bank Discount, Bank Mizrahi, and the First International Bank,
concerning the Transfer of Information relating to Commissions" ("the decision"), the Anti-
Trust Tribunal on 15 June 2014 gave effect to an agreed order for agreement between the
banks appealing to the Anti-Trust Commissioner, under which, inter alia, subject to the deposit
of an amount of NIS 70 million (the Bank's share – NIS 21.425 million) with a trustee, the
decision would be void. This amount was deposited with a trustee ("the Trustee"). It was also
decided in the framework of the agreed order that the banks that are party to it can use these
funds to make settlement agreements in various claims, including the claims listed in this
paragraph B below, and in paragraph B below, (and additional claims detailed in paragraphs
1.2A and B in Note 25 to the financial statements of the Bank as at 31 December 2015),
subject to terms set forth in the order.
On 11 December 2014 a petition was filed in the court requesting approval of a compromise
arrangement according to which the respondent banks will pay to the members of the Group a
total of NIS 35 million from the money deposited with the trustee. In January 2015 the
petitioners, in the process described in paragraph B below, filed a petition to cancel the
decision regarding publication of the arrangement or alternatively, to delay until after the
decision between the process described herein, and that described in paragraph B below. In the
hearing that took place on 25 March 2015 the parties were asked to consider the court's
proposal regarding continuation of the management of the two proceedings (and inter-alia, to
consider a merger. The parties acted to prepare a revised compromise arrangement, paying
attention to the court's comments. On 25 February 2016 a revised a compromise arrangement
was filed in the court for approval as described in this paragraph, and that described in
paragraph B below, according to which all the respondent banks will pay to the members of
the Group, in the two proceedings together, a total of NIS 47 million (not including fees and
remunerations to attorneys and petitioners in the two proceedings) whereby NIS 35 million
from the total amount will be paid from the money deposited with the trustee, as stated above,
and to which NIS 12 million will be added by the banks (the Bank's portion of this additional
amount is NIS 4.5 million). On 15 May 2016, the Court approved the compromise agreement
with the effect of a judgment.
B. On 23 November 2006, a claim and a petition to approve the claim as a class action were filed
in the Jerusalem District Court against the Bank, against Bank Hapoalim B.M. and against
Israel Discount Bank Ltd. The petitioners allege that in respect of credit to the household
sector, the banks collect interest at a rate that is much higher than that collected from the
commercial sector and from the corporate sector.. The alleged damage is NIS 5.6 billion
according to one method, and NIS 5.2 billion according to a second method. The damage
claimed attributed to the Bank’s customers is at least NIS 1.6 billion.. On 21 January 2014, the
Court decided to transfer the proceedings in the claim to the Tel-Aviv-Jaffa Court that is
dealing with the proceedings described in Section A above. See paragraph A above for an
update regarding proceedings in this claim as well.
C. On 1 April 2007, a petition was filed with the Tel Aviv District Court to approve a class action
against the Bank, and against three other banks and also against other respondents that are,
allegedly, members of the Stock Exchange. According to the petitioners, the respondents
charged the managers of mutual funds under their control commissions for buying and selling
of securities (brokerage commissions) and for performing transactions in foreign currency,
which were higher than the fees charged to other institutions and that, according to the
petitioners, is in violation of the provisions of the Joint Investment Trust Law, 1994, as
worded then, and a breach of other obligations. The petitioners claimed that the collection of
the (alleged) excessive fees continued unlawfully even after the sale of control of the mutual
funds by the banks to the other respondents. According to the petitioners, the total amount of
154
damages caused to all the members of the group by all the respondents amounts to
approximately NIS 386 million, of which damages of NIS 130 million is attributed to the
Bank. On 10 May 2016, the Court handed down its verdict rejecting the petition for approval
of the class action.
D. On 17 March 2014, a special manager of a company in liquidation (the "Company" and "the
Special Manager") filed a petition in the Central District Court to issue instructions against the
Bank, in which it requested that the Court declare that the Bank will bear the payment to the
Company (the liquidation fund) in an aggregate amount of NIS 1,200 million, of which an
amount of NIS 635 million to cover all the company's debts to its creditors and an amount of
NIS 565 million for repayment of the full value of the assets of the Company in the principal
amount standing according to the special manager as at 25 March 2001 in the amount of NIS
165 million, plus interest from that date at the rate the Company was obliged to pay the Bank.
According to the special manager, the Bank is to bear individual responsibility for the
liabilities of the company, since allegedly the Bank is to be deemed an "office holder" in the
company due to its alleged control over the company; since the Bank is to be deemed as a
"director de-facto" or a "shadow director" in the company; because of its responsibility in
jointly committing and / or jointly misleading in allegedly fraudulent actions detailed in the
petition; and because of the doctrine of lender liability.
It should be noted that as part of the motion, the special manager retained the right to file
additional proceedings against the Bank and / or other officers of the company and / or
individuals on behalf of the Bank and lawyers advising the Bank. The Bank has filed its
response to the petition.
On 20 April 2015, the Supreme Court decided that insofar as it will be decided to take further
action, a new official would be appointed for the Company, unrelated to the previous special
manager or his firm, and he will deal with all future matters, if any. The attorney of the firm of
the special manager that filed the petition may continue dealing with the pending proceedings
only. On 17 September 2015, the Official Receiver filed a petition to appoint another lawyer
to a role in the case, who would be authorized to carry out further investigations in this
proceeding. The Bank has filed its response to the petition. On 20 March 2016 the Court
decided to dismiss the petition of the Official Receiver.
E. On 6 January 2015, a petition was filed with the Central District Court, for approval of a class
action for an amount claimed of NIS 400 million, based on estimates and valuations of the
expert of the petitioner. According to the petitioner, the Bank is violating the provisions of the
Interest Rate Law (Determination of the Maximum Interest Rate), 1970, under which interest
on arrears is not to be charged on index-linked loans at a rate exceeding 17% per annum, in
that it charges interest on arrears on index-linked loans at the rate of 18.3891% per annum,
which according to the petitioner, exceeds the rate allowed. The petitioner attached an expert
opinion to the request. On 15 June 2015, the petitioner filed an amended petition according to
which, in light of proceedings in the Supreme Court which support the position of the Bank, it
reduces the relief requested for a future change in the manner of interest collection. On 16
September 2015, the Bank filed a petition for dismissal of the petition for approval, inter alia
on the grounds that in the situation where the Bank is acting lawfully and according to the
ruling of the Supreme Court, there are no grounds for the claim against it and it is not possible
to approve a class action. On 20 December 2015, the Central District Court decided to dismiss
the petition for approval of a class action and on 14 January 2016, an appeal was filed against
this decision.
155
2. In addition, there are legal claims pending against the Bank, including petitions for the approval of
class actions, as detailed below. In the opinion of the Management of the Bank, based on legal
opinions with regard to the chances of these legal proceedings, it is not possible, at this stage, to
estimate the chances of the claims, and therefore no provision has been recorded in respect thereof.
A. On 29 April 2015, a petition was filed in the Tel Aviv District Court for approval of a class
action against the Bank. The action pertains to the petitioner's claim that the funds of
Holocaust survivors, which were deposited before the Second World War in the Anglo-
Palestine Bank and not withdrawn by the customers during the war, were returned to the
survivors or their heirs and allegedly were not revalued in real terms. The petitioner claims
personal damages of NIS 251,266 and the amount of the group claim is estimated by him at
NIS 150 million. On 5 August 2015, the Bank filed a petition for dismissal of the petition for
approval and the personal claim of the petitioner. The petition to dismiss was rejected and the
Bank has to submit its response.
B. On 22 July 2015, the Bank received a petition for approval of a class action, filed against the
Bank in the Central District Court. The petition concerns the claim of the petitioner that
payments made directly to the Bank on account of a debt in respect of which a collection
process is being conducted by the Enforcement and Collection Authority, are reported late by
the Bank to the Enforcement and Collection Authority, resulting in the creation of an alleged
discrepancy between the actual debt and the debt recorded in the file of the Enforcement and
Collection Authority.
In addition, the petitioner claims that when the Bank makes a late report of a payment, the
debtor receives a credit for interest charged during the period between the payment and the
report. The petitioner claims that, up to the end of 2010, the credit received was at an interest
rate lower than the banking interest accrued on the debt. Only in 2010, a change was made in
the Enforcement and Collection Authority’s systems that enabled the crediting of interest at
the appropriate rate. The petitioner claims personal injury of NIS 33.46, and estimates the
amount of the group claim in NIS millions, without specifying an amount or a detailed
calculation.
C. On 11 February 2016, petition for approval of a class action was filed with the Tel Aviv
District Court against the Bank and against four other banks. The action relates to the
petitioner's claim that the banks give various benefits in student accounts, but restricts the age
of the students eligible for the benefits, which the petitioner claims is contrary to the law. The
petitioner claims personal damages of NIS 11 thousand, and the amount of the claim for the
whole group the petitioner wishes to represent in the class action against the five banks
together is estimated at NIS 219 million.
D. In the United States District Court for the District of Colombia a petition was filed on 7 March
2016, by a large number of petitioners, against tens of plaintiffs, among them: the Bank, Bank
Leumi USA, Bank Hapoalim, private individuals such as: Sheldon Adelson, Irving Moskovitz,
Haim Saban, Lev Leviev and others, and against various institutions, such as the Friendly
Associations connected with settlements, construction companies such as Africa Israel and
Dania Cebus and other companies such as Volvo, HP, Motorola, Israel Chemicals, Ahava
(Dead Sea Products), and more.
The subject of the petition, the petition claimed that persons and the above institutions support
settlements, in such a way as to harm Palestinian residents, their property and their rights,
against the Banks it is claimed, inter-alia, that the transfer of funds by the entities supporting
settlements was made through Bank Transfers, where, according to the petitioners, the Banks
knew from the "know the customer" rules, what the transferred funds were intended for, and
executed the transfers in order to promote their business and profits.
The amount of the petition against all the plaintiffs together stands at $34.5 billion. The legal
or economic basis for this amount was not clarified, and no explanation given to relate the
petitioners with the unrealistic sum requested in the petition, or details of the damages claimed
against the Bank.
156
3. Below are details of claims and petitions for approval of class actions in material amounts filed
against the Bank's subsidiary companies. In the opinion of the management of the Bank, based on
the opinion of the management of the relevant subsidiaries that are based on the opinion of its legal
counsel with regard to the chances of these legal proceedings, appropriate provisions have been
included in the financial statements, where required, to cover damage resulting from the said
claims:
On 23 June 2009, a petition was filed in the Tel Aviv District Court for approval of a class action
against Standard and Force Elevators Ltd, Keshet Bonds Ltd ("Keshet"), Bank Leumi Le'Israel
Trust Company ("The Trust Company") and 6 other plaintiffs. This petition was withdrawn and
amalgamated with a similar petition which was resubmitted as an amalgamated petition. The
amount of the class action claimed from all the plaintiffs stood at NIS 286 million. In the complaint
no clear connection of a specific sum was made for each plaintiff. The petition for approval relates
to bonds issued by Keshet, that were issued in NOTES, issued by Lehman Brothers Bankhaus A G.
The petitioner claims that with the crash of Lehman Brothers, the price of the bonds fell and their
trading ceased. Against the Trust Company, that acted as trustee for holding the bonds issued by
Keshet, the petitioner claimed that according to the petitioner, no actions were taken to prevent or
minimalize, the damage caused to the bond holders. On 16 May 2016, the Court approved a
compromise arrangement in the claim. The amount to be paid to the group members represented is
about NIS 5.3 million. Out of this amount, the Trust Company's portion of the payment is NIS
195,000.
4. Below are details of claims and petitions for approval of class actions in material amounts filed
against the Bank's subsidiary companies. In the opinion of the management of the Bank, based on
the opinion of the management of the relevant subsidiaries that are based on the opinion of its legal
counsel with regard to the chances of these legal proceedings. It is not possible at this stage to
evaluate their chances and for this reason no provision has been made in their respect.
On 28 April 2014, a petition for approval of a class action was filed with the Central District Court
against Leumi Card, Isracard, and C.A.L., in the amount of NIS 1.7 billion, relating to the charging
of vendors with interchange commission in respect of transactions executed by means of debit
cards and prepaid cards that are reloaded in advance. The petitioner claims that the interchange
commission charged on these cards (as opposed to credit cards), did not receive approval from the
Anti-Trust Court, and is a restrictive arrangement. In addition, the arrangement between the
respondents, under which proceeds of transactions are transferred to vendors with a delay of some
20 days, is also a restrictive arrangement or a discriminating condition in a uniform contract. An
amended petition for withdrawal that was submitted, was approved by the Court in July 2015. In
addition, a number of petitions were filed with the Court to replace the petitioner and his
representative. On 20 October 2015, the Court ordered that each of the groups requesting to serve
as representatives of the group is required to file a document with the Court explaining, inter alia,
how it intends to conduct the action, and the Court will give its decision with reference to the
identity of the petitioners (and their representatives) that will be chosen to stand behind the petition
for approval as a class action. It was further decided that the group that is chosen will be required to
file an amended petition for approval, the date of whose filing will be decided after a decision is
given regarding the identity of the petitioners. On 9 March 2016, the Court determined the identity
of the group that will serve as representative in the petition. The Court also determined that an
amended petition will be submitted for approval of the petition as a class action, and afterward
answers and responses to questions will be submitted.
5. For details of legal proceedings regarding US customers see paragraph C.1.A in this Note, below.
157
B. Contingent liabilities and other special commitments
1. The US customers affair:
For details of the US customers affair, including arrangements with the U.S. authorities and details
of the legal proceedings– see Note 25 to the annual financial statements for 31 December 2015.
In this Note, updates will be brought that occurred in the period of the report that were not
published in the annual financial statements.
In the framework of the DPA, Leumi Group undertook, inter alia, to take certain actions related to
the provision of services to US customers, and to develop and implement a compliance program
with the FATCA provisions. In the framework of the agreement with the New York Department of
Financial Services (NYDFS) also, certain obligations were imposed on the Bank including the
appointment of a monitor to examine, inter alia, the Group's activities. The monitor commenced his
duties on 15 July 2015. During the period of the report, the NYDFS raised a claim that the period
of the monitor's activities may be extended. At his stage, it is not possible to evaluate if the period
will be extended.
In order to comply with the provisions of the arrangements as aforesaid, the Bank has appointed a
special steering committee which supervises the fulfillment of the undertakings of the Bank and its
offices in accordance with the arrangements, and submits regular reports thereon to the Bank's
management and Board of Directors.
A. Legal proceedings
Pursuant to of the investigations of the US authorities, a number of actions have been served
against the Bank and office holders who served and who are serving in the Bank and the
Group:
In the opinion of the Management of the Bank, based on legal opinions with regard to the
chances of these actions, (inasmuch as they refer to claims against the Bank), it is not possible
at this stage to evaluate their chances (except for the claim set out in paragraph 2 below) and
for this reason no provision has been made in their respect.
1. On 1 September 2013, a petition for approval of a derivative action was filed in the
Economic Division of the Tel Aviv District Court against former senior officers of the
Bank. The petitioner claimed that, as part of investigations of the U.S. tax authorities, it
was found that representatives of the Bank and representatives of Bank Leumi USA
assisted customers that are US taxpayers to execute transactions that prevented the US tax
authorities from collecting taxes from their citizens. On 6 January 2015, the petitioner
filed an amended petition to approve the filing of a derivative action against officers in
the Bank and other corporations controlled by the bank ("Leumi Group") as well as
against the Bank's external auditors. According to that claimed in the amended petition,
the damage caused to Leumi Group by the investigations of the US authorities and the
arrangements signed with them is about NIS 2.1 billion.
In February 2015 the Board of Directors appointed an independent claims committee, for
an overall review of the advisable course of legal action to the Bank in light of the totality
of events in connection with the US customers affair, and on 11 March 2015, a decision
was handed down by the Hon Judge Khaled Kabub of the Tel-Aviv District Court
(Economic Department) approving the appointment of the Committee and postponing
proceedings in the claims filed in connection with the US customers affair, to enable the
committee to make its recommendations.
On 12 October 2015, the Bank notified the Court of the report of the independent
committee and the adoption of the conclusions and recommendations by the Board of
Directors, and on 3 February 2016 a notice was submitted to the court regarding the
decision of the Bank's Board of Director's audit committee on 2 February 2016, to adopt
the opinion of the independent expert accountant whom it appointed, according to which

158
there was no fault in the work of the accountants who audit everything related to the US
customers' affair.
On 1 March 2016 a request was submitted to the court to approve a compromise
agreement, according to which, without admitting any claim from among the claims of
the plaintiff in the request for approval, the officers and managers respondents will pay
the Bank, through the insurers holding the office holder insurance that the Bank
purchased, a total sum of US$ 92 million (below "the compromise amount") in
accordance with the contract structure and the composition of the insurers according to
the policy and without mutual responsibility between the insurers (the total includes the
portion insured by the Bank's "Captive" for a total of US$ 26.25 million, and a sum of
US$ 12 million that was already approved by the insurers for payment). Furthermore,
without admitting any allegation on their part, beyond the letter of the law. Some of the
respondents to the request for approval Ms. Galia Maor, Eitan Raff, and Zvi Itzkovitz,
will return to the Bank part of the bonuses that they received from the Bank during the
period relevant to the US customers' affair, in a form and distribution notified to the
Bank, and without mutual responsibility , and a total amount of NIS 5.1 million.
A hearing was set in June 2016 for the compromise arrangement and the arrangement that
was submitted in the request for approval for a class action described in paragraph 2
below.
2. On 19 January 2015, a petition was filed in the Tel Aviv District Court (Economic
Division), to approve a class action against the Bank, and against 19 other respondents,
who were or are directors in the Bank. According to the plaintiffs, as part of investigation
proceedings by various agencies in the US, the Bank admitted that it and other companies
in the Leumi Group acted to help its (US taxpayer) customers to evade reporting and from
tax payments. It is argued that the investigation proceedings led to the Bank writing off
NIS 1.438 billion from its equity, and that the members of the Board of Directors who
held office in 2002-2010 were negligent in not employing supervision and control that
allowed this illegal conduct of the Bank and, as a result, caused damage to members of
the Group by writing off funds from the Bank's equity, and cutting the potential return on
their investment in the shares of the Bank. The amount of the claim amounts to
approximately NIS 475 million and it was argued that minimum damage to the
shareholders group that sold their shares between 21 March 2013 (which is, according to
the plaintiffs, the date of the initial inclusion of a provision in the financial statements for
the investigation) and 15 January 2015 ranged from the above amount to NIS 825 million.
On 17 March 2016 a request was submitted to the court to approve a compromise
agreement in this complaint, according to which the Bank will pay to the members of the
Group an amount of NIS 10,080,000, including costs and fees of an external prosecutor,
fee for a trustee, and other distribution expenses.
Payment according to this compromise agreement is dependent on approval of the
compromise agreement in the procedure as detailed in paragraph 1 above. In a final and
valid verdict, and on receipt of the compromise amount contained in the agreement in the
above procedure, as detailed in paragraph 1 above, and the payment will be made from
these funds.
3. On 3 March 2015, a petition was filed with the Court in the State of New York, USA, by a
shareholder in the Bank, who is a resident of Israel, (below "the petitioner")for a
derivative action on behalf of the Bank and on behalf of Bank Leumi USA against
subsidiaries of the Bank and against 61 directors and officers, who served in the past and
some of them still holding office in the Bank and in the subsidiaries of the Bank. The
claim pertains to the alleged liability of the respondents for the payment of sums borne by
the Bank and its subsidiaries as a result of the arrangements that were signed with the US
authorities. On 12 October 2015, the Bank submitted to the Tel Aviv District Court, as
mentioned in paragraph 1 above, the report of the Independent Claims Committee. At the
same time, the Bank claimed that, in the Bank's opinion, the claim submitted in New
York should be dismissed out right since there is no point in conducting proceedings in

159
New York at the same time a similar claim is being conducted in Israel, and moreover
the purpose of the Committee's recommendations is to arrive at an overall arrangement.
The Bank further notified the Court that insofar as agreement is not achieved regarding
the US derivative claim, the Bank will be requesting a blocking order obliging the
dismissal of the proceedings being conducted in New York and/or will take any other
measure that is relevant. On 1 February 2016 the Bank ( and other companies in the
Group)submitted a request to the court handling the process detailed in paragraph 1
above, to grant a blocking order which will order the plaintiff and anyone acting for him,
to desist from continuing to conduct the complaint herein described in this paragraph
and/or conducting any other derivative relating to the cause and complaints contained in
the request described in paragraph 1 above, in courts in Israel or abroad.
On 3 March 2016 the court dealing with the process detailed in paragraph 1 above decided to
give a blocking order according to which the plaintiff in the process detailed in this
paragraph is forbidden to continue with the request to approve a derivative action that he
submitted in the name of the Bank's Group in the USA, or to submit another request to
approve a derivative action against the Bank Group in another location, in relation to the
US customers' affair. On 30 March 2016 the plaintiff requested approval from the
Supreme Court to appeal (alternatively notice of appeal) against this decision.
On 11 May 2016, the Bank and Bank Leumi (USA) submitted a petition to the Court
to dismiss the proceedings under this paragraph that the plaintiff filed with the Court in
New York.
4. Examination by the US Securities and Exchange Commission (SEC)
There is an investigation pending by the United States Securities and Exchange
Commission (SEC) in connection with the Group's activities in securities and securities
counseling vis-à-vis US residents. The Group provided the SEC during the period of the
report with the documents it required.
According to the legal advice received by the Group from its attorneys in the US, due to
the broad discretion given to the SEC and due to the special facts concerning the Group,
the Group is unable at this stage to evaluate the amount that the Group may be required to
pay pursuant to this investigation. Since it is not possible to evaluate the total amount of
the expense that may be incurred by the Group regarding this investigation, the Group,
based on the opinion of the US legal counsel assisting the Group in the SEC
investigation, was of the opinion that there is no justification to make any provision in the
financial statements in respect of it. Nevertheless, pursuant to the instructions of the Bank
of Israel, from 25 May 2015, according to which the Bank is to include a "provision in
the amount of the loss expected in respect of the investigation. For reasons of prudence,
this provision will not be less than US$ 5 million". The Bank made a provision in the
financial statements as at 31 March 2015 of US$ 5 million.
160
2. Other proceedings
A. On 16 February 2014, a petition was submitted to the Economic Department of the District Court
in Tel Aviv against the Bank, for disclosure and perusal of documents. According to the plaintiff
the purpose of the request was to examine the possibility of submitting a derivative action in the
name of the Bank against the office holders of the Bank in regards to credit that the Bank provided,
according to the plaintiff, to Ganden Holdings Ltd, ("Ganden") for the purpose of financing the
purchase of IDB Holdings Ltd. shares. On 8 April 2016 the Court approved the mediation
agreement, according to which the Bank declared that it took it upon itself certain procedures in the
procedures that relate to the provision of credit to borrowers for purpose of financing the purchase
of means of control in significant sums. The procedure ends with the approval of the mediated
agreement.
B. On 19 July 2015, a petition was submitted to the Economic Department of the District Court in Tel
Aviv against the Bank, for disclosure and perusal of documents that was submitted according to the
petitioner's claim, pursuant to Section 198A of the Companies Law, 1999.
The petition was for the disclosure of various documents in connection with the Bank's handling of
the debt of Delek Real Estate Ltd. This petition was intended, according to the petitioner's claim, to
examine the need to submit a petition for approval of the submission of a derivative action in the
name of the Bank against its office-holders. The background to the petition is the petitioner's claim
that, during the years 2012-2013, the Bank made a waiver in the amount of about NIS 120 million
of the debts of Delek Real Estate Ltd., according to the petitioner's claim, without justification and
notwithstanding that the value of the collateral made it possible, allegedly, to collect the debt in
full. The Bank submitted its response to the petition. On 24 March 2016 the court decided to delete
the petition after determining, amongst other things, that there were no evident grounds to the
complaint, according to which office holders violated their obligations to the Bank. On 1 May
2016, the plaintiff submitted a petition for leave of appeal against this decision to the Supreme
Court.

FINANCIAL STATEMENTS
161
Note 11 – Activity in Derivative Instruments – Scope, Credit Risks and Repayment Dates
A. Scope of activity on consolidated basis
31 March 2016 (Unaudited)
Foreign Contracts in Commodities
Shekel –
index Other
currency
contracts
respect of
shares
and other
contracts Total
(NIS millions)
(1) Nominal amount of
derivative instruments
a) Hedging derivatives (a)
Swaps - 2,343 - - - 2,343
Total - 2,343 - - - 2,343
Of which: interest rate swap
contracts in which the
banking institution agreed
rate of interest - 2,343 - - - 2,343
b) ALM derivatives (a)(b)
Futures contracts - 28,795 18 48,636 223 77,672
Forward contracts 12,154 14,200 190,277 325 15 216,971
Exchange-traded options
Options written - 1,289 17,010 11,033 143 29,475
Options purchased - 1,289 17,529 11,033 143 29,994
Other options
Options written - 11,575 16,832 3,393 128 31,928
Options purchased - 6,791 16,880 3,405 128 27,204
Swaps 587 261,936 27,740 26,745 380 317,388
Total 12,741 325,875 286,286 104,570 1,160 730,632
Of which: interest rate swap
contracts in which the
banking institution agreed
to pay a fixed rate of interest - 138,792 - - - 138,792
c) Other derivatives (a) - - - - - -
d) Credit derivatives and
foreign exchange spot
contracts
Credit derivatives in which
the banking corporation is a
beneficiary - - - - 30 30
Spot foreign exchange contracts - - 23,296 - - 23,296
Total - - 23,296 - 30 23,326
Grand total 12,741 328,218 309,582 104,570 1,190 756,301
Interest contracts
(a) Excluding credit derivatives and foreign exchange spot contracts.
(b) Derivatives constituting part of the Bank's assets and liabilities not designated for hedging.
FINANCIAL STATEMENTS
162
Note 11 – Activity in Derivative Instruments – Scope, Credit Risks and Repayment Dates (cont'd)
A. Scope of activity (cont'd)
31 March 2016 (Unaudited)
Foreign Contracts in Commodities
Shekel –
index Other
currency
contracts
respect of
shares
and other
contracts Total
(NIS millions)
(2) Gross fair value of
derivative instruments
a) Hedging derivatives (a)
Gross positive fair value - - - - - -
Gross negative fair value - 180 - - - 180
b) ALM derivatives (a)(b)
Gross positive fair value 379 7,163 3,997 1,576 38 13,153
Gross negative fair value 439 6,935 4,880 1,565 37 13,856
c) Other derivatives (a) - - - - - -
d) Credit derivatives
Credit derivatives in which
the banking corporation is a
beneficiary
Gross positive fair value - - - - - -
Gross negative fair value - - - - 1 1
e) Total
Gross positive fair value (c) 379 7,163 3,997 1,576 38 13,153
Fair value amounts offset in
the balance sheet - - - - - -
Book value of assets in
respect of derivative
instruments 379 7,163 3,997 1,576 38 13,153
Of which: book value of
assets in respect of
derivative instruments not
subject to a master netting
arrangement or similar
arrangements 40 17 177 - 34 268
Gross negative fair value (c) 439 7,115 4,880 1,565 38 14,037
Fair value amounts offset in
the balance sheet - - - - - -
Book value of liabilities in
respect of derivative 439 7,115 4,880 1,565 38 14,037Of which: book value of
liabilities in respect of
derivative instruments not
subject to a master netting
arrangement or similar
arrangements 1 7 465 - 3 476
Interest contracts
(a) Excluding credit derivatives and foreign exchange spot contracts.
(b) Derivatives constituting part of the Bank's asset and liability management not designated for hedging.
(c) Of which: gross positive fair value of assets in respect of embedded derivative instruments in the amount of NIS 3 million (and gross
negative fair value of liabilities in respect of embedded derivative instruments in the amount of NIS 41 million).

FINANCIAL STATEMENTS
163
Note 11 – Activity in Derivative Instruments – Scope, Credit Risks and Repayment Dates (cont'd)
A. Scope of activity on consolidated basis (cont'd)
31 March 2015 (Unaudited)
Foreign Contracts in Commodities
Shekel –
index Other
currency
contracts
respect of
shares
and other
contracts Total
(NIS millions)
(1) Nominal amount of
derivative instruments
a) Hedging derivatives (a)
Swaps - 2,376 - - - 2,376
Total - 2,376 - - - 2,376
Of which: interest rate swap
contracts in which the
banking institution agreed
rate of interest - 2,376 - - - 2,376
b) ALM derivatives (a)(b)
Futures contracts - 8,249 407 61,410 398 70,464
Forward contracts 13,156 15,301 229,749 533 25 258,764
Exchange-traded options
Options written - 476 12,337 12,399 34 25,246
Options purchased - 476 12,328 12,399 34 25,237
Other options
Options written - 13,875 27,349 4,227 89 45,540
Options purchased - 10,969 25,994 4,254 127 41,344
Swaps 663 296,716 30,421 23,657 426 351,883
Total 13,819 346,062 338,585 118,879 1,133 818,478
Of which: interest rate swap
contracts in which the
banking institution agreed
to pay a fixed rate of interest - 147,328 - - - 147,328
c) Other derivatives (a) - - - - - -
d) Credit derivatives and
foreign exchange spot
contracts
Credit derivatives in which
the banking corporation is a
beneficiary - - - - - -
Spot foreign exchange
contracts - - 9,703 - - 9,703
Total - - 9,703 - - 9,703
Grand total 13,819 348,438 348,288 118,879 1,133 830,557
Interest contracts
(c)
(c)
(a) Excluding credit derivatives and foreign exchange spot contracts.
(b) Derivatives constituting part of the Bank's assets and liabilities not designated for hedging.
(c) Reclassified.
FINANCIAL STATEMENTS
164
Note 11 – Activity in Derivative Instruments – Scope, Credit Risks and Repayment Dates (cont'd)
A. Scope of activity on consolidated basis (cont'd)
31 March 2015 (Unaudited)
Foreign Contracts in Commodities
Shekel –
index Other
currency
contracts
respect of
shares
and other
contracts Total
(NIS millions)
(2) Gross fair value of
derivative instruments
a) Hedging derivatives (a)
Gross negative fair value - 159 - - - 159
b) ALM derivatives (a)(b)
Gross positive fair value 306 9,583 7,564 1,323 58 18,834
Gross negative fair value 327 9,146 7,087 1,352 57 17,969
c) Other derivatives (a) - - - - - -
d) Credit derivatives
Credit derivatives in which
the banking corporation is a
beneficiary
Gross positive fair value - - - - - -
Gross negative fair value - - - - - -
e) Total
Gross positive fair value (c) 306 9,583 7,564 1,323 58 18,834
Fair value amounts offset in
the balance sheet - - - - - -
Book value of assets in
respect of derivative
instruments 306 9,583 7,564 1,323 58 18,834
Of which: book value of
assets in respect of
derivative instruments not
subject to a master netting
arrangement or similar
arrangements 18 31 300 16 1 366
Gross negative fair value (c) 327 9,305 7,087 1,352 57 18,128
Fair value amounts offset in
the balance sheet - - - - - -
Book value of liabilities in
respect of derivative
instruments 327 9,305 7,087 1,352 57 18,128Of which: book value of
liabilities in respect of
derivative instruments not
subject to a master netting
arrangement or similar
arrangements - 7 904 110 2 1,023
Interest contracts
(a) Excluding credit derivatives and foreign exchange spot contracts.
(b) Derivatives constituting part of the Bank's assets and liabilities not designated for hedging.
(c) Of which: gross positive fair value of assets in respect of embedded derivative instruments in the amount of NIS 3 million (and gross
negative fair value of liabilities in respect of embedded derivative instruments in the amount of NIS 42 million).

FINANCIAL STATEMENTS
165
Note 11 – Activity in Derivative Instruments – Scope, Credit Risks and Repayment Dates (cont'd)
A. Scope of activity on consolidated basis (cont'd)
31 December 2015 (Audited)
Foreign Contracts in Commodities
Shekel –
index Other
currency
contracts
respect of
shares
and other
contracts Total
(NIS millions)
(1) Nominal amount of
derivative instruments
a) Hedging derivatives (a)
Swaps - 2,443 - - - 2,443
Total - 2,443 - - - 2,443
Of which: interest rate swap
contracts in which the
banking institution agreed
rate of interest - 2,443 - - - 2,443
b) ALM derivatives (a)(b)
Futures contracts - 14,589 10 58,799 217 73,615
Forward contracts 12,525 14,300 179,448 366 11 206,650
Exchange-traded options
Options written - 262 14,797 11,129 100 26,288
Options purchased - 250 15,292 11,129 101 26,772
Other options
Options written - 10,797 15,997 3,144 139 30,077
Options purchased - 8,037 16,567 3,245 139 27,988
Swaps 587 268,113 28,668 27,384 299 325,051
Total 13,112 316,348 270,779 115,196 1,006 716,441
Of which: interest rate swap
contracts in which the
banking institution agreed
to pay a fixed rate of interest - 137,675 - - - 137,675
c) Other derivatives (a) - - - - - -
d) Credit derivatives and
foreign exchange spot
contracts
Credit derivatives in which
the banking corporation is a
beneficiary - - - - 40 40
Spot foreign exchange contracts - - 9,086 - - 9,086
Total - - 9,086 - 40 9,126Grand total 13,112 318,791 279,865 115,196 1,046 728,010
Interest contracts
(a) Excluding credit derivatives and foreign exchange spot contracts.
(b) Derivatives constituting part of the Bank's assets and liabilities not designated for hedging.
.

FINANCIAL STATEMENTS
166
Note 11 – Activity in Derivative Instruments – Scope, Credit Risks and Repayment Dates (cont'd)
A. Scope of activity on consolidated basis (cont'd)
31 December 2015 (Audited)
Foreign Contracts in Commodities
Shekel –
index Other
currency
contracts
respect of
shares
and other
contracts Total
(NIS millions)
(2) Gross fair value of
derivative instruments
a) Hedging derivatives (a)
Gross positive fair value - 1 - - - 1
Gross negative fair value - 146 - - - 146
b) ALM derivatives (a)(b)
Gross positive fair value 344 6,375 3,245 1,245 46 11,255
Gross negative fair value 392 5,949 3,340 1,258 45 10,984
c) Other derivatives (a) - - - - - -
d) Credit derivatives
Credit derivatives in which
the banking corporation is a
beneficiary
Gross positive fair value - - - - - -
Gross negative fair value - - - - 1 1
e) Total
Gross positive fair value (c) 344 6,376 3,245 1,245 46 11,256
Fair value amounts offset in
the balance sheet - - - - - -
Book value of assets in
respect of derivative
instruments 344 6,376 3,245 1,245 46 11,256
Of which: book value of
assets in respect of
derivative instruments not
subject to a master netting
arrangement or similar
arrangements 31 20 147 65 - 263
Gross negative fair value (c) 392 6,095 3,340 1,258 46 11,131
Fair value amounts offset in
the balance sheet - - - - - -
Book value of liabilities in
respect of derivative
instruments 392 6,095 3,340 1,258 46 11,131Of which: book value of
liabilities in respect of
derivative instruments not
subject to a master netting
arrangement or similar
arrangements - 6 482 37 - 525
Interest contracts
(a) Excluding credit derivatives and foreign exchange spot contracts.
(b) Derivatives constituting part of the Bank's assets and liabilities not designated for hedging.
(c) Of which: gross positive fair value of assets in respect of embedded derivative instruments in the amount of NIS 6 million (and gross
negative fair value of liabilities in respect of embedded derivative instruments in the amount of NIS 33 million).

FINANCIAL STATEMENTS
167
Note 11 – Activity in Derivative Instruments – Scope, Credit Risks and Repayment Dates (cont'd)
B. Credit risk in respect of derivative instruments by counterparty to the contract
31 March 2016 (Unaudited)
Stock
Exchanges Banks
Dealers/
brokers
Governments
and central
banks Others Total
(NIS millions)
188 8,383 2,260 27 2,295 13,153
- 6,432 1,985 27 839 9,283
- 829 229 - 5 1,063
188 1,122 46 - 1,451 2,807
- 3,513 1,155 68 4,500 9,236
- 1,710 592 41 1,741 4,084
- 1,803 563 27 2,759 5,152
188 2,925 609 27 4,210 7,959
208 7,178 2,240 40 4,371 14,037
- 6,432 1,985 27 839 9,283
- 458 168 12 757 1,395
208 288 87 1 2,775 3,359
Cash collateral pledgedNet amount of liabilities in respect
of derivative instruments
Mitigation of off-balance sheet
credit risk
Net off-balance sheet credit risk in
respect of derivative instruments
Total credit risk in respect of
derivative instruments
Book balance of liabilities in
respect of derivative instruments
(a) (c)
Gross amounts not offset in the
balance sheet:
Derivative financial instruments
Book balance of assets in respect of
derivative instruments (a) (b)
Gross amounts not offset in the
balance sheet:
Mitigation of credit risk in respect
of financial instruments
Mitigation of credit risk in respect
of cash collateral received
Net amount of assets in respect of
derivative instruments
Off-balance sheet credit risk in
respect of derivative instruments (d)
See notes on page 177.

FINANCIAL STATEMENTS
168
Note 11 – Activity in Derivative Instruments – Scope, Credit Risks and Repayment Dates (cont'd)
B. Credit risk in respect of derivative instruments by counterparty to the contract (cont'd)
31 March 2015 (Unaudited)
Stock
Exchanges Banks
Dealers/
brokers
Governments
and central
banks Others Total
(NIS millions)
173 11,368 3,438 4 3,851 18,834
- 3,753 1,191 4 929 5,877
- 1,617 650 - - 2,267
173 5,998 1,597 - 2,922 10,690
- 4,176 1,209 86 5,411 10,882
- 243 27 51 1,029 1,350
- 3,933 1,182 35 4,382 9,532
173 9,931 2,779 35 7,304 20,222
202 9,920 3,057 107 4,842 18,128
- 3,753 1,191 4 929 5,877
- 375 148 74 56 653
202 5,792 1,718 29 3,857 11,598
Book balance of assets in respect of
derivative instruments (a) (b)
Gross amounts not offset in the
balance sheet:
Mitigation of credit risk in respect
of financial instruments
Mitigation of credit risk in respect
of cash collateral received
Gross amounts not offset in the
balance sheet:
Derivative financial instrumentsCash collateral pledgedNet amount of liabilities in respect
of derivative instruments
Net amount of assets in respect of
derivative instruments
Off-balance sheet credit risk in
respect of derivative instruments (d)
Mitigation of off-balance sheet
credit risk
Net off-balance sheet credit risk in
respect of derivative instruments
Total credit risk in respect of
derivative instruments
Book balance of liabilities in
respect of derivative instruments
See notes on page 177.

FINANCIAL STATEMENTS
169
Note 11 – Activity in Derivative Instruments – Scope, Credit Risks and Repayment Dates (cont'd)
B. Credit risk in respect of derivative instruments by counterparty to the contract (cont'd)
31 December 2015 (Audited)
Stock
Exchanges Banks
Dealers/
brokers
Governments
and central
banks Others Total
(NIS millions)
169 6,653 1,880 6 2,548 11,256
- 2,951 1,085 6 821 4,863
- 731 252 - 96 1,079
169 2,971 543 - 1,631 5,314
- 3,551 1,220 71 4,963 9,805
- 379 97 43 2,392 2,911
- 3,172 1,123 28 2,571 6,894
169 6,143 1,666 28 4,202 12,208
194 6,427 1,707 91 2,712 11,131
- 2,951 1,085 6 821 4,863
- 341 68 29 1 439
194 3,135 554 56 1,890 5,829
Mitigation of credit risk in respect
of cash collateral received
Net amount of assets in respect of
derivative instruments
Off-balance sheet credit risk in
respect of derivative instruments (d)
Mitigation of off-balance sheet
credit risk
Net off-balance sheet credit risk in
respect of derivative instruments
Net amount of liabilities in respect
of derivative instruments
Total credit risk in respect of
derivative instruments
Book balance of liabilities in
respect of derivative instruments
(a) (c)Gross amounts not offset in the
balance sheet:
Derivative financial instruments
Book balance of assets in respect of
derivative instruments (a) (b)
Gross amounts not offset in the
balance sheet:
Cash collateral pledged
Mitigation of credit risk in respect
of financial instruments
(a) The Bank did not offset master netting arrangements.
(b) Of which a book balance of assets in respect of standalone derivative instruments in the amount of NIS 13,150 million (at 31 March 2015 -
NIS 18,831 million, at 31 December 2015 – NIS 11,250 million).
(c) Of which a book balance of standalone derivative instruments in the amount of NIS 13,996 million (at 31 March 2015 - NIS 18,086 million, at
31 December 2015 – NIS 11,098 million).
(d) Credit risk in respect of off-balance sheet financial instruments (imcluding in respect of derivative instruments with negative fair value) before
mitigation of credit risk, as calculated for the purpose of single borrower credit limitations.
Note:
In the three month period ended 31 March 2016, in the corresponding period last year, and in December 2015, no credit losses were recognized in
respect of derivative instruments.
FINANCIAL STATEMENTS
170
Note 11 – Activity in Derivative Instruments – Scope, Credit Risks and Repayment Dates (cont'd)
C. Repayment Dates – Nominal Amounts: Balances
31 March 2016 (Unaudited)
Unaudited
Up to
three
months
From three
months to
one year
From one to
five years
Over five
years Total
(NIS millions)
Interest contracts:
Shekel – index 512 3,774 5,680 2,775 12,741
Other 37,024 72,466 140,951 77,777 328,218
Foreign currency contracts 185,502 87,637 29,086 7,357 309,582
Contracts in respect of shares 77,282 26,278 1,006 4 104,570
Commodities and other contracts 844 271 75 - 1,190
Total 301,164 190,426 176,798 87,913 756,301
Total 31 March 2015 (Unaudited) 337,927 196,676 195,624 100,330 830,557
Total 31 December 2015 (Audited) 297,910 168,935 166,537 94,628 728,010

171
Note 12A – Regulatory operating segments
Regulatory operating segments
On 3 November 2014, a circular regarding reporting on operating segments and a file of questions and answers
for implementation was published. On 10 September 2015, an update to the file of questions and answers was
published.
The circular updates the Public Reporting Directives in all matters related to the reporting requirements for
regulatory operating segments, and, inter alia, includes a change in certain definitions and instructions
according to which the banks will be required to categorize customers to regulatory segments and update their
reports.
The new rules will apply from the financial statements for 2015 and thereafter in the manner set forth below:
1. In the financial statements for 2015, there is a disclosure requirement in connection with the balance sheet
data in relation to the regulatory operating segments as defined in the new provisions. In accordance with
the new provisions, it is permissible not to provide disclosure of comparative figures for balance sheet data
of regulatory operating segments, but rather to include comparative figures, in accordance with the Public
Reporting Directives which were in effect prior to the introduction of the circular. In addition, disclosure is
not required of the Financial Management segment.
These disclosure requirements are in addition to the disclosure requirements on operating segments in
accordance with the Public Reporting Directives which were in effect prior to the introduction of the
circular.
2. With effect from the financial statements for the first quarter of 2016, full disclosure is required according to
the new rules, except for disclosure of the Financial Management segment. Comparative figures should be
retroactively adjusted. It is permitted to present comparative figures of one year only in the 2016 statements,
in relation to the note on regulatory operating segments. For the purpose of presenting the comparative
figures, it will be possible to rely on the classification of the customer to the regulatory operating segments
as of 1 January 2016.
3. Commencing with the financial statements for the first quarter of 2017, the requirements of the circular must
be implemented in full.

172
Note 12A – Regulatory operating segments (cont.)
The following is a description of the main operating segments prescribed by the Bank of Israel directives:
1. Households segment - The provision of banking services to private individuals, except customers included
in Private Banking.
2. Private Banking segment -The provision of banking services to private individuals whose balance of the
financial asset portfolio they have in the Bank (including monetary deposits, securities portfolio and other
monetary assets) exceeds NIS 3 million.
3. Small and micro-businesses segment - The provision of banking services to businesses whose activity
turnover (annual total sales or annual total income) is less than NIS 50 million.
4. Mid-sized business segment - The provision of banking services to a business whose activity turnover is
greater than or equal to NIS 50 million and less than NIS 250 million.
5. Large businesses segment - The provision of banking services to a business whose activity turnover is
greater than or equal to NIS 250 million.
6. Financial management segment - Includes the following activities:
a. Trading activity – Investment in securities for trading, market-making activity in securities and
derivative instruments, activity in derivative instruments non-designated for hedging and not part of
the management of the assets and liabilities of the banking corporation, repurchase and lending
transactions of securities for trading, short selling of securities, underwriting of securities services.
b. Asset and liability management activity – Including investment in available-for-sale debentures and
debentures held to maturity, that are not attributed to other activity segments (with a borrower having
no indebtedness to the Bank, apart from securities), hedging derivative instruments and derivative
instruments which are part of asset and liability management, deposits in banks and from banks in
Israel and around the world, hedging or protective exchange rate differences of investments in
overseas offices, deposits in and of governments.
c. Non-bank investment activity – Investment in vas shares and investment in companies included on
equity basis of businesses.
d. Other – Management, operating, trust and custody services for banks, consultancy services, selling
activity and credit portfolio management, and financial product development activities.
7. Other segment - Including discontinued activities, designated profits and other results connected to
employee rights not attributed to the other activity segments, activities not attributed to other segments, and
adjustments between the total of all the items attributed to the segments and the total of all the items in the
consolidated financial statements.
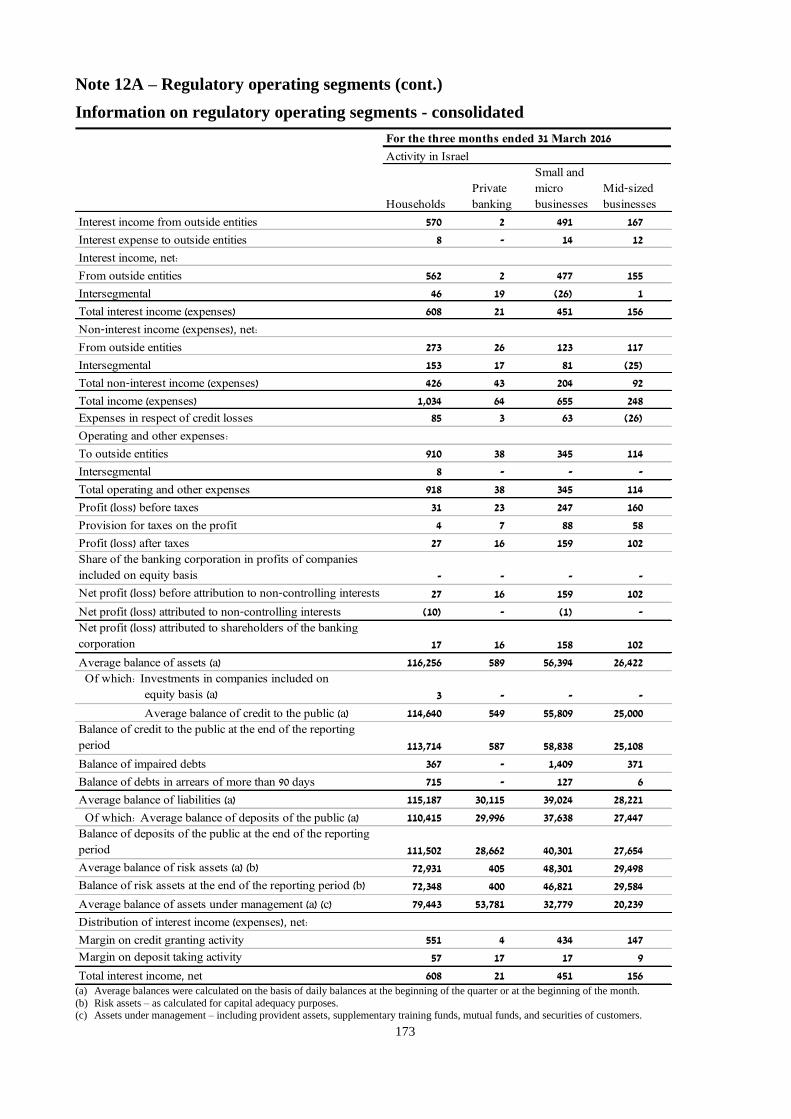
173
Note 12A – Regulatory operating segments (cont.)
Information on regulatory operating segments - consolidated
For the three months ended 31 March 2016
Activity in Israel
Households
Private
banking
Small and
micro
businesses
Mid-sized
businesses
Interest income from outside entities 570 2 491 167
Interest expense to outside entities 8 - 14 12
Interest income, net:
From outside entities 562 2 477 155
Intersegmental 46 19 (26) 1
Total interest income (expenses) 608 21 451 156
Non-interest income (expenses), net:
From outside entities 273 26 123 117
Intersegmental 153 17 81 (25)
Total non-interest income (expenses) 426 43 204 92
Total income (expenses) 1,034 64 655 248
Expenses in respect of credit losses 85 3 63 (26)
Operating and other expenses:
To outside entities 910 38 345 114
Intersegmental 8 - - -
Total operating and other expenses 918 38 345 114
Profit (loss) before taxes 31 23 247 160
Provision for taxes on the profit 4 7 88 58
Profit (loss) after taxes 27 16 159 102
Share of the banking corporation in profits of companies
included on equity basis - - - -
Net profit (loss) before attribution to non-controlling interests 27 16 159 102
Net profit (loss) attributed to non-controlling interests (10) - (1) -
Net profit (loss) attributed to shareholders of the banking
corporation 17 16 158 102
Average balance of assets (a) 116,256 589 56,394 26,422
Of which: Investments in companies included on
equity basis (a) 3 - - -
Average balance of credit to the public (a) 114,640 549 55,809 25,000
Balance of credit to the public at the end of the reporting
period 113,714 587 58,838 25,108
Balance of impaired debts 367 - 1,409 371
Balance of debts in arrears of more than 90 days 715 - 127 6
Average balance of liabilities (a) 115,187 30,115 39,024 28,221
Of which: Average balance of deposits of the public (a) 110,415 29,996 37,638 27,447
Balance of deposits of the public at the end of the reporting
period 111,502 28,662 40,301 27,654
Average balance of risk assets (a) (b) 72,931 405 48,301 29,498
Balance of risk assets at the end of the reporting period (b) 72,348 400 46,821 29,584
Average balance of assets under management (a) (c) 79,443 53,781 32,779 20,239
Distribution of interest income (expenses), net:
Margin on credit granting activity 551 4 434 147
Margin on deposit taking activity 57 17 17 9
Total interest income, net 608 21 451 156 (a) Average balances were calculated on the basis of daily balances at the beginning of the quarter or at the beginning of the month.
(b) Risk assets – as calculated for capital adequacy purposes. (c) Assets under management – including provident assets, supplementary training funds, mutual funds, and securities of customers.
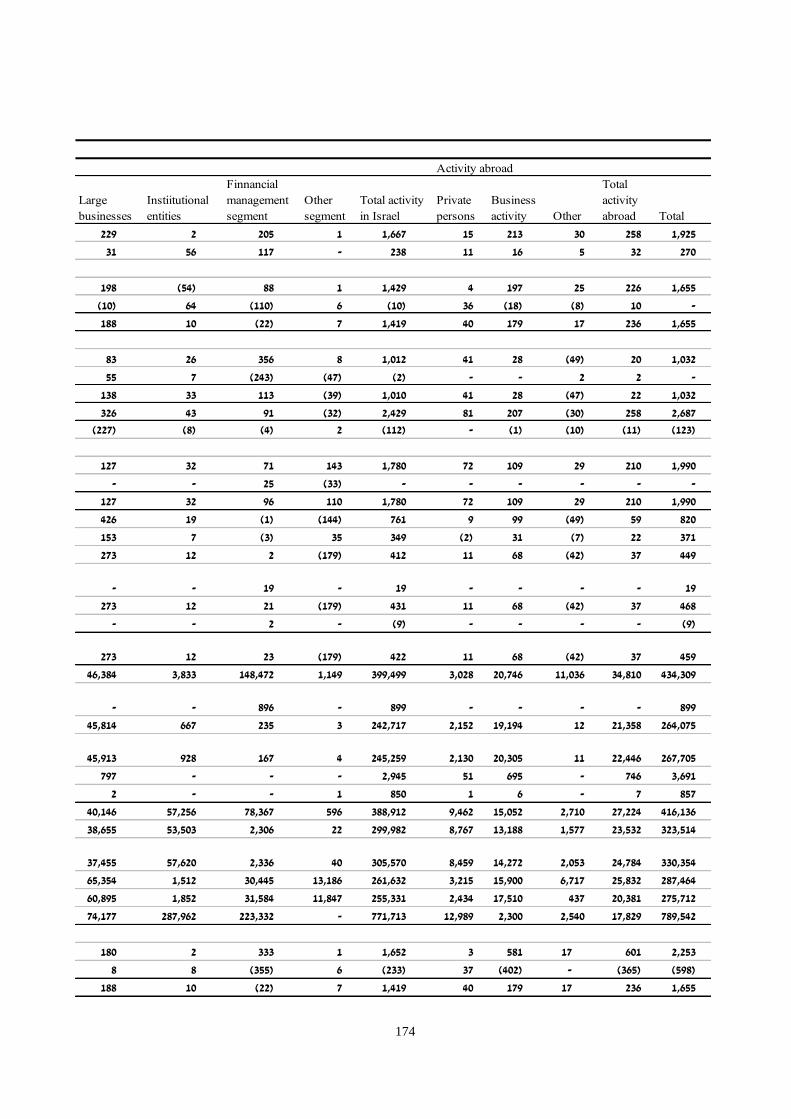
174
Note 12 – Regulatory operating segments and geographical areas
Information on regulatory operating segments - consolidated
Large
businesses
Instiitutional
entities
Finnancial
management
segment
Other
segment
Total activity
in Israel
Private
persons
Business
activity Other
Total
activity
abroad Total
229 2 205 1 1,667 15 213 30 258 1,925
31 56 117 - 238 11 16 5 32 270
198 (54) 88 1 1,429 4 197 25 226 1,655
(10) 64 (110) 6 (10) 36 (18) (8) 10 -
188 10 (22) 7 1,419 40 179 17 236 1,655
83 26 356 8 1,012 41 28 (49) 20 1,032
55 7 (243) (47) (2) - - 2 2 -
138 33 113 (39) 1,010 41 28 (47) 22 1,032
326 43 91 (32) 2,429 81 207 (30) 258 2,687
(227) (8) (4) 2 (112) - (1) (10) (11) (123)
127 32 71 143 1,780 72 109 29 210 1,990
- - 25 (33) - - - - - -
127 32 96 110 1,780 72 109 29 210 1,990
426 19 (1) (144) 761 9 99 (49) 59 820
153 7 (3) 35 349 (2) 31 (7) 22 371
273 12 2 (179) 412 11 68 (42) 37 449
- - 19 - 19 - - - - 19
273 12 21 (179) 431 11 68 (42) 37 468
- - 2 - (9) - - - - (9)
273 12 23 (179) 422 11 68 (42) 37 459
46,384 3,833 148,472 1,149 399,499 3,028 20,746 11,036 34,810 434,309
- - 896 - 899 - - - - 899
45,814 667 235 3 242,717 2,152 19,194 12 21,358 264,075
45,913 928 167 4 245,259 2,130 20,305 11 22,446 267,705
797 - - - 2,945 51 695 - 746 3,691
2 - - 1 850 1 6 - 7 857
40,146 57,256 78,367 596 388,912 9,462 15,052 2,710 27,224 416,136
38,655 53,503 2,306 22 299,982 8,767 13,188 1,577 23,532 323,514
37,455 57,620 2,336 40 305,570 8,459 14,272 2,053 24,784 330,354
65,354 1,512 30,445 13,186 261,632 3,215 15,900 6,717 25,832 287,464
60,895 1,852 31,584 11,847 255,331 2,434 17,510 437 20,381 275,712
74,177 287,962 223,332 - 771,713 12,989 2,300 2,540 17,829 789,542
180 2 333 1 1,652 3 581 17 601 2,253
8 8 (355) 6 (233) 37 (402) - (365) (598)
188 10 (22) 7 1,419 40 179 17 236 1,655
Activity abroad

175
Note 12A – Regulatory operating segments (cont.)
Information on regulatory operating segments – consolidated (cont.)
For the three months ended 31 March 2015
Activity in Israel
Households
Private
banking
Small and
micro
businesses
Mid-sized
businesses
Interest income from outside entities 323 1 415 147
Interest expense to outside entities (42) (17) 5 3
Interest income (expenses), net
From outside entities 365 18 410 144
Intersegmental 247 (5) (19) 9
Total interest income (expenses) 612 13 391 153
Non-interest income (expenses), net:
From outside entities 311 32 241 28
Intersegmental 113 17 (25) 72
Total non-interest income (expenses) 424 49 216 100
Total income (expenses) 1,036 62 607 253
Expenses in respect of credit losses 45 5 47 (46)
Operating and other expenses:
To outside entities 990 41 360 121
Intersegmental (17) - - -
Total operating and other expenses 973 41 360 121
Profit (loss) before taxes 18 16 200 178
Provision for taxes on the profit 4 6 75 66
Profit (loss) after taxes 14 10 125 112
Share of the banking corporation in profits of companies
included on equity basis 1 - - -
Net profit (loss) before attribution to non-controlling interests 15 10 125 112
Net profit (loss) attributed to non-controlling interests (7) - (1) -
Net profit (loss) attributed to shareholders of the banking
corporation 8 10 124 112
Average balance of assets 108,356 477 52,565 26,246
Of which: Investments in companies included on
equity basis 3 - - -
Average balance of credit to the public 107,146 447 52,244 25,150
Balance of credit to the public at the end of the reporting
period 107,792 471 53,314 24,045
Balance of impaired debts 428 - 2,138 393
Balance of debts in arrears of more than 90 days 770 - 119 6
Average balance of liabilities (a) 102,495 24,904 34,538 23,527
Of which: Average balance of deposits of the public (a) 97,668 24,820 32,369 22,873
Balance of deposits of the public at the end of the reporting
period 99,474 24,944 33,573 23,538
Average balance of risk assets (a) (b) 72,461 344 48,329 32,113
Balance of risk assets at the end of the reporting period (b) 70,684 335 47,032 31,265
Average balance of assets under management (a) (c) 91,308 55,491 39,051 22,136
Distribution of interest income, net:
Margin on credit granting activity 552 - 378 146
Margin on deposit taking activity 60 13 13 7
Total interest income, net 612 13 391 153 (a) Average balances to be calculated on the basis of daily balances at the beginning of the quarter or at the beginning of the month.
(b) Risk assets – as calculated for capital adequacy purposes.
(c) Assets under management – including provident assets, supplementary training funds, mutual funds, and securities of customers.
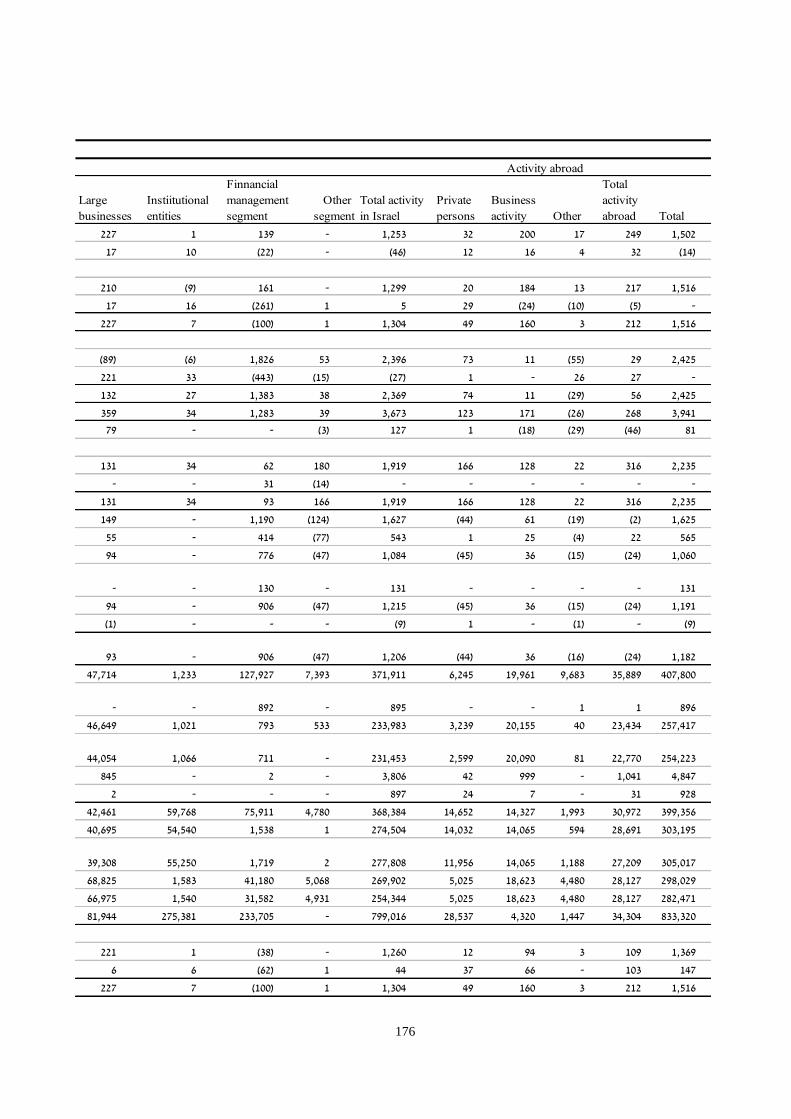
176
ote 12 – Regulatory operating segments and geographical areas
Information on regulatory operating segments - consolidated
Large
businesses
Instiitutional
entities
Finnancial
management
segment
Other
segment
Total activity
in Israel
Private
persons
Business
activity Other
Total
activity
abroad Total
227 1 139 - 1,253 32 200 17 249 1,502
17 10 (22) - (46) 12 16 4 32 (14)
210 (9) 161 - 1,299 20 184 13 217 1,516
17 16 (261) 1 5 29 (24) (10) (5) -
227 7 (100) 1 1,304 49 160 3 212 1,516
(89) (6) 1,826 53 2,396 73 11 (55) 29 2,425
221 33 (443) (15) (27) 1 - 26 27 -
132 27 1,383 38 2,369 74 11 (29) 56 2,425
359 34 1,283 39 3,673 123 171 (26) 268 3,941
79 - - (3) 127 1 (18) (29) (46) 81
131 34 62 180 1,919 166 128 22 316 2,235
- - 31 (14) - - - - - -
131 34 93 166 1,919 166 128 22 316 2,235
149 - 1,190 (124) 1,627 (44) 61 (19) (2) 1,625
55 - 414 (77) 543 1 25 (4) 22 565
94 - 776 (47) 1,084 (45) 36 (15) (24) 1,060
- - 130 - 131 - - - - 131
94 - 906 (47) 1,215 (45) 36 (15) (24) 1,191
(1) - - - (9) 1 - (1) - (9)
93 - 906 (47) 1,206 (44) 36 (16) (24) 1,182
47,714 1,233 127,927 7,393 371,911 6,245 19,961 9,683 35,889 407,800
- - 892 - 895 - - 1 1 896
46,649 1,021 793 533 233,983 3,239 20,155 40 23,434 257,417
44,054 1,066 711 - 231,453 2,599 20,090 81 22,770 254,223
845 - 2 - 3,806 42 999 - 1,041 4,847
2 - - - 897 24 7 - 31 928
42,461 59,768 75,911 4,780 368,384 14,652 14,327 1,993 30,972 399,356
40,695 54,540 1,538 1 274,504 14,032 14,065 594 28,691 303,195
39,308 55,250 1,719 2 277,808 11,956 14,065 1,188 27,209 305,017
68,825 1,583 41,180 5,068 269,902 5,025 18,623 4,480 28,127 298,029
66,975 1,540 31,582 4,931 254,344 5,025 18,623 4,480 28,127 282,471
81,944 275,381 233,705 - 799,016 28,537 4,320 1,447 34,304 833,320
221 1 (38) - 1,260 12 94 3 109 1,369
6 6 (62) 1 44 37 66 - 103 147
227 7 (100) 1 1,304 49 160 3 212 1,516
Activity abroad

177
Note 12B – Operating segments – Management Approach
The report of the operating segments according to the management's approach presents the Bank's results
according to business lines, in accordance with the Bank's organizational structure.
The business lines specialize in providing service to customer segments having similar characteristics and
needs.
The Bank in Israel is organized into six business lines:
1. Banking – providing banking services to private and small business customers. The business line includes
the mortgage department and private banking department.
2. Commercial - providing banking and financial services to middle-market companies and interested parties
in these companies.
3. Corporate - providing banking and financial services to large companies and international corporations in
the economy, with their activity in Israel and abroad.
4. Real estate - providing banking and financial services to the real estate and construction segment.
5. Capital market – managing the Bank's nostro, managing assets and commitments, and managing
investments and financial assets.
6. Other – activities not attributed to other business lines.
Operational results are attributed to the business line in which the customer's account is managed.
Net interest income - the business line is credited with interest received from loans that it made available,
less the cost of raising the sources (transfer cost). In addition, the business line is credited with the transfer
cost for deposits that were raised less the interest that was paid to the customer.
Noninterest incomes (financing incomes that are not from interest, commissions and other income) – are
attributed to the business line according to the customer's activity.
Business line expenses – include the direct expenses of the business line, and also expenses of headquarters'
units providing services are charged to the business line.
The results of the business lines' activity, both on the side of the balance sheet and on the profit and loss side,
are regularly examined by the management. Examination of the results is done using targets set within the
framework of the annual work plan and against data from the corresponding period in the previous year.
In addition, an examination is carried out of a variety of additional metrics relating to the business line's activity.
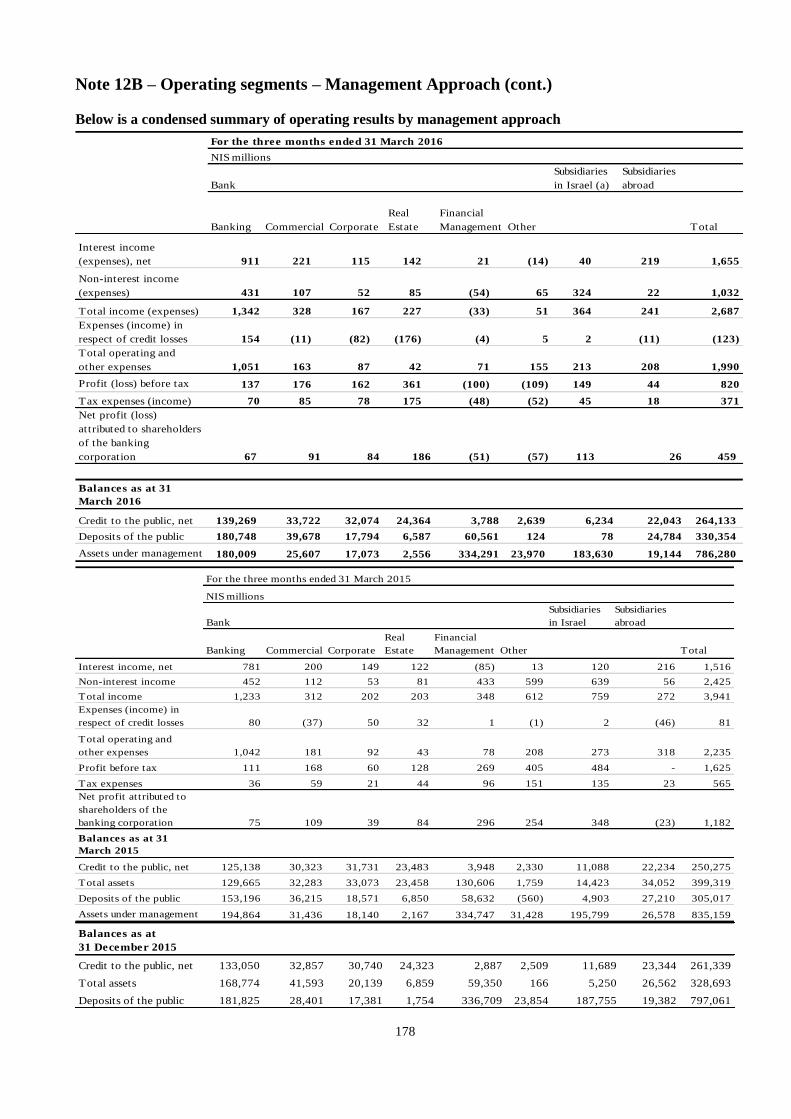
178
Note 12B – Operating segments – Management Approach (cont.)
Below is a condensed summary of operating results by management approach
For the three months ended 31 March 2016
Bank
Subsidiaries
in Israel (a)
Subsidiaries
abroad
Banking Commercial Corporate
Real
Estate
Financial
Management Other Total
Interest income
(expenses), net 911 221 115 142 21 (14) 40 219 1,655
Non-interest income
(expenses) 431 107 52 85 (54) 65 324 22 1,032
Total income (expenses) 1,342 328 167 227 (33) 51 364 241 2,687
Expenses (income) in
respect of credit losses 154 (11) (82) (176) (4) 5 2 (11) (123)
Total operating and
other expenses 1,051 163 87 42 71 155 213 208 1,990
Profit (loss) before tax 137 176 162 361 (100) (109) 149 44 820
Tax expenses (income) 70 85 78 175 (48) (52) 45 18 371
Net profit (loss)
attributed to shareholders
of the banking
corporation 67 91 84 186 (51) (57) 113 26 459
Balances as at 31
March 2016
Credit to the public, net 139,269 33,722 32,074 24,364 3,788 2,639 6,234 22,043 264,133
Deposits of the public 180,748 39,678 17,794 6,587 60,561 124 78 24,784 330,354
Assets under management 180,009 25,607 17,073 2,556 334,291 23,970 183,630 19,144 786,280
NIS millions
For the three months ended 31 March 2015
Bank
Subsidiaries
in Israel
Subsidiaries
abroad
Banking Commercial Corporate
Real
Estate
Financial
Management Other Total
Interest income, net 781 200 149 122 (85) 13 120 216 1,516
Non-interest income 452 112 53 81 433 599 639 56 2,425
Total income 1,233 312 202 203 348 612 759 272 3,941
Expenses (income) in
respect of credit losses 80 (37) 50 32 1 (1) 2 (46) 81
Total operating and
other expenses 1,042 181 92 43 78 208 273 318 2,235
Profit before tax 111 168 60 128 269 405 484 - 1,625
Tax expenses 36 59 21 44 96 151 135 23 565
Net profit attributed to
shareholders of the
banking corporation 75 109 39 84 296 254 348 (23) 1,182
Balances as at 31
March 2015
Credit to the public, net 125,138 30,323 31,731 23,483 3,948 2,330 11,088 22,234 250,275
Total assets 129,665 32,283 33,073 23,458 130,606 1,759 14,423 34,052 399,319
Deposits of the public 153,196 36,215 18,571 6,850 58,632 (560) 4,903 27,210 305,017
Assets under management 194,864 31,436 18,140 2,167 334,747 31,428 195,799 26,578 835,159
NIS millions
Balances as at
31 December 2015
Credit to the public, net 133,050 32,857 30,740 24,323 2,887 2,509 11,689 23,344 261,339
Total assets 168,774 41,593 20,139 6,859 59,350 166 5,250 26,562 328,693
Deposits of the public 181,825 28,401 17,381 1,754 336,709 23,854 187,755 19,382 797,061

179
Note 13 – Additional Information on Credit Risk, Credit to the Public and Allowance for Credit
Losses
A. Debtsa and off-balance sheet credit instruments
Allowance for credit losses
1. Change in balance of allowance for credit losses
For the three months ended 31 March 2016 (Unaudited)
Allowance for credit losses
Banks and
Commercial Residential
Other
private Total
govern-
ments Total
(NIS millions)
Balance of allowance for credit losses
at beginning of the reporting period 2,933 513 707 4,153 3 4,156
Expenses (income) in respect of credit
losses (219) (2) 99 (122) (1) (123)
Accounting write-offs (251) (2) (142) (395) - (395)
Collection of debts written off in
previous years 321 - 90 411 - 411
Net accounting write-offs 70 (2) (52) 16 - 16
Adjustments from translation of
financial statements (6) 1 1 (4) - (4)Balance of allowance for credit losses
at end of the reporting period12,778 510 755 4,043 2 4,045
1Of which: in respect of off-balance
sheet credit instruments 438 - 33 471 - 471
Credit to the public
For the three months ended 31 March 2015 (Unaudited)
Allowance for credit losses
Banks and
Commercial Residential
Other
private Total
govern-
ments Total
(NIS millions)Balance of allowance for credit losses
at beginning of reporting period 3,317 513 652 4,482 4 4,486
Expenses in respect of credit losses 37 (3) 48 82 (1) 81
Accounting write-offs (185) (1) (148) (334) - (334)
Collection of debts written off in
previous years 81 - 98 179 - 179
Net accounting write-offs (104) (1) (50) (155) - (155)
Adjustments from translation of
financial statements 6 (1) (1) 4 - 4Balance of allowance for credit losses
at end of the reporting period13,256 508 649 4,413 3 4,416
1Of which: in respect of off-balance
sheet credit instruments 426 - 39 465 - 465
Credit to the public
(a) Credit to the public, credit to governments, deposits in banks and other debts, excluding bonds and securities borrowed or
purchased under agreements to resell.

180
Note 13 – Additional Information on Credit Risk, Credit to the Public and Allowance for Credit
Losses (cont.)
A. Debtsa and off-balance sheet credit instruments (cont'd)
2. Additional information on the method of calculating the credit loss allowance in respect of debtsa
and on debtsa on which it was calculated
31 March 2016 (Unaudited)
Banks and
Commercial Residential
Other
private Total
govern-
ments Total
(NIS millions)
Recorded debt balance of debtsa
Examined on an individual basis 113,292 61 1,374 114,727 8,174 122,901
Examined on a collective basis1
35,575 81,419 35,984 152,978 3,561 156,539
1Of which: the allowance was
calculated by extent of arrears 1,032 80,366 - 81,398 - 81,398
Total debts(a)2
148,867 81,480 37,358 267,705 11,735 279,440
2Of which:
Debts under restructuring 1,748 - 107 1,855 - 1,855
Other impaired debts 1,729 - 107 1,836 - 1,836
Total impaired debts 3,477 - 214 3,691 - 3,691
Debts in arrears of 90 days or more 62 719 76 857 - 857
Other problem debts 3,091 28 245 3,364 - 3,364
Total impaired debts 6,630 747 535 7,912 - 7,912
Allowance for credit losses for debtsa:
Examined on an individual basis 1,987 13 115 2,115 2 2,117
Examined on a collective basis3
353 497 607 1,457 - 1,457
3Of which the allowance was
calculated by extent of arrears (b) - 495 - 495 - 495
Total allowance for credit losses4
2,340 510 722 3,572 2 3,5744Of which in respect of impaired debts 667 - 23 690 - 690
Credit to the public
c c
c
c
c
c
(a) Credit to the public, credit to governments, deposits in banks (excluding in the Bank of Israel) and other debts, excluding bonds
and securities borrowed or purchased under agreements to resell.
(b) Including the balance of the allowance in excess of that required by the extent of arrears method calculated on a collective basis in
the amount of NIS 307 million.
(c) Including the balance of housing loans granted to purchasing groups in process of construction.

181
Note 13 – Additional Information on Credit Risk, Credit to the Public and Allowance for Credit
Losses (cont.)
A. Debtsa and off-balance sheet credit instruments (cont'd)
2. Additional information on the method of calculating the credit loss allowance in respect of debtsa
and on debtsa on which it was calculated
31 March 2015 (Unaudited)
Banks and
Commercial Residential
Other
private Total
govern-
ments Total
(NIS millions)
Recorded debt balance of debtsa
Examined on an individual basis 106,882 46 872 107,800 10,056 117,856
Examined on a collective basis1
35,914 76,092 34,417 146,423 1,782 148,205
1Of which: the allowance was
calculated by extent of arrears 1,269 73,679 - 74,948 - 74,948
Total debts(a)2
142,796 76,138 35,289 254,223 11,838 266,061
2Of which:
Debts under restructuring 2,441 - 100 2,541 - 2,541
Other impaired debts 2,245 - 61 2,306 - 2,306
Total impaired debts 4,686 - 161 4,847 - 4,847
Debts in arrears of 90 days or more 69 766 93 928 - 928
Other problem debts 4,237 8 268 4,513 - 4,513
Total impaired debts 8,992 774 522 10,288 - 10,288
Allowance for credit losses for debtsa:
Examined on an individual basis 2,542 14 80 2,636 3 2,639
Examined on a collective basis3
288 494 530 1,312 - 1,312
3Of which the allowance was
calculated by extent of arrears (b) 1 491 - 492 - 492
Total allowance for credit losses4
2,830 508 610 3,948 3 3,9514Of which in respect of impaired debts 1,074 - 83 1,157 - 1,157
Credit to the public
c
c
c
c
(a) Credit to the public, credit to governments, deposits in banks (excluding in the Bank of Israel) and other debts, excluding bonds
and securities borrowed or purchased under agreements to resell.
(b) Including the balance of the allowance in excess of that required by the extent of arrears method, calculated on a collective basis in
the amount of NIS 296 million.
(c) Including the balance of housing loans granted to purchasing groups in process of construction.
(d) Restated.

182
Note 13 – Additional Information on Credit Risk, Credit to the Public and Allowance for Credit
Losses (cont.)
A. Debtsa and off-balance sheet credit instruments (cont'd)
2. Additional information on the method of calculating the credit loss allowance in respect of debtsa
and on debtsa on which it was calculated
Banks and
Commercial Residential
Other
private Total
govern-
ments Total
(NIS millions)
Recorded debt balance of debtsa
Examined on an individual basis 107,768 45 852 108,665 7,515 116,180
Examined on a collective basis1
38,097 81,760 36,548 156,405 3,254 159,659
1Of which: the allowance was
calculated by extent of arrears 1,014 80,616 - 81,630 - 81,630
Total debts(a)2
145,865 81,805 37,400 265,070 10,769 275,839
2Of which:
Debts under restructuring 2,192 - 86 2,278 - 2,278
Other impaired debts 1,617 - 26 1,643 - 1,643
Total impaired debts 3,809 - 112 3,921 - 3,921
Debts in arrears of 90 days or more 67 770 105 942 - 942
Other problem debts 3,151 11 299 3,461 - 3,461
Total impaired debts 7,027 781 516 8,324 - 8,324
Allowance for credit losses for debtsa:
Examined on an individual basis 2,177 15 93 2,285 3 2,288
Examined on a collective basis3
307 498 581 1,386 - 1,386
3Of which the allowance was
calculated by extent of arrears (b) 1 497 - 498 - 498
Total allowance for credit losses4
2,484 513 674 3,671 3 3,6744Of which in respect of impaired debts 824 - 43 867 - 867
Credit to the public
31 December 2015 (Audited)
c
d
d
c
d
(a) Credit to the public, credit to governments, deposits in banks (excluding in the Bank of Israel) and other debts, excluding bonds
and securities borrowed or purchased under agreements to resell.
(b) Including the balance of the allowance in excess of that required by the extent of arrears method, calculated on a collective basis in
the amount of NIS 296 million.
(c) Including the balance of housing loans granted to purchasing groups in process of construction.
(d) Reclassified.
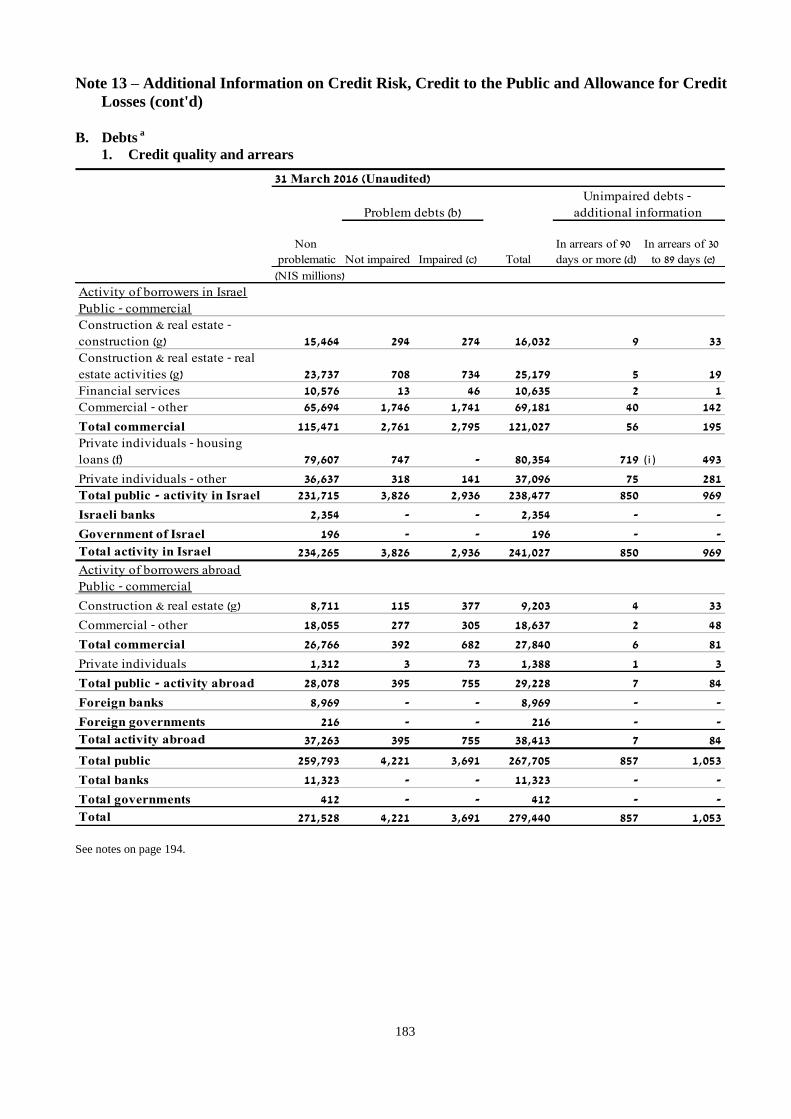
183
Note 13 – Additional Information on Credit Risk, Credit to the Public and Allowance for Credit
Losses (cont'd)
B. Debts
a
1. Credit quality and arrears
Non
problematic Not impaired Impaired (c) Total
In arrears of 90
days or more (d)
In arrears of 30
to 89 days (e)
(NIS millions)
Activity of borrowers in Israel
Public - commercial
Construction & real estate -
construction (g) 15,464 294 274 16,032 9 33
Construction & real estate - real
estate activities (g) 23,737 708 734 25,179 5 19
Financial services 10,576 13 46 10,635 2 1
Commercial - other 65,694 1,746 1,741 69,181 40 142
Total commercial 115,471 2,761 2,795 121,027 56 195
Private individuals - housing
loans (f) 79,607 747 - 80,354 719 493
Private individuals - other 36,637 318 141 37,096 75 281
Total public - activity in Israel 231,715 3,826 2,936 238,477 850 969
Israeli banks 2,354 - - 2,354 - -
Government of Israel 196 - - 196 - -
Total activity in Israel 234,265 3,826 2,936 241,027 850 969
Activity of borrowers abroad
Public - commercial
Construction & real estate (g) 8,711 115 377 9,203 4 33
Commercial - other 18,055 277 305 18,637 2 48
Total commercial 26,766 392 682 27,840 6 81
Private individuals 1,312 3 73 1,388 1 3
Total public - activity abroad 28,078 395 755 29,228 7 84
Foreign banks 8,969 - - 8,969 - -
Foreign governments 216 - - 216 - -
Total activity abroad 37,263 395 755 38,413 7 84
Total public 259,793 4,221 3,691 267,705 857 1,053
Total banks 11,323 - - 11,323 - -
Total governments 412 - - 412 - -
Total 271,528 4,221 3,691 279,440 857 1,053
31 March 2016 (Unaudited)
Problem debts (b)
Unimpaired debts -
additional information
(i )
See notes on page 194.
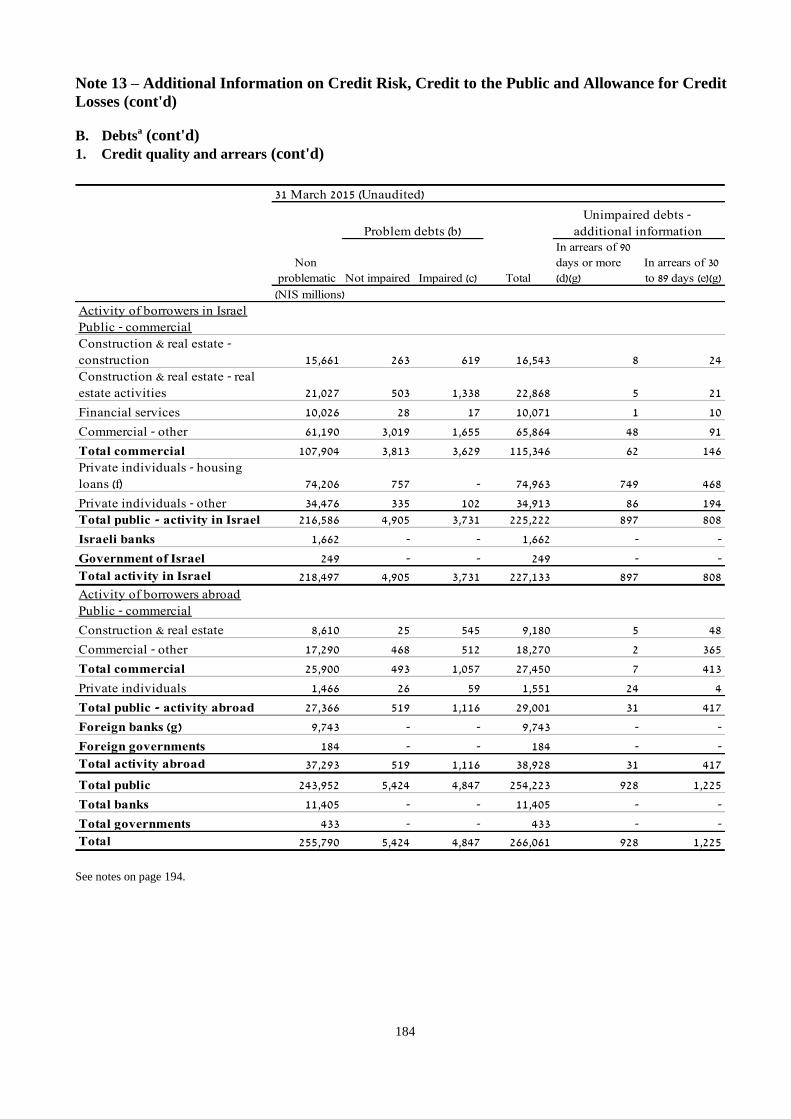
184
Note 13 – Additional Information on Credit Risk, Credit to the Public and Allowance for Credit
Losses (cont'd)
B. Debtsa (cont'd)
1. Credit quality and arrears (cont'd)
Non
problematic Not impaired Impaired (c) Total
In arrears of 90
days or more
(d)(g)
In arrears of 30
to 89 days (e)(g)
(NIS millions)
Activity of borrowers in Israel
Public - commercial
Construction & real estate -
construction 15,661 263 619 16,543 8 24
Construction & real estate - real
estate activities 21,027 503 1,338 22,868 5 21
Financial services 10,026 28 17 10,071 1 10
Commercial - other 61,190 3,019 1,655 65,864 48 91
Total commercial 107,904 3,813 3,629 115,346 62 146
Private individuals - housing
loans (f) 74,206 757 - 74,963 749 468
Private individuals - other 34,476 335 102 34,913 86 194
Total public - activity in Israel 216,586 4,905 3,731 225,222 897 808
Israeli banks 1,662 - - 1,662 - -
Government of Israel 249 - - 249 - -
Total activity in Israel 218,497 4,905 3,731 227,133 897 808
Activity of borrowers abroad
Public - commercial
Construction & real estate 8,610 25 545 9,180 5 48
Commercial - other 17,290 468 512 18,270 2 365
Total commercial 25,900 493 1,057 27,450 7 413
Private individuals 1,466 26 59 1,551 24 4
Total public - activity abroad 27,366 519 1,116 29,001 31 417
Foreign banks (g) 9,743 - - 9,743 - -
Foreign governments 184 - - 184 - -
Total activity abroad 37,293 519 1,116 38,928 31 417
Total public 243,952 5,424 4,847 254,223 928 1,225
Total banks 11,405 - - 11,405 - -
Total governments 433 - - 433 - -
Total 255,790 5,424 4,847 266,061 928 1,225
31 March 2015 (Unaudited)
Problem debts (b)
Unimpaired debts -
additional information
See notes on page 194.
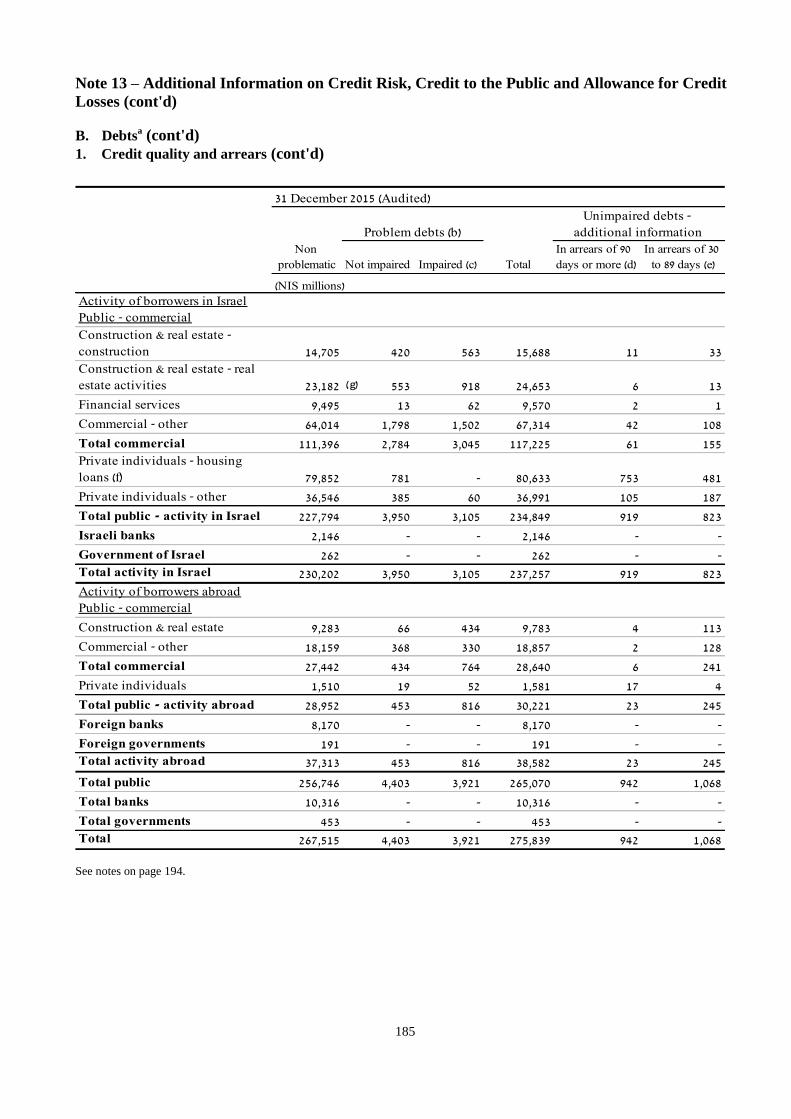
185
Note 13 – Additional Information on Credit Risk, Credit to the Public and Allowance for Credit
Losses (cont'd)
B. Debtsa (cont'd)
1. Credit quality and arrears (cont'd)
Non
problematic Not impaired Impaired (c) Total
In arrears of 90
days or more (d)
In arrears of 30
to 89 days (e)
(NIS millions)
Activity of borrowers in Israel
Public - commercial
Construction & real estate -
construction 14,705 420 563 15,688 11 33
Construction & real estate - real
estate activities 23,182 553 918 24,653 6 13
Financial services 9,495 13 62 9,570 2 1
Commercial - other 64,014 1,798 1,502 67,314 42 108
Total commercial 111,396 2,784 3,045 117,225 61 155
Private individuals - housing
loans (f) 79,852 781 - 80,633 753 481
Private individuals - other 36,546 385 60 36,991 105 187
Total public - activity in Israel 227,794 3,950 3,105 234,849 919 823
Israeli banks 2,146 - - 2,146 - -
Government of Israel 262 - - 262 - -
Total activity in Israel 230,202 3,950 3,105 237,257 919 823
Activity of borrowers abroad
Public - commercial
Construction & real estate 9,283 66 434 9,783 4 113
Commercial - other 18,159 368 330 18,857 2 128
Total commercial 27,442 434 764 28,640 6 241
Private individuals 1,510 19 52 1,581 17 4
Total public - activity abroad 28,952 453 816 30,221 23 245
Foreign banks 8,170 - - 8,170 - -
Foreign governments 191 - - 191 - -
Total activity abroad 37,313 453 816 38,582 23 245
Total public 256,746 4,403 3,921 265,070 942 1,068
Total banks 10,316 - - 10,316 - -
Total governments 453 - - 453 - -
Total 267,515 4,403 3,921 275,839 942 1,068
31 December 2015 (Audited)
Problem debts (b)
Unimpaired debts -
additional information
g
See notes on page 194.

186
Note 13 – Additional Information on Credit Risk, Credit to the Public and Allowance for Credit
Losses (cont'd)
1. Credit quality and arrears (cont'd)
Notes: (a) Credit to the public, credit to governments, deposits in banks and other debts, excluding bonds and securities borrowed or
purchased under agreements to resell.
(b) Impaired, substandard or special mention credit risk, including in respect of housing loans for which there is a provision by extent
of arrears, and housing loans for which there is no provision that are in arrears of 90 days or more.
(c) As a rule, impaired debts do not accrue interest income. For information on certain impaired debts under troubled debt
restructuring, see Note 13(B)(2)C below.
(d) Classified as problem debts that are not impaired, accruing interest income.
(e) Accruing interest income. Debts in arrears of 30 to 89 days in the amount of NIS 524 million were classified as problem debts that
are not impaired (31 March 2015 – NIS 482 million, 31 December 2015 – NIS 503 million).
(f) Including balance of housing loans in the amount of NIS 144 million (31 March 2015 – NIS 159 million, 31 December 2015 –
NIS 144 million) with a provision by extent of arrears, in which an arrangement was signed for the repayment of arrears by the
borrower, with a change made to the repayment schedule in respect of the loan balance of which the repayment date has not yet
arrived.
(g) 5.3% of credit for income generating properties granted by the Construction and Real Estate Division of the Bank has LTV rates in
excess of 85%.
(h) Reclassified.
(i) The balance of non-impaired debts in arrears of 90 days or more, as of 31 March 2016, NIS 857 million, is credit granted by the
Bank, of which NIS 138 million is for non-housing loans for which the period of arrears is 90-149 days and NIS 719 million for
housing loans, of which a total of NIS 169 million is in arrears of up to 149 days, NIS 159 million is in arrears of 150-249 days
and the balance is in respect of a debt in arrears of 150 days or more.
Credit quality – status of debts in arrears(a)
The status of debts in arrears is monitored routinely, and serves as one of the key indicators of credit quality.
The status of debts in arrears is determined based on actual days of arrears. Debts are treated as nonperforming
(not accruing interest income) after 90 days of arrears, as is any debt that has undergone troubled debt
restructuring and has resumed accruing interest when it is one day of arrears relative to the new terms of the
debt. With regard to debts evaluated on a collective basis, the status of arrears affects the classification of the
debt (the classification is more severe for more extensive arrears). In most cases after 150 days of arrears, the
Bank performs a charge-off of the debt. With regard to housing loans, with the exception of loans without
quarterly or monthly payments, the Bank establishes an allowance according to the method of the extent of
arrears.

187
Note 13 – Additional Information on Credit Risk, Credit to the Public and Allowance for Credit
Losses (cont'd)
B. Debtsa (cont'd)
2. Additional information on impaired debts
a. Impaired debts and individual allowance
Balance (b) of
impaired
debts in
respect of
which there is
an andividual
allowance (c)
Balance of
individual
allowance (c)
Balance (b) of
impaired
debts in
respect of
which there is
no individual
allowance (c)
Total
balance (b) of
impaired debts
Principal
contractual
balance of
impaired debts
Activity of borrowers in Israel
Public - commercial
Construction & real estate - construction 104 22 170 274 851
Construction & real estate - real estate
activities 591 117 143 734 1,948
Financial services - - 46 46 561
Commercial - other 1,417 305 324 1,741 4,979
Total commercial 2,112 444 683 2,795 8,339
Private individuals - housing loans - - - - -
Private individuals - other 75 6 66 141 2,080
Total public - activity in Israel 2,187 450 749 2,936 10,419
Israeli banks - - - - -
Government of Israel - - - - -Total activity in Israel 2,187 450 749 2,936 10,419
Activity of borrowers abroad
Public - commercial
Construction & real estate 262 134 115 377 508
Commercial - other 244 89 61 305 594
Total commercial 506 223 176 682 1,102
Private individuals 35 17 38 73 119
Total public - activity abroad 541 240 214 755 1,221
Foreign banks - - - - -
Foreign governments - - - - -Total activity abroad 541 240 214 755 1,221
Total public 2,728 690 963 3,691 11,640
Total banks - - - - -
Total governments - - - - -Total 2,728 690 963 3,691 11,640
Of which:
Measured by present value of cash
flows 2,076 427 517 2,593Debts under troubled debt
restructuring 1,183 175 672 1,855
(NIS millions)
31 March 2016 (Unaudited)
(a) Credit to the public, credit to governments, deposits in banks and other debts, excluding bonds and securities borrowed or
purchased under agreements to resell.
(b) Recorded balance of debt.
(c) Individual allowance for credit losses.
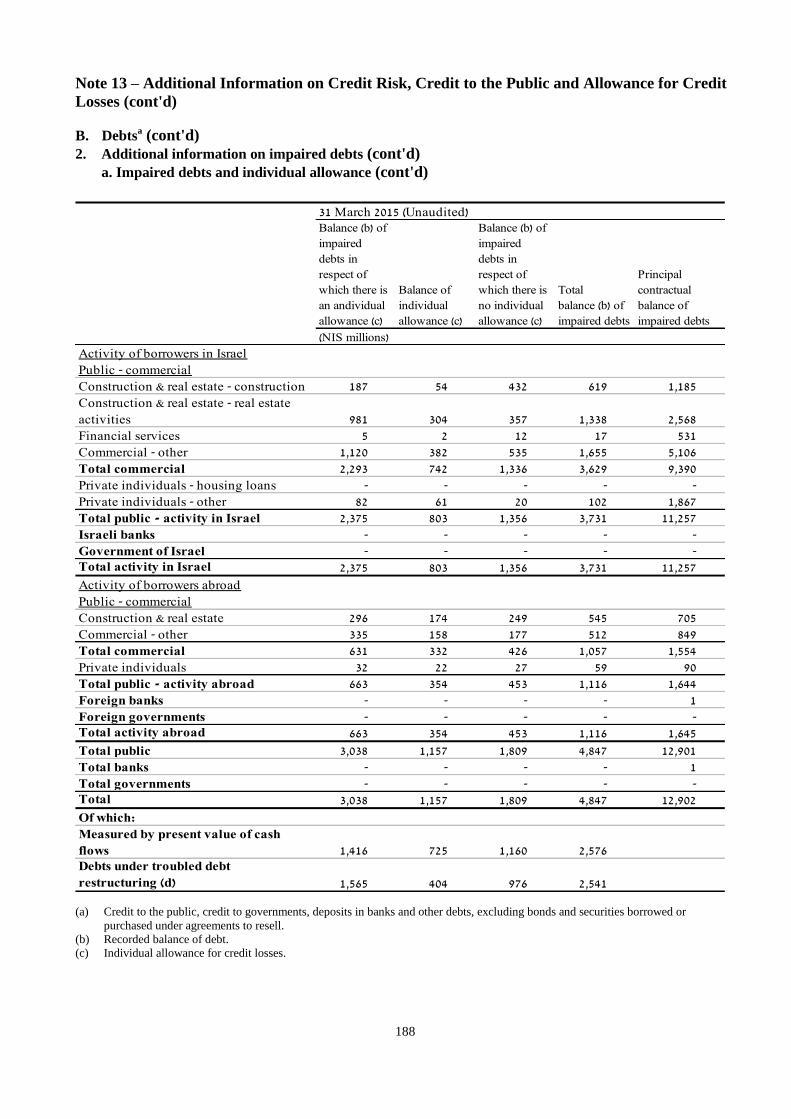
188
Note 13 – Additional Information on Credit Risk, Credit to the Public and Allowance for Credit
Losses (cont'd)
B. Debtsa (cont'd)
2. Additional information on impaired debts (cont'd)
a. Impaired debts and individual allowance (cont'd)
Balance (b) of
impaired
debts in
respect of
which there is
an andividual
allowance (c)
Balance of
individual
allowance (c)
Balance (b) of
impaired
debts in
respect of
which there is
no individual
allowance (c)
Total
balance (b) of
impaired debts
Principal
contractual
balance of
impaired debts
Activity of borrowers in Israel
Public - commercial
Construction & real estate - construction 187 54 432 619 1,185
Construction & real estate - real estate
activities 981 304 357 1,338 2,568
Financial services 5 2 12 17 531
Commercial - other 1,120 382 535 1,655 5,106
Total commercial 2,293 742 1,336 3,629 9,390
Private individuals - housing loans - - - - -
Private individuals - other 82 61 20 102 1,867
Total public - activity in Israel 2,375 803 1,356 3,731 11,257
Israeli banks - - - - -
Government of Israel - - - - -Total activity in Israel 2,375 803 1,356 3,731 11,257
Activity of borrowers abroad
Public - commercial
Construction & real estate 296 174 249 545 705
Commercial - other 335 158 177 512 849
Total commercial 631 332 426 1,057 1,554
Private individuals 32 22 27 59 90
Total public - activity abroad 663 354 453 1,116 1,644
Foreign banks - - - - 1
Foreign governments - - - - -Total activity abroad 663 354 453 1,116 1,645
Total public 3,038 1,157 1,809 4,847 12,901
Total banks - - - - 1
Total governments - - - - -Total 3,038 1,157 1,809 4,847 12,902
Of which:
Measured by present value of cash
flows 1,416 725 1,160 2,576Debts under troubled debt
restructuring (d) 1,565 404 976 2,541
31 March 2015 (Unaudited)
(NIS millions)
(a) Credit to the public, credit to governments, deposits in banks and other debts, excluding bonds and securities borrowed or
purchased under agreements to resell.
(b) Recorded balance of debt.
(c) Individual allowance for credit losses.

189
Note 13 – Additional Information on Credit Risk, Credit to the Public and Allowance for Credit
Losses (cont'd)
B. Debtsa (cont'd)
2. Additional information on impaired debts (cont'd)
a. Impaired debts and individual allowance (cont'd)
Balance (b) of
impaired
debts in
respect of
which there is
an andividual
allowance (c)
Balance of
individual
allowance (c)
Balance (b) of
impaired
debts in
respect of
which there is
no individual
allowance (c)
Total
balance (b) of
impaired debts
Principal
contractual
balance of
impaired debts
Activity of borrowers in Israel
Public - commercial
Construction & real estate - construction 149 33 414 563 1,084
Construction & real estate - real estate
activities 666 186 252 918 2,214Financial services 1 1 61 62 589Commercial - other 1,103 333 399 1,502 4,856Total commercial 1,919 553 1,126 3,045 8,743Private individuals - housing loans - - - - -Private individuals - other 51 25 9 60 1,958Total public - activity in Israel 1,970 578 1,135 3,105 10,701Israeli banks - - - - -
Government of Israel - - - - -Total activity in Israel 1,970 578 1,135 3,105 10,701
Activity of borrowers abroad
Public - commercial
Construction & real estate 295 146 139 434 634Commercial - other 261 125 69 330 599Total commercial 556 271 208 764 1,233Private individuals 29 18 23 52 96Total public - activity abroad 585 289 231 816 1,329Foreign banks - - - - 1Foreign governments - - - - -Total public - activity abroad 585 289 231 816 1,330
Total public 2,555 867 1,366 3,921 12,030Total banks - - - - 1Total governments - - - - -Total 2,555 867 1,366 3,921 12,031
Of which:
Measured by present value of cash
flows 1,549 572 950 2,499Debts under troubled debt
restructuring 1,425 308 853 2,278
31 December 2015 (Audited)
(NIS millions)
(d)
(d)
(d)
(a) Credit to the public, credit to governments, deposits in banks and other debts, excluding bonds and securities borrowed or
purchased under agreements to resell.
(b) Recorded balance of debt.
(c) Individual allowance for credit losses.
(d) Reclassified.

190
Note 13 – Additional Information on Credit Risk, Credit to the Public and Allowance for Credit
Losses (cont'd)
B. Debtsa (cont'd)
2. Additional information on impaired debts (cont'd) b. Average balance and interest income
Average
balance (b)
of impaired
debts
Interest
income
recorded (c)
Of which:
recorded
on cash
basis
Average
balance of
impaired
debts (b) (e)
Interest
income
recorded
(c)
Of which:
recorded
on cash
basis
(Unaudited)
NIS millions
Activity of borrowers in Israel
Public - commercial
Construction & real estate -
construction 415 2 1 555 (1) (1)
Construction & real estate - real estate
activities 824 - - 1,379 1 1
Financial services 54 - - 126 - -
Commercial - other 1,618 5 3 1,590 (1) (1)
Total commercial 2,911 7 4 3,650 (1) (1)
Private individuals - housing loans - - - - - -
Private individuals - other 99 1 - 104 (3) (3)
Total public - activity in Israel 3,010 8 4 3,754 (4) (4)
Israeli banks - - - - - -
Government of Israel - - - - - -
Total activity in Israel 3,010 8 4 3,754 (4) (4)
Activity of borrowers abroad
Public - commercial - - - - - -
Construction & real estate 410 2 2 627 (2) (2)
Commercial - other 273 2 2 697 (4) (4)
Total commercial 683 4 4 1,324 (6) (6)
Private individuals 66 1 1 70 (1) (1)
Total public - activity abroad 749 5 5 1,394 (7) (7)
Foreign banks - - - - - -
Foreign governments - - - - - -
Total activity abroad 749 5 5 1,394 (7) (7)
Total public 3,759 13 9 5,148 (11) (11)
Total banks - - - - - -
Total governments - - - - - -
Total 3,759 13 9 5,148 (11) (11)
For the three months ended 31 March
2016
For the three months ended 31 March
2015
(d) (d)
(a) Credit to the public, credit to governments, deposits in banks and other debts, excluding bonds and securities borrowed or
purchased under agreements to resell.
(b) Average recorded balance of debt of impaired debts during the reporting period.
(c) Interest income recorded in the reporting period, in respect of the average balance of impaired debts, at the time the debts were
classified as impaired.
(d) If the impaired debts had accumulated interest according to the original terms, interest income would have been recorded for the
three month period ended 31 March 2016 in the amount of NIS 80 million (31 March 2015 – NIS 102 million).

191
Note 13 – Additional Information on Credit Risk, Credit to the Public and Allowance for Credit
Losses (cont'd)
B. Debtsa (cont'd)
2. Additional information on impaired debts (cont'd) c. Problem debts under restructuring
d
31 March 2015
Not accruing
interest income
Accruing (b)
not in arrears Total (c)
Not accruing
interest income
Accruing (b)
not in arrears Total (c)
Unaudited
Activity of borrowers in Israel
Public - commercial
Construction & real estate -
construction 132 24 156 454 18 472
Construction & real estate - real
estate activities 316 131 447 829 4 833
Financial services 1 13 14 11 - 11
Commercial - other 704 92 796 541 28 569
Total commercial 1,153 260 1,413 1,835 50 1,885
Private individuals - housing
loans - - - - - -
Private individuals - other 59 20 79 66 - 66
Total public - activity in Israel 1,212 280 1,492 1,901 50 1,951
Israeli banks - - - - - -
Government of Israel - - - - - -
Total activity in Israel 1,212 280 1,492 1,901 50 1,951
Activity of borrowers abroad
Public - commercial
Construction & real estate 160 102 262 177 135 312
Commercial - other 34 39 73 107 137 244
Total commercial 194 141 335 284 272 556
Private individuals 7 21 28 25 9 34
Total public - activity abroad 201 162 363 309 281 590
Foreign banks - - - - - -
Foreign governments - - - - - -
Total activity abroad 201 162 363 309 281 590
Total public 1,413 442 1,855 2,210 331 2,541
Total banks - - - - - -
Total governments - - - - - -
Total 1,413 442 1,855 2,210 331 2,541
31 March 2016
(NIS millions)
(a) Credit to the public, credit to governments, deposits in banks and other debts, excluding bonds and securities borrowed or
purchased under agreements to resell.
(b) Accumulating interest income.
(c) Included in impaired debts.
(d) Liabilities for granting additional credit to borrowers for whom there was a troubled debt restructuring in which changes were made
to the terms of the credit amounted to 69 million for 31 March 2016 (31 March 2015 – NIS 92 million).

192
Note 13 – Additional Information on Credit Risk, Credit to the Public and Allowance for Credit
Losses (cont'd)
B. Debtsa (cont'd)
2. Additional information on impaired debts (cont'd) c. Problem debts under restructuring (cont'd)
Not accruing
interest income
Accruing (b)
not in arrears Total (c)
(NIS millions)
Activity of borrowers in Israel
Public - commercialConstruction & real estate - construction 456 14 470
Construction & real estate - real
estate activities 613 4 617
Financial services 1 - 1
Commercial - other 519 29 548
Total commercial 1,589 47 1,636
Private individuals - housing loans - - -
Private individuals - other 56 - 56
Total public - activity in Israel 1,645 47 1,692
Israeli banks - - -
Government of Israel - - -Total activity in Israel 1,645 47 1,692
Activity of borrowers abroad
Public - commercialConstruction & real estate 146 267 413
Commercial - other 40 103 143
Total commercial 186 370 556
Private individuals 8 22 30
Total public - activity abroad 194 392 586
Foreign banks - - -
Foreign governments - - -Total activity abroad 194 392 586
Total public 1,839 439 2,278
Total banks - - -
Total governments - - -Total 1,839 439 2,278
31 December 2015 (Audited)
(a) Credit to the public, credit to governments, deposits in banks and other debts, excluding bonds and securities borrowed or
purchased under agreements to resell.
(b) Accumulating interest income.
(c) Included in impaired debts.
Liabilities for granting additional credit to borrowers for whom there was a troubled debt restructuring in which changes were made
to the terms of the credit amounted at 31 December 2015 to NIS 43 million.

193
Note 13 – Additional Information on Credit Risk, Credit to the Public and Allowance for Credit
Losses (cont'd)
B. Debtsa (cont'd)
2. Additional information on impaired debts (cont'd) c. Problem debts under restructuring (cont'd)
1. Restructurings carried out
Number of
contracts
Recorded
debt balance
before
restructuring
Recorded
debt balance
after
restructuring
Number of
contracts
Recorded
debt
balance
before
restructuring
Recorded
debt balance
after
restructuring
(Unaudited)
Activity of borrowers in Israel
Public - commercial
Construction & real estate -
construction 51 3 3 15 3 48
Construction & real estate -
real estate activities 11 - - - - -
Financial services 3 - - - - -
Commercial - other 217 15 15 30 5 5
Total commercial 282 18 18 45 8 53
Private individuals - housing
loans - - - - - -
Private individuals - other 1,580 5 2 252 3 3
Total public -
activity in Israel 1,862 23 20 297 11 56
Israeli banks - - - - - -
Government of Israel - - - - - -
Total activity in Israel 1,862 23 20 297 11 56
Activity of borrowers abroad
Public - commercial - - - - - -
Construction & real estate 2 14 14 6 10 9
Commercial - other 4 8 8 7 65 65
Total commercial 6 22 22 13 75 74
Private individuals 2 - - 2 - -
Total public - activity abroad 8 22 22 15 75 74
Foreign banks - - - - - -
Foreign governments - - - - - -
Total activity abroad 8 22 22 15 75 74
Total public 1,870 45 42 312 86 130
Total banks - - - - - -
Total governments - - - - - -
Total 1,870 45 42 312 86 130
For the three months ended 31 March 2016
(NIS millions)
For the three months ended 31 March 2015
(a) Credit to the public, credit to governments, deposits in banks and other debts, excluding bonds and securities borrowed or purchased
under agreements to resell.

194
Note 13 – Additional Information on Credit Risk, Credit to the Public and Allowance for Credit
Losses (cont'd)
B. Debtsa (cont'd)
2. Additional information on impaired debts (cont'd) c. Problem debts under restructuring (cont'd)
2. Failed restructurings carried out(b)
Number of
contracts
Recorded debt
balance (c)
Number of
contracts
Recorded debt
balance (c)
(Unaudited)
Activity of borrowers in Israel
Public - commercial
Construction & real estate -
construction 15 2 11 8
Construction & real estate - real
estate activities 1 - 1 -
Financial services 1 - - -
Commercial - other 47 6 17 2
Total commercial 64 8 29 10
Private individuals - housing
loans - - - -
Private individuals - other 253 4 115 1
Total public - activity in Israel 317 12 144 11
Israeli banks - - - -
Government of Israel - - - -
Total activity in Israel 317 12 144 11
Activity of borrowers abroad
Public - commercial
Construction & real estate 3 1 4 1
Commercial - other 4 1 1 -
Total commercial 7 2 5 1
Private individuals - - 2 -
Total public - activity abroad 7 2 7 1
Foreign banks - - - -
Foreign governments - - - -
Total activity abroad 7 2 7 1
Total public 324 14 151 12
Total banks - - - -
Total governments - - - -Total 324 14 151 12
For the three months ended 31 March
2016
For the three months ended 31 March
2015
(NIS millions)
(a) Credit to the public, credit to governments, deposits in banks and other debts, excluding bonds and securities borrowed or
purchased under agreements to resell.
(b) Debts that during the reporting year went into arrears of 30 days or more and underwent a troubled debt restructuring during the 12
months preceding the date they became debts in arrears.
(c) Recorded balance of debt at the end of the quarter in which the failure was carried out.
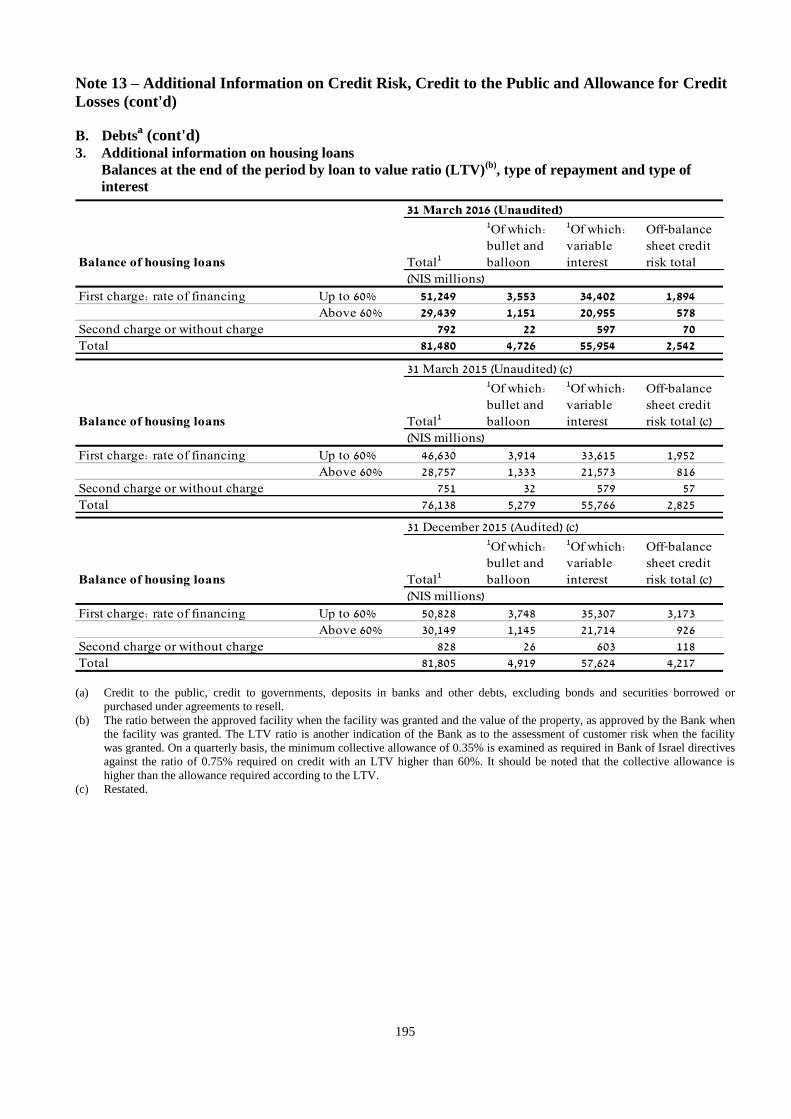
195
Note 13 – Additional Information on Credit Risk, Credit to the Public and Allowance for Credit
Losses (cont'd)
B. Debtsa (cont'd)
3. Additional information on housing loans
Balances at the end of the period by loan to value ratio (LTV)(b)
, type of repayment and type of
interest
Balance of housing loans Total1
1Of which:
bullet and
balloon
1Of which:
variable
interest
Off-balance
sheet credit
risk total
(NIS millions)
First charge: rate of financing Up to 60% 51,249 3,553 34,402 1,894
Above 60% 29,439 1,151 20,955 578
Second charge or without charge 792 22 597 70
Total 81,480 4,726 55,954 2,542
31 March 2016 (Unaudited)
Balance of housing loans Total1
1Of which:
bullet and
balloon
1Of which:
variable
interest
Off-balance
sheet credit
risk total (c)
(NIS millions)
First charge: rate of financing Up to 60% 46,630 3,914 33,615 1,952
Above 60% 28,757 1,333 21,573 816
Second charge or without charge 751 32 579 57
Total 76,138 5,279 55,766 2,825
31 March 2015 (Unaudited) (c)
Balance of housing loans Total1
1Of which:
bullet and
balloon
1Of which:
variable
interest
Off-balance
sheet credit
risk total (c)
(NIS millions)
First charge: rate of financing Up to 60% 50,828 3,748 35,307 3,173
Above 60% 30,149 1,145 21,714 926
Second charge or without charge 828 26 603 118
Total 81,805 4,919 57,624 4,217
31 December 2015 (Audited) (c)
(a) Credit to the public, credit to governments, deposits in banks and other debts, excluding bonds and securities borrowed or
purchased under agreements to resell.
(b) The ratio between the approved facility when the facility was granted and the value of the property, as approved by the Bank when
the facility was granted. The LTV ratio is another indication of the Bank as to the assessment of customer risk when the facility
was granted. On a quarterly basis, the minimum collective allowance of 0.35% is examined as required in Bank of Israel directives
against the ratio of 0.75% required on credit with an LTV higher than 60%. It should be noted that the collective allowance is
higher than the allowance required according to the LTV. (c) Restated.
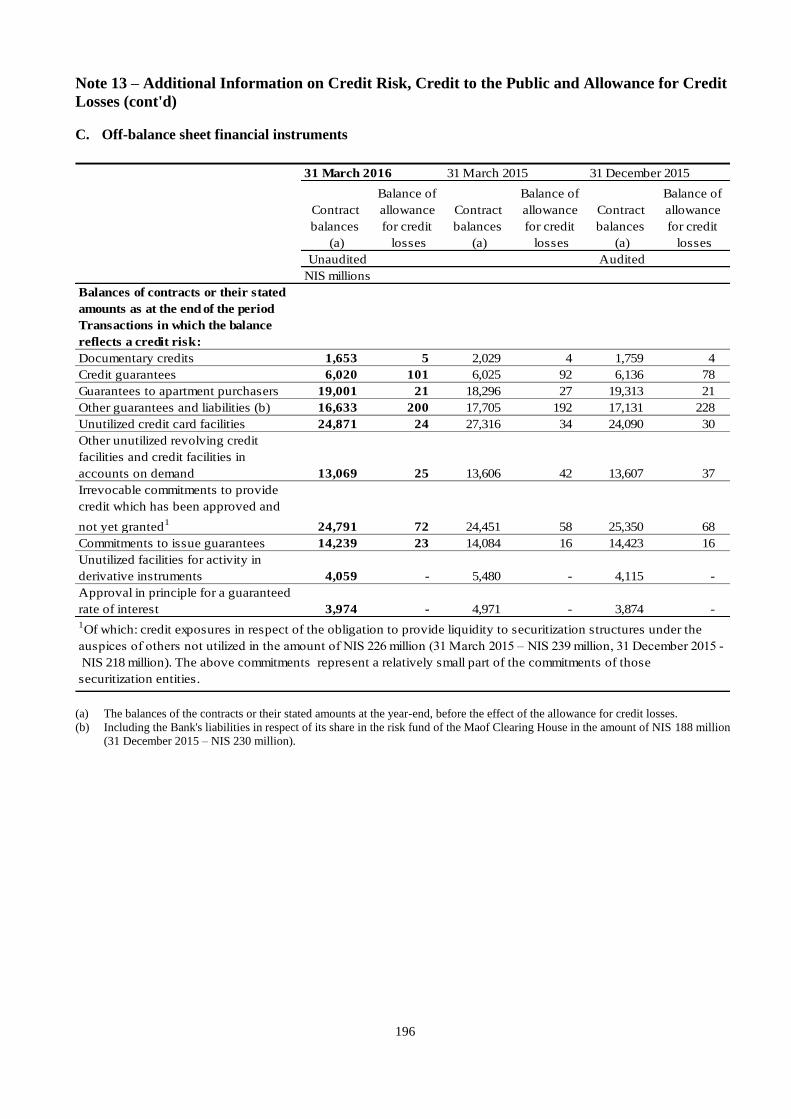
196
Note 13 – Additional Information on Credit Risk, Credit to the Public and Allowance for Credit
Losses (cont'd)
C. Off-balance sheet financial instruments
Contract
balances
(a)
Balance of
allowance
for credit
losses
Contract
balances
(a)
Balance of
allowance
for credit
losses
Contract
balances
(a)
Balance of
allowance
for credit
losses
Unaudited Audited
NIS millions
Balances of contracts or their stated
amounts as at the end of the period
Transactions in which the balance
reflects a credit risk:
Documentary credits 1,653 5 2,029 4 1,759 4
Credit guarantees 6,020 101 6,025 92 6,136 78
Guarantees to apartment purchasers 19,001 21 18,296 27 19,313 21
Other guarantees and liabilities (b) 16,633 200 17,705 192 17,131 228
Unutilized credit card facilities 24,871 24 27,316 34 24,090 30
Other unutilized revolving credit
facilities and credit facilities in
accounts on demand 13,069 25 13,606 42 13,607 37
Irrevocable commitments to provide
credit which has been approved and
not yet granted1
24,791 72 24,451 58 25,350 68
Commitments to issue guarantees 14,239 23 14,084 16 14,423 16
Unutilized facilities for activity in
derivative instruments 4,059 - 5,480 - 4,115 -
Approval in principle for a guaranteed
rate of interest 3,974 - 4,971 - 3,874 -
31 March 2016 31 March 2015 31 December 2015
1Of which: credit exposures in respect of the obligation to provide liquidity to securitization structures under the
auspices of others not utilized in the amount of NIS 226 million (31 March 2015 – NIS 239 million, 31 December 2015 -
NIS 218 million). The above commitments represent a relatively small part of the commitments of those
securitization entities.
(a) The balances of the contracts or their stated amounts at the year-end, before the effect of the allowance for credit losses.
(b) Including the Bank's liabilities in respect of its share in the risk fund of the Maof Clearing House in the amount of NIS 188 million
(31 December 2015 – NIS 230 million).

197
Note 14 –Assets and Liabilities by Linkage Basis
31 March 2016 (Unaudited)
Israeli currency Foreign currency (a)
Non-
Linked to In U.S. In In other monetary
Unlinked the CPI dollars euro currencies items (b) Total
(NIS millions)
Assets
Cash and deposits with banks 44,997 242 6,699 912 2,506 292 55,648
Securities 37,928 2,919 31,940 1,886 1,444 2,610 78,727
Securities borrowed or purchased under
agreements to resell 1,621 - - - - - 1,621
Credit to the public, net (c) 177,017 48,477 27,817 5,234 5,387 201 264,133
Credit to governments 53 143 159 57 - - 412
Investments in companies included on equity
basis - - - - - 899 899
Buildings and equipment - - - - - 3,060 3,060
Assets in respect of derivative instruments 8,796 129 2,014 455 288 1,468 13,150
Intangible assets and goodwill 6,459 3 846 7 39 536 7,890
Other assets - - - - - 17 17
Total assets 276,871 51,913 69,475 8,551 9,664 9,083 425,557
Liabilities
Deposits of the public 198,602 25,731 83,860 12,903 8,736 522 330,354
Deposits from banks 1,963 33 2,022 382 41 - 4,441
Deposits from governments 53 1 746 8 - - 808
Securities lent or sold under agreements to
repurchase 845 - - - - - 845
Debentures, bonds and subordinated notes 6,606 18,154 - - - 50 24,810
Liabilities in respect of derivative instruments 9,053 172 2,307 618 425 1,421 13,996
Other liabilities 8,073 10,941 769 42 193 632 20,650
Total liabilities 225,195 55,032 89,704 13,953 9,395 2,625 395,904
Surplus assets (liabilities) (d) 51,676 (3,119) (20,229) (5,402) 269 6,458 29,653
Effect of hedging derivative instruments:
Derivative instruments (excluding options) - - - - - - -
Effect of non-hedging derivative instruments:
Derivative instruments (excluding options) (22,366) (950) 19,324 5,026 (1,073) 39 -
Options in the money, net (in terms of
underlying asset) (380) - 546 (257) 91 - -
Options out of the money, net (in terms of
underlying asset) 617 - (573) (145) 101 - -
Total 29,547 (4,069) (932) (778) (612) 6,497 29,653
Effect of non-hedging derivative instruments:
Options in the money, net
(discounted par value) (347) - 513 (306) 140 - -Options out of the money, net
(discounted par value) 960 - 47 (1,021) 14 - - (a) Including linked to foreign currency. (b) Including derivative instruments whose basis refers to a non-monetary item.
(c) After deducting credit loss allowances attributed to the linkage basis according to the linkage of the credit for which it was
created in the amount of NIS 3,572 million.
(d) Shareholders' equity including minority interests.
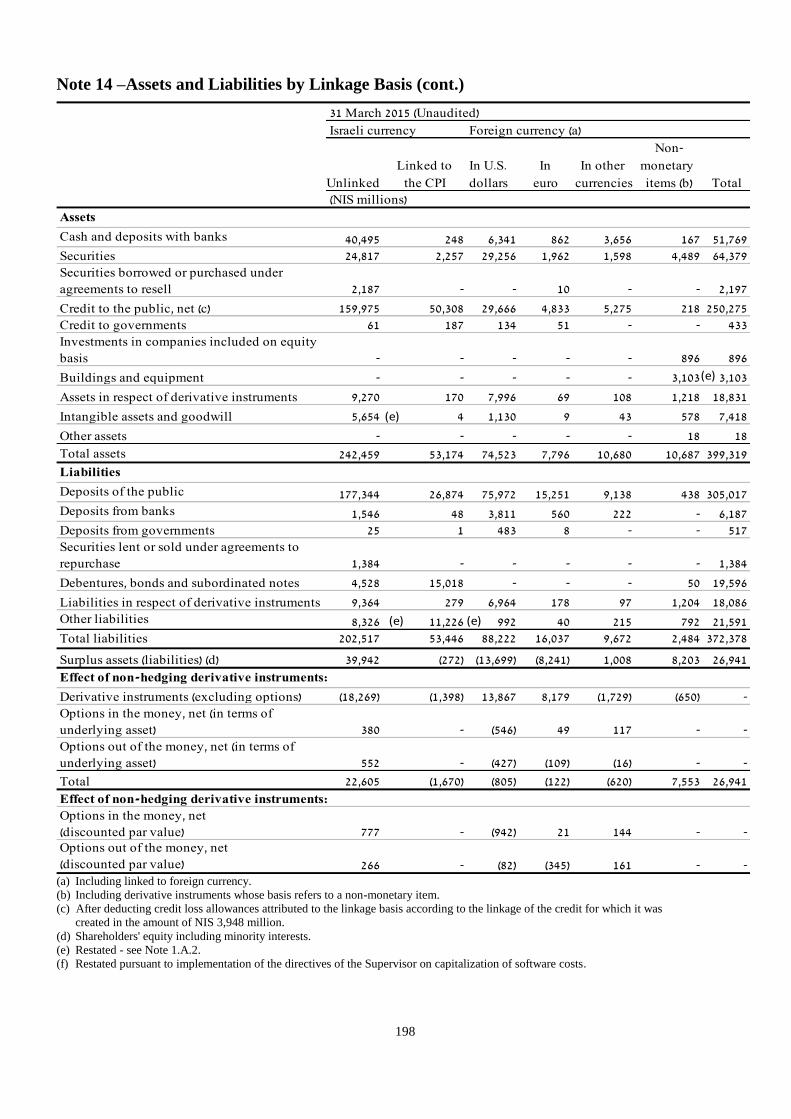
198
Note 14 –Assets and Liabilities by Linkage Basis (cont.)
31 March 2015 (Unaudited)
Israeli currency Foreign currency (a)
Non-
Linked to In U.S. In In other monetary
Unlinked the CPI dollars euro currencies items (b) Total
(NIS millions)
Assets
Cash and deposits with banks 40,495 248 6,341 862 3,656 167 51,769
Securities 24,817 2,257 29,256 1,962 1,598 4,489 64,379
Securities borrowed or purchased under
agreements to resell 2,187 - - 10 - - 2,197
Credit to the public, net (c) 159,975 50,308 29,666 4,833 5,275 218 250,275
Credit to governments 61 187 134 51 - - 433
Investments in companies included on equity
basis - - - - - 896 896
Buildings and equipment - - - - - 3,103 3,103
Assets in respect of derivative instruments 9,270 170 7,996 69 108 1,218 18,831
Intangible assets and goodwill 5,654 4 1,130 9 43 578 7,418
Other assets - - - - - 18 18
Total assets 242,459 53,174 74,523 7,796 10,680 10,687 399,319
Liabilities
Deposits of the public 177,344 26,874 75,972 15,251 9,138 438 305,017
Deposits from banks 1,546 48 3,811 560 222 - 6,187
Deposits from governments 25 1 483 8 - - 517
Securities lent or sold under agreements to
repurchase 1,384 - - - - - 1,384
Debentures, bonds and subordinated notes 4,528 15,018 - - - 50 19,596
Liabilities in respect of derivative instruments 9,364 279 6,964 178 97 1,204 18,086
Other liabilities 8,326 11,226 992 40 215 792 21,591
Total liabilities 202,517 53,446 88,222 16,037 9,672 2,484 372,378
Surplus assets (liabilities) (d) 39,942 (272) (13,699) (8,241) 1,008 8,203 26,941
Effect of non-hedging derivative instruments:
Derivative instruments (excluding options) (18,269) (1,398) 13,867 8,179 (1,729) (650) -
Options in the money, net (in terms of
underlying asset) 380 - (546) 49 117 - -
Options out of the money, net (in terms of
underlying asset) 552 - (427) (109) (16) - -
Total 22,605 (1,670) (805) (122) (620) 7,553 26,941
Effect of non-hedging derivative instruments:
Options in the money, net
(discounted par value) 777 - (942) 21 144 - -Options out of the money, net
(discounted par value) 266 - (82) (345) 161 - -
(e)
(e)
(e)
(e)
(a) Including linked to foreign currency. (b) Including derivative instruments whose basis refers to a non-monetary item.
(c) After deducting credit loss allowances attributed to the linkage basis according to the linkage of the credit for which it was
created in the amount of NIS 3,948 million.
(d) Shareholders' equity including minority interests.
(e) Restated - see Note 1.A.2.
(f) Restated pursuant to implementation of the directives of the Supervisor on capitalization of software costs.

199
Note 14 –Assets and Liabilities by Linkage Basis (cont.)
31 December 2015 (Audited)
Israeli currency Foreign currency (a)
Non-
Linked to In U.S. In In other monetary
Unlinked the CPI dollars euro currencies items (b) Total
(NIS millions)
Assets
Cash and deposits with banks 50,912 246 5,951 763 2,407 176 60,455
Securities 32,331 1,933 28,228 2,023 1,640 3,320 69,475
Securities borrowed or purchased under
agreements to resell 1,764 - - - - - 1,764
Credit to the public, net (c) 172,545 49,178 28,768 4,809 5,849 250 261,399
Credit to governments 67 195 130 61 - - 453
Investments in companies included on equity
basis - - - - - 924 924
Buildings and equipment - - - - - 3,095 3,095
Assets in respect of derivative instruments 6,402 115 3,466 308 243 716 11,250
Intangible assets and goodwill 6,138 5 896 6 44 577 7,666
Other assets - - - - - 18 18
Total assets 270,159 51,672 67,439 7,970 10,183 9,076 416,499
Liabilities
Deposits of the public 195,425 25,583 84,646 13,709 8,866 464 328,693
Deposits from banks 1,886 72 1,470 385 46 - 3,859
Deposits from governments 39 1 703 7 - - 750
Securities lent or sold under agreements to
repurchase 938 - - - - - 938
Debentures, bonds and subordinated notes 5,704 15,604 - - - - 21,308
Liabilities in respect of derivative instruments 6,356 222 3,266 305 247 702 11,098
Other liabilities 9,170 9,515 964 51 215 831 20,746
Total liabilities 219,518 50,997 91,049 14,457 9,374 1,997 387,392
Surplus assets (liabilities) (d) 50,641 675 (23,610) (6,487) 809 7,079 29,107
Effect of non-hedging derivative instruments:
Derivative instruments (excluding options) (26,357) (1,308) 23,871 5,617 (1,427) (396) -
Options in the money, net (in terms of
underlying asset) 616 - (654) 102 (64) - -
Options out of the money, net (in terms of
underlying asset) 533 - (483) (9) (41) - -
Total 25,433 (633) (876) (777) (723) 6,683 29,107
Effect of non-hedging derivative instruments:
Options in the money, net
(discounted par value) 1,425 - (1,257) (100) (68) - -Options out of the money, net
(discounted par value) 1,305 - (1,112) (416) 223 - -
(f)
(f)
(f)
(f)
(a) Including linked to foreign currency. (b) Including derivative instruments whose basis refers to a non-monetary item.
(c) After deducting credit loss allowances attributed to the linkage basis according to the linkage of the credit for which it was
created in the amount of NIS 3,671 million.
(d) Shareholders' equity including minority interests.
200
Note 15A – Balances and fair value assessments of financial instruments
A. General
This note includes information regarding the determination of the fair value of financial instruments
according to directives of the Supervisor of Banks. Most of the financial instruments of the Bank do not
have a "market value" because they do not have an active trading market. Their fair value is therefore
determined on the basis of the present value of future cash flows, discounted at an interest rate that reflects
the interest at which the Bank would have effected a similar transaction on the reporting date. The
estimated fair value is calculated by means of estimating future cash flows and a subjective determination
of the discount rate. Therefore, in respect of most financial instruments, the reported fair value does not
necessarily indicate the realizable value of the financial instrument on the reporting date. The estimate of
fair value is made on the basis of interest rates in effect on the reporting date and does not take into account
interest rate fluctuations. Under different interest rates the fair value calculated may be significantly
different. This is true especially in respect of financial instruments with interest at fixed rates or those
which are non-interest bearing. Furthermore, the determination of fair value does not take into account
commissions that will be received or paid over the course of business. In addition, the difference between
the balance sheet value and the fair value may not be realized because in most cases the Bank may hold the
financial instrument until maturity. Therefore, it should be noted that the data included in this note do not
purport to reflect the value of the Bank as a going concern. Furthermore, because of the wide range of
valuation techniques and estimates that can be applied in the calculation of fair value, caution must be exercised
when comparing fair values of different banks.
B. Principal methods and assumptions used in estimating the fair value of financial instruments
Financial assets:
Credit to the public - the fair value of credit to the public is determined on the basis of the present value of
future cash flows discounted at an appropriate discount rate. The balance of credit was classified into a
number of categories according to the operating segment and the credit rating of the borrowers. Future cash
flows (principal and interest) were calculated in respect of each category according to the various linkage
bases. These receipts were discounted at an interest rate that reflects the rate of risk and average margin
inherent in that category of credit and the term of the credit.
The interest rate is usually determined according to the interest rate used in similar transactions on the
reporting date.
The fair value of debit balances in current accounts was valued at book value.
The fair value of impaired debts was calculated using interest rates that reflect the inherent high credit risk.
In any case, these interest rates reflect the highest rates of interest used by the Group in transactions on the
reporting date in the same segment.
The fair value of current account balances classified as impaired loans was calculated in accordance with
an estimate of their average duration and based on maximum interest rates in the Bank.
The future cash flows in respect of impaired debts were calculated after deducting the effect of accounting
write-offs and allowances for credit losses.

201
Note 15A – Balances and fair value assessments of financial instruments (cont.)
Deposits with banks and credit to governments - by the discounted future cash flows method, at interest
rates at which similar transactions were executed on the reporting date.
Securities – Quoted securities at their market value. Unquoted securities, shares at cost, and debentures
according to a model which takes into account the present value of future cash flows discounted at the
appropriate discount rate, and which also takes into account the probability of default and market value.
Financial liabilities:
Deposits of the public - The balance of the deposits is classified according to a number of categories
according to operating segments, adjustment basis and the terms of deposit. Future cash flows (principal
and interest) were calculated in respect of each category. These payments were discounted at an interest
rate that reflects the average interest rate the Group pays on similar deposits in the same category for the
period remaining until maturity. The balance sheet amount of current accounts and deposits without a
repayment date is considered to be an estimate of their fair value.
Deposits from banks and deposits from governments - The fair value estimated by the discounted future
cash flows method, at the rate of interest at which the Group raises similar deposits on the reporting date.
Debentures, bonds and subordinated notes - At their fair value or by the discounted future cash flows
method, at the rate of interest at which the Group raises similar deposits or at the rate at which it issues
similar bonds on the reporting date.
Other financial assets and liabilities:
Derivative instruments:
Derivative instruments that have an active market were valued at market value and, when there are a
number of markets in which the instrument is traded, the value is determined according to the most active
market.
Derivative instruments that are not traded on an active market were valued on the basis of models the Bank
uses in its current operations as at the reporting date, which take into account the risks inherent in the
financial instrument.
Off-balance sheet financial instruments in which the balance reflects a credit risk:
The balance sheet value approximates the fair value, since the terms of transactions in the balance sheet do
not differ materially from the terms of similar transactions on the reporting date.

202
Note 15A – Balances and fair value assessments of financial instruments (cont.)
31 March 2016 (Unaudited)
Book
value Level 1 (a) Level 2 (a) Level 3 (a) Total
(NIS millions)
Financial assets
Cash and deposits with banks 55,648 45,991 8,016 1,686 55,693
Securities (b) 78,727 56,155 20,253 2,319 78,727
Securities borrowed or purchased
under agreements to resell 1,621 1,621 - - 1,621
Credit to the public, net 264,133 2,537 72,163 189,740 264,440
Credit to governments 412 - 15 409 424
Assets in respect of derivative
instruments 13,150 1,141 10,435 1,574 13,150
Other financial assets 1,473 398 - 1,076 1,474
Total financial assets 415,164 107,843 110,882 196,804 415,529
Financial liabilities
Deposits of the public 330,354 3,652 207,509 121,462 332,623
Deposits from banks 4,441 - 4,266 41 4,307
Deposits from governments 808 - 747 87 834
Securities lent or sold under
agreements to repurchase 845 845 - - 845
Debentures, notes and subordinated
notes 24,810 18,941 377 5,742 25,060
Liabilities in respect of derivative
instruments 13,996 1,142 12,612 242 13,996
Other financial liabilities 7,385 1,173 5,120 1,093 7,386
Total financial liabilitiies 382,639 25,753 230,631 128,667 385,051
Off-balance sheet financial instrumentsTransactions whose balance
represents credit risk 337 - - 337 337
In addition, liabilities in respect of
employee rights, gross - pension and
severance pay (d) 16,544 - 182 16,362 16,544
Fair value
(c)
(c)
(a) Level 1 - fair value measurements using prices quoted in an active market.
Level 2 - fair value measurements using other significant observable data.
Level 3 - fair value measurements using significant unobservable data.
(b) For further details on the book value and fair value of securities, see Note 5 - Securities.
(c) Of which: assets and liabilities in the amounts of NIS 129,714 million and NIS 129,736 million, respectively, whose
book value is the same as the fair value (instruments shown in the balance sheet at fair value) or is an approximation of
fair value (instruments for an original term of up to 3 months for which the book value is used as an approximation of
fair value). For further details of instruments measured for fair value on a recurring basis and on a non-recurring basis,
see Notes 15B - 15D.
(d) The liability is shown gross, and does not take the plan assets managed in its respect into account.

203
Note 15A – Balances and fair value assessments of financial instruments (cont.)
31 March 2015 (Unaudited)
Book
value Level 1 (a) Level 2 (a) Level 3 (a) Total
(NIS millions)
Financial assets
Cash and deposits with banks 51,769 44,023 6,410 1,379 51,812
Securities (b) 64,379 43,797 17,208 3,374 64,379
Securities borrowed or purchased
under agreements to resell 2,197 2,197 - - 2,197
Credit to the public, net 250,275 2,193 65,805 182,415 250,413
Credit to governments 433 - 12 433 445
Assets in respect of derivative
instruments 18,831 751 15,163 2,917 18,831
Other financial assets 1,321 567 509 245 1,321
Total financial assets 389,205 93,528 105,107 190,763 389,398
Financial liabilities
Deposits of the public 305,017 2,338 181,689 123,344 307,371
Deposits from banks 6,187 - 5,992 148 6,140
Deposits from governments 517 - 443 104 547
Securities lent or sold under
agreements to repurchase 1,384 1,384 - - 1,384
Debentures, notes and subordinated
notes 19,596 15,677 358 6,053 22,088
Liabilities in respect of derivative
instruments 18,086 752 17,038 296 18,086
Other financial liabilities 7,513 1,294 5,021 1,187 7,502
Total financial liabilitiies 358,300 21,445 210,541 131,132 363,118
Off-balance sheet financial instrumentsTransactions whose balance
represents credit risk 324 - - 324 324
Fair value
(d)
(c)
(c)
(d) (d)
(a) Level 1 - fair value measurements using prices quoted in an active market.
Level 2 - fair value measurements using other significant observable data.
Level 3 - fair value measurements using significant unobservable data.
(b) For further details on the book value and fair value of securities, see Note 5 - Securities.
(c) Of which: assets and liabilities in the amounts of NIS 121,332 million and NIS 150,052 million, respectively, whose
book value is the same as the fair value (instruments shown in the balance sheet at fair value) or is an approximation of
fair value (instruments for an original term of up to 3 months for which the book value is used as an approximation of
fair value). For further details of instruments measured for fair value on a recurring basis and on a non-recurring basis,
see Notes 15B – 15D.
(d) Reclassified.
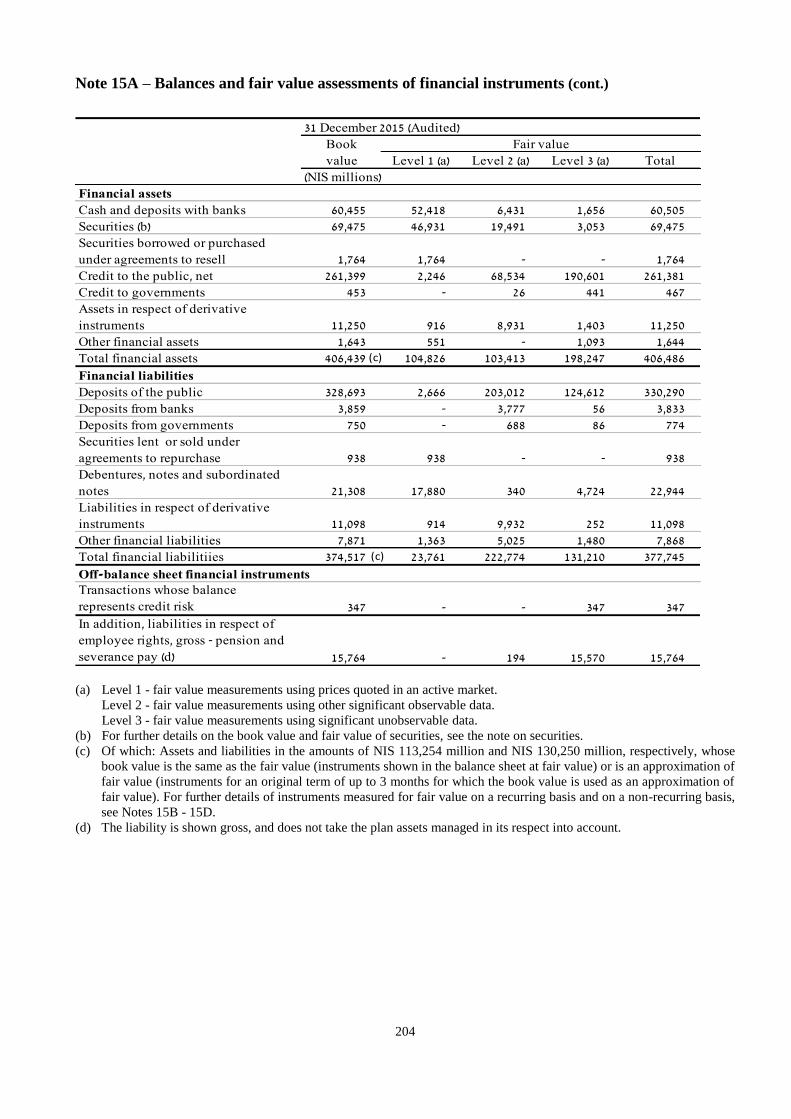
204
Note 15A – Balances and fair value assessments of financial instruments (cont.)
31 December 2015 (Audited)
Book
value Level 1 (a) Level 2 (a) Level 3 (a) Total
(NIS millions)
Financial assets
Cash and deposits with banks 60,455 52,418 6,431 1,656 60,505
Securities (b) 69,475 46,931 19,491 3,053 69,475
Securities borrowed or purchased
under agreements to resell 1,764 1,764 - - 1,764
Credit to the public, net 261,399 2,246 68,534 190,601 261,381
Credit to governments 453 - 26 441 467
Assets in respect of derivative
instruments 11,250 916 8,931 1,403 11,250
Other financial assets 1,643 551 - 1,093 1,644
Total financial assets 406,439 104,826 103,413 198,247 406,486
Financial liabilities
Deposits of the public 328,693 2,666 203,012 124,612 330,290
Deposits from banks 3,859 - 3,777 56 3,833
Deposits from governments 750 - 688 86 774
Securities lent or sold under
agreements to repurchase 938 938 - - 938
Debentures, notes and subordinated
notes 21,308 17,880 340 4,724 22,944
Liabilities in respect of derivative
instruments 11,098 914 9,932 252 11,098
Other financial liabilities 7,871 1,363 5,025 1,480 7,868
Total financial liabilitiies 374,517 23,761 222,774 131,210 377,745
Off-balance sheet financial instrumentsTransactions whose balance
represents credit risk 347 - - 347 347
In addition, liabilities in respect of
employee rights, gross - pension and
severance pay (d) 15,764 - 194 15,570 15,764
Fair value
(c)
(c)
(a) Level 1 - fair value measurements using prices quoted in an active market.
Level 2 - fair value measurements using other significant observable data.
Level 3 - fair value measurements using significant unobservable data.
(b) For further details on the book value and fair value of securities, see the note on securities.
(c) Of which: Assets and liabilities in the amounts of NIS 113,254 million and NIS 130,250 million, respectively, whose
book value is the same as the fair value (instruments shown in the balance sheet at fair value) or is an approximation of
fair value (instruments for an original term of up to 3 months for which the book value is used as an approximation of
fair value). For further details of instruments measured for fair value on a recurring basis and on a non-recurring basis,
see Notes 15B - 15D.
(d) The liability is shown gross, and does not take the plan assets managed in its respect into account.
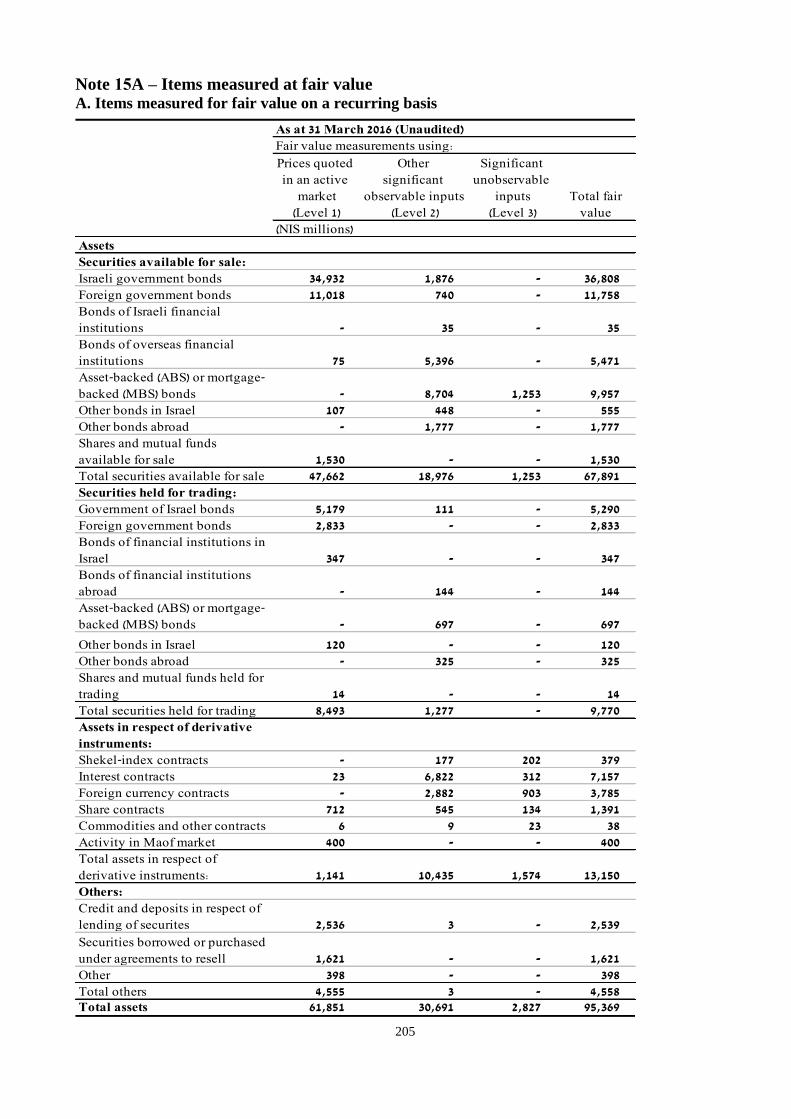
205
Note 51A – Items measured at fair value A. Items measured for fair value on a recurring basis
As at 31 March 2016 (Unaudited)
Prices quoted
in an active
market
Other
significant
observable inputs
Significant
unobservable
inputs Total fair
(Level 1) (Level 2) (Level 3) value
(NIS millions)
Assets
Securities available for sale:
Israeli government bonds 34,932 1,876 - 36,808
Foreign government bonds 11,018 740 - 11,758
Bonds of Israeli financial
institutions - 35 - 35
Bonds of overseas financial
institutions 75 5,396 - 5,471
Asset-backed (ABS) or mortgage-
backed (MBS) bonds - 8,704 1,253 9,957
Other bonds in Israel 107 448 - 555
Other bonds abroad - 1,777 - 1,777
Shares and mutual funds
available for sale 1,530 - - 1,530
Total securities available for sale 47,662 18,976 1,253 67,891
Securities held for trading:
Government of Israel bonds 5,179 111 - 5,290
Foreign government bonds 2,833 - - 2,833
Bonds of financial institutions in
Israel 347 - - 347
Bonds of financial institutions
abroad - 144 - 144
Asset-backed (ABS) or mortgage-
backed (MBS) bonds - 697 - 697
Other bonds in Israel 120 - - 120
Other bonds abroad - 325 - 325
Shares and mutual funds held for
trading 14 - - 14
Total securities held for trading 8,493 1,277 - 9,770
Assets in respect of derivative
instruments:
Shekel-index contracts - 177 202 379
Interest contracts 23 6,822 312 7,157
Foreign currency contracts - 2,882 903 3,785
Share contracts 712 545 134 1,391
Commodities and other contracts 6 9 23 38
Activity in Maof market 400 - - 400
Total assets in respect of
derivative instruments: 1,141 10,435 1,574 13,150
Others:
Credit and deposits in respect of
lending of securites 2,536 3 - 2,539
Securities borrowed or purchased
under agreements to resell 1,621 - - 1,621
Other 398 - - 398
Total others 4,555 3 - 4,558Total assets 61,851 30,691 2,827 95,369
Fair value measurements using:

206
Note 51A – Items measured at fair value (cont.) A. Items measured at fair value on a recurring basis (cont.)
As at 31 March 2016 (Unaudited)
Prices quoted
in an active
market
Other
significant
observable inputs
Significant
unobservable
inputs Total fair
(Level 1) (Level 2) (Level 3) value
(NIS millions)
Fair value measurements using:
Liabilities
Liabilities in respect of
derivative instruments:
Shekel-index contracts - 378 61 439
Interest contracts 30 7,085 - 7,115
Foreign currency contracts - 4,475 181 4,656
Share contracts 712 642 - 1,354
Commodities and other contracts 6 32 - 38
Activity in Maof market 394 - - 394
Total liabilities in respect of
derivative instruments 1,142 12,612 242 13,996
Others:
Deposits in respect of lending of
securites 3,652 24 17 3,693
Securities lent or sold under
agreements to repurchase 845 - - 845
Others 1,173 - - 1,173
Total others 5,670 24 17 5,711Total liabilities 6,812 12,636 259 19,707

207
Note 51A – Items measured at fair value (cont.) A. Items measured at fair value on a recurring basis (cont.)
As at 31 March 2015 (Unaudited)
Prices quoted
in an active
market
Other
significant
observable inputs
Significant
unobservable
inputs Total fair
(Level 1) (Level 2) (Level 3) value
(NIS millions)
Assets
Securities available for sale:
Israeli government bonds 18,311 1,601 - 19,912
Foreign government bonds 11,753 418 - 12,171
Bonds of Israeli financial
institutions - 48 - 48
Bonds of overseas financial
institutions 94 6,525 - 6,619
Asset-backed (ABS) or mortgage-
backed (MBS) bonds - 5,420 1,968 7,388
Other bonds in Israel 577 258 - 835
Other bonds abroad 331 1,143 - 1,474
Shares and mutual funds
available for sale 2,369 - - 2,369
Total securities available for sale 33,435 15,413 1,968 50,816
Securities held for trading:
Government of Israel bonds 7,725 323 - 8,048
Foreign government bonds 1,400 7 - 1,407
Bonds of financial institutions in
Israel 244 - - 244
Bonds of financial institutions
abroad - 234 - 234
Asset-backed (ABS) or mortgage-
backed (MBS) bonds - 980 - 980
Other bonds in Israel 279 - - 279
Other bonds abroad - 251 - 251
Shares and mutual funds held for
trading 714 - - 714
Total securities held for trading 10,362 1,795 - 12,157
Assets in respect of derivative
instruments:
Shekel-index contracts - 77 229 306
Interest contracts 8 9,083 489 9,580
Foreign currency contracts 1 5,412 1,999 7,412
Share contracts 373 588 153 1,114
Commodities and other contracts 8 3 47 58
Activity in Maof market 361 - - 361
Total assets in respect of
derivative instruments 751 15,163 2,917 18,831
Others:
Credit and deposits in respect of
lending of securites 2,192 3 - 2,195
Securities borrowed or purchased
under agreements to resell 2,197 - - 2,197
Other 559 - - 559
Total others 4,948 3 - 4,951Total assets 49,496 32,374 4,885 86,755
Fair value measurements using:

208
Note 51A – Items measured at fair value (cont.) A. Items measured at fair value on a recurring basis (cont.)
As at 31 March 2015 (Unaudited)
Prices quoted
in an active
market
Other
significant
observable inputs
Significant
unobservable
inputs Total fair
(Level 1) (Level 2) (Level 3) value
(NIS millions)
Fair value measurements using:
Liabilities
Liabilities in respect of
derivative instruments:
Shekel-index contracts - 278 49 327
Interest contracts 8 9,296 1 9,305
Foreign currency contracts 1 6,646 246 6,893
Share contracts 373 769 - 1,142
Commodities and other contracts 8 49 - 57
Activity in Maof market 362 - - 362
Total liabilities in respect of
derivative instruments 752 17,038 296 18,086
Others:
Deposits in respect of lending of
securites 2,339 27 15 2,381
Securities lent or sold under
agreements to repurchase 1,384 - - 1,384
Others 1,294 - - 1,294
Total others 5,017 27 15 5,059Total liabilities 5,769 17,065 311 23,145
(a)
(a) Restated.
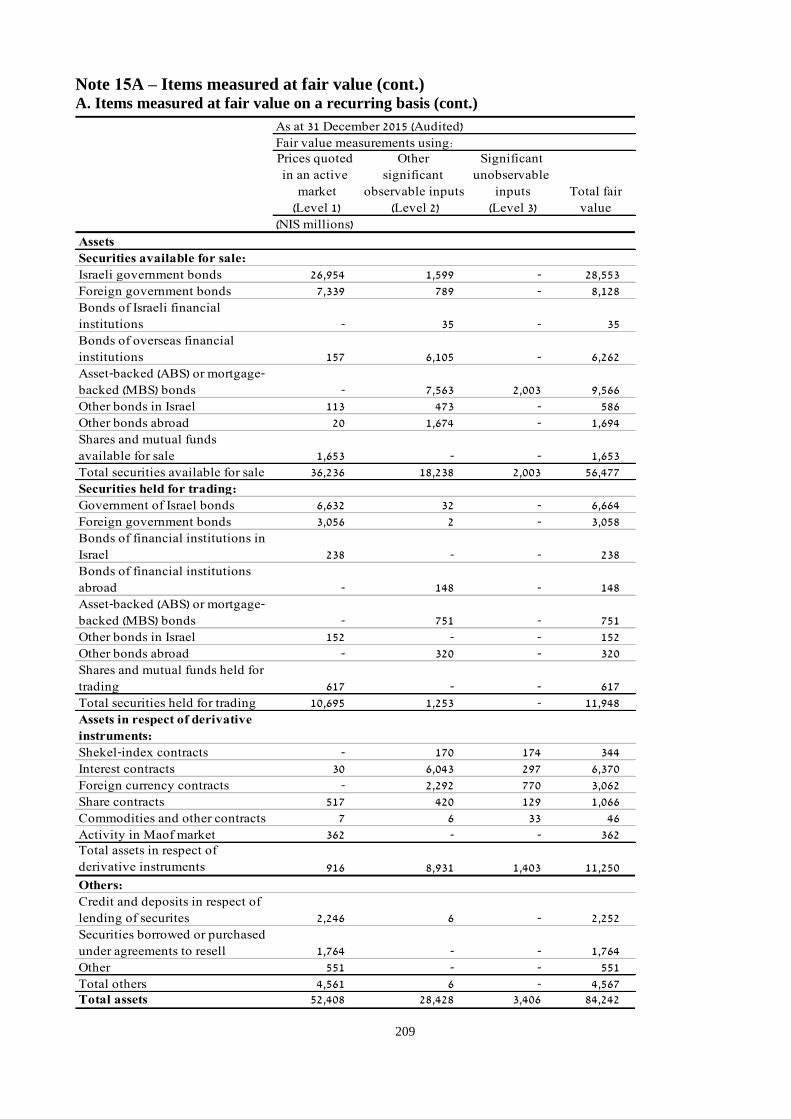
209
Note 51A – Items measured at fair value (cont.) A. Items measured at fair value on a recurring basis (cont.)
As at 31 December 2015 (Audited)
Prices quoted
in an active
market
Other
significant
observable inputs
Significant
unobservable
inputs Total fair
(Level 1) (Level 2) (Level 3) value
(NIS millions)
Assets
Securities available for sale:
Israeli government bonds 26,954 1,599 - 28,553
Foreign government bonds 7,339 789 - 8,128
Bonds of Israeli financial
institutions - 35 - 35
Bonds of overseas financial
institutions 157 6,105 - 6,262
Asset-backed (ABS) or mortgage-
backed (MBS) bonds - 7,563 2,003 9,566
Other bonds in Israel 113 473 - 586
Other bonds abroad 20 1,674 - 1,694
Shares and mutual funds
available for sale 1,653 - - 1,653
Total securities available for sale 36,236 18,238 2,003 56,477
Securities held for trading:
Government of Israel bonds 6,632 32 - 6,664
Foreign government bonds 3,056 2 - 3,058
Bonds of financial institutions in
Israel 238 - - 238
Bonds of financial institutions
abroad - 148 - 148
Asset-backed (ABS) or mortgage-
backed (MBS) bonds - 751 - 751
Other bonds in Israel 152 - - 152
Other bonds abroad - 320 - 320
Shares and mutual funds held for
trading 617 - - 617
Total securities held for trading 10,695 1,253 - 11,948
Assets in respect of derivative
instruments:
Shekel-index contracts - 170 174 344
Interest contracts 30 6,043 297 6,370
Foreign currency contracts - 2,292 770 3,062
Share contracts 517 420 129 1,066
Commodities and other contracts 7 6 33 46
Activity in Maof market 362 - - 362Total assets in respect of
derivative instruments 916 8,931 1,403 11,250
Others:
Credit and deposits in respect of
lending of securites 2,246 6 - 2,252
Securities borrowed or purchased
under agreements to resell 1,764 - - 1,764
Other 551 - - 551
Total others 4,561 6 - 4,567Total assets 52,408 28,428 3,406 84,242
Fair value measurements using:
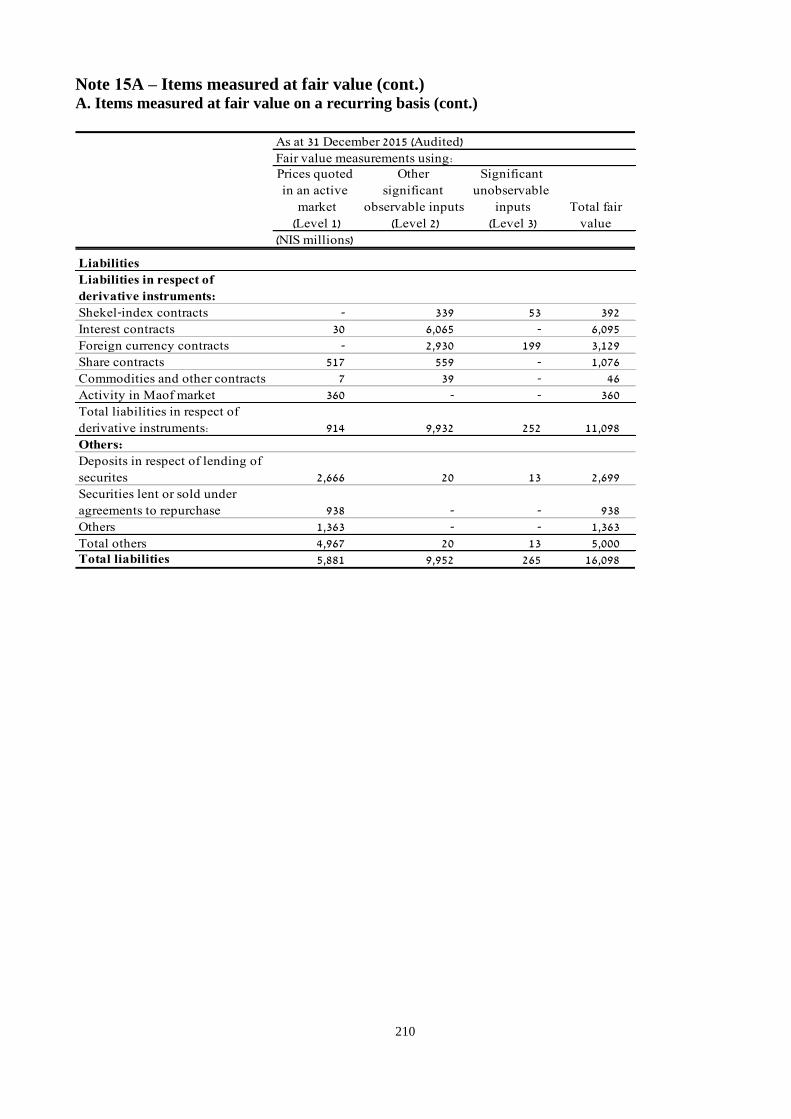
210
Note 51A – Items measured at fair value (cont.) A. Items measured at fair value on a recurring basis (cont.)
As at 31 December 2015 (Audited)
Prices quoted
in an active
market
Other
significant
observable inputs
Significant
unobservable
inputs Total fair
(Level 1) (Level 2) (Level 3) value
(NIS millions)
Fair value measurements using:
Liabilities
Liabilities in respect of
derivative instruments:
Shekel-index contracts - 339 53 392
Interest contracts 30 6,065 - 6,095
Foreign currency contracts - 2,930 199 3,129
Share contracts 517 559 - 1,076
Commodities and other contracts 7 39 - 46
Activity in Maof market 360 - - 360
Total liabilities in respect of
derivative instruments: 914 9,932 252 11,098
Others:
Deposits in respect of lending of
securites 2,666 20 13 2,699
Securities lent or sold under
agreements to repurchase 938 - - 938
Others 1,363 - - 1,363
Total others 4,967 20 13 5,000Total liabilities 5,881 9,952 265 16,098
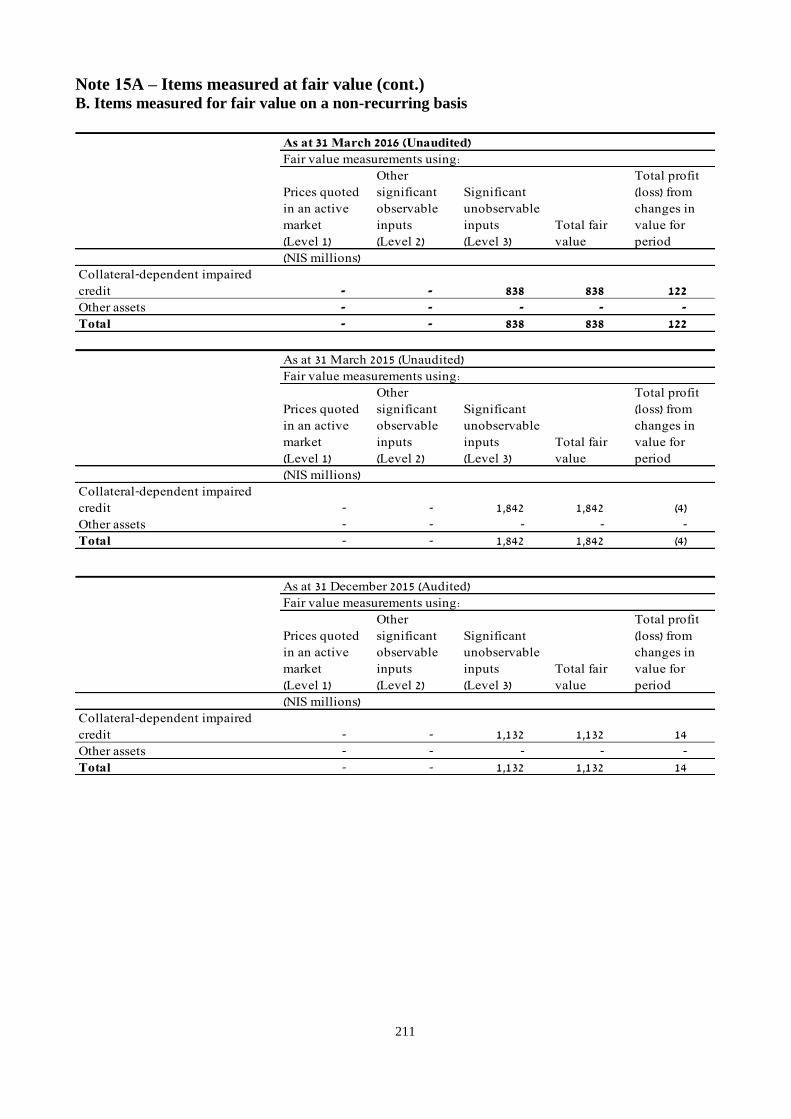
211
Note 51A – Items measured at fair value (cont.) B. Items measured for fair value on a non-recurring basis
As at 31 March 2016 (Unaudited)
Prices quoted
in an active
market
(Level 1)
Other
significant
observable
inputs
(Level 2)
Significant
unobservable
inputs
(Level 3)
Total fair
value
Total profit
(loss) from
changes in
value for
period
(NIS millions)
Collateral-dependent impaired
credit - - 838 838 122
Other assets - - - - -
Total - - 838 838 122
As at 31 March 2015 (Unaudited)
Prices quoted
in an active
market
(Level 1)
Other
significant
observable
inputs
(Level 2)
Significant
unobservable
inputs
(Level 3)
Total fair
value
Total profit
(loss) from
changes in
value for
period
(NIS millions)
Collateral-dependent impaired
credit - - 1,842 1,842 (4)
Other assets - - - - -
Total - - 1,842 1,842 (4)
As at 31 December 2015 (Audited)
Prices quoted
in an active
market
(Level 1)
Other
significant
observable
inputs
(Level 2)
Significant
unobservable
inputs
(Level 3)
Total fair
value
Total profit
(loss) from
changes in
value for
period
(NIS millions)
Collateral-dependent impaired
credit - - 1,132 1,132 14
Other assets - - - - -
Total - - 1,132 1,132 14
Fair value measurements using:
Fair value measurements using:
Fair value measurements using:

212
Note 15C – Changes in items measured for fair value on a recurring basis included in Level 3
For the three months ended 31 March 2016 (Unaudited)
Fair value at
beginning
of the year
In profit and
loss
statement (a)
In other
comprehensive
income (b)
Acqui-
sitions
and issues Sales
Extinguish-
ments
Adjustments
from
translation
of financial
statements
Transfers
to Level 3
Transfers from
Level 3
Fair value
at 31
March
2016
(losses) in
respect of
instruments
held at 31
March 2016
(NIS millions)
Assets
Securities available for sale:
Asset-backed (ABS) or mortgage-
backed (MBS) bonds 2,003 (735) (4) - - (11) - - - 1,253 (4)
Total bonds available for sale 2,003 (735) (4) - - (11) - - - 1,253 (4)
Total shares available for sale - - - - - - - - - - -
Total bonds for trading - - - - - - - - - - -
Total shares for trading - - - - - - - - - - -
Assets in respect of derivative
instruments:
Shekel-index contracts 174 9 - - - - - 19 - 202 (4)
Interest contracts 297 58 - - - (43) - - - 312 10
Foreign currency contracts 770 (98) - 231 - - - - - 903 421
Share contracts 129 5 - - - - - - - 134 37
Commodities and other contracts 33 (10) - - - - - - - 23 5
Activity in the Maof market - - - - - - - - - - -
Total assets in respect of derivative
instruments 1,403 (36) - 231 - (43) - 19 - 1,574 469
Total others - - - - - - - - - - -
Total assets 3,406 (771) (4) 231 - (54) - 19 - 2,827 465
Liabilities
Liabilities in respect of derivative
instruments:
Shekel-index contracts 53 (4) - - - - - 12 - 61 17
Foreign currency contracts 199 (18) - - - - - - - 181 (39)
Share contracts - - - - - - - - - - -
Total liabilities in respect of
derivative instruments 252 (22) - - - - - 12 - 242 (22)
Total others 13 4 - - - - - - - 17 17
Total liabilities 265 (18) - - - - - 12 - 259 (5)
Unrealized
profits
Realized and unrealized
profits (losses), net, included
Changes in items measured for fair value included in Level 3
(a) Realized profits (losses) were included in the statement of profit and loss under non-interest financing income.
(b) Unrealized profits (losses) were included in the statement of changes in equity under accumulated other comprehensive income (loss).
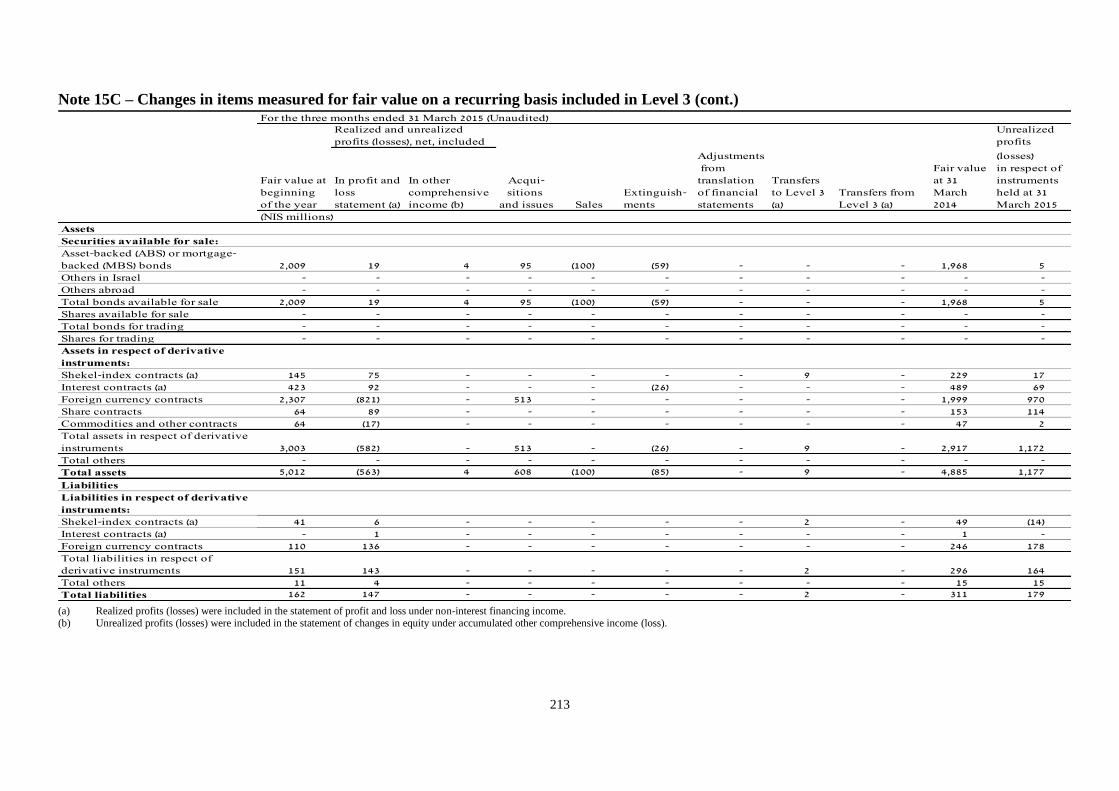
213
Note 15C – Changes in items measured for fair value on a recurring basis included in Level 3 (cont.) For the three months ended 31 March 2015 (Unaudited)
Unrealized
profits
Fair value at
beginning
of the year
In profit and
loss
statement (a)
In other
comprehensive
income (b)
Acqui-
sitions
and issues Sales
Extinguish-
ments
Adjustments
from
translation
of financial
statements
Transfers
to Level 3
(a)
Transfers from
Level 3 (a)
Fair value
at 31
March
2014
(losses)
in respect of
instruments
held at 31
March 2015
(NIS millions)
Assets
Securities available for sale:
Asset-backed (ABS) or mortgage-
backed (MBS) bonds 2,009 19 4 95 (100) (59) - - - 1,968 5
Others in Israel - - - - - - - - - - -
Others abroad - - - - - - - - - - -
Total bonds available for sale 2,009 19 4 95 (100) (59) - - - 1,968 5
Shares available for sale - - - - - - - - - - -
Total bonds for trading - - - - - - - - - - -
Shares for trading - - - - - - - - - - -
Assets in respect of derivative
instruments:
Shekel-index contracts (a) 145 75 - - - - - 9 - 229 17
Interest contracts (a) 423 92 - - - (26) - - - 489 69
Foreign currency contracts 2,307 (821) - 513 - - - - - 1,999 970
Share contracts 64 89 - - - - - - - 153 114
Commodities and other contracts 64 (17) - - - - - - - 47 2
Total assets in respect of derivative
instruments 3,003 (582) - 513 - (26) - 9 - 2,917 1,172
Total others - - - - - - - - - - -
Total assets 5,012 (563) 4 608 (100) (85) - 9 - 4,885 1,177
Liabilities
Liabilities in respect of derivative
instruments:
Shekel-index contracts (a) 41 6 - - - - - 2 - 49 (14)
Interest contracts (a) - 1 - - - - - - - 1 -
Foreign currency contracts 110 136 - - - - - - - 246 178
Total liabilities in respect of
derivative instruments 151 143 - - - - - 2 - 296 164
Total others 11 4 - - - - - - - 15 15
Total liabilities 162 147 - - - - - 2 - 311 179
Realized and unrealized
profits (losses), net, included
(a) Realized profits (losses) were included in the statement of profit and loss under non-interest financing income. (b) Unrealized profits (losses) were included in the statement of changes in equity under accumulated other comprehensive income (loss).
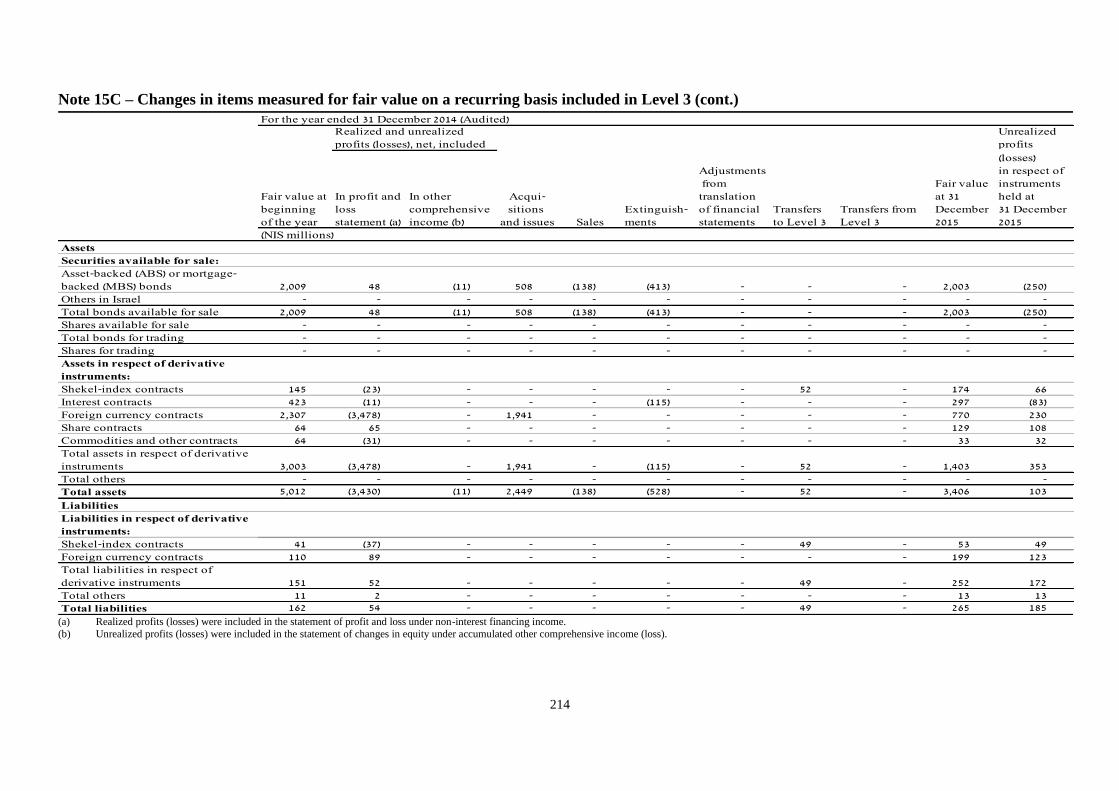
214
Note 15C – Changes in items measured for fair value on a recurring basis included in Level 3 (cont.)
For the year ended 31 December 2014 (Audited)Unrealized
profits
Fair value at
beginning
of the year
In profit and
loss
statement (a)
In other
comprehensive
income (b)
Acqui-
sitions
and issues Sales
Extinguish-
ments
Adjustments
from
translation
of financial
statements
Transfers
to Level 3
Transfers from
Level 3
Fair value
at 31
December
2015
(losses)
in respect of
instruments
held at
31 December
2015
(NIS millions)
Assets
Securities available for sale:
Asset-backed (ABS) or mortgage-
backed (MBS) bonds 2,009 48 (11) 508 (138) (413) - - - 2,003 (250)
Others in Israel - - - - - - - - - - -
Total bonds available for sale 2,009 48 (11) 508 (138) (413) - - - 2,003 (250)
Shares available for sale - - - - - - - - - - -
Total bonds for trading - - - - - - - - - - -
Shares for trading - - - - - - - - - - -
Assets in respect of derivative
instruments:
Shekel-index contracts 145 (23) - - - - - 52 - 174 66
Interest contracts 423 (11) - - - (115) - - - 297 (83)
Foreign currency contracts 2,307 (3,478) - 1,941 - - - - - 770 230
Share contracts 64 65 - - - - - - - 129 108
Commodities and other contracts 64 (31) - - - - - - - 33 32
Total assets in respect of derivative
instruments 3,003 (3,478) - 1,941 - (115) - 52 - 1,403 353
Total others - - - - - - - - - - -
Total assets 5,012 (3,430) (11) 2,449 (138) (528) - 52 - 3,406 103
Liabilities
Liabilities in respect of derivative
instruments:
Shekel-index contracts 41 (37) - - - - - 49 - 53 49
Foreign currency contracts 110 89 - - - - - - - 199 123
Total liabilities in respect of
derivative instruments 151 52 - - - - - 49 - 252 172
Total others 11 2 - - - - - - - 13 13
Total liabilities 162 54 - - - - - 49 - 265 185
Realized and unrealized
profits (losses), net, included
(a) Realized profits (losses) were included in the statement of profit and loss under non-interest financing income.
(b) Unrealized profits (losses) were included in the statement of changes in equity under accumulated other comprehensive income (loss).
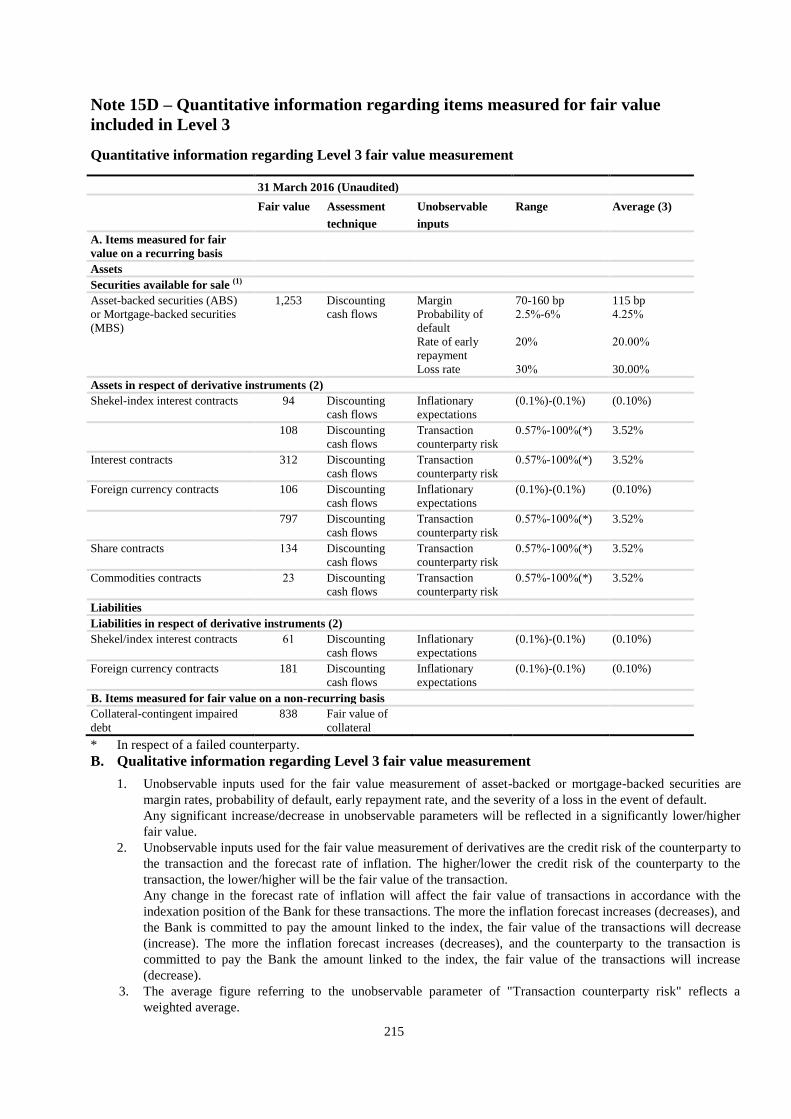
215
Note 15D – Quantitative information regarding items measured for fair value
included in Level 3
Quantitative information regarding Level 3 fair value measurement
31 March 2016 (Unaudited)
Fair value Assessment
technique
Unobservable
inputs
Range Average (3)
A. Items measured for fair
value on a recurring basis
Assets
Securities available for sale (1)
Asset-backed securities (ABS)
or Mortgage-backed securities
(MBS)
1,253 Discounting
cash flows
Margin
Probability of
default
Rate of early
repayment
Loss rate
70-160 bp
5.2%-6%
52%
02%
115 bp
4.52%
52.22%
30.00%
Assets in respect of derivative instruments (2)
Shekel-index interest contracts 94 Discounting
cash flows
Inflationary
expectations
(0.1%)-(0.1%) (0.10%)
108 Discounting
cash flows
Transaction
counterparty risk
2.25%-022%(*) 3.52%
Interest contracts 312 Discounting
cash flows
Transaction
counterparty risk
2.25%-022%(*) 3.52%
Foreign currency contracts
106 Discounting
cash flows
Inflationary
expectations
(0.1%)-(0.1%) (0.10%)
797 Discounting
cash flows
Transaction
counterparty risk
2.25%-022%(*) 3.52%
Share contracts 004 Discounting
cash flows
Transaction
counterparty risk
2.25%-022%(*) 3.52%
Commodities contracts 50 Discounting
cash flows
Transaction
counterparty risk
2.25%-022%(*) 3.52%
Liabilities
Liabilities in respect of derivative instruments (2)
Shekel/index interest contracts 60 Discounting
cash flows
Inflationary
expectations
(0.1%)-(0.1%) (0.10%)
Foreign currency contracts
181 Discounting
cash flows
Inflationary
expectations
(0.1%)-(0.1%) (0.10%)
B. Items measured for fair value on a non-recurring basis
Collateral-contingent impaired
debt
838 Fair value of
collateral
* In respect of a failed counterparty. B. Qualitative information regarding Level 3 fair value measurement
1. Unobservable inputs used for the fair value measurement of asset-backed or mortgage-backed securities are
margin rates, probability of default, early repayment rate, and the severity of a loss in the event of default.
Any significant increase/decrease in unobservable parameters will be reflected in a significantly lower/higher
fair value.
2. Unobservable inputs used for the fair value measurement of derivatives are the credit risk of the counterparty to
the transaction and the forecast rate of inflation. The higher/lower the credit risk of the counterparty to the
transaction, the lower/higher will be the fair value of the transaction.
Any change in the forecast rate of inflation will affect the fair value of transactions in accordance with the
indexation position of the Bank for these transactions. The more the inflation forecast increases (decreases), and
the Bank is committed to pay the amount linked to the index, the fair value of the transactions will decrease
(increase). The more the inflation forecast increases (decreases), and the counterparty to the transaction is
committed to pay the Bank the amount linked to the index, the fair value of the transactions will increase
(decrease).
3. The average figure referring to the unobservable parameter of "Transaction counterparty risk" reflects a
weighted average.
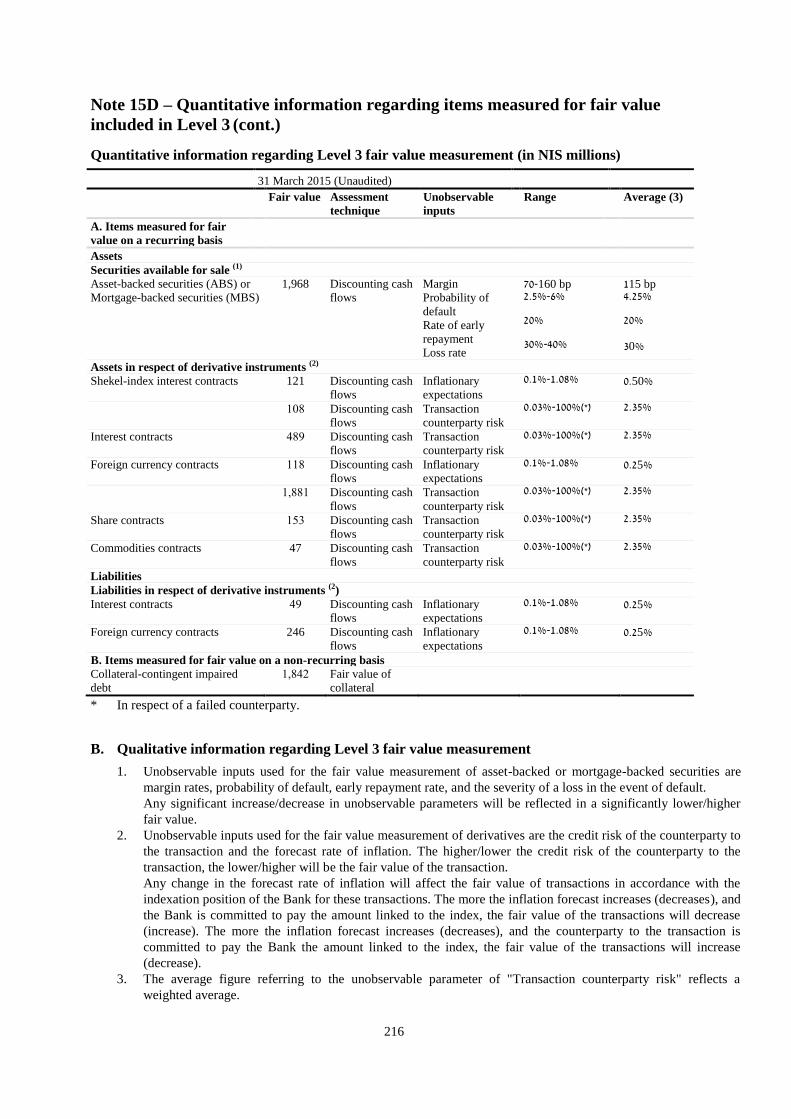
216
Note 15D – Quantitative information regarding items measured for fair value
included in Level 3 (cont.)
Quantitative information regarding Level 3 fair value measurement (in NIS millions)
31 March 2015 (Unaudited)
Fair value Assessment
technique
Unobservable
inputs
Range Average (3)
A. Items measured for fair
value on a recurring basis
Assets
Securities available for sale (1)
Asset-backed securities (ABS) or
Mortgage-backed securities (MBS)
1,968 Discounting cash
flows
Margin
Probability of
default
Rate of early
repayment
Loss rate
70-160 bp 25.%-6% 20% 00%-00%
115 bp 052.% 20% 00%
Assets in respect of derivative instruments (2)
Shekel-index interest contracts 121 Discounting cash
flows
Inflationary
expectations
051%-1508% 0550%
021 Discounting cash
flows
Transaction
counterparty risk
* 0500%-100% 250.%
Interest contracts 414 Discounting cash
flows
Transaction
counterparty risk
* 0500%-100% 250.%
Foreign currency contracts
001 Discounting cash
flows
Inflationary
expectations
051%-1508% 0525%
08110 Discounting cash
flows
Transaction
counterparty risk
* 0500%-100% 250.%
Share contracts 020 Discounting cash
flows
Transaction
counterparty risk
* 0500%-100% 250.%
Commodities contracts 47 Discounting cash
flows
Transaction
counterparty risk
* 0500%-100% 250.%
Liabilities
Liabilities in respect of derivative instruments (2)
Interest contracts 44 Discounting cash
flows
Inflationary
expectations
051%-1508% 0525%
Foreign currency contracts
246 Discounting cash
flows
Inflationary
expectations
051%-1508% 0525%
B. Items measured for fair value on a non-recurring basis
Collateral-contingent impaired
debt
08145 Fair value of
collateral
* In respect of a failed counterparty.
B. Qualitative information regarding Level 3 fair value measurement
1. Unobservable inputs used for the fair value measurement of asset-backed or mortgage-backed securities are
margin rates, probability of default, early repayment rate, and the severity of a loss in the event of default.
Any significant increase/decrease in unobservable parameters will be reflected in a significantly lower/higher
fair value.
2. Unobservable inputs used for the fair value measurement of derivatives are the credit risk of the counterparty to
the transaction and the forecast rate of inflation. The higher/lower the credit risk of the counterparty to the
transaction, the lower/higher will be the fair value of the transaction.
Any change in the forecast rate of inflation will affect the fair value of transactions in accordance with the
indexation position of the Bank for these transactions. The more the inflation forecast increases (decreases), and
the Bank is committed to pay the amount linked to the index, the fair value of the transactions will decrease
(increase). The more the inflation forecast increases (decreases), and the counterparty to the transaction is
committed to pay the Bank the amount linked to the index, the fair value of the transactions will increase
(decrease).
3. The average figure referring to the unobservable parameter of "Transaction counterparty risk" reflects a
weighted average.
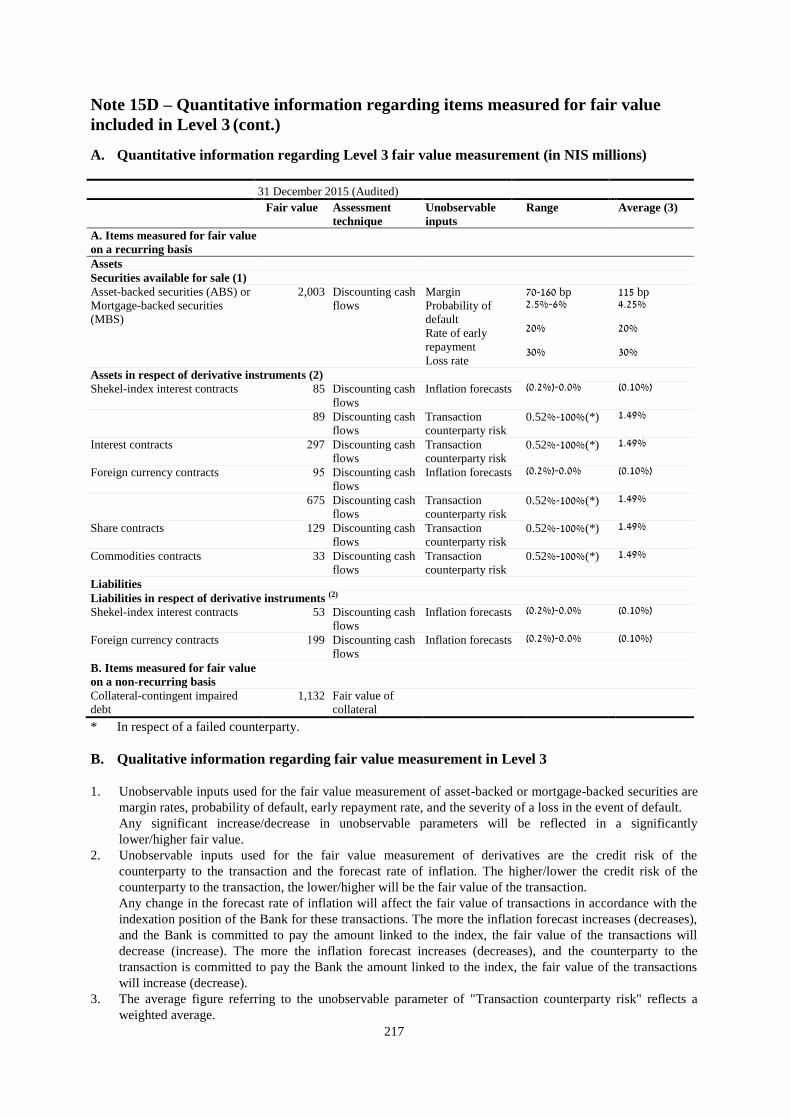
217
Note 15D – Quantitative information regarding items measured for fair value
included in Level 3 (cont.)
A. Quantitative information regarding Level 3 fair value measurement (in NIS millions)
31 December 2015 (Audited)
Fair value Assessment
technique Unobservable
inputs Range Average (3)
A. Items measured for fair value
on a recurring basis
Assets
Securities available for sale (1)
Asset-backed securities (ABS) or
Mortgage-backed securities
(MBS)
2,003 Discounting cash
flows
Margin
Probability of
default
Rate of early
repayment
Loss rate
70-160 bp 25.%-6% 20% 00%
11. bp 052.% 20% 00%
Assets in respect of derivative instruments (2)
Shekel-index interest contracts 85 Discounting cash
flows Inflation forecasts 050%- 052% 0510%
89 Discounting cash
flows Transaction
counterparty risk 0.52%-100%(*) 1504%
Interest contracts 547 Discounting cash
flows Transaction
counterparty risk 0.52%-100%(*) 1504%
Foreign currency contracts
42 Discounting cash
flows Inflation forecasts 050%- 052% 0510%
675 Discounting cash
flows Transaction
counterparty risk 0.52%-100%(*) 1504%
Share contracts 129 Discounting cash
flows
Transaction
counterparty risk 0.52%-100%(*) 1504%
Commodities contracts 33 Discounting cash
flows
Transaction
counterparty risk 0.52%-100%(*) 1504%
Liabilities
Liabilities in respect of derivative instruments (2)
Shekel-index interest contracts 53 Discounting cash
flows Inflation forecasts 050%- 052% 0510%
Foreign currency contracts
049 Discounting cash
flows Inflation forecasts 050%- 052% 0510%
B. Items measured for fair value
on a non-recurring basis
Collateral-contingent impaired
debt
1,132 Fair value of
collateral
* In respect of a failed counterparty.
B. Qualitative information regarding fair value measurement in Level 3 1. Unobservable inputs used for the fair value measurement of asset-backed or mortgage-backed securities are
margin rates, probability of default, early repayment rate, and the severity of a loss in the event of default.
Any significant increase/decrease in unobservable parameters will be reflected in a significantly
lower/higher fair value.
2. Unobservable inputs used for the fair value measurement of derivatives are the credit risk of the
counterparty to the transaction and the forecast rate of inflation. The higher/lower the credit risk of the
counterparty to the transaction, the lower/higher will be the fair value of the transaction.
Any change in the forecast rate of inflation will affect the fair value of transactions in accordance with the
indexation position of the Bank for these transactions. The more the inflation forecast increases (decreases),
and the Bank is committed to pay the amount linked to the index, the fair value of the transactions will
decrease (increase). The more the inflation forecast increases (decreases), and the counterparty to the
transaction is committed to pay the Bank the amount linked to the index, the fair value of the transactions
will increase (decrease).
3. The average figure referring to the unobservable parameter of "Transaction counterparty risk" reflects a
weighted average.

218
Note 16– Events after the reporting period
A. Bank Leumi Jersey
On 8 April 2016, the transaction was completed for the engagement of the sub-subsidiary Bank
Leumi Jersey in an agreement to sell its holdings in its subsidiary Leumi Overseas Trust Corporation,
after receiving the relevant permits required for carrying out the agreement.
B. Sale of the Israel Corporation
On 21 April 2016, in an off-floor transaction, the Bank sold the balance of the shares it held in the
Israel Corporation Ltd., 451,252 shares, representing about 5.86% of the issued and paid=up capital of
the Israel Corporation, for 17,906,037 shares in Israel Chemicals Ltd. (CIL), representing 1.4% of the
issued and paid-up share capital of CIL.
C. Appointments and resignations
1. Mr. Ron Fainaro, member of Management of the Bank and Head of the Finance Division, will
be appointed CEO of Leumi Card. The appointment will come into effect subject to the receipt of
Bank of Israel approval. Mr. Fainaro will cease serving in the Bank after the appointment of his
replacement.
2. Prof. Danny Tsiddon, Deputy CEO, gave notice of his resignation from the Bank and will finish
his duties during 2016 after 12 years in the Bank when his replacement takes up his position.
3. Mr. Omer Ziv will be appointed as Head of the Financial Division and member of Bank
Management with the rank of First Executive Vice President. The appointment will come into
effect during 2016, subject to the approval of the Bank of Israel.
D. Change in the rate of Companies Tax
On 5 January 2016, the Amendment to the Income Tax Ordinance (No. 216) Law, 2016 was
published, reducing the rate of Companies Tax from 26.5% to 25%.
The balances of deferred taxes as at 31 March 2016 were calculated in accordance with the new tax
rate. The effect of the change on the financial statements as at 31 March 2016 is expressed in a
reduction of the balance of deferred taxes by NIS 148 million, of which NIS 122 million was charged
to profit and loss and NIS 26 million was charged to capital reserve.
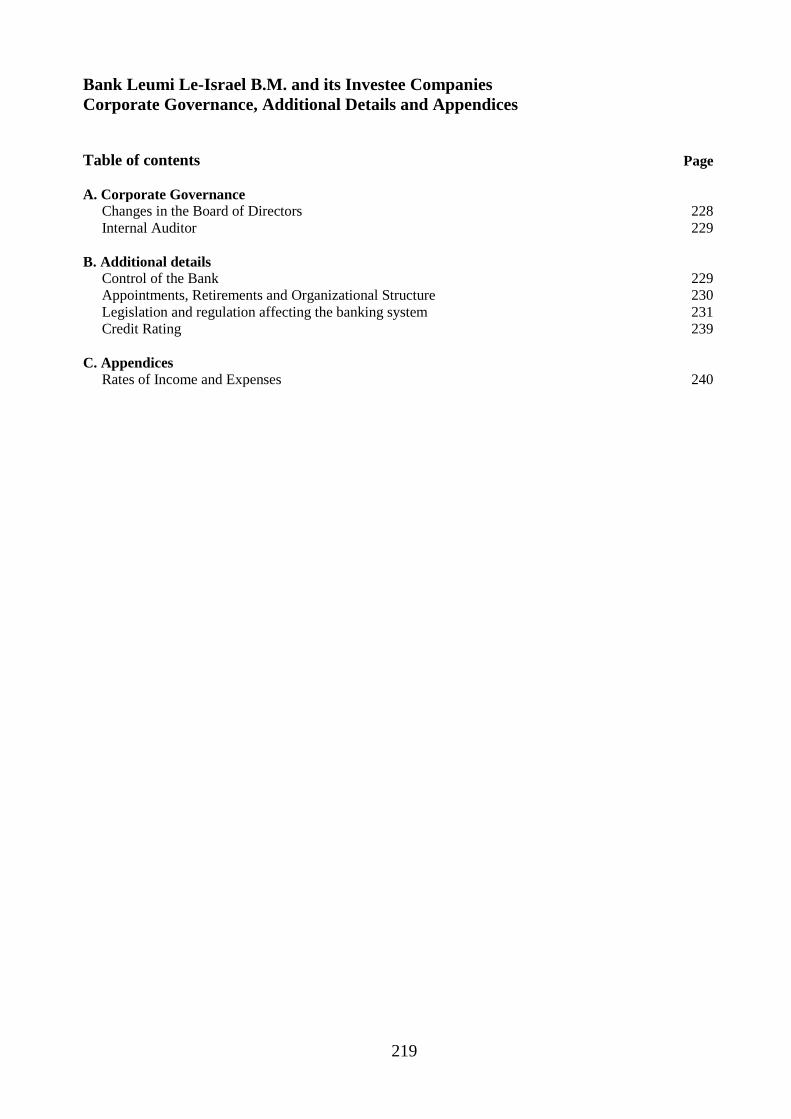
219
Bank Leumi Le-Israel B.M. and its Investee Companies
Corporate Governance, Additional Details and Appendices
Table of contents Page
A. Corporate Governance
Changes in the Board of Directors 228
Internal Auditor 229
B. Additional details
Control of the Bank 229
Appointments, Retirements and Organizational Structure 230
Legislation and regulation affecting the banking system 231
Credit Rating 239
C. Appendices
Rates of Income and Expenses 240
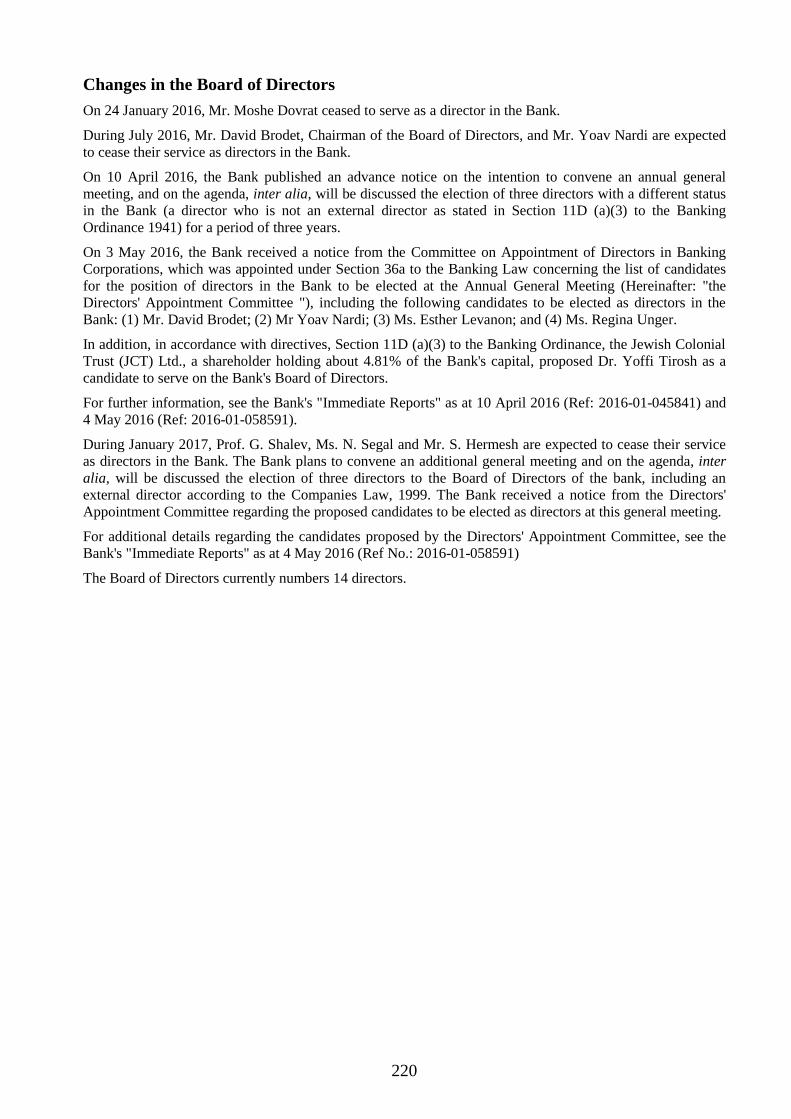
220
Changes in the Board of Directors
On 24 January 2016, Mr. Moshe Dovrat ceased to serve as a director in the Bank.
During July 2016, Mr. David Brodet, Chairman of the Board of Directors, and Mr. Yoav Nardi are expected
to cease their service as directors in the Bank.
On 10 April 2016, the Bank published an advance notice on the intention to convene an annual general
meeting, and on the agenda, inter alia, will be discussed the election of three directors with a different status
in the Bank (a director who is not an external director as stated in Section 11D (a)(3) to the Banking
Ordinance 1941) for a period of three years.
On 3 May 2016, the Bank received a notice from the Committee on Appointment of Directors in Banking
Corporations, which was appointed under Section 36a to the Banking Law concerning the list of candidates
for the position of directors in the Bank to be elected at the Annual General Meeting (Hereinafter: "the
Directors' Appointment Committee "), including the following candidates to be elected as directors in the
Bank: (1) Mr. David Brodet; (2) Mr Yoav Nardi; (3) Ms. Esther Levanon; and (4) Ms. Regina Unger.
In addition, in accordance with directives, Section 11D (a)(3) to the Banking Ordinance, the Jewish Colonial
Trust (JCT) Ltd., a shareholder holding about 4.81% of the Bank's capital, proposed Dr. Yoffi Tirosh as a
candidate to serve on the Bank's Board of Directors.
For further information, see the Bank's "Immediate Reports" as at 10 April 2016 (Ref: 2016-01-045841) and
4 May 2016 (Ref: 2016-01-058591).
During January 2017, Prof. G. Shalev, Ms. N. Segal and Mr. S. Hermesh are expected to cease their service
as directors in the Bank. The Bank plans to convene an additional general meeting and on the agenda, inter
alia, will be discussed the election of three directors to the Board of Directors of the bank, including an
external director according to the Companies Law, 1999. The Bank received a notice from the Directors'
Appointment Committee regarding the proposed candidates to be elected as directors at this general meeting.
For additional details regarding the candidates proposed by the Directors' Appointment Committee, see the
Bank's "Immediate Reports" as at 4 May 2016 (Ref No.: 2016-01-058591)
The Board of Directors currently numbers 14 directors.
221
Internal Auditor
Details of the internal audit in the Group, including the professional standards according to which the internal
audit operates, the annual and multiyear work plan and the considerations in determining it, are included in
the Financial Statements 2015.
The work plan of the Internal Audit Division for 2016 was submitted to the Audit Committee on
28 December 2015 and approved in the Committee on 31 December 2015, and was submitted to the Board of
Directors on 5 January 2016 and approved in the Board of Directors on 10 January 2016.
The Internal Auditor’s annual report for 2015 was submitted to the Audit Committee on 18 February 2016
and discussed by the Committee on 23 February 2016, and was submitted to the Board of Directors on 2
March 2016 and discussed therein on 10 March 2016.
The annual reports of the internal auditors of the subsidiaries in Israel for 2015 were submitted to the Audit
Committee on 30 March 2016 and were discussed therein on 3 April 2016.
The annual reports of the internal auditors in the overseas offices for 2015 were submitted to the Audit
Committee on 4 May 2016 and were discussed therein on 8 May 2016.
Control of the Bank
As of 24 March 2012, the Bank is defined, according to the provisions of the law, as a banking corporation
without core control and there is no shareholder who is defined as a controlling shareholder in the Bank.
For updated information regarding the holdings of interested parties in the Bank, see Immediate Report on the Position of holdings of
Interested Parties and Senior Office Holders, dated 7 April 2016 (Ref. No. 2016-01-044562 and Immediate Report on Changes in the
Holdings of Interested Parties and Senior Office Holders dated 14 April 2016 (Ref. No. 2016-01-044563).
Annual General Meeting and Election of Directors
On 10 April 2016, an advance notice on the intention to convene a general meeting was published, and on the
agenda, inter alia, will be discussed the appointment of three directors with status of "Different Director", as
outlined in the chapter "Changes in the Board of Directors", above, and in the Amendment of the Bank's
Regulation on various subjects.

222
Appointments and Retirements
Appointments:
Mr. Danny Cohen, member of Bank Management, Head of the Human Resources Division and Chairman of
the Board of Directors of the Arab Israel Bank, was appointed to the position of Head of the Banking
Division, with effect from 1 January 2016.
Ms. Tamar Yassur, member of Bank Management, Head of the Banking Division and Chairman of the
Board of Directors of Leumi Card, was appointed to the position of Head of the Digital Banking Division
with effect from 1 January 2016, and, at the same time, she will continue in her position as Chairman of the
Board of Directors of Leumi Card.
Ms. Michal Dana joined the Bank on 21 October 2015 and will be appointed to the position of Head of the
Human Resources Division, and a member of Bank Management with the rank of First Executive Vice
President, with effect from 1 January 2016.
Adv. Livnat Ein-Shai Vilder was appointed to the position of the Bank's Secretary in status of office holder
who is not a member of Management, with effect from 1 March 2016.
Mr. Ron Fainaro, a member of Bank Management and Head of the Financial Division will be appointed to
the position of CEO of Leumi Card. The appointment will take effect subject to the receipt of approval from
the Bank of Israel. Mr. Fainaro will cease to serve in his position in the Bank after his replacement is
appointed.
Mr. Omer Ziv will be appointed as Head of the Financial Division and member of Bank Management with
the rank of First Executive Vice President. The appointment will come into effect during 2016, subject to the
approval of Bank of Israel.
Retirements:
Prof. Dani Tzidon, Deputy CEO announced his retirement from the Bank, and will cease to serve in his
position during 2016 after 12 years of employment in the Bank, three years of which he served as Deputy
CEO.
Mr. Heny Heller, CEO of Leumi Card, will cease to serve in his position during 2016, after 16 years of
employment in the Bank, three and a half years of which he served as CEO.
Organizational Structure
Digital Banking Division
On 1 January 2016, a new division was set up in Leumi for Digital Banking, which is subordinate to the
President and CEO. The establishment of the division constitutes an additional and significant step in the
digital revolution. The division leads and implements the digital innovativeness in the Leumi Group.
Banking Division
In light of changes and trends in the global business environment and in banking in Israel, it was decided to
make a gradual transition from a geographical structure (regions) to a structure of four lines of business,
which will operate as independent profit centers: Private Banking (an existing department), Small Businesses
(set up on 1 January 2016), Premium Banking and Retail Banking. The preparations and transition from areas
to lines of business will span the whole year.
Investment Counseling Department
On 1 January 2016, the Investment Consulting Department was transferred to the responsibility of the Head
of the Banking Division. Until the end of 2015, the Department was the responsibility of the Head of the
Human Resources Division.

223
Legislation and Regulation relating to the Banking System
Some of the information in this chapter is "forward-looking information". For the meaning of this term and the consequences arising
from this meaning, see the chapter, "Forward-Looking Information".
See a detailed description in the Financial Statements for 2015 – pages 505 - 535
A large number of proposals for regulatory changes and changes in various provisions of the law were
published during the reporting period, which may have an impact on the characteristics of the Group's
activity, the scope of activity in some of the Group's areas, the rate of profitability in some of the Group's
activities and on the credit risks and operating and legal risks to which the Group is exposed. Most of the
directives are at various stages of discussion, and consequently it is not possible to assess whether they will
be issued as binding directives, and if issued, what the ultimate directives that are established will be.
Accordingly, at this stage, it is not possible to estimate the impact that those regulations will have on the
overall activity of the Group, if any.
Legislation
Amendment to Annual Vacation Law
On 8 February 2016, the Annual Vacation Law, 1951, was amended. According to the amendment, it was
decided that in the period from 1 July 2016 until 31 December 2016, an employee will be eligible to 15
vacation days in each of the first four years of his employment, and from 1 January 2017, an employee will
be eligible to 16 vacation days in each of the first five years of his employment.
Prohibition of Money Laundering Law (Amendment No. 14), 2016
On 7 April 2016, an amendment to the Prohibition of Money Laundering Law was published, determining
that serious tax offences according to the Income Tax Ordinance, the Value Added Tax Law, and the Land
Appreciation Tax Law, will be recognized as predicate offences according to the Prohibition of Money
Laundering Law, and will be subject to sanctions under this law, including severe punishment of up to 10
years imprisonment and possible forfeit of property.
As a rule, tax offences will be considered as predicate offences under certain conditions and inter alia, if the
tax offence crossed a certain monetary threshold, or was committed with sophistication, or in connection with
crime organizations and terrorism, or by someone who is not the person liable to the taxation.
In addition, the amendment provides an arrangement that allows the transfer of information from the Money
Laundering & Terror Financing Prohibition Authority to the Tax Authority for the purpose of crime
investigation and prevention under the law.
The law will come into effect six months from the date of its publication.
Credit Data Service Law, 2016
On 12 April 2016 the Credit Data Service Law was published.
The Law establishes a comprehensive arrangement of credit data sharing, and includes directives for the
gathering of credit data from the information sources stipulated by law, saving them in a central database that
will be operated by the Bank of Israel and furnishing the credit data in the database to credit bureau for it to
be processed and transferred, inter alia, to credit providers.
The Law provides instructions with regard to the retention of customers' personal information and customer
privacy.
Most sections of the Law will enter into effect within six months from its publication date. Under certain
circumstances it will be possible to extend the Law's enter into effect date for additional periods, provided
that the total delays will not exceed four years from date of publication of the Law.
224
Remuneration Law for Officeholders in Financial Corporations (special approval and non
recognition as an allowable tax deductible expense since it is exceptional remuneration), 2016
On 12 April, the Remuneration Law for Office Holders in Financial Corporations (special approval and
non recognition of exceptional remuneration as a tax deductible expense), 2016, was published. The
Law establishes restrictions on the remuneration of office holders or other employees in financial
corporations (hereinafter: "the remuneration"), as follows:
The benchmark for approving the remuneration was established; in respect of which the projected
expenditure is expected to exceed NIS 2.5 million per year.
No agreement will be approved when the expected expenditure in respect of the remuneration exceeds
NIS 2.5 million, unless the ratio between the projected expenditure, according to the cost of a full salary,
resulting from this remuneration and the expenditure, resulting from the lowest remuneration, according
to the cost of a full salary that the financial corporation paid directly or indirectly to the employee in the
corporation (including contractors' employees) in the year prior to the date of the agreement, is lower
than 35.
The amount of remuneration of the said employee / office holder, will be calculated on a collective basis,
i.e. it will also include remuneration from related corporations as they are defined in this law.
For the purpose of calculating the taxable income of a financial corporation, it was decided that an
expense which exceeds the ceiling, as defined by law, may not be deducted as a recognized expense. The
ceiling defined in the law does not exceed NIS 2.5 million per year, and in the event that the
remuneration exceeds NIS 2.5 million per year, the ceiling will be reduced to the amount of the
difference between the remuneration and NIS 2.5 million (Hereinafter: "the ceiling").
The rules for reporting to the Tax Authority with regards to remuneration details that exceed the ceiling
were determined.
A sanction was set, according to which a corporation that does not comply with the rules- the agreement
will be regarded as an invalid transaction (according to Section 280 of the Companies Law).
With regard to agreements that were approved on the day of publication of the Law and thereafter, wage
restrictions will come into force from the day of publication, while the effect on taxable income of the
financial institution and the report to the tax authority will apply from 1 January 2017. With regard to
agreements that were approved prior to the date of publication, wage restrictions and the effect on taxable
income of the financial institution and the report to the tax authority will apply from the end of six months
from the date of publication.
On 7 April 2016, the Supervisor of Banks published a letter to the Chairpersons and CEOs of the banking
corporations, according to which the banking corporations are required to estimate the possible implications
and risks to the Bank when the law comes into force, including examination of the likelihood of key
employees terminating their service and to examine the impact on the Bank's long-term plans, including the
ability to significantly streamline operations in accordance with supervisory requirements.
In addition, the banking corporations are required to examine the need to update obligations regarding
employees' rights in the Banks' upcoming financial statements, given that the changes in circumstances are
likely to have implications for the banking corporations' retirement estimates.
Against the background of the increasing likelihood that members of management and other managers who
are employed under personal contracts in the Bank, will terminate their service in the relatively near future,
due to the expected worsening of their conditions when the law comes into force, the Bank's Board of
Directors, in light of management's assessment and in accordance with legal opinions, approved a provision
in respect of the termination of employee-employer relations with respect to estimating the Bank's increasing
exposure, according to the rights that have accumulated to date, in accordance with the terms of employment
of members of management and other managers who are employed under personal contracts, if their
employment was discontinued during the reporting period.
225
Legislative proposals
A Draft Law to Broaden Tax Collection and Increase Enforcement (the means to enforce tax
payment and deter against money laundering (Legislative Amendments), 2015
On 12 October 2015, the Knesset approved a draft law to broaden tax collection and increase enforcement
(the means to enforce tax payment and deter against money laundering) (Legislative Amendments), 2015.
The proposed amended law is currently being discussed in the Knesset's Constitution, Law and Justice
Committee.
The draft law proposes to authorize the tax authorities to request information from financial entities regarding
their customers, with regard to various characteristics of tax evasion, such as the transfer of funds overseas to
countries which are tax havens. Requests for the aforesaid information will be subject to the approval of the
Public Committee and the government's legal advisor.
Memorandum of the Securities Law (Amendment No.) (Structural Change of the Stock
Exchange), 2016
On 22 February 2016 the Ministry of Finance published a memorandum of the Securities Law (Amendment
No.)(Structural Change of the Stock Exchange), 2016
The memorandum proposes to change the ownership structure on the stock exchange while turning it into a
for-profit company.
It is also proposed to widen the company base in the stock exchange and make it accessible to a larger
number of eligible traders in such a way that access to trade will no longer be dependent on ownership rights
in the stock exchange but rather will be based on contractual arrangements between the stock exchange and
potential members.
In addition, the memorandum discussed the following issues: strengthening the supervisory mechanisms on
the stock exchange, stipulating conditions for the provision of a license to open the stock exchange, control
permits and corporate governance arrangements.
Draft Law for the Insolvency and Economic Rehabilitation Law, 2016
On 7 March 2016 the proposed Insolvency and Economic Rehabilitation Law was approved in a first reading.
The proposal includes a comprehensive reform, both structurally and materially, in insolvency proceedings of
individuals and corporations. The proposal includes instructions related to all kinds of debtors, alongside
instructions dealing with the unique aspects of various kinds of debtors – units and corporations. The
proposal includes, inter alia, the following innovations:
The definition of insolvent will be according to a cash flow test, and accordingly, an insolvent is anyone
who is unable to pay his debts when due, this, in place of the balance sheet test which is currently used.
A creditor will be able to submit a request for the grant of an order for opening proceedings only when
the debtor has not paid him a debt when due. A future creditor will not be entitled to submit a request to
start proceedings, except in circumstances in which the debtor is acting in order to defraud his creditors,
to prefer creditors or conceal assets.
The court which is qualified in the insolvency proceedings of an individual will be the magistrates' court,
while the insolvency proceedings for a corporation will continue to be conducted in a district court.
The start of insolvency proceedings against a corporation will commence in a consolidated proceeding in
which it will be established whether the corporation is insolvent. After this decision the court will decide
on the way in which it is appropriate to deal with the corporation's insolvency – recovery proceedings or
liquidation proceedings.
With regard to individuals – The management of a large part of the proceedings will be transferred from
the District Court to the Official Receiver referred to in the proposed law as "the Official Receiver") and
to the Magistrates Court. The proceedings will begin in the period of examination, which will coincide
with grant of the order for opening proceedings, in which the economic position of the debtor will be
investigated, during which a stay of the proceeding will be in force. At the end of the examination, the
Official Receiver will submit a report to the court on the basis of which a recovery program for the
debtor will be established, on the completion of which the individual will be discharged of his debts.

226
If the individual does not have the ability to pay his creditors, he will be discharged immediately. In
addition, it is proposed to provide alternative tracks for debtors without any means, and debtors with
small debts, which will be dealt with mainly by the Enforcement and Collection Authority, usually,
without the involvement of the court.
The preferred status of some of the "debts with preferential right" will be cancelled.
A floating lien will apply only to the assets of the debtor at the time of granting the order and to the
assets that will be due to the debtor at this date and thereafter as consideration for the abovementioned
assets or as an alternate asset which is identifiable and consistent.
A secured creditor in a floating lien will be entitled to repay his secured debt from the floating lien only
up to the amount equivalent to 75% of the value of the assets to which the lien applies. The balance of the
assets under the lien will be used as payment to the general creditors.
Directors in a corporation in insolvency are required to take reasonable steps to minimize the scope of the
insolvency.
For the first time, a part has been added relating to the management of insolvency proceedings which has
international aspects.
A corporation will be able to execute a debt arrangement at an early stage, even before insolvency, with
the aim of stopping its deterioration, this, in accordance with the recommendations of the Committee to
Examine Debt Arrangements in Israel (the Endoren Committee).
Banking Law Draft (Licensing) (Amendment – Branch Closures), 2015
On 9 March 2016, the Knesset plenum approved in a preliminary reading the draft of the Banking Law
(Licensing) (Amendment – Branch Closures), 2015, in a preliminary reading. In accordance with the
proposal, a banking corporation will not close a branch as long as the Supervisor was notified thereof at least
60 days prior to the branch closure, and the Supervisor or a Bank of Israel employee authorized for that
purpose by the Supervisor did not express, within the said period, his consent or opposition to the branch
closure.
Draft Law for the Supervision of Financial Services (Provident Funds) (Amendment No. 15),
2016
On 14 March 2016 the Knesset plenum approved in a first reading a draft of the Law for the Supervision of
Financial Services (Provident Funds) (Amendment No. 15), 2016 in a first reading. As part of the draft, it
was suggested, inter alia, to allow companies that manage provident funds to establish an additional savings
product that will be called "Provident Funds for Investment" intended to pay a capital amount to a plan
member. The funds in the provident fund for investment will be liquid and the saver will be able to withdraw
them in one payment, without tax benefits or receive an exemption from capital gains tax if the plan member
decides to receive them as an allowance.
Draft Law for the Supervision of Financial Services (Legislation Amendments), 2016
On 21 March 2016, the Knesset plenum approved in a first reading the draft Law for the Supervision of
Financial Services (Legislation Amendments), 2016 in a first reading.
As part of the draft, it was proposed to change the Capital Markets Division in the Finance Ministry to an
authority that will be called: Capital Markets, Insurance and Savings Authority. The authority will operate as
an independent unit in the Finance Ministry which the Finance Minister will supervise.
It was also proposed that the Finance Minister will appoint, with the approval of the government, a
supervisor of the Capital Markets, Insurance and Savings, and he will be responsible for fulfilling the roles
and routine management of the Authority. The aim of this is to provide the supervisor of the Capital Markets,
Insurance and Savings with greater administrative independence and freedom than he has today.

227
Proposed law for the Supervision of Financial Services (Provident Funds)
(Amendment No. 16), 2016 - General Collective (Framework) Agreement to increase pension
insurance contributions in the market
On 23 February 2016, the Presidency of Business Organizations and the New General Workers' Union signed
a General Collective (Framework) Agreement to increase pension insurance contributions in the market,
designed to establish an increase in deposit rates that will apply to all employees and employers in the market
("the framework agreement"). The condition for the framework agreement to come into effect is to extend its
provisions to all employees in the extension order and amendment of "the general approval regarding the
employers' payments to a pension and insurance funds instead of severance pay".
On 21 March 2016, a bill was published by the Government – a proposed law for the Supervision of
Financial Services (Provident Funds) (Amendment No. 16) 2016, The bill proposes, in accordance with the
directives of the framework agreement, to amend Section 20 to the Supervision of Financial Services Law
(Provident Funds), 2005 and provide that, if it is stipulated by law or in the agreement that the rate of the
deposit to a particular provident fund stands at a certain rate of an employee's salary and includes a payment
of the employer to purchase preferred insurance at the rate required to ensure 75% of the employee's salary or
at a rate of 2.5% of his salary, as aforesaid, whichever the lower, and the rate of the deposit according to law
or the agreement to a different type of provident fund stands at a lower rate, the said stipulation will not be
considered a stipulation of the employer with regard to the deposit rate for the employee for a particular type
of provident fund, provided that the employee will be entitled to a deposit rate to the employer's payment
components of no less than the deposit set in the proposed third supplement(from 1 July 2016. 6.25%, from 1
July 2017, 6.5%).
Draft Law for a Warning Obligation in the Advertising and Telemarketing of a Loan
(Legislation Amendments), 2015
On 23 March 2016 the Knesset plenum approved in a preliminary reading the draft law for a Warning
Obligation in the Advertising and Telemarketing of a Loan (Legislation Amendments), 2015, according to
which it was proposed to determine that a banking corporation or a non-banking lender will not engage in
advertising that encourages taking a debt or a loan and will not market loans over the phone, unless a warning
is attached to the advertisement that failure to meet the repayment of the loan may result in legal expenses,
fines, foreclosure of account and execution acts from the part of the lender.
Material Directives of the Bank of Israel
Permit to open partial and mobile branches
On 28 February 2016, the Supervisor of Banks published a format of a permit to open partial and mobile
branches. The permit will enable banks to open partial branches at various sites. The partial branch can be
operated from a suitable room with signposts of the Bank or via a branch that can be moved move and
operated from various sites, including from within a suitable vehicle. The branch will operate at regular
intervals, as set by the Bank, at least once a month.
The services in the branch will only be available to individual customers or small businesses.
A bank will be permitted to provide the full range of bank services in the said branch, excluding: signing of
guarantees, extending housing loans and investments consulting and marketing.
Amendment to the Banking Management Directive 329 on the subject of restrictions in the
provision of housing loans
On 1 May 2016, the Bank of Israel published an amendment to Directive 329 on the subject of restrictions in
the provision of housing loans.
As part of the amendment, it was determined that, for the purpose of calculating the financing rate of the
housing loan to those eligible for housing in projects in which the State gives a discount on the cost of
land, such as "a target price" and "a home owner price ", a banking corporation will be authorized to base the
value of the property on an appraisal, rather than on the actual purchase price. It was determined that if the
appraisal is higher than NIS 1.8 million, the value of the property should be based on NIS 1.8 million, or on
the purchase price, whichever is higher. It was further determined that the purchaser must pay at least NIS
100 thousand of the purchase out of his own sources.

228
When penalties, in respect of a breach of the terms of the plan in these projects, are levied, these amounts
must be deducted from the value of the apartment, unless the Bank has a preferential right over the right of
the State to a penalty upon the realization of the property.
Proper Conduct of Banking Business Directive 472, on the subject of clearing entities and the
clearing of debit card transactions
On 1 May 2016, the Banking Supervision Department published Proper Banking Management Regulation
No. 472, on the subject of clearing entities and the clearing of debit card transactions.
This directive relates for the first time, in a designated manner, to financial entities whose main business is
the clearing of debit card transactions.
The directive alleviates some of the regulatory requirements which, until now, have been imposed on credit
card and clearing companies, and also alleviates the cleared capital requirements, while distinguishing
between clearing entities whose scope of credit activity is immaterial, and other clearing agents.
In addition, the directive discusses the following subjects: the existence of an adequate infrastructures of
corporate governance; risks management; internal control and IT management; the protection of funds in
clearing; management of businesses accounts, relations between clearing entities and businesses, the transfer
of funds in immediate debit transactions; the use of the EMV standard, a mechanism for diverting
responsibility, the rental to businesses of terminal equipment adapted to new technology (EMV) and details
of the provisions of the Proper Conduct of Banking Business Regulations which apply to the clearing entities.
In defining the directive, the relevant sections that apply to clearing entities were transferred from Proper
Conduct of Banking Business Directive 470 – Debit Cards, to this directive.
The directive will come into effect on 1 June 2016, with the exception of certain sections that were
transferred from Proper Conduct of Banking Business Directive 470, which discuss transactions in an
immediate debit card, transactions with a prepaid card and connection to a new terminal, for which different
effective dates have been determined.
229
Material Drafts of the Bank of Israel
Online banking; transmission of messages in the media; types of accounts and conditions that
if fulfilled, the customer's signature of agreement will not be required.
On 16 March 2016, the Banking Supervision Department published drafts of various direvtives in the area of
online banking. The drafts discuss, inter alia, the following topics:
Opening a new account online.
Enrolling online banking online;
Expanding the types of agreements for which the customer's signature at the branch is not required;
A customer who enrolls for online banking services will be able to make online transactions and
payments to a third party and specify regular beneficiaries in his account without the need to attend the
branch as has been required until now;
The restrictions that have been imposed until now, with regard to ceilings for the amounts of transfers by
the customers to unlisted beneficiaries, will be removed - along with determining ceilings by the banking
corporate, according to the risks management policy that will be devised on the matter.
A customer who enrolls for online banking services will be able to update details in his account
(for example, family name and address) and also obtain a preliminary password and release a blocked
password online without the need to go to a branch;
Subject to the approval of the Supervisor, a customer will be able to obtain collection of information
services from any financial entity in which he has an account. The customer will choose the bank in
which he wishes the information to be collected.
A customer who so chooses will be able to receive most of the notices via online banking. The bank will
be able to offer the customer the option of receiving alerts which will assist him in managing his account
via a mobile phone (SMS text messages) or by e-mail,
Sending a text message (SMS) to a customer that five checks were refused in his account or for whom
restrictions have been imposed on his account.
Alongside these reliefs, the Banking Supervision Department intends to impose on the banks responsibility
for the management of the risks inherent in expanding remote banking activity, implementation of various
controls and protection of the information.
Draft amendment to Proper Conduct of Banking Business Regulation 454 on the subject of
early repayment of non-housing loans
On May 15, 2016 the Bank of Israel published a draft amendment to Regulation 454 on the subject of early
repayment of non-housing loans.
The draft includes an amendment to the version of the amended regulation, which entered into effect on April
1, 2016.
Among other things the draft stipulates that the explanation page to the customer regarding the early
repayment, may be included as an annex to the loan agreement or the framework agreement provided that it
will be presented in bold and highlighted manner in order to avoid duplication.
It was also stipulated that instead of presenting the capitalization component formula and its method of
calculation in the explanation page, the banking corporations must refer to a link to the website of the
banking corporations, where the capitalization component formula and the method of calculation will be
displayed clearly. The link must lead directly to the place in the website where the capitalization component
formula and method of calculation are displayed. In addition, the banking corporation must provide the
borrower who is interested in that, the formula of the capitalization component and calculation method, in the
way it uses to send notices to customers or by any other accepted way chosen by the customer.
In addition the draft includes various clarifications regarding the information that should be included in the
explanation page provided to the customer and regarding the classification of the borrower.
230
Draft Amendment to Proper Conduct of Banking Business Regulation 403 on the subject of
non-banking benefits to customers
On May 15, 2016 the Bank of Israel published a revised draft of Proper Conduct of Banking Business
Regulation 403 on the subject of non-banking benefits to customers.
This regulation regulated the rules for granting non-banking benefits of banking corporations to their
customers. The amendment extends the options available to the banking corporations to give non-banking
benefits to their customers while the customer conducts his current account regularly, including enrolling and
using online banking services.
The amendment does not allow the banking corporations to give a non-banking benefit while opening a
current account (excluding paying money or a small value item for marketing purposes of the banking
corporation) or during sale of other banking products including placing a deposit, extension or use of credit,
opening an investment portfolio and its management and investment or pension consulting.
International Regulation
Base Erosion Profit Shifting (BEPS)
BEPS is a project initiated by the G20 Forum in cooperation with the OECD, with the aim of contending with
international tax planning of global companies, which transfer their profits to territories with beneficient tax
regimes, and, in many cases, to tax havens where tax is not imposed at all. The project encompasses
a comprehensive plan of action that will supply information, analyses, courses of action and
recommendations for contending with the phenomenon. Courses of action have been developed in order to
provide governments with tools at a local and international level to cope with the tax planning and to assist
countries in ensuring that profits will be taxed in the location where the financial activity of the corporation
takes place and where the value is created, and to give businesses greater certainty as a result of a reduction
in the number of disputes on international taxation. The BEPS plan of action includes 15 operative
recommendations divided into three categories: consistency, content, and transparency. Under the category of
transparency, the OECD recommends that multi-national corporations with a turnover of over 750 million
euro be obligated to hand over to relevant tax authorities reports that will enable the tax authorities in the
relevant countries to examine whether or not profits have been legitimately offset among the related
corporations. The recommendations will most likely be expressed in local legislation. On May 13, 2016 the
State of Israel signed its joining the implementation of the multilateral convention on inter-state reporting ("
CBC"). The Bank has started to prepare for the implementation of the recommendations.
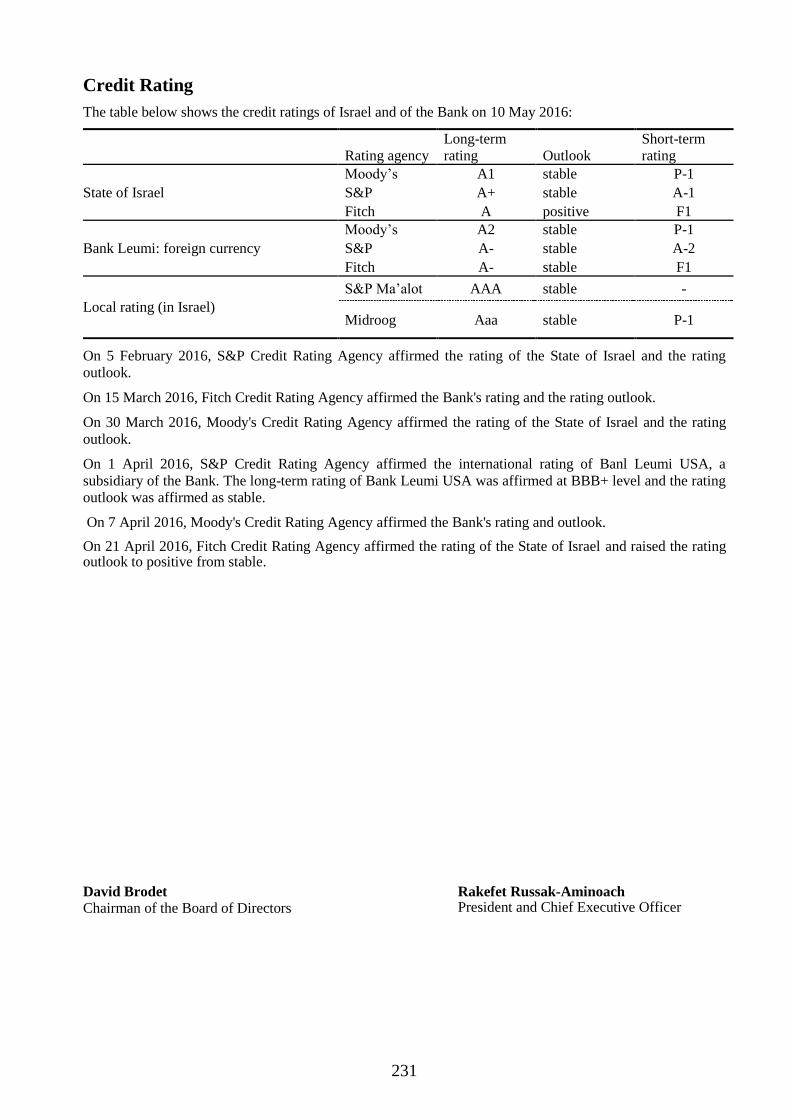
231
Credit Rating
The table below shows the credit ratings of Israel and of the Bank on 10 May 2016:
Rating agency
Long-term
rating Outlook
Short-term
rating
State of Israel
Moody’s A1 stable P-1
S&P A+ stable A-1
Fitch A positive F1
Bank Leumi: foreign currency
Moody’s A2 stable P-1
S&P A- stable A-2
Fitch A- stable F1
Local rating (in Israel)
S&P Ma’alot AAA stable -
Midroog Aaa stable P-1
On 5 February 2016, S&P Credit Rating Agency affirmed the rating of the State of Israel and the rating
outlook.
On 15 March 2016, Fitch Credit Rating Agency affirmed the Bank's rating and the rating outlook.
On 30 March 2016, Moody's Credit Rating Agency affirmed the rating of the State of Israel and the rating
outlook.
On 1 April 2016, S&P Credit Rating Agency affirmed the international rating of Banl Leumi USA, a
subsidiary of the Bank. The long-term rating of Bank Leumi USA was affirmed at BBB+ level and the rating
outlook was affirmed as stable.
On 7 April 2016, Moody's Credit Rating Agency affirmed the Bank's rating and outlook.
On 21 April 2016, Fitch Credit Rating Agency affirmed the rating of the State of Israel and raised the rating outlook to positive from stable.
David Brodet
Chairman of the Board of Directors
Rakefet Russak-Aminoach President and Chief Executive Officer
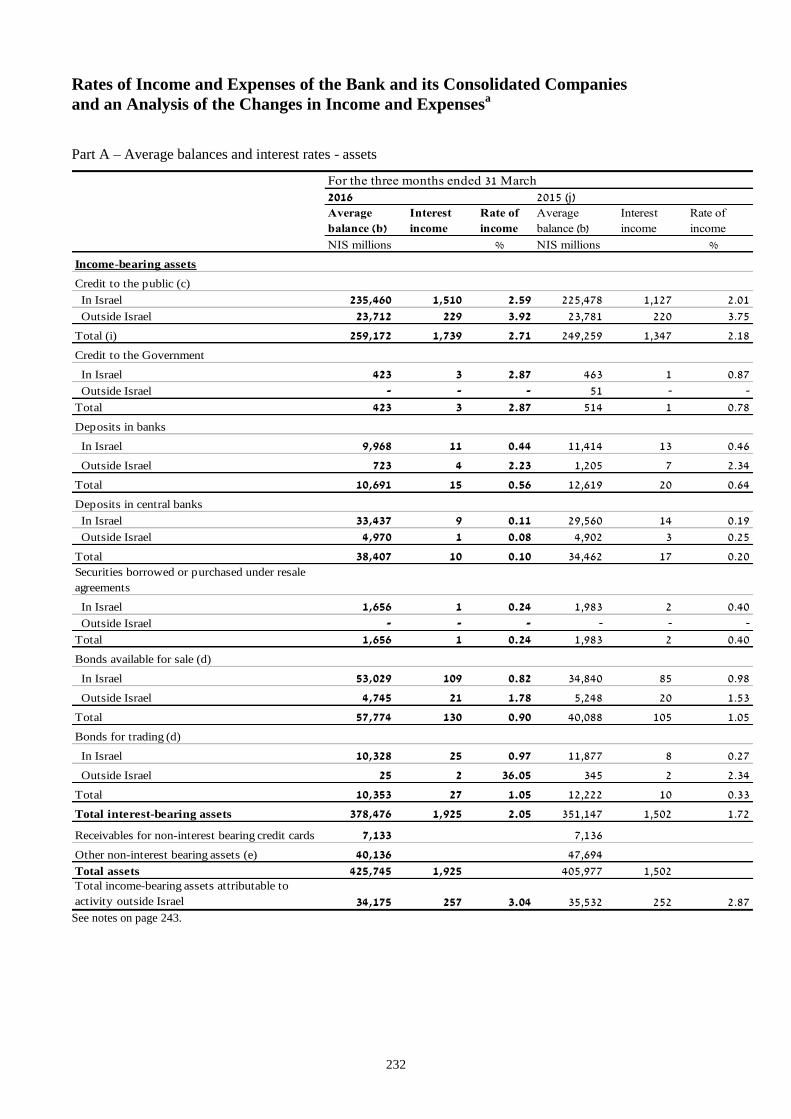
232
Rates of Income and Expenses of the Bank and its Consolidated Companies
and an Analysis of the Changes in Income and Expensesa
Part A – Average balances and interest rates - assets
For the three months ended 31 March
2016 2015 (j)Average
balance (b)
Interest
income
Rate of
income
Average
balance (b)
Interest
income
Rate of
income
% %
Income-bearing assets
Credit to the public (c)
In Israel 235,460 1,510 2.59 225,478 1,127 2.01
Outside Israel 23,712 229 3.92 23,781 220 3.75
Total (i) 259,172 1,739 2.71 249,259 1,347 2.18
Credit to the Government
In Israel 423 3 2.87 463 1 0.87
Outside Israel - - - 51 - -
Total 423 3 2.87 514 1 0.78
Deposits in banks
In Israel 9,968 11 0.44 11,414 13 0.46
Outside Israel 723 4 2.23 1,205 7 2.34
Total 10,691 15 0.56 12,619 20 0.64
Deposits in central banks
In Israel 33,437 9 0.11 29,560 14 0.19
Outside Israel 4,970 1 0.08 4,902 3 0.25
Total 38,407 10 0.10 34,462 17 0.20Securities borrowed or purchased under resale
agreements
In Israel 1,656 1 0.24 1,983 2 0.40
Outside Israel - - - - - -
Total 1,656 1 0.24 1,983 2 0.40
Bonds available for sale (d)
In Israel 53,029 109 0.82 34,840 85 0.98
Outside Israel 4,745 21 1.78 5,248 20 1.53
Total 57,774 130 0.90 40,088 105 1.05
Bonds for trading (d)
In Israel 10,328 25 0.97 11,877 8 0.27
Outside Israel 25 2 36.05 345 2 2.34
Total 10,353 27 1.05 12,222 10 0.33
Total interest-bearing assets 378,476 1,925 2.05 351,147 1,502 1.72
Receivables for non-interest bearing credit cards 7,133 7,136
Other non-interest bearing assets (e) 40,136 47,694
Total assets 425,745 1,925 405,977 1,502Total income-bearing assets attributable to
activity outside Israel 34,175 257 3.04 35,532 252 2.87
NIS millions NIS millions
See notes on page 243.

233
Rates of Income and Expenses of the Bank and its Consolidated Companies
and an Analysis of the Changes in Income and Expensesa (cont'd)
Part B – Average balances and interest rates – liabilities and equity
2016 2015 (j)Average
balance (b)
Interest
expense
Rate of
expense
Average
balance (b)
Interest
expense
Rate of
expense
% %
Interest- bearing liabilities
Deposits of the public
In Israel 238,447 (146) (0.24) 223,539 17 0.03 On demand 72,395 (3) (0.02) 60,281 (5) (0.03) Fixed term 166,052 (143) (0.34) 163,258 22 0.05 Outside Israel 16,556 (30) (0.72) 16,901 (31) (0.73) On demand 3,679 (2) (0.22) 2,919 (2) (0.27) Fixed term 12,877 (28) (0.87) 13,982 (29) (0.83)Total 255,003 (176) (0.28) 240,440 (14) (0.02)
Deposits of the Government
In Israel 149 (1) (2.66) 144 (1) (2.81)
Outside Israel 604 - - 344 - -
Total 753 (1) (0.53) 488 (1) (0.82)
Deposits from central banks - - - - - -
In Israel - - - - - -
Outside Israel - - - - - -
Total - - - - - -
Deposits from banks
In Israel 5,151 (2) (0.16) 4,279 (3) (0.28)
Outside Israel 16 - - 49 - -
Total 5,167 (2) (0.15) 4,328 (3) (0.28)
Securities lent or sold under resale agreements
In Israel 950 (1) (0.42) 1,186 (2) (0.68)
Outside Israel - - - - - -
Total 950 (1) (0.42) 1,186 (2) (0.68)
Bonds
In Israel 24,259 (90) (1.48) 21,771 34 0.63
Outside Israel - - - 10 - -
Total 24,259 (90) (1.48) 21,781 34 (0.79)
Total interest-bearing liabilities 286,132 (270) (0.38) 268,223 14 0.02Non-interest bearing deposits of the public 76,212 72,048
Payables for non-interest bearing credit cards 8,149 7,764
Other non-interest bearing liabilities (f) 26,721 31,717Total liabilities 397,214 (270) 379,752 14Total capital means 28,531 26,225Total liabilities and capital means 425,745 (270) 405,977 14Interest margin 1,655 1.67 1,516 1.74
Net yield (g) on income-bearing assets
In Israel 344,301 1,428 1.67 315,615 1,295 1.65
Outside Israel 34,175 227 2.68 35,532 221 2.51
Total 378,476 1,655 1.76 351,147 1,516 1.74Total income-bearing liabilities attributable to
activity outside Israel 17,176 (30) (0.70) 17,304 (31) (0.72)
(NIS millions)
For the three months ended 31 March
(NIS millions)
See notes on page 243.
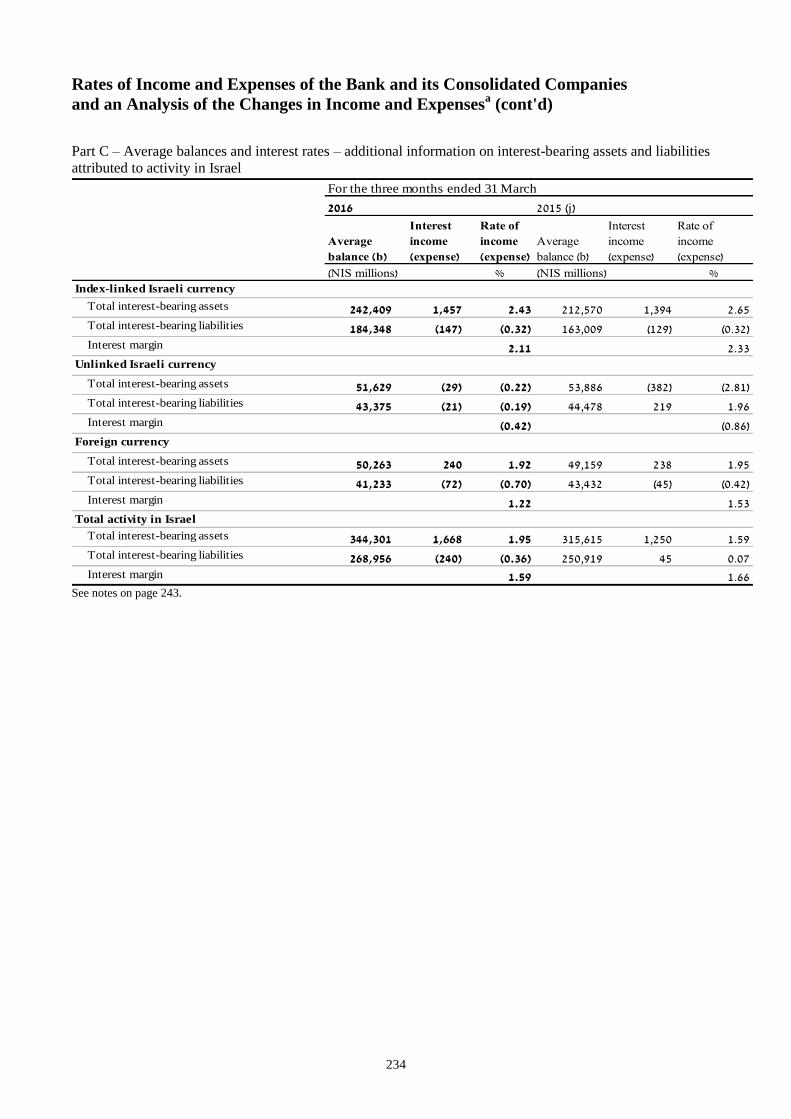
234
Rates of Income and Expenses of the Bank and its Consolidated Companies
and an Analysis of the Changes in Income and Expensesa (cont'd)
Part C – Average balances and interest rates – additional information on interest-bearing assets and liabilities
attributed to activity in Israel
2016 2015 (j)
Average
balance (b)
Interest
income
(expense)
Rate of
income
(expense)
Average
balance (b)
Interest
income
(expense)
Rate of
income
(expense)
% %
Index-linked Israeli currency
Total interest-bearing assets 242,409 1,457 2.43 212,570 1,394 2.65Total interest-bearing liabilities 184,348 (147) (0.32) 163,009 (129) (0.32)Interest margin 2.11 2.33
Unlinked Israeli currency
Total interest-bearing assets 51,629 (29) (0.22) 53,886 (382) (2.81)Total interest-bearing liabilities 43,375 (21) (0.19) 44,478 219 1.96Interest margin (0.42) (0.86)
Foreign currency
Total interest-bearing assets 50,263 240 1.92 49,159 238 1.95Total interest-bearing liabilities 41,233 (72) (0.70) 43,432 (45) (0.42)Interest margin 1.22 1.53
Total activity in Israel
Total interest-bearing assets 344,301 1,668 1.95 315,615 1,250 1.59Total interest-bearing liabilities 268,956 (240) (0.36) 250,919 45 0.07Interest margin 1.59 1.66
For the three months ended 31 March
(NIS millions) (NIS millions)
See notes on page 243.

235
Rates of Income and Expensesa (cont'd)
Part D – Analysis of changes in interest income and interest expenses
2016 compared to 2015
Net change
Amount Price
Interest-bearing assets
Credit to the public
In Israel 71 (522) (451)
Outside Israel (1) (437) (438)
Total 70 (959) (889)
Other interest-bearing assets
In Israel 24 (97) (73)
Outside Israel 2 (61) (59)
Total 26 (158) (132)
Total interest income 96 (1,117) (1,021)
Interest-bearing liabilities
Deposits of the public
In Israel 17 (164) (147)
Outside Israel 1 (64) (63)
Total 18 (228) (210)
Other interest-bearing liabilities
In Israel (4) (24) (28)
Outside Israel 3 (5) (2)
Total (1) (29) (30)
Total interest expenses 17 (257) (240)
For the three months ended 31
March
(NIS millions)
Increase (decrease) due
to change (h)
Notes:
(a) The data in these tables are shown after the effect of hedging derivative instruments.
(b) Based on monthly opening balances, except for the unlinked Israeli currency segment where the average balance is
calculated on daily figures, and before deduction of the average balance of credit loss allowances, overseas
subsidiaries on the basis of quarterly opening balances.
(c) Before deduction of the average balance of credit loss allowances. Including impaired debts not accumulating
interest income.
(d) From the average balance of bonds held for trading and bonds available for sale there has been deducted/added the
average balance of unrealized gains/losses from fair value adjustments of bonds for trading and also gains/losses in
respect of bonds available for trading that are included in shareholder's equity in the framework of accumulated
other comprehensive income under "Adjustments in respect of presentation of available for sale securities at fair
value" in respect of bonds transferred from the available for sale portfolio, in the amount of NIS 1,429 million
respectively (31 March 2015 – NIS 589 million).
(e) Including book balances of derivative instruments, other non-interest bearing assets, non-monetary assets, and after
deducting allowance for credit losses.
(f) Including book balances of derivative instruments, and non-monetary liabilities.
(g) Net yield – net interest income divided by total interest-bearing assets.
(h) The change attributed to the change in amount was calculated by multiplying the new price by the change in
amount. The change attributed to the change in price was calculated by multiplying the old amount by the change in
price.
(i) Commissions for the three and nine period in an amount of NIS 89 million have been included in interest income
from credit to the public (31 March 2015 – NIS 120 million).
(j) Reclassified.