Condensed consolidated interim financial statements€¦ · Condensed consolidated interim...
26
Condensed consolidated interim financial statements 31 March 2017
Transcript of Condensed consolidated interim financial statements€¦ · Condensed consolidated interim...

Condensed consolidated interim
financial statements
31 March 2017
Condensed consolidated interim financial statements
Contents Page
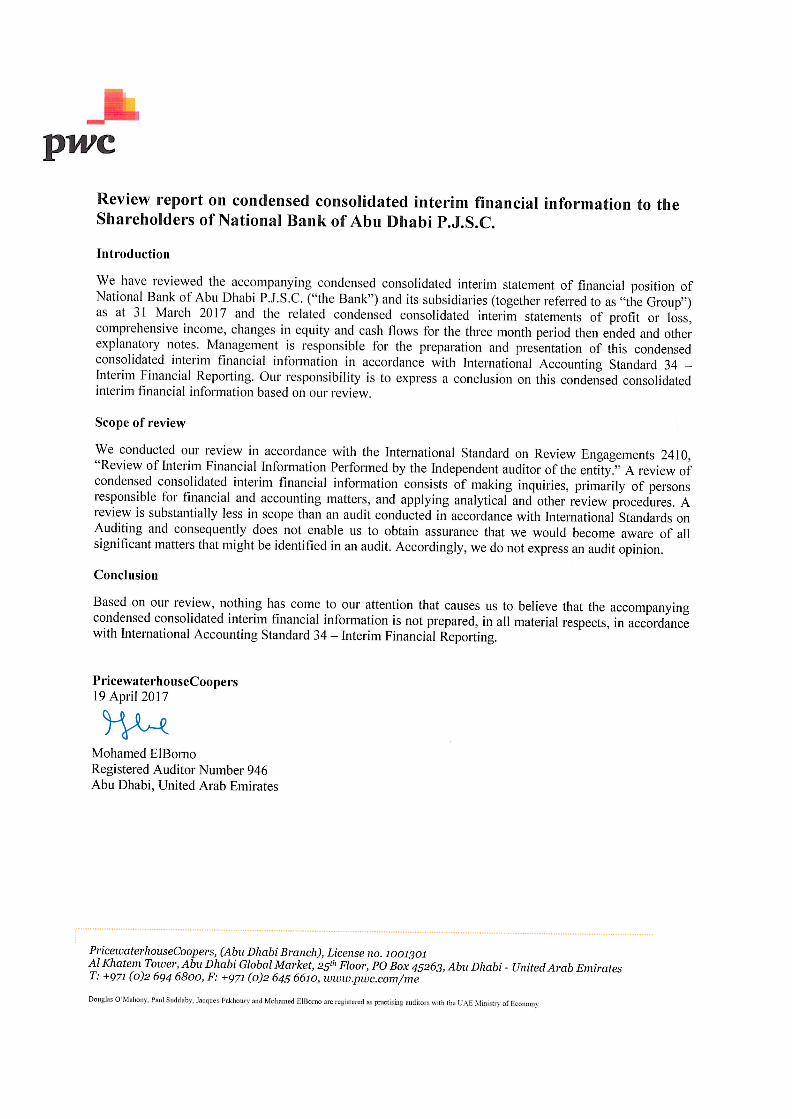
Independent auditor’s report on review of condensed consolidated interim
financial information 1
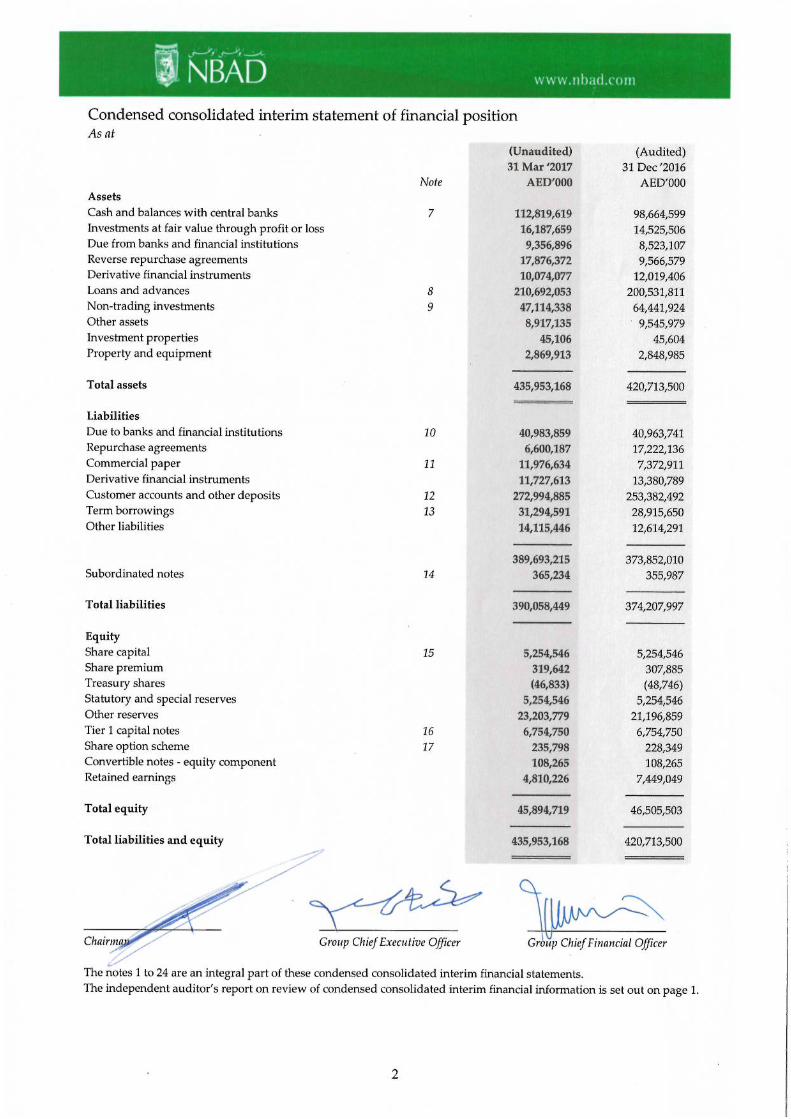
Condensed consolidated interim statement of financial position 2
Condensed consolidated interim statement of profit or loss 3
Condensed consolidated interim statement of comprehensive income 4
Condensed consolidated interim statement of changes in equity 5
Condensed consolidated interim statement of cash flows 6
Notes to the condensed consolidated interim financial statements 7 - 24
3
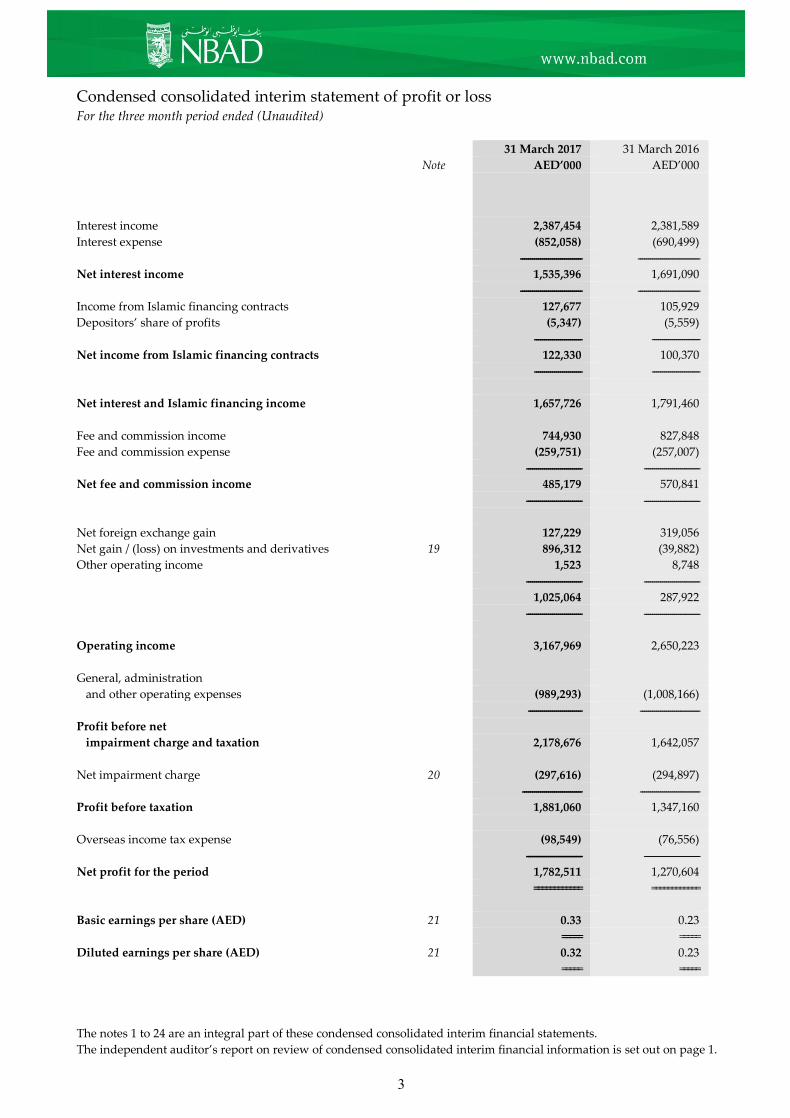
Condensed consolidated interim statement of profit or loss For the three month period ended (Unaudited)
31 March 2017 31 March 2016
Note AED’000 AED’000
Interest income 2,387,454 2,381,589
Interest expense (852,058) (690,499)
------------------------------- -------------------------------
Net interest income 1,535,396 1,691,090
------------------------------- -------------------------------
Income from Islamic financing contracts 127,677 105,929
Depositors’ share of profits (5,347) (5,559)
------------------------ ------------------------
Net income from Islamic financing contracts 122,330 100,370
------------------------ ------------------------
Net interest and Islamic financing income 1,657,726 1,791,460
Fee and commission income 744,930 827,848
Fee and commission expense (259,751) (257,007)
---------------------------- ----------------------------
Net fee and commission income 485,179 570,841
---------------------------- ----------------------------
Net foreign exchange gain 127,229 319,056
Net gain / (loss) on investments and derivatives 19 896,312 (39,882)
Other operating income 1,523 8,748
---------------------------- ----------------------------
1,025,064 287,922
---------------------------- ----------------------------
Operating income 3,167,969 2,650,223
General, administration
and other operating expenses (989,293) (1,008,166)
--------------------------- ------------------------------
Profit before net
impairment charge and taxation 2,178,676 1,642,057
Net impairment charge 20 (297,616) (294,897)
------------------------------ ------------------------------
Profit before taxation 1,881,060 1,347,160
Overseas income tax expense (98,549) (76,556)
---------------------------- ----------------------------
Net profit for the period 1,782,511 1,270,604
============ ============
Basic earnings per share (AED) 21 0.33 0.23
===== =====
Diluted earnings per share (AED) 21 0.32 0.23
===== =====
The notes 1 to 24 are an integral part of these condensed consolidated interim financial statements.
The independent auditor’s report on review of condensed consolidated interim financial information is set out on page 1.
4
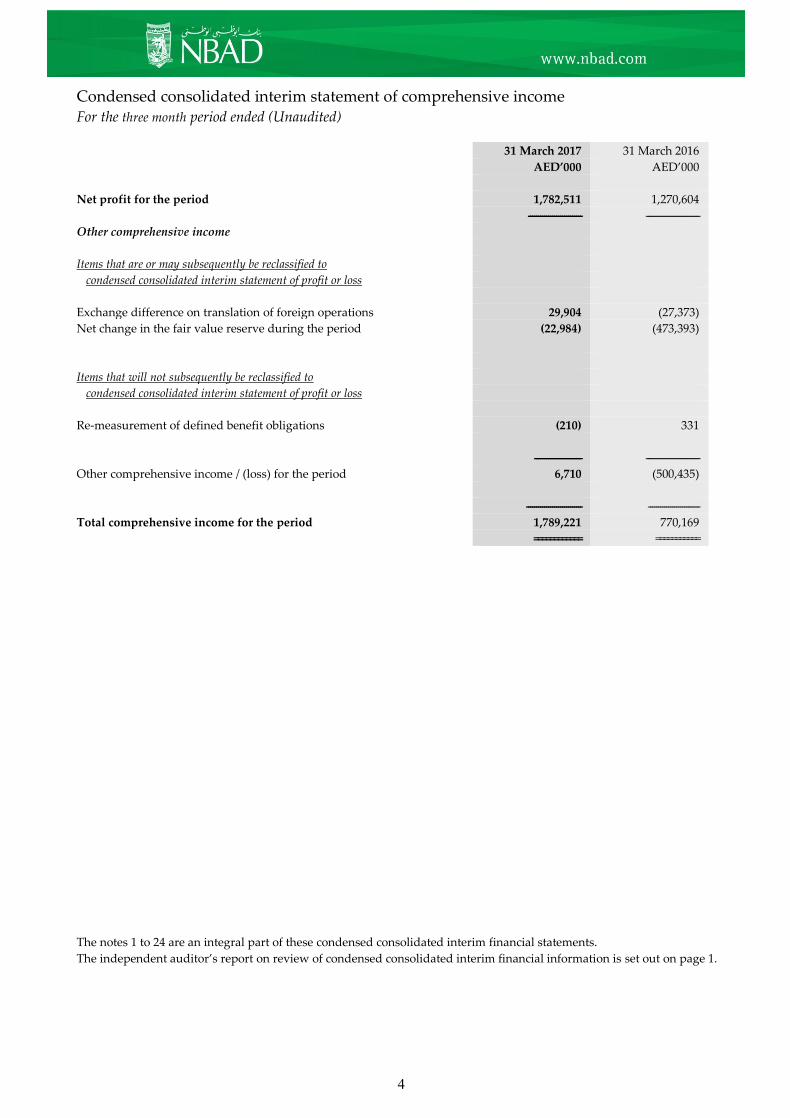
Condensed consolidated interim statement of comprehensive income For the three month period ended (Unaudited)
31 March 2017 31 March 2016
AED’000 AED’000
Net profit for the period 1,782,511 1,270,604
--------------------------- ---------------------------
Other comprehensive income
Items that are or may subsequently be reclassified to
condensed consolidated interim statement of profit or loss
Exchange difference on translation of foreign operations 29,904 (27,373)
Net change in the fair value reserve during the period (22,984) (473,393)
Items that will not subsequently be reclassified to
condensed consolidated interim statement of profit or loss
Re-measurement of defined benefit obligations (210) 331
------------------------ ---------------------------
Other comprehensive income / (loss) for the period 6,710 (500,435)
---------------------------- --------------------------
Total comprehensive income for the period 1,789,221 770,169
============ ===========
The notes 1 to 24 are an integral part of these condensed consolidated interim financial statements.
The independent auditor’s report on review of condensed consolidated interim financial information is set out on page 1.
5
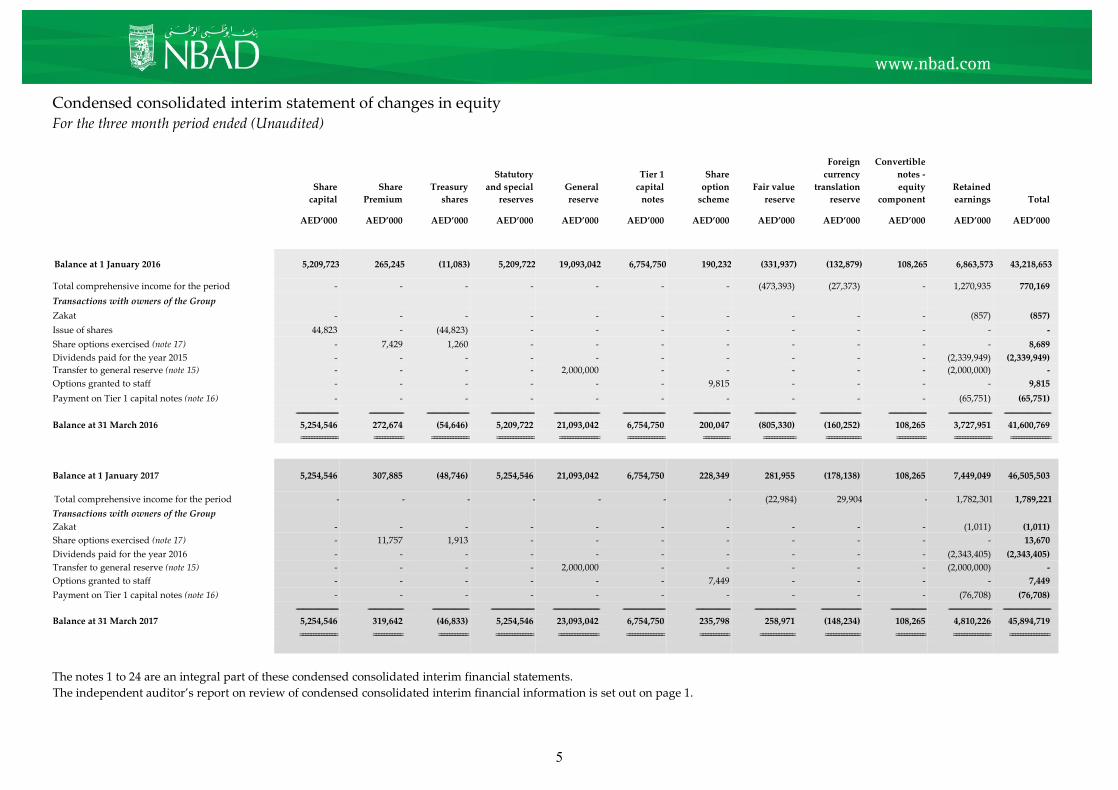
Condensed consolidated interim statement of changes in equity For the three month period ended (Unaudited)
Share
capital
Share
Premium
Treasury
shares
Statutory
and special
reserves
General
reserve
Tier 1
capital
notes
Share
option
scheme
Fair value
reserve
Foreign
currency
translation
reserve
Convertible
notes -
equity
component
Retained
earnings Total
AED’000 AED’000 AED’000 AED’000 AED’000 AED’000 AED’000 AED’000 AED’000 AED’000 AED’000 AED’000
Balance at 1 January 2016 5,209,723 265,245 (11,083) 5,209,722 19,093,042 6,754,750 190,232 (331,937) (132,879) 108,265 6,863,573 43,218,653
Total comprehensive income for the period - - - - - - - (473,393) (27,373) - 1,270,935 770,169
Transactions with owners of the Group
Zakat - - - - - - - - - - (857) (857)
Issue of shares 44,823 - (44,823) - - - - - - - - -
Share options exercised (note 17) - 7,429 1,260 - - - - - - - - 8,689
Dividends paid for the year 2015 - - - - - - - - - - (2,339,949) (2,339,949)
Transfer to general reserve (note 15) - - - - 2,000,000 - - - - - (2,000,000) -
Options granted to staff - - - - - - 9,815 - - - - 9,815
Payment on Tier 1 capital notes (note 16) - - - - - - - - - - (65,751) (65,751)
-------------------------------------- ------------------------------- -------------------------------------- --------------------------------------- ----------------------------------------- -------------------------------------- --------------------------------- ------------------------------------- ------------------------------------- ---------------------------------- --------------------------------------- ------------------------------------------
Balance at 31 March 2016 5,254,546 272,674 (54,646) 5,209,722 21,093,042 6,754,750 200,047 (805,330) (160,252) 108,265 3,727,951 41,600,769
============== =========== ============== ============== =============== ============== ========== ============ ============= =========== ============== ===============
Balance at 1 January 2017 5,254,546 307,885 (48,746) 5,254,546 21,093,042 6,754,750 228,349 281,955 (178,138) 108,265 7,449,049 46,505,503
Total comprehensive income for the period - - - - - - - (22,984) 29,904 - 1,782,301 1,789,221
Transactions with owners of the Group
Zakat - - - - - - - - - - (1,011) (1,011)
Share options exercised (note 17) - 11,757 1,913 - - - - - - - - 13,670
Dividends paid for the year 2016 - - - - - - - - - - (2,343,405) (2,343,405)
Transfer to general reserve (note 15) - - - - 2,000,000 - - - - - (2,000,000) -
Options granted to staff - - - - - - 7,449 - - - - 7,449
Payment on Tier 1 capital notes (note 16) - - - - - - - - - - (76,708) (76,708)
-------------------------------------- -------------------------------- --------------------------------- --------------------------------------- ------------------------------------------ -------------------------------------- ------------------------------- ------------------------------------- ------------------------------------ -------------------------------- --------------------------------------- -------------------------------------------
Balance at 31 March 2017 5,254,546 319,642 (46,833) 5,254,546 23,093,042 6,754,750 235,798 258,971 (148,234) 108,265 4,810,226 45,894,719
============== =========== =========== ============== =============== ============== =========== ============= ============= =========== ============== ===============
The notes 1 to 24 are an integral part of these condensed consolidated interim financial statements.
The independent auditor’s report on review of condensed consolidated interim financial information is set out on page 1.
6
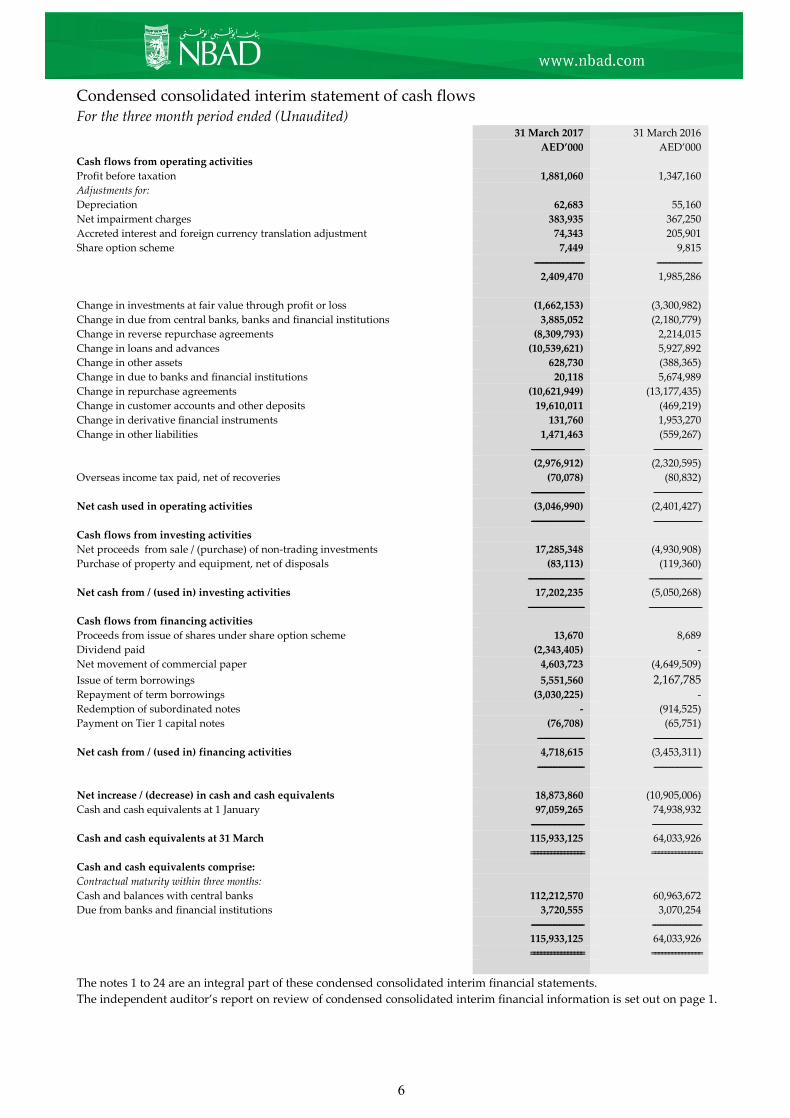
Condensed consolidated interim statement of cash flows For the three month period ended (Unaudited) 31 March 2017 31 March 2016
AED’000 AED’000
Cash flows from operating activities
Profit before taxation 1,881,060 1,347,160
Adjustments for:
Depreciation 62,683 55,160
Net impairment charges 383,935 367,250
Accreted interest and foreign currency translation adjustment 74,343 205,901
Share option scheme 7,449 9,815
-------------------------------- -----------------------------
2,409,470 1,985,286
Change in investments at fair value through profit or loss (1,662,153) (3,300,982)
Change in due from central banks, banks and financial institutions 3,885,052 (2,180,779)
Change in reverse repurchase agreements (8,309,793) 2,214,015
Change in loans and advances (10,539,621) 5,927,892
Change in other assets 628,730 (388,365)
Change in due to banks and financial institutions 20,118 5,674,989
Change in repurchase agreements (10,621,949) (13,177,435)
Change in customer accounts and other deposits 19,610,011 (469,219)
Change in derivative financial instruments 131,760 1,953,270
Change in other liabilities 1,471,463 (559,267)
---------------------------------- -------------------------------
(2,976,912) (2,320,595)
Overseas income tax paid, net of recoveries (70,078) (80,832)
---------------------------------- -------------------------------
Net cash used in operating activities (3,046,990) (2,401,427)
---------------------------------- -------------------------------
Cash flows from investing activities
Net proceeds from sale / (purchase) of non-trading investments 17,285,348 (4,930,908)
Purchase of property and equipment, net of disposals (83,113) (119,360)
------------------------------------ ----------------------------------
Net cash from / (used in) investing activities 17,202,235 (5,050,268)
------------------------------------ ----------------------------------
Cash flows from financing activities
Proceeds from issue of shares under share option scheme 13,670 8,689
Dividend paid (2,343,405) -
Net movement of commercial paper 4,603,723 (4,649,509)
Issue of term borrowings 5,551,560 2,167,785
Repayment of term borrowings (3,030,225) -
Redemption of subordinated notes - (914,525)
Payment on Tier 1 capital notes (76,708) (65,751)
------------------------------ -------------------------------
Net cash from / (used in) financing activities 4,718,615 (3,453,311)
------------------------------ -------------------------------
Net increase / (decrease) in cash and cash equivalents 18,873,860 (10,905,006)
Cash and cash equivalents at 1 January 97,059,265 74,938,932
---------------------------------- --------------------------------
Cash and cash equivalents at 31 March 115,933,125 64,033,926
================ ===============
Cash and cash equivalents comprise:
Contractual maturity within three months:
Cash and balances with central banks 112,212,570 60,963,672
Due from banks and financial institutions 3,720,555 3,070,254
---------------------------------- --------------------------------
115,933,125 64,033,926
================ ===============
The notes 1 to 24 are an integral part of these condensed consolidated interim financial statements.
The independent auditor’s report on review of condensed consolidated interim financial information is set out on page 1.

7
Notes to the condensed consolidated interim financial statements
1 Legal status and principal activities
National Bank of Abu Dhabi PJSC (the “Bank”) was established in Abu Dhabi in 1968 with limited liability and
is registered as a Public Joint Stock Company in accordance with the United Arab Emirates Federal Law No. 8
of 1984 (as amended) relating to Commercial Companies.
Its registered office address is P. O. Box 4, Abu Dhabi, United Arab Emirates. These condensed consolidated
interim financial statements as at and for the period ended 31 March 2017 comprises the Bank and its
subsidiaries (together referred to as the “Group”). The Group is primarily engaged in corporate, retail, private
and investment banking activities, management services, Islamic banking activities; and carries out its
operations through its local and overseas branches, subsidiaries and representative offices located in the United
Arab Emirates, Bahrain, Egypt, France, Oman, Kuwait, Brazil, Cayman Islands, Sudan, Libya, the United
Kingdom, Switzerland, Hong Kong, Jordan, Lebanon, Malaysia, India, China and the United States of America.
The Group’s Islamic banking activities are conducted in accordance with Islamic Sharia’a laws issued by the
Sharia’a Supervisory Board.
The Bank is listed on the Abu Dhabi Securities Exchange (Ticker: NBAD).
The parent company of the Bank is the Abu Dhabi Investment Council, an entity owned by the Government of
the Emirate of Abu Dhabi.
The consolidated financial statements of the Group as at and for the year ended 31 December 2016 are available
upon request from the Bank’s registered office or at http://www.nbad.ae.
Merger between National Bank of Abu Dhabi PJSC (“NBAD”) and First Gulf Bank PJSC (“FGB”)
On 3 July 2016, the Boards of Directors of NBAD and FGB have voted unanimously to recommend to
shareholders a merger of the two Abu Dhabi-listed banks.
Subsequently, on 7 December 2016, the proposed merger (the Merger) of the NBAD and First Gulf Bank PJSC
(FGB) was approved by the Shareholders to be effected by way of a merger pursuant to Article 283(1) of UAE
Federal Law No. 2 of 2015 Concerning Commercial Companies (the Law), through the issuance of 1.254 new
NBAD shares for every 1 share in FGB subject to the terms and conditions of the Merger.
Subsequent to the period end, the share capital of the combined bank increased from AED 5,254,545,318 to AED
10,897,545,318.
The approved merger has now been successfully completed and, following this, FGB shareholders own
approximately 52 percent of the combined bank and NBAD shareholders own approximately 48 percent. These
financial statements have been approved by the new Board.
2 Statement of compliance These condensed consolidated interim financial statements have been prepared on an ongoing basis in
accordance with IAS 34 Interim Financial Reporting and the requirements of applicable laws in the UAE. They
do not include all of the information required for full annual consolidated financial statements as required
under IFRS. These condensed consolidated interim financial statements should be read in conjunction with the
consolidated financial statements of the Group as at and for the year ended 31 December 2016.
On 1 April 2015, a new UAE Federal Law No 2 for Commercial Companies (“UAE Companies Law of 2015”)
was issued with effective date 1 July 2015. As per the transitional provisions of the new law, companies are to
ensure compliance by 30 June 2017. The Bank is in the process of adopting the new federal law and will be fully
compliant before the transitional provisions deadline.
8
Notes to the condensed consolidated interim financial statements
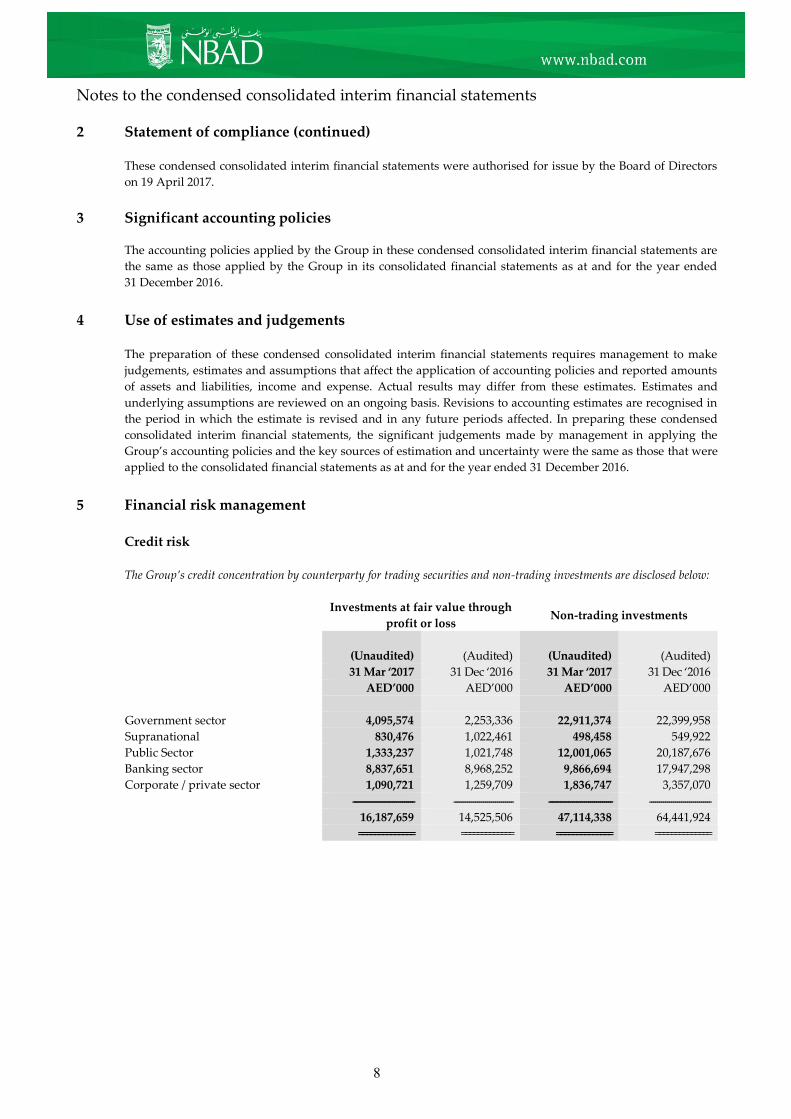
2 Statement of compliance (continued)
These condensed consolidated interim financial statements were authorised for issue by the Board of Directors
on 19 April 2017.
3 Significant accounting policies
The accounting policies applied by the Group in these condensed consolidated interim financial statements are
the same as those applied by the Group in its consolidated financial statements as at and for the year ended
31 December 2016.
4 Use of estimates and judgements
The preparation of these condensed consolidated interim financial statements requires management to make
judgements, estimates and assumptions that affect the application of accounting policies and reported amounts
of assets and liabilities, income and expense. Actual results may differ from these estimates. Estimates and
underlying assumptions are reviewed on an ongoing basis. Revisions to accounting estimates are recognised in
the period in which the estimate is revised and in any future periods affected. In preparing these condensed
consolidated interim financial statements, the significant judgements made by management in applying the
Group’s accounting policies and the key sources of estimation and uncertainty were the same as those that were
applied to the consolidated financial statements as at and for the year ended 31 December 2016.
5 Financial risk management
Credit risk
The Group’s credit concentration by counterparty for trading securities and non-trading investments are disclosed below:
Investments at fair value through
profit or loss Non-trading investments
(Unaudited) (Audited) (Unaudited) (Audited)
31 Mar ‘2017 31 Dec ‘2016 31 Mar ‘2017 31 Dec ‘2016
AED’000 AED’000 AED’000 AED’000
Government sector 4,095,574 2,253,336 22,911,374 22,399,958
Supranational 830,476 1,022,461 498,458 549,922
Public Sector 1,333,237 1,021,748 12,001,065 20,187,676
Banking sector 8,837,651 8,968,252 9,866,694 17,947,298
Corporate / private sector 1,090,721 1,259,709 1,836,747 3,357,070
------------------------------- ------------------------------ -------------------------------- -------------------------------
16,187,659 14,525,506 47,114,338 64,441,924
============== ============= ============== ==============

9
Notes to the condensed consolidated interim financial statements
5 Financial risk management (continued)
Credit risk (continued)
The external ratings for trading securities and non-trading investments are disclosed below:
Investments at fair value through
profit or loss Non-trading investments
(Unaudited) (Audited) (Unaudited) (Audited) 31 Mar ‘2017 31 Dec ‘2016 31 Mar ‘2017 31 Dec ‘2016
AED’000 AED’000 AED’000 AED’000
AAA 128,250 13,701 7,105,065 7,379,206
AA to A 12,987,366 12,238,671 30,835,670 46,484,287
BBB to B 1,951,350 1,156,151 7,503,752 8,810,341
Unrated 1,120,693 1,116,983 1,669,851 1,768,090
------------------------------- ------------------------------- ------------------------------- -------------------------------
16,187,659 14,525,506 47,114,338 64,441,924
============== ============== ============== ==============
Non-trading investment includes investment in equity instruments which do not carry credit risk.
10
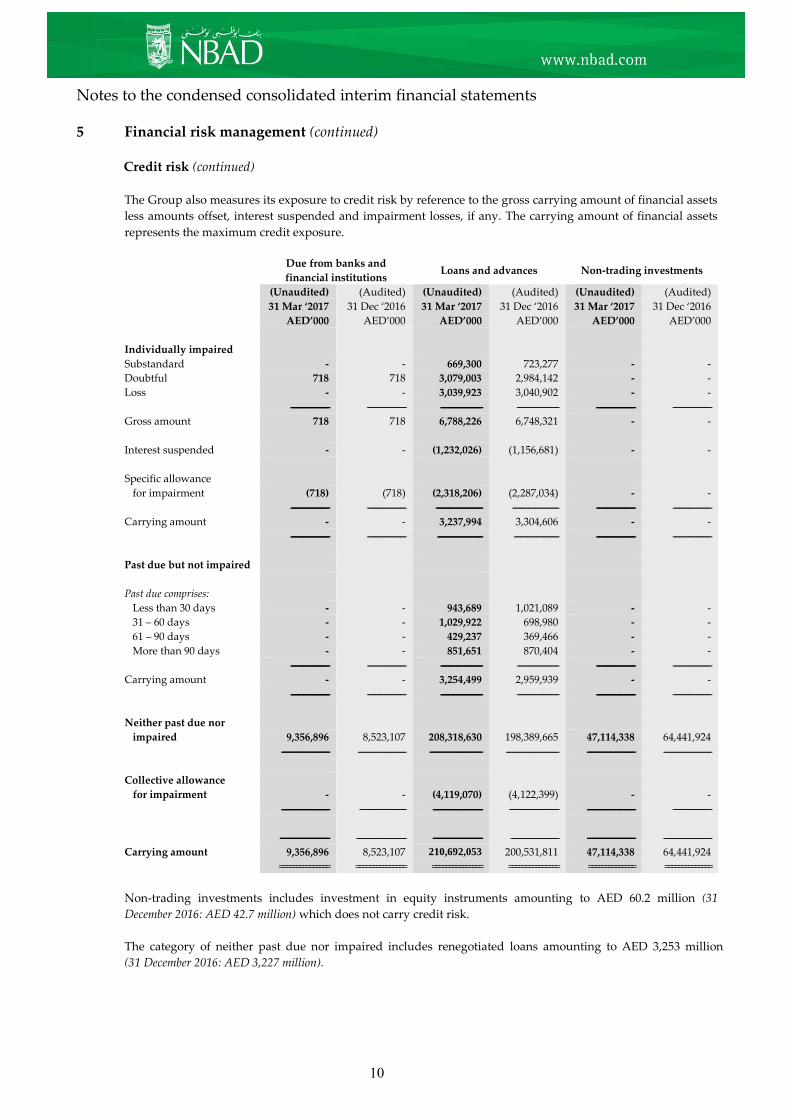
Notes to the condensed consolidated interim financial statements
5 Financial risk management (continued)
Credit risk (continued)
The Group also measures its exposure to credit risk by reference to the gross carrying amount of financial assets
less amounts offset, interest suspended and impairment losses, if any. The carrying amount of financial assets
represents the maximum credit exposure.
Due from banks and
financial institutions Loans and advances Non-trading investments
(Unaudited) (Audited) (Unaudited) (Audited) (Unaudited) (Audited)
31 Mar ‘2017 31 Dec ‘2016 31 Mar ‘2017 31 Dec ‘2016 31 Mar ‘2017 31 Dec ‘2016
AED’000 AED’000 AED’000 AED’000 AED’000 AED’000
Individually impaired
Substandard - - 669,300 723,277 - -
Doubtful 718 718 3,079,003 2,984,142 - -
Loss - - 3,039,923 3,040,902 - -
------------------------- ------------------------- --------------------------- --------------------------- ------------------------- -------------------------
Gross amount 718 718 6,788,226 6,748,321 - -
Interest suspended - - (1,232,026) (1,156,681) - -
Specific allowance
for impairment (718) (718) (2,318,206) (2,287,034) - -
------------------------- ------------------------- ------------------------------ ------------------------------ ------------------------- -------------------------
Carrying amount - - 3,237,994 3,304,606 - -
------------------------- ------------------------- ----------------------------- ----------------------------- ------------------------- -------------------------
Past due but not impaired
Past due comprises:
Less than 30 days - - 943,689 1,021,089 - -
31 – 60 days - - 1,029,922 698,980 - -
61 – 90 days - - 429,237 369,466 - -
More than 90 days - - 851,651 870,404 - -
------------------------- ------------------------- --------------------------- --------------------------- ------------------------- -------------------------
Carrying amount - - 3,254,499 2,959,939 - -
------------------------- ------------------------- --------------------------- --------------------------- ------------------------- -------------------------
Neither past due nor
impaired 9,356,896 8,523,107 208,318,630 198,389,665 47,114,338 64,441,924
------------------------------- ------------------------------- ---------------------------------- ---------------------------------- ------------------------------- -------------------------------
Collective allowance
for impairment - - (4,119,070) (4,122,399) - -
------------------------------- ------------------------------ -------------------------------- -------------------------------- ------------------------------- -------------------------
-------------------------------- -------------------------------- -------------------------------- ------------------------------- ------------------------------- -------------------------------
Carrying amount 9,356,896 8,523,107 210,692,053 200,531,811 47,114,338 64,441,924
=============== =============== =============== =============== ============== ==============
Non-trading investments includes investment in equity instruments amounting to AED 60.2 million (31
December 2016: AED 42.7 million) which does not carry credit risk.
The category of neither past due nor impaired includes renegotiated loans amounting to AED 3,253 million
(31 December 2016: AED 3,227 million).

11
Notes to the condensed consolidated interim financial statements
6 Financial assets and liabilities
Financial instruments measured at fair value - hierarchy
The table below analyses financial instruments measured at fair value at the end of the reporting period, by the
level in the fair value hierarchy into which the fair value measurement is categorised:
Level 1 Level 2 Level 3 Total
AED’000 AED’000 AED’000 AED’000
As at 31 March 2017 (Unaudited)
Financial assets held for trading 11,211,583 4,965,077 - 16,176,660
Designated at fair value through profit and loss 10,999 - - 10,999
Available-for-sale financial assets 37,376,040 3,518,076 32,911 40,927,027
Derivative financial instruments (Assets) 8,121 10,065,956 - 10,074,077
-------------------------------- -------------------------------- --------------------- ---------------------------------
48,606,743 18,549,109 32,911 67,188,763
============== ============== ========= ===============
Derivative financial instruments (Liabilities) (43,913) (11,683,700) - (11,727,613)
============== ============== ========= ===============
As at 31 December 2016 (Audited)
Financial assets held for trading 9,474,665 5,039,878 - 14,514,543
Designated at fair value through profit and loss 10,963 - - 10,963
Available-for-sale financial assets 52,546,376 5,850,227 13,705 58,410,308
Derivative financial instruments (Assets) 4,303 12,015,103 - 12,019,406
-------------------------------- -------------------------------- --------------------- ---------------------------------
62,036,307 22,905,208 13,705 84,955,220
============== ============== ========= ===============
Derivative financial instruments (Liabilities) (35,229) (13,345,560) - (13,380,789)
============== ============== ========= ===============
There were no transfers between the fair value hierarchies for any financial asset or liability except for two
bonds which moved from level 2 to level 1 amounting to AED 1,695 million (31 December 2016: AED 663
million).
The valuation techniques and inputs used in these condensed consolidated interim financial statements are
same as those prescribed in Note 6 of the consolidated financial statements of the Group as at and for the year
ended 31 December 2016.
Certain available-for-sale investment securities have been disclosed under Level 3 of the fair value hierarchy as
management has recorded these at cost in the absence of observable market data. Management has deemed cost
to be a close approximation of their fair value.
The following table shows a reconciliation from the beginning balances to the ending balances for fair value
measurements in Level 3:
(Unaudited) (Unaudited)
Three month Three month
period ended period ended
31 Mar ‘2017 31 Mar ‘2016
AED’000 AED’000
Available-for-sale financial assets
Balance as at 1 January 13,705 13,806
Purchases 19,190 -
Settlement and other adjustments 16 32
--------------------- ----------------------
Balance as at 31 March 32,911 13,838
========= =========

12
Notes to the condensed consolidated interim financial statements
7 Cash and balances with central banks
Cash and balances with central banks include Certificates of Deposit with the Central Bank of UAE amounting
to Nil (31 December 2016: AED 3 million).
8 Loans and advances
(Unaudited) (Audited)
31 Mar ‘2017 31 Dec ‘2016
AED’000 AED’000
Gross loans and advances 218,361,355 208,097,925
Less: interest suspended (1,232,026) (1,156,681)
Less: allowance for impairment (6,437,276) (6,409,433)
---------------------------------- ----------------------------------
Net loans and advances 210,692,053 200,531,811
=============== ===============
(Unaudited) (Audited)
31 Mar ‘2017 31 Dec ‘2016
AED’000 AED’000
By counterparty:
Government sector 17,916,424 17,900,011
Public sector 52,244,424 44,542,134
Banking sector 18,812,686 14,950,955
Corporate / private sector 94,263,093 94,373,935
Personal / retail sector 35,124,728 36,330,890
---------------------------------- ----------------------------------
Gross loans and advances 218,361,355 208,097,925
=============== ===============
(Unaudited) (Audited)
31 Mar ‘2017 31 Dec ‘2016
AED’000 AED’000
By product:
Overdrafts 12,844,644 8,648,300
Term loans 125,755,928 123,716,285
Trade related loans 20,418,714 16,685,277
Real estate 26,890,016 26,215,367
Mortgage loans 14,506,771 13,932,692
Personal loans 14,794,675 15,206,073
Credit cards 1,665,886 1,782,790
Vehicle financing loans 1,383,939 1,475,780
Others 100,782 435,361
--------------------------------- ----------------------------------
Gross loans and advances 218,361,355 208,097,925
=============== ===============

13
Notes to the condensed consolidated interim financial statements
8 Loans and advances (continued)
(Unaudited) (Audited)
31 Mar ‘2017 31 Dec ‘2016
AED’000 AED’000
Concentration by industry sector:
Agriculture 45,939 60,941
Energy 21,519,963 17,432,780
Manufacturing 13,007,758 14,093,970
Construction 10,639,282 10,436,678
Real estate 43,864,167 41,860,131
Trading 8,380,135 9,224,060
Transport and communication 17,318,114 19,504,913
Banks 18,812,686 14,950,955
Other financial institutions 25,800,151 20,401,184
Services 5,812,672 5,734,609
Government 17,916,424 17,900,011
Personal loans for consumption 28,036,525 28,358,847
Personal loans others 7,088,203 7,972,043
Others 119,336 166,803
---------------------------------- ----------------------------------
218,361,355 208,097,925
=============== ===============
The movement in the allowance for impairment during the period is shown below:
(Unaudited) (Unaudited)
Three month Three month
period ended period ended
31 Mar ‘2017 31 Mar ‘2016
AED’000 AED’000
Beginning of the period 6,409,433 6,124,973
Charge / (reversal) for the period
Collective provision (4,025) 2,761
Specific provision 466,141 427,908
Recoveries (73,704) (61,430)
Write-backs during the period (90,057) (75,462)
Amounts written off (270,512) (57,676)
---------------------------- ----------------------------
End of the period 6,437,276 6,361,074
============ ============

14
Notes to the condensed consolidated interim financial statements
9 Non-trading investments
(Unaudited) (Audited)
31 Mar ‘2017 31 Dec ‘2016 AED’000 AED’000
Available-for-sale investments 40,927,027 58,410,308
Held-to-maturity investments 6,187,311 6,031,616
-------------------------------- --------------------------------
47,114,338 64,441,924
============== ==============
An analysis of non-trading investments by type at the reporting date is shown below:
(Unaudited) (Audited)
31 March 2017 31 December 2016
AED’000 AED’000
--------------------------------------------------------------------------------- ---------------------------------------------------------------------------------
Quoted Unquoted Total Quoted Unquoted Total
Equity investments 16,856 43,370 60,226 18,565 24,164 42,729
Debt investments 46,631,163 381,039 47,012,202 64,207,111 160,850 64,367,961
Funds 41,899 11 41,910 31,223 11 31,234
----------------------------- ------------------------- ----------------------------- ----------------------------- ------------------------ -----------------------------
46,689,918 424,420 47,114,338 64,256,899 185,025 64,441,924
============= =========== ============= ============= ========== =============
Debt instruments under repurchase agreements included in non-trading investments at 31 March 2017
amounted to AED 1,793 million (31 December 2016: AED 11,240 million).
10 Due to banks and financial institutions
Due to banks and financial institutions include balances due to central banks amounting to AED 13,261 million
(31 December 2016: AED 13,165 million).
11 Commercial paper
The Bank has established two Commercial Paper Programmes, the “Euro commercial paper programme” and a
“US Dollar commercial paper programme” of USD 5 billion each.
These notes have maturity periods of up to 397 days.
15
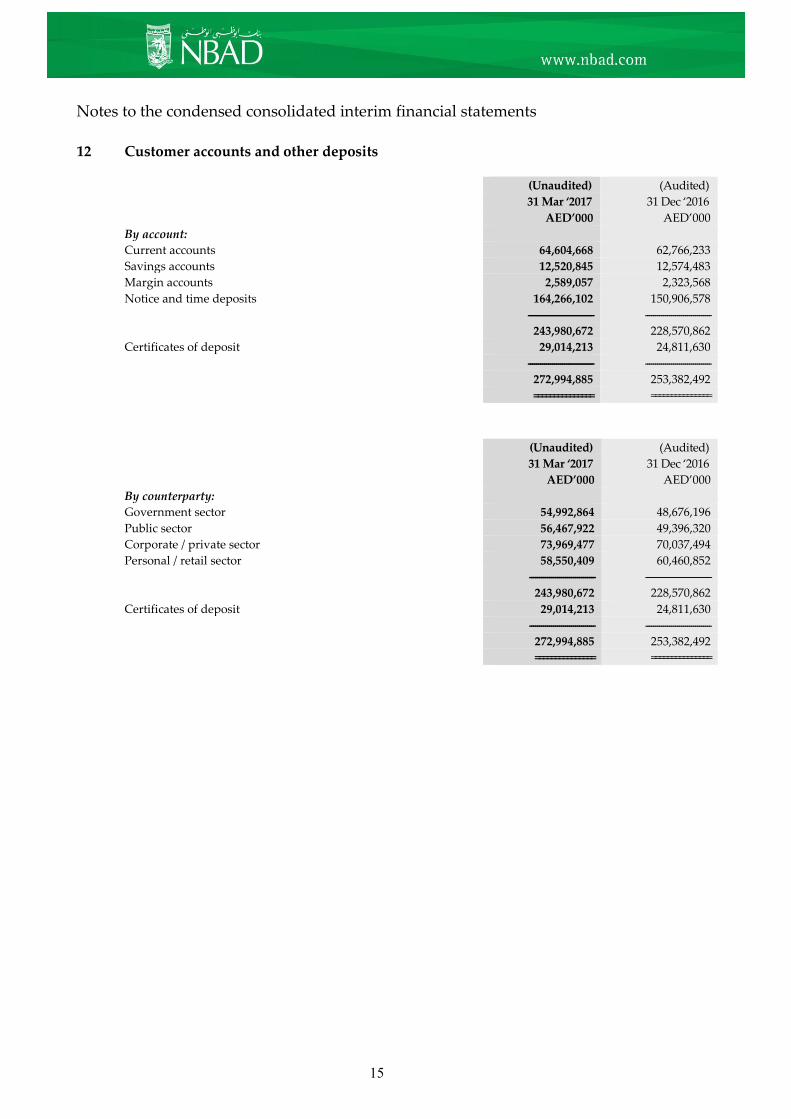
Notes to the condensed consolidated interim financial statements
12 Customer accounts and other deposits
(Unaudited) (Audited)
31 Mar ‘2017 31 Dec ‘2016
AED’000 AED’000
By account:
Current accounts 64,604,668 62,766,233
Savings accounts 12,520,845 12,574,483
Margin accounts 2,589,057 2,323,568
Notice and time deposits 164,266,102 150,906,578
--------------------------------- ---------------------------------
243,980,672 228,570,862
Certificates of deposit 29,014,213 24,811,630
--------------------------------- ---------------------------------
272,994,885 253,382,492
=============== ===============
(Unaudited) (Audited)
31 Mar ‘2017 31 Dec ‘2016
AED’000 AED’000
By counterparty:
Government sector 54,992,864 48,676,196
Public sector 56,467,922 49,396,320
Corporate / private sector 73,969,477 70,037,494
Personal / retail sector 58,550,409 60,460,852
--------------------------------- ---------------------------------
243,980,672 228,570,862
Certificates of deposit 29,014,213 24,811,630
--------------------------------- ---------------------------------
272,994,885 253,382,492
=============== ===============
16
Notes to the condensed consolidated interim financial statements
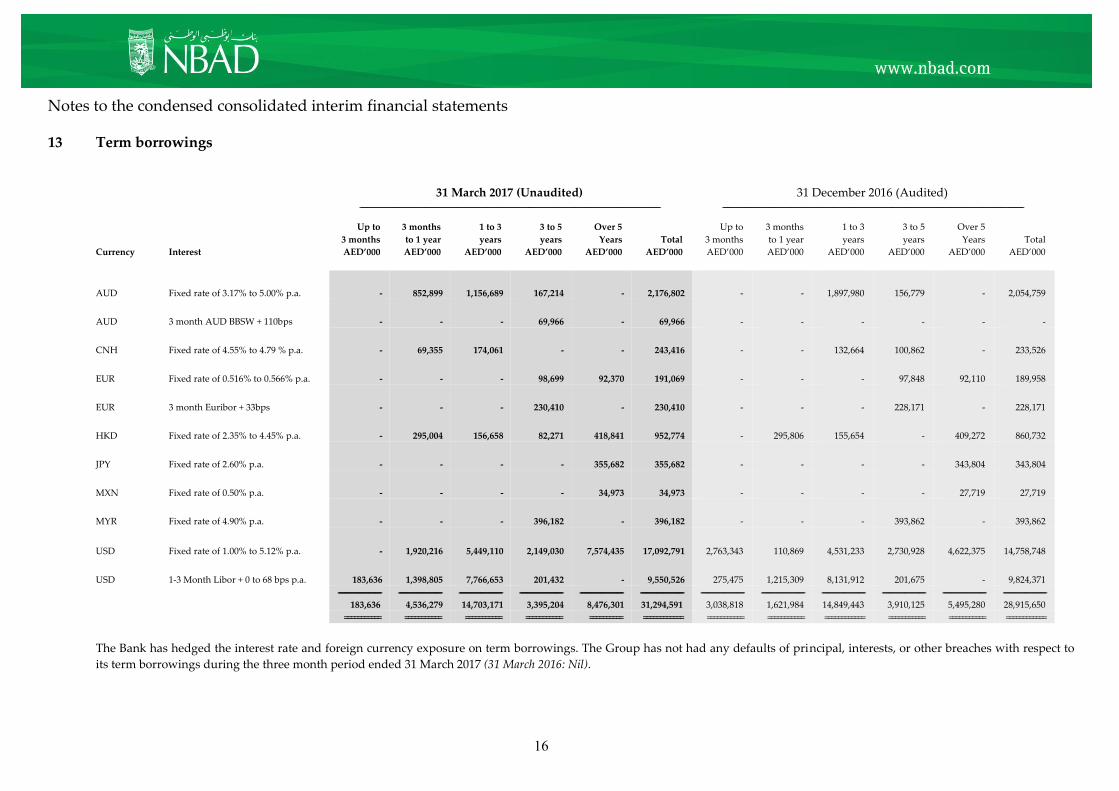
13 Term borrowings
31 March 2017 (Unaudited) 31 December 2016 (Audited) -------------------------------------------------------------------------------------------------------------------------------------------------------------------------------------------------------------------------------------------------------------------------------- --------------------------------------------------------------------------------------------------------------------------------------------------------------------------------------------------------------------------------------------------------------------------------
Up to 3 months 1 to 3 3 to 5 Over 5 Up to 3 months 1 to 3 3 to 5 Over 5
3 months to 1 year years years Years Total 3 months to 1 year years years Years Total
Currency Interest AED’000 AED’000 AED’000 AED’000 AED’000 AED’000 AED’000 AED’000 AED’000 AED’000 AED’000 AED’000
AUD Fixed rate of 3.17% to 5.00% p.a.
-
852,899
1,156,689
167,214
-
2,176,802 - - 1,897,980 156,779 - 2,054,759
AUD 3 month AUD BBSW + 110bps
-
-
-
69,966
-
69,966 - - - - - -
CNH Fixed rate of 4.55% to 4.79 % p.a.
-
69,355
174,061
-
-
243,416 - - 132,664 100,862 - 233,526
EUR Fixed rate of 0.516% to 0.566% p.a.
-
-
-
98,699
92,370
191,069 - - - 97,848 92,110 189,958
EUR 3 month Euribor + 33bps
-
-
-
230,410
-
230,410 - - - 228,171 - 228,171
HKD Fixed rate of 2.35% to 4.45% p.a.
-
295,004
156,658
82,271
418,841
952,774 - 295,806 155,654 - 409,272 860,732
JPY Fixed rate of 2.60% p.a.
-
-
-
-
355,682
355,682 - - - - 343,804 343,804
MXN Fixed rate of 0.50% p.a.
-
-
-
-
34,973
34,973 - - - - 27,719 27,719
MYR Fixed rate of 4.90% p.a.
-
-
-
396,182
-
396,182 - - - 393,862 - 393,862
USD Fixed rate of 1.00% to 5.12% p.a.
-
1,920,216
5,449,110
2,149,030
7,574,435
17,092,791 2,763,343 110,869 4,531,233 2,730,928 4,622,375 14,758,748
USD 1-3 Month Libor + 0 to 68 bps p.a.
183,636
1,398,805
7,766,653
201,432
-
9,550,526 275,475 1,215,309 8,131,912 201,675 - 9,824,371
--------------------------------------- --------------------------------------- --------------------------------------- --------------------------------------- --------------------------------------- --------------------------------------- --------------------------------------- --------------------------------------- --------------------------------------- --------------------------------------- --------------------------------------- ---------------------------------------
183,636 4,536,279 14,703,171 3,395,204 8,476,301 31,294,591 3,038,818 1,621,984 14,849,443 3,910,125 5,495,280 28,915,650
=========== =========== =========== =========== ========== ============ =========== =========== ============ =========== =========== ============
The Bank has hedged the interest rate and foreign currency exposure on term borrowings. The Group has not had any defaults of principal, interests, or other breaches with respect to
its term borrowings during the three month period ended 31 March 2017 (31 March 2016: Nil).

17
Notes to the condensed consolidated interim financial statements
13 Term borrowings (continued)
During the period, the Bank has issued various fixed and floating rate notes. The nominal values of the notes
issued during the period are stated below:
(Unaudited) (Unaudited)
Three month Three month
period ended period ended
31 Mar ‘2017 31 Mar ‘2016
AED’000 AED’000
AUD 70,067 -
CNH - 147,635
HKD 81,776 -
USD 5,406,656 550,950
----------------------------- --------------------------
5,558,499 698,585
=============== =============
14 Subordinated notes
(Unaudited) (Audited)
31 Mar ‘2017 31 Dec ‘2016
AED’000 AED’000
10 December 2012 issue 365,234 355,987
========== ==========
The Bank has hedged the interest rate and foreign currency exposure on certain subordinated notes. The Group
has not had any defaults of principal, interests, or other breaches with respect to its subordinated notes during
the three month period ended 31 March 2017 (31 March 2016: None).
15 Capital and reserves
Share capital
At the Annual General Meeting (AGM) held on 28 February 2017, the shareholders of the Bank approved a cash
dividend of AED 0.45 per ordinary share (31 December 2016: AED 0.45 per ordinary share).
The general reserve is available for distribution to the shareholders at the recommendation of the Board of
Directors. On 28 February 2017, the AGM approved the transfer of AED 2 billion (31 December 2016: AED 2
billion) to general reserve.
18
Notes to the condensed consolidated interim financial statements
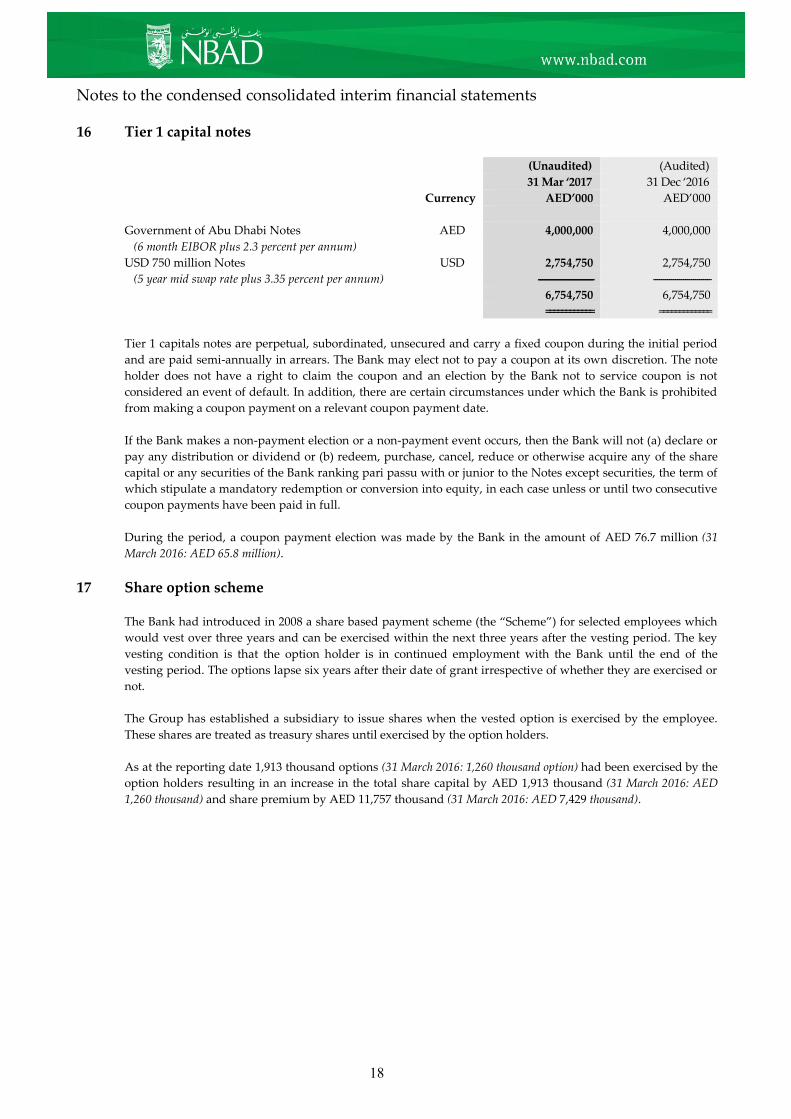
16 Tier 1 capital notes
(Unaudited) (Audited)
31 Mar ‘2017 31 Dec ‘2016
Currency AED’000 AED’000
Government of Abu Dhabi Notes AED 4,000,000 4,000,000
(6 month EIBOR plus 2.3 percent per annum)
USD 750 million Notes USD 2,754,750 2,754,750
(5 year mid swap rate plus 3.35 percent per annum) ---------------------------- -----------------------------
6,754,750 6,754,750
============ =============
Tier 1 capitals notes are perpetual, subordinated, unsecured and carry a fixed coupon during the initial period
and are paid semi-annually in arrears. The Bank may elect not to pay a coupon at its own discretion. The note
holder does not have a right to claim the coupon and an election by the Bank not to service coupon is not
considered an event of default. In addition, there are certain circumstances under which the Bank is prohibited
from making a coupon payment on a relevant coupon payment date.
If the Bank makes a non-payment election or a non-payment event occurs, then the Bank will not (a) declare or
pay any distribution or dividend or (b) redeem, purchase, cancel, reduce or otherwise acquire any of the share
capital or any securities of the Bank ranking pari passu with or junior to the Notes except securities, the term of
which stipulate a mandatory redemption or conversion into equity, in each case unless or until two consecutive
coupon payments have been paid in full.
During the period, a coupon payment election was made by the Bank in the amount of AED 76.7 million (31
March 2016: AED 65.8 million).
17 Share option scheme
The Bank had introduced in 2008 a share based payment scheme (the “Scheme”) for selected employees which
would vest over three years and can be exercised within the next three years after the vesting period. The key
vesting condition is that the option holder is in continued employment with the Bank until the end of the
vesting period. The options lapse six years after their date of grant irrespective of whether they are exercised or
not.
The Group has established a subsidiary to issue shares when the vested option is exercised by the employee.
These shares are treated as treasury shares until exercised by the option holders.
As at the reporting date 1,913 thousand options (31 March 2016: 1,260 thousand option) had been exercised by the
option holders resulting in an increase in the total share capital by AED 1,913 thousand (31 March 2016: AED
1,260 thousand) and share premium by AED 11,757 thousand (31 March 2016: AED 7,429 thousand).

19
Notes to the condensed consolidated interim financial statements
18 Commitments and contingencies
The Group, in the ordinary course of business, enters into various types of transactions that involve
undertaking certain commitments such as letters of credit, guarantees and undrawn loan commitments.
Undrawn commitments to extend credit amounted to AED 31,999 million (31 December 2016: AED 30,519
million).
There were no other significant changes in contingent liabilities and commitments during the period other than
those arising out of normal course of business.
19 Net gain / (loss) on investments and derivatives
(Unaudited) (Unaudited)
Three month Three month
period ended period ended
31 Mar ‘2017 31 Mar ‘2016
AED’000 AED’000
Net realised and unrealised gain / (loss) on investments at fair
value through profit or loss and derivatives 336,777 (53,685)
Net gain from sale of non-trading investments 541,504 4,924
Dividend income 18,031 8,879
----------------------- -----------------------
896,312 (39,882)
========== ==========
20 Net impairment charge
(Unaudited) (Unaudited)
Three month Three month
period ended period ended
31 Mar ‘2017 31 Mar ‘2016
AED’000 AED’000
Collective provision for loans and advances (4,025) 2,761
Specific provision for loans and advances 466,141 427,908
Write back of provisions for loans and advances (90,057) (75,462)
Recovery of loan loss provisions (73,704) (61,430)
Recovery of loans previously written off (12,615) (10,923)
Write-off of impaired financial assets 11,763 12,043
Impairment of other financial assets 113 -
------------------------ ------------------------
297,616 294,897
========== ==========
20
Notes to the condensed consolidated interim financial statements
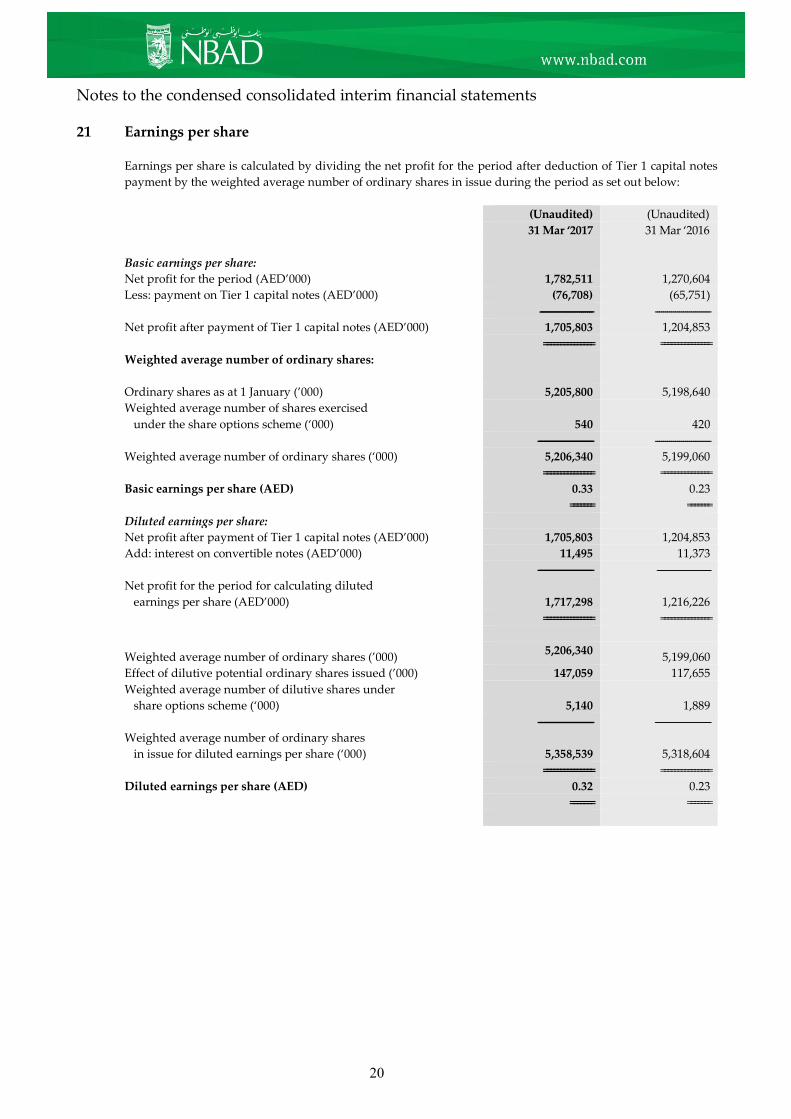
21 Earnings per share
Earnings per share is calculated by dividing the net profit for the period after deduction of Tier 1 capital notes
payment by the weighted average number of ordinary shares in issue during the period as set out below:
(Unaudited) (Unaudited)
31 Mar ‘2017 31 Mar ‘2016
Basic earnings per share:
Net profit for the period (AED’000) 1,782,511 1,270,604
Less: payment on Tier 1 capital notes (AED’000) (76,708) (65,751)
--------------------------- ----------------------------
Net profit after payment of Tier 1 capital notes (AED’000) 1,705,803 1,204,853
=============== ===============
Weighted average number of ordinary shares:
Ordinary shares as at 1 January (’000) 5,205,800 5,198,640
Weighted average number of shares exercised
under the share options scheme (‘000) 540 420
---------------------------- ----------------------------
Weighted average number of ordinary shares (‘000) 5,206,340 5,199,060
=============== ===============
Basic earnings per share (AED) 0.33 0.23
======= =======
Diluted earnings per share:
Net profit after payment of Tier 1 capital notes (AED’000) 1,705,803 1,204,853
Add: interest on convertible notes (AED’000) 11,495 11,373
---------------------------- ---------------------------
Net profit for the period for calculating diluted
earnings per share (AED’000) 1,717,298 1,216,226
=============== ===============
Weighted average number of ordinary shares (’000) 5,206,340
5,199,060
Effect of dilutive potential ordinary shares issued (’000) 147,059 117,655
Weighted average number of dilutive shares under
share options scheme (‘000) 5,140 1,889
---------------------------- ----------------------------
Weighted average number of ordinary shares
in issue for diluted earnings per share (‘000) 5,358,539 5,318,604
=============== ===============
Diluted earnings per share (AED) 0.32 0.23
======= =======

21
Notes to the condensed consolidated interim financial statements
22 Segmental information
Business Segment Geographic Segment
_________________________________________________________________________ ______________________________________________________________
Global
Global Global Retail and Head
Wholesale Wealth Commercial Office Total UAE Gulf International Total
AED’000 AED’000 AED’000 AED’000 AED’000 AED’000 AED’000 AED’000 AED’000
For the three month period ended 31 March 2017 (Unaudited)
Net Interest income 630,450 136,462 694,082 196,732 1,657,726 1,405,480 55,384 196,862 1,657,726
Net Non-interest income 816,079 67,127 239,689 387,348 1,510,243 1,259,050 27,075 224,118 1,510,243
Operating income 1,446,529 203,589 933,771 584,080 3,167,969 2,664,530 82,459 420,980 3,167,969
============= ============= ============= ============= ============= ============= =============
General administration and other
operating expenses 340,076 87,898 493,107 68,212 989,293 809,224 39,249 140,820 989,293
Net impairment charge (405) 8,298 199,229 90,494 297,616 319,705 (528) (21,561) 297,616
============= ============= ============= ============= ============= ============= =============
Profit before taxation 1,106,858 107,393 241,435 425,374 1,881,060 1,535,601 43,738 301,721 1,881,060
============= ============= ============= ============= ============= ============= =============
Overseas taxation 48,684 40,440 8,445 980 98,549 1,400 4,640 92,509 98,549
============= ============= ============= ============= ============= ============= =============
Net profit for the period 1,058,174 66,953 232,990 424,394 1,782,511 1,534,201 39,098 209,212 1,782,511
============= ============= ============= ============= ============= ============= =============
As at 31 March 2017 (Unaudited)
Segment total assets 314,337,588 31,056,323 70,986,292 75,713,821 492,094,024 335,349,473 10,288,193 141,711,697 487,349,363
================= =============== =============== =============== ================ ============= ===============
Inter segment balances (56,140,856) (51,396,195)
----------------------------------- -----------------------------------
Total assets 435,953,168 435,953,168
================ ================
Segment total liabilities 310,210,187 30,327,272 68,457,765 37,204,081 446,199,305 294,950,674 8,729,143 137,774,827 441,454,644
================= =============== =============== =============== ================ ============= ===============
Inter segment balances (56,140,856) (51,396,195)
---------------------------------- -----------------------------------
Total liabilities 390,058,449 390,058,449
================ ================

22
Notes to the condensed consolidated interim financial statements
22 Segmental information (continued)
Business Segment Geographic Segment
_________________________________________________________________________ ______________________________________________________________
Global
Global Global Retail and Head
Wholesale Wealth Commercial Office Total UAE Gulf International Total
AED’000 AED’000 AED’000 AED’000 AED’000 AED’000 AED’000 AED’000 AED’000
For the three month period ended 31 March 2016 (Unaudited)
Net Interest income 729,275 163,034 701,940 197,211 1,791,460 1,481,650 58,270 251,540 1,791,460
Net Non-interest income 547,446 53,693 250,133 7,491 858,763 664,089 17,242 177,432 858,763
Operating income 1,276,721 216,727 952,073 204,702 2,650,223 2,145,739 75,512 428,972 2,650,223
============= ============= ============= ============= ============= ============= =============
General administration and other
operating expenses 353,631 91,255 561,313 1,967 1,008,166 809,006 39,007 160,153 1,008,166
Net impairment charge (51,873) 6,920 289,956 49,894 294,897 323,029 10,920 (39,052) 294,897
============= ============= ============= ============= ============= ============= =============
Profit before taxation 974,963 118,552 100,804 152,841 1,347,160 1,013,704 25,585 307,871 1,347,160
============= ============= ============= ============= ============= ============= =============
Overseas taxation 50,045 16,160 10,841 (490) 76,556 - 4,212 72,344 76,556
============= ============= ============= ============= ============= ============= =============
Net profit for the period 924,918 102,392 89,963 153,331 1,270,604 1,013,704 21,373 235,527 1,270,604
============= ============= ============= ============= ============= ============= =============
As at 31 December 2016 (Audited)
Segment total assets 293,410,184 31,077,857 70,699,081 71,714,104 466,901,226 327,431,825 9,452,008 126,226,766 463,110,599
================= =============== =============== =============== ================ ============= ===============
Inter segment balances (46,187,726) (42,397,099)
----------------------------------- -----------------------------------
Total assets 420,713,500 420,713,500
================ ================
Segment total liabilities 287,196,939 30,069,164 68,152,349 34,977,271 420,395,723 286,648,484 7,924,196 122,032,416 416,605,096
================= =============== =============== =============== ================ ============= ===============
Inter segment balances (46,187,726) (42,397,099)
---------------------------------- -----------------------------------
Total liabilities 374,207,997 374,207,997
================ ================

23
Notes to the condensed consolidated interim financial statements
23 Related parties
Identity of related parties
Parties are considered to be related if one party has the ability to control the other party or exercise significant
influence over the other party in making financial or operational decisions. Related parties comprise major
shareholder, directors and key management personnel of the Group. Key management personnel comprise
those executive committee members “EXCO” of the Group who are involved in the strategic planning and
decision making of the Group. The terms of these transactions are approved by the Group’s management and
are made on terms agreed by the Board of Directors or management.
Parent and ultimate controlling party
Pursuant to the provisions of Law No. 16 of 2006, Abu Dhabi Investment Council (the “Council”) was
established which holds 69.17% (31 December 2016: 69.82%) of the issued share capital of the Bank.
Compensation of directors and key management personnel
(Unaudited) (Unaudited)
31 Mar ‘2017 31 Mar ‘2016
AED’000 AED’000
Key management compensation
Short term employment benefits 21,287 30,793
Post-employment benefits 86 514
Termination benefits 477 463
Share based payments 1,261 2,869
========= =========
Directors’ remuneration 2,580 2,668
========= =========
During the period, a coupon payment election of AED 76.7 million (31 March 2016: AED 65.8 million) was made
by the Bank in relation to the AED 4 billion (31 December 2016: AED 4 billion) Government of Abu Dhabi Tier 1
capital notes.
Terms and conditions
Financial assets and liabilities are granted and accepted in various currency denominations and for various time
periods. Interest rates earned on such financial assets extended to related parties in various currencies during
the period range from negative 0.5% to 7.63% per annum (31 March 2016: negative 0.10% to 8.50% per annum)
and interest rates incurred on financial liabilities placed by related parties in various currencies during the
period range from nil to 10.25% per annum (31 March 2016: nil to 6.00% per annum).
Collaterals against lending to related parties range from being nil to fully secure.

24
Notes to the condensed consolidated interim financial statements
23 Related parties (continued)
Directors
and key
management
Major
shareholder Others
(Unaudited)
31 Mar ‘2017
(Audited)
31 Dec ‘2016
Total Total
AED’000 AED’000 AED’000 AED’000 AED’000
Balances with related parties at the reporting date are shown below:
Financial assets 880,635 14,877,958 57,735,428 73,494,021 71,257,297
============ ============ ============== ============== ============== Financial liabilities 437,141 5,712,658 73,845,540 79,995,339 66,257,586
============ ============ ============== ============== ============== Contingent liabilities 278,540 1,428,464 13,898,894 15,605,898 16,041,447
============ ============ ============== ============== ==============
Transactions carried out during the three month period with related parties are shown below:
(Unaudited)
31 Mar ‘2016
Interest income 8,538 214,596 397,421 620,555 599,002
============ ============ ============ ============ ============ Interest expense 185 152,465 146,556 299,206 192,224
============ ============ ============ ============ ============ Fee and commission income 422 705 8,355 9,482 14,751
============ ============ ============ ============ ============
Others comprise Government of Abu Dhabi entities.
No allowances for impairment have been recognised against loans and advances extended to related parties or
contingent liabilities issued in favour of related parties during the period (31 March 2016: AED nil).
24 Comparative figures
Certain comparative figures have been reclassified where appropriate to conform to the presentation and
accounting policies adopted in these condensed consolidated interim financial statements.
During the period, the Group revisited the basis of allocation around centrally held profit & losses and other
inter-segmental allocations resulting in a restatement of comparative segmental information.