
Concrete Structures Subjected to Fragment Impacts · 2019-06-13 · Concrete Structures Chalmers...
156
Concrete Structures Subjected to Fragment Impacts Dynamic Behaviour and Material Modelling JOOSEF LEPPÄNEN Department of Structural Engineering and Mechanics Concrete Structures CHALMERS UNIVERSITY OF TECHNOLOGY Göteborg, Sweden, 2004
Transcript of Concrete Structures Subjected to Fragment Impacts · 2019-06-13 · Concrete Structures Chalmers...
Concrete Structures Subjected to Fragment Impacts Dynamic Behaviour and Material Modelling JOOSEF LEPPÄNEN Department of Structural Engineering and Mechanics Concrete Structures CHALMERS UNIVERSITY OF TECHNOLOGY Göteborg, Sweden, 2004

THESIS FOR THE DEGREE OF DOCTOR OF PHILOSOPHY
Concrete Structures Subjected to Fragment Impacts
Dynamic Behaviour and Material Modelling
JOOSEF LEPPÄNEN
Department of Structural Engineering and Mechanics Concrete Structures CHALMERS UNIVERSITY OF TECHNOLOGY
Göteborg, Sweden, 2004
Concrete Structures Subjected to Fragment Impacts Dynamic Behaviour and Material Modelling JOOSEF LEPPÄNEN ISBN 91-7291-511-0
© JOOSEF LEPPÄNEN, 2004
Doktorsavhandlingar vid Chalmers tekniska högskola Ny serie nr. 2193 ISSN 0346-718x ISSN 1651-8357 Publication 04:4 Archive no. 31 Department of Structural Engineering and Mechanics Concrete Structures Chalmers University of Technology SE-412 96 Göteborg Sweden Telephone: + 46 (0)31-772 1000 Cover: Fragment impacting a concrete target; see Figure 5.8. Chalmers Reproservice / Department of Structural Engineering and Mechanics Göteborg, Sweden, 2004
Concrete Structures Subjected to Fragment Impacts Dynamic Behaviour and Material Modelling JOOSEF LEPPÄNEN Department of Structural Engineering and Mechanics Concrete Structures Chalmers University of Technology
ABSTRACT
As concrete is commonly used for protective structures, how a blast wave and fragment impacts from an explosion affect the concrete is an important issue. Concrete subjected to explosive loading responds very differently from statically loaded structures. The compressive and tensile strengths and the initial stiffness increase due to the strain rate effects. When fragments penetrate, spalling occur at the impact zone and scabbing may occur on the reverse side of a wall, or even perforation, with a risk of injury to people inside the structure. The principal aim of this thesis is to improve the current knowledge of the behaviour of concrete structures subjected to blast and fragment impacts. The main focus is on numerical modelling of fragment impacts on plain concrete members. In addition, experiments in combination with numerical analyses were conducted to deepen the understanding of concrete subjected to blast wave and fragment impacts. In the experiments, both multiple and single fragments were shot at thick concrete blocks. To capture the response of the concrete material behaviour, both the fragment impacts and the blast wave must be taken into account. The damage in the spalling zone is caused by the fragment impacts, whereas the major stress wave that propagates is caused mainly by the blast wave. To predict the penetration depth of the fragment impacts, spalling and scabbing in concrete with numerical methods, material models that take into account the strain rate effect, large deformations and triaxial stress states are required. The depth of penetration depends mainly on the compressive strength of the concrete. However, to model cracking, spalling and scabbing correctly in concrete, the tensile behaviour is very important. The RHT model in AUTODYN was used for the numerical analyses. The RHT model does not describe the concrete behaviour in tension accurately: the softening is linear and the strain rate dependency does not fit experimental results. Hence, a bi-linear softening law and a strain rate law were implemented in the model. By parametrical studies it was shown that the tensile strength, fracture energy and the strain rate law influenced the cracking and scabbing of concrete. By implementing the bi-linear softening law and a modified strain rate dependent law, the results of the numerical analyses were improved for projectile and fragment impacts on concrete.
Key words: concrete; fragment and projectile impacts; blast wave; numerical simulations; penetration; perforation; spalling; scabbing; dynamic loading; strain rate.
I
Splitterbelastade betongkonstruktioner Dynamiska egenskaper och materialmodellering JOOSEF LEPPÄNEN Institutionen för konstruktion och mekanik Betongbyggnad Chalmers tekniska högskola
SAMMANFATTNING
Skyddsrum är oftast betongkonstruktioner. En viktig frågeställning är hur betongen påverkas av stötvåg- och splitterbelastning orsakad av en explosion. Betongkonstruktioner utsatta för explosionslaster där en stötvåg utbreder sig och splitter träffar konstruktionen uppför sig mycket annorlunda än konstruktioner som är utsatta för statisk belastning. Betongens tryck- och draghållfasthet och den initiella styvheten ökar på grund av ökad töjningshastighet. Betongen utsatt för denna typ av belastning erhåller kraftig sprickbildning och kratrar uppstår när splittret träffar betongen. När splittret penetrerar betongen djupt, kan utstötning ske på motsatta sidan av anslaget, eller till och med genomträngning, med risk för skada att personer inuti byggnaden.
Målsättningen med avhandlingen är att öka kunskapen om betongkonstruktioner utsatta för stötvågs- och splitterbelastning. Arbetet har huvudsakligen varit inriktat på numerisk modellering av splitterbelastning. Dock har även experiment i kombination med numeriska analyser genomförts i detta arbete, där tjocka betongblock har skjutits med stötvåg- och splitterbelastning. För att fånga betongens respons vid stötvågs- och splitterbelastning i numeriska analyser är det nödvändigt att både splitter och stötvågen beaktas. Splittret orsakar avskalning på ytan medan spänningsvågen som propagerar är huvudsakligen orsakad av stötvågen.
För att kunna följa penetrationsförlopp i betong med numeriska metoder behövs materialmodeller där töjningshastighetsinverkan, stora deformationer och triaxiella spänningstillstånd kan beaktas. Inträngningsdjupet styrs huvudsakligen av betongens förmåga att motstå tryckkrafter. För att noggrant modellera sprickbildning, kraterbildning och utstötning i betong är betongens materialegenskaper vid drag mycket viktigt. RHT modellen i programmet AUTODYN har nyttjats för de numeriska beräkningarna. RHT modellen beskriver inte noggrant betongens materialegenskaper vid drag, då betongens mjuknande beskrivs med ett linjärt samband och töjningshastighets beroende i modellen följer inte experimentella resultat. För att öka noggrannheten i de numeriska analyserna för projektil- och splitterbelastning har ett bi-linjärt mjuknande och ett modifierat töjningshastighetsberoende implementerats i RHT modellen. Parameterstudier har visat att betongens draghållfasthet, brottenergi samt töjningshastighetsberoendet påverkar betongens sprickbildning och utstötning. För projektil- och splitterbelastning har noggrannheten ökat i de numeriska analyserna genom dessa implementeringar.
Nyckelord: betong; splitter; projektil; stötvåg; numerisk simulering; penetration; perforering; kraterbildning; utstötning; dynamisk belastning; töjningshastighet.
II
LIST OF PUBLICATIONS
This thesis is based on the work contained in the following papers, referred to by Roman numerals in the text. For more than one author, the contributions of the authors to the work are given for each paper.
I. Leppänen, J. and Gylltoft, K. (2003): Concrete Structures Subjected to Blast and Fragment Impacts. Nordic Concrete Research, 1/03, 2003, pp. 65-84.
Work done by Leppänen, J., supervised by Gylltoft, K.
II. Leppänen, J. (2003): Numerical Simulation of Projectile Penetration in Concrete. Nordic Concrete Research, 2/03, 2003, pp. 84-103.
III. Leppänen, J. (2004): Experiments and numerical analyses of blast and fragment impacts on concrete. Accepted for publication in the International Journal of Impact Engineering. Article in Press, 2004. 18 pp.
IV. Leppänen, J. (2004): Concrete subjected to projectile and fragment impacts: Modelling of crack softening and strain rate dependency in tension. Submitted to International Journal of Impact Engineering, in September 2004. 14 pp.
III
OTHER PUBLICATIONS BY THE AUTHOR
During the course of this work, subsequent results and some additional results have been presented on several occasions. These publications are:
LICENTIATE THESIS
Leppänen, J. (2002): Dynamic Behaviour of Concrete Structures subjected to Blast and Fragment Impacts. Licentiate Thesis. Publication no. 02:2, Archive no. 31. Department of Structural Engineering, Chalmers University of Technology, Göteborg, Sweden, April 2002. 71 pp.
CONFERENCE PAPERS
Leppänen, J. (2004): Fragment impacts into concrete, Eighth International Conference on Structures Under Shock and Impact, Crete, Greece, March 2004, pp. 63-71.
Leppänen, J. and Gylltoft, K. (2002a): Numerical Simulation of Concrete Penetration with a Steel Projectile, XVIII Nordic Concrete Research Symposium, Helsingör, Denmark, June 2002, pp. 273-275.
Leppänen, J. and Gylltoft, K. (2002b): Finite element analyses of concrete penetration with a steel projectile. Comparison of Lagrangian and Eulerian techniques, Seventh International Conference on Structures Under Shock and Impact, Montreal, Canada, May 2002, pp. 59-68.
REPORTS AND OTHER PUBLICATIONS
Leppänen, J. (2003): Splitterbelastad betong - Experiment och numeriska analyser (Fragment impacts into concrete - Experiments and numerical analyses, In Swedish). Report no. 03:6, Department of Structural Engineering and Mechanics, Concrete Structures, Chalmers University of Technology, Göteborg, Sweden, August 2003, 80 pp.
Leppänen, J., Ekengren, B., Gylltoft, K., Johansson, M. and Plos, M. (2002): Explosionsbelastade betongkonstruktioner (Concrete Structures subjected to Explosions, In Swedish), Bygg & teknik, Vol. 7, No. 02, Stockholm, Sweden, October 2002, pp. 54-59.
Leppänen, J. (2001): Finita Elementanalyser av splitterbelastade betongkonstruktioner - Inledande studie med ABAQUS/Explicit (Finite Element analyses of concrete structures subjected to fragment impacts - Preliminary study by ABAQUS/Explicit, In Swedish). Report no. 01:1, Department of Structural Engineering, Concrete Structures, Chalmers University of Technology, Göteborg, Sweden, March 2001, 72 pp.
IV
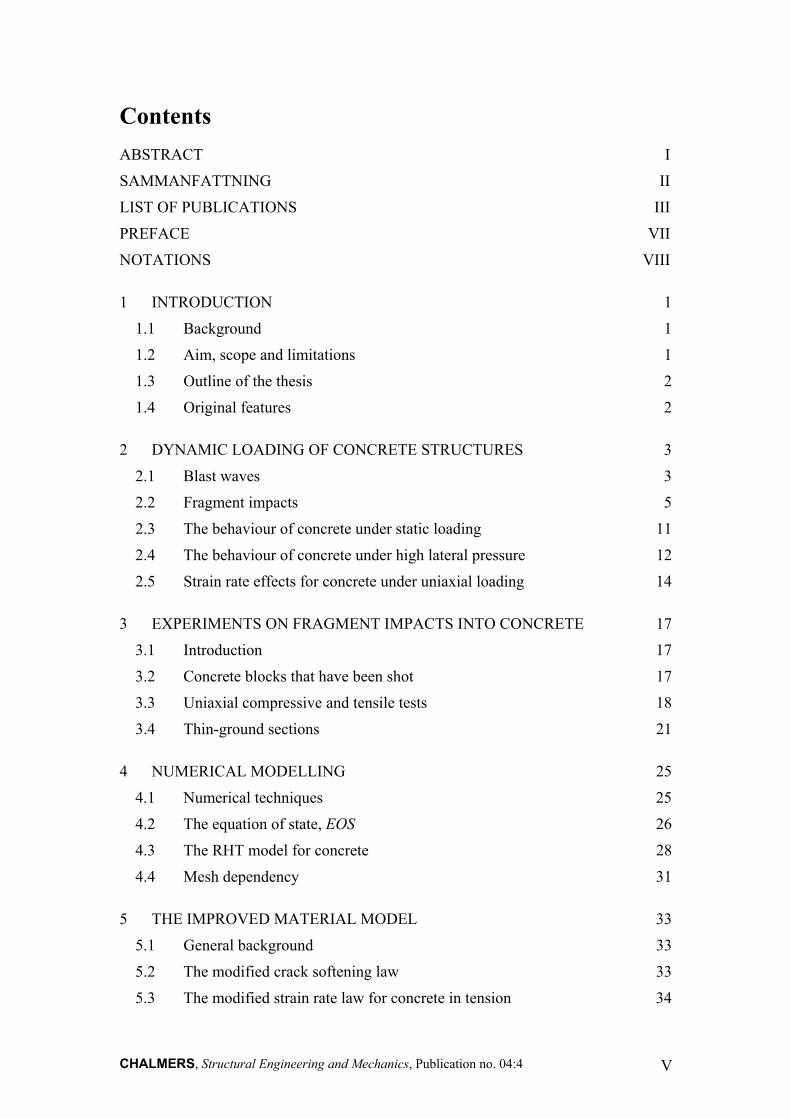
Contents ABSTRACT I
SAMMANFATTNING II
LIST OF PUBLICATIONS III
PREFACE VII
NOTATIONS VIII
1 INTRODUCTION 1
1.1 Background 1
1.2 Aim, scope and limitations 1
1.3 Outline of the thesis 2
1.4 Original features 2
2 DYNAMIC LOADING OF CONCRETE STRUCTURES 3
2.1 Blast waves 3
2.2 Fragment impacts 5
2.3 The behaviour of concrete under static loading 11
2.4 The behaviour of concrete under high lateral pressure 12
2.5 Strain rate effects for concrete under uniaxial loading 14
3 EXPERIMENTS ON FRAGMENT IMPACTS INTO CONCRETE 17
3.1 Introduction 17
3.2 Concrete blocks that have been shot 17
3.3 Uniaxial compressive and tensile tests 18
3.4 Thin-ground sections 21
4 NUMERICAL MODELLING 25
4.1 Numerical techniques 25
4.2 The equation of state, EOS 26
4.3 The RHT model for concrete 28
4.4 Mesh dependency 31
5 THE IMPROVED MATERIAL MODEL 33
5.1 General background 33
5.2 The modified crack softening law 33
5.3 The modified strain rate law for concrete in tension 34
CHALMERS, Structural Engineering and Mechanics, Publication no. 04:4 V
5.4 Mesh dependency 37
5.5 Results with the improved material model 39
6 CONCLUSIONS 42
6.1 General conclusions 42
6.2 Suggestions for future research 43
7 REFERENCES 45
APPENDIX A Empirical equations
APPENDIX B Equations to determine the dynamic increase factor
APPENDIX C Input data for modelling concrete
PAPER I - PAPER IV
CHALMERS, Structural Engineering and Mechanics, Publication no. 04:4 VI
Preface The present study treats concrete structures subjected to fragment impacts. The work presented in this thesis was carried out from February 2000 to October 2004 at the Department of Structural Engineering and Mechanics, Concrete Structures, Chalmers University of Technology, Sweden. Financial support for this work was provided by the Swedish Rescue Services Agency.
I would like to express gratitude to my supervisor, Professor Kent Gylltoft, for his valuable guidance and support during these years. I am also grateful to the reference group members of the project, “Dynamic behaviour of concrete structures subjected to blast and fragment impacts”. The members are Björn Ekengren, from the Swedish Rescue Services Agency, Mario Plos, from Chalmers, and Morgan Johansson from Reinertsen AB. These people, together with Kent Gylltoft and myself, have met for this project several times per year. The meetings have been creative and balanced well by humour, with fruitful and lively discussions of the project and its progress. Additional thanks go to Morgan for proof reading and offering valuable comments on all my papers and this thesis.
Furthermore, I would like to thank Lars Wahlström for the great work in the laboratory during the experimental part of this project. Thanks go also to the staff at Swedish defence research agency, FOI for the help with the experiments. I would also like to thank the staff at Century Dynamics and Leo Laine for the support with the program AUTODYN.
Finally, I thank my present and former colleagues for their support and interesting discussions on material modelling and the general behaviour of concrete during our concrete group days, doctoral meetings and coffee breaks, particularly Peter Grassl, Ingemar Löfgren and Mathias Johansson.
Göteborg, October 2004
Joosef Leppänen
CHALMERS, Structural Engineering and Mechanics, Publication no. 04:4 VII
Notations
Upper case letters
A Area, parameter for compressive yield surface B Parameter for residual yield surface D Damage E Young´s modulus GF Fracture energy K Bulk modulus M Parameter for residual yield surface N Parameter for compressive yield surface Mh Weight of the bomb case Ps
+, Ps- Peak pressures
Q Charge weight T+, T - Positive time duration, negative time duration Us Shock velocity V, V0 Volume, Initial volume Vs Striking velocity Y, Y* Yield strength, yield strength normalized by compressive strength YTXC Pressure dependent yield strength Y*
residual Residual strength
Lower case letters
b Constant to describe pressure–time history dpf Thickness to prevent perforation e Specific internal energy fc Compressive strength ft Tensile strength fts Static tensile strength k, k1, k2 Crack softening slopes l Length i+, i - Positive impulse, negative impulse mf Fragment mass p, p* Pressure, pressure normalized by compressive strength
CHALMERS, Structural Engineering and Mechanics, Publication no. 04:4 VIII
pcrush Initial compaction pressure p0 Atmospheric pressure r, r0 Radius, Initial radius t Time vi Initial fragment velocity vr Fragment velocity after a distance, r w Crack opening wu Ultimate crack opening x Depth of penetration
Greek letters
α Strain rate factor δ Strain rate factor ε Strain εc Concrete strain εu Ultimate concrete strain in tension ε& Strain rate
sεε && ,0 Static strain rate
µ Compression ν Poisson´s ratio ρ Density ρ0, ρs Initial density, solid density σ Stress σ1, σ2, σ3 Principal stresses σc Concrete stress σlat Lateral stress
CHALMERS, Structural Engineering and Mechanics, Publication no. 04:4 IX

1 INTRODUCTION
1.1 Background The terrorist attack on 11th September 2001 shocked the world. The risk of terrorist attacks may not be as high in Sweden as in other parts of the world. However, the wise are prepared for the unknown future; it is important to have tools to analyse loading phenomena such as concrete structures subjected to explosive loading. Since massive concrete structures withstand blast waves and fragment impacts effectively, they are often used for protection. According to the Swedish Shelter Regulations, Ekengren (2003), a shelter should withstand, “…the effect of a pressure wave corresponding to that produced by a 250-kilogram GP (General Purpose) bomb with 50% by weight TNT that bursts freely outside at a distance of 5.0 metres from the outside of the shelter during free pressure release”: Henceforth, this is referred to as the design bomb. Furthermore, according to these regulations, the shelter shall withstand the effect of fragment impacts from the design bomb. Normally, the thickness of concrete is designed to withstand the fragment impacts, while and a static load, with a dynamic increase factor, approximates the blast load.
Chalmers University of Technology has been collaborating with the Swedish Rescue Services Agency for many years, to study the behaviour of concrete structures subjected to blast and fragment impacts; see Plos (1995), Johansson (2000), Leppänen (2002), Leppänen et al. (2002) or Rempling (2004).
A blast load is characterized by its short duration. By computations, Johansson (2000) showed how a shelter subjected to a blast wave responded at the most critical stage, i.e. the first few milliseconds. If the load was applied fast enough, some parts of the structure were not affected by the loading, while other parts of it had already failed. In addition to the blast wave, the detonation of a General Purpose (GP) bomb causes fragments to fly against the civil defence shelter. This thesis includes the effects of fragment impacts in the numerical analyses. To examine what happens when a fragment strikes a concrete structure, there are several factors that must be taken into account. These include fragment impacts and damage mechanisms in concrete, as well as the dynamic behaviour of concrete under high pressures.
1.2 Aim, scope and limitations The principal aim of the research project, dynamic behaviour of concrete structures subjected to blast and fragment impacts, is to improve the current knowledge of the behaviour of concrete structures subjected to blast and fragment impacts. This thesis focuses mainly on studies of projectiles and fragment impacts into plain concrete. The project goals include an understanding of the phenomena for concrete subjected to dynamic loading. Another aim was to improve the modelling of fragment impacts in plain concrete. Experiments and numerical analyses were conducted for combined blast wave and fragment impacts in concrete. In both the experiments and analyses, the fragments were simplified as spherical ones. However, in real bomb detonation, the flying
CHALMERS, Structural Engineering and Mechanics, Publication no. 04:4 1
fragments are not spherical; this limitation was chosen, however, to have as clear initial conditions as possible, both for the experiments and the numerical analyses. Concrete structures are normally reinforced. In this thesis, the experiments and numerical analyses are limited to plain concrete (or slightly reinforced concrete members), such as blocks, cylinders or walls, as a starting point for examing and extending the knowledge of penetration, perforation, spalling, scabbing and cracking phenomena.
1.3 Outline of the thesis The thesis consists of an introductory part and four papers. The introductory part gives a background to the subjects treated in the papers and links them together. Although the main work is given in the papers, some new results are also presented in the first part.
• Chapter 2 gives general information on blast waves, fragment impacts and the dynamic behaviour of concrete.
• In Chapter 3, experiments on fragment impacts are discussed.
• Chapter 4 deals with numerical modelling.
• Chapter 5 explains the improved material model and shows some results.
• In Chapter 6 major conclusions are drawn and some suggestions for future research.
• Appendixes A, B and C, followed by Papers I to IV complete the thesis.
1.4 Original features The work presented in this thesis is a study of the behaviour of plain concrete subjected to blast and fragment impacts. It is shown that, by combining both experiments and numerical analyses, which form a powerful tool for deeper understanding of phenomena, fragment impacts can be modelled accurately by numerical methods. It is believed that the experiments done during this work are unique. Furthermore, by combined literature studies and numerical analyses, it was found that the strain rate law and the linear crack softening law must be improved in the software used in the numerical analyses. A modified strain rate law for tension and the bi-linear crack softening law, proposed by Gylltoft (1983), are implemented in the software AUTODYN (2004). It is believed that this implementation is the first. Thus, the contribution of this thesis meets the need for greater practical and deeper theoretical understanding of concrete structures subjected to blast and fragment impacts of the next generation of analysts.
CHALMERS, Structural Engineering and Mechanics, Publication no. 04:4 2
2 DYNAMIC LOADING OF CONCRETE STRUCTURES
2.1 Blast waves To understand the behaviour of concrete structures subjected to severe loading from military weapons, the nature and physics of explosions and the formation of a blast wave and reflections from a bomb must be comprehended. When the blast wave hits a concrete surface, a stress wave propagates through the concrete.
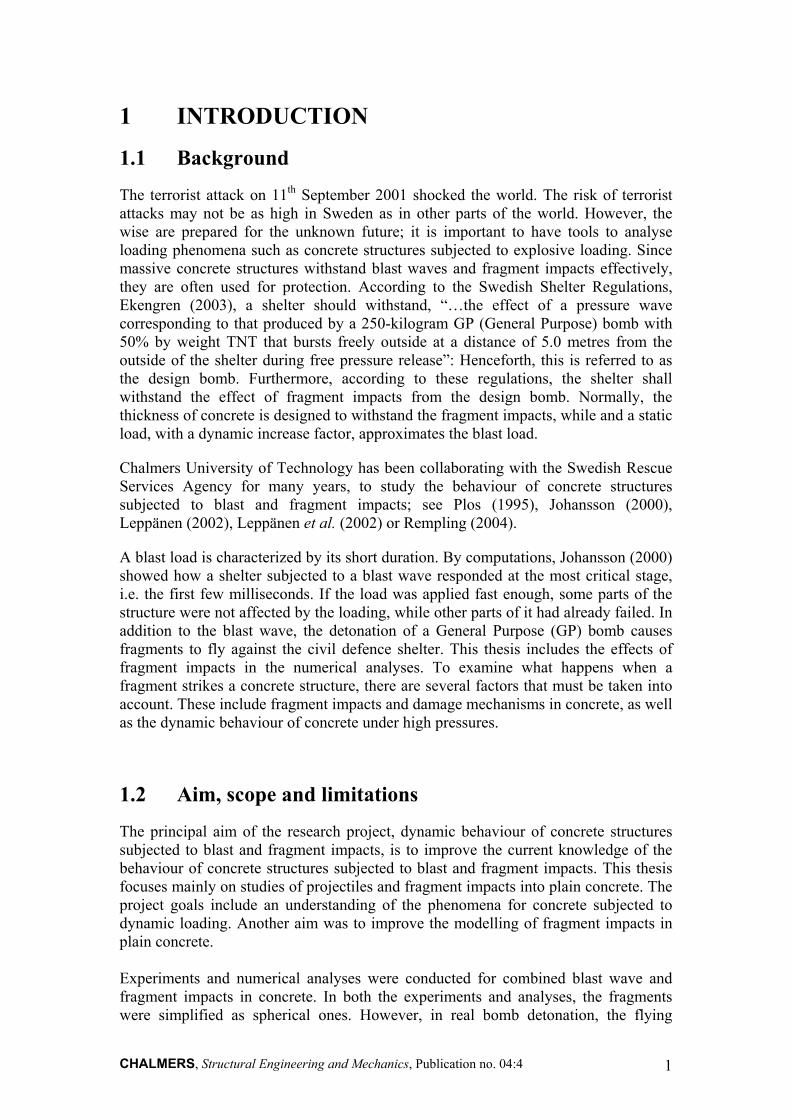
A shock wave resulting from an explosive detonation in free air is termed an air-blast shock wave, or simply a blast wave, see Baker (1973). The blast environment differs according to where the explosion takes place. In an airburst, a blast wave that hits the ground surface is reflected. The reflected wave coalesces with the incident wave, forming a Mach front, as shown in Figure 2.1. The point at which the three shock fronts meet – incident wave, reflected wave and the Mach front – is termed the triple point; blast wave reflections are further discussed in Paper I and in Baker (1973).
Incident wave
Path of the triple point
Ground surface
Mach front
Reflected wave
Shelter
Detonation point
Figure 2.1 Blast environment from an airburst, based on Krauthammer (2000).
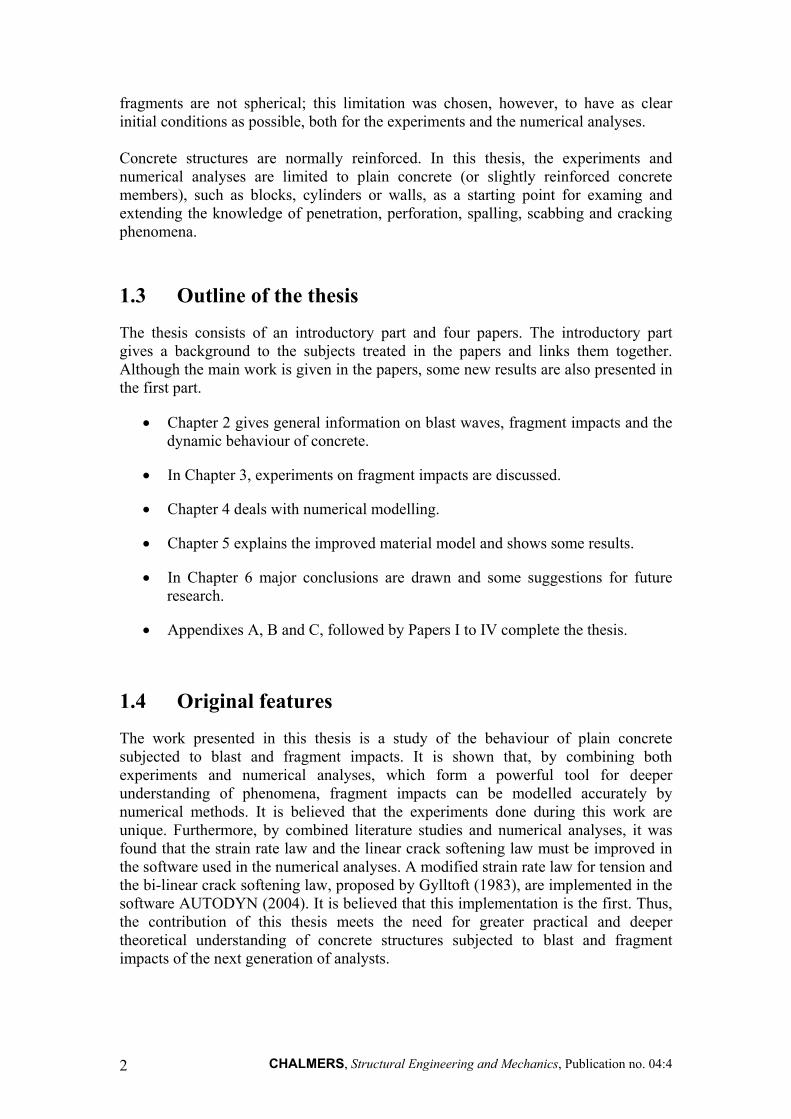
When there is a surface burst, the reflection occurs instantaneously from the ground surface, which generates a shock wave; this is termed a ground-reflected wave, as shown in Figure 2.2. At a relatively short distance from the burst, the wave front can be approximated by a plane wave.
CHALMERS, Structural Engineering and Mechanics, Publication no. 04:4 3
Ground surface
Assumed plane wave front
Ground-reflected wave
Shelter
Detonation point
Figure 2.2 Surface burst blast environment, based on Krauthammer (2000).
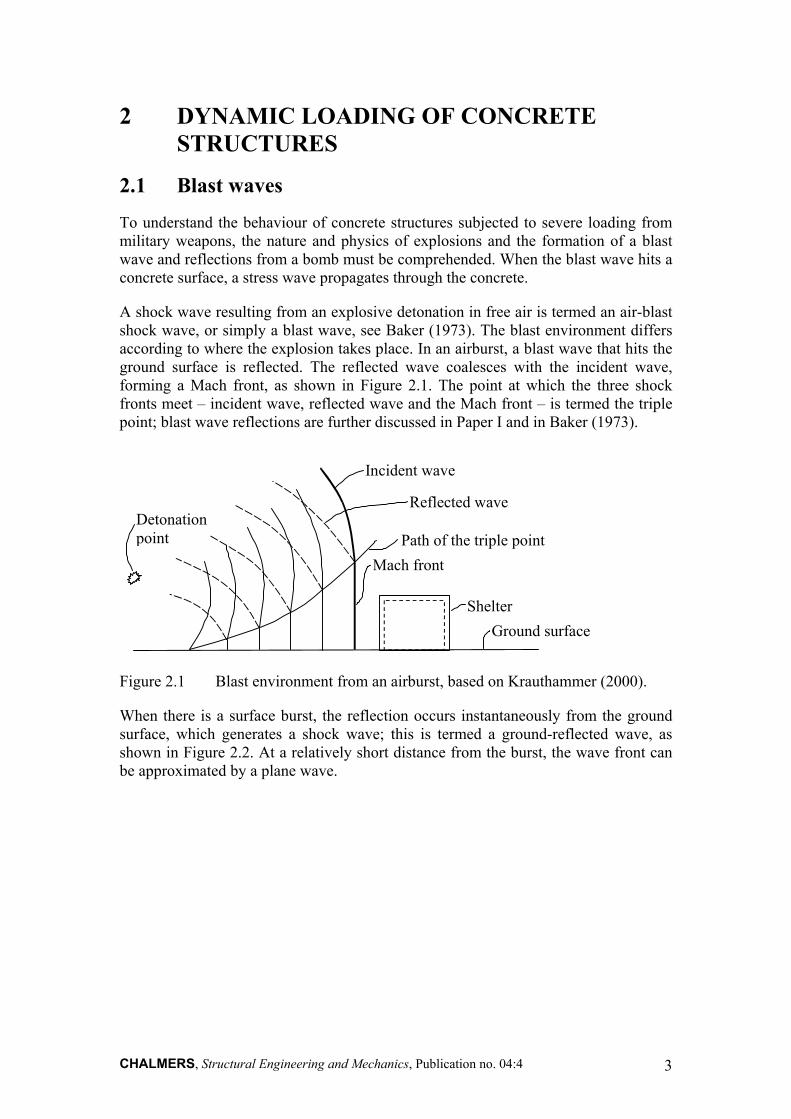
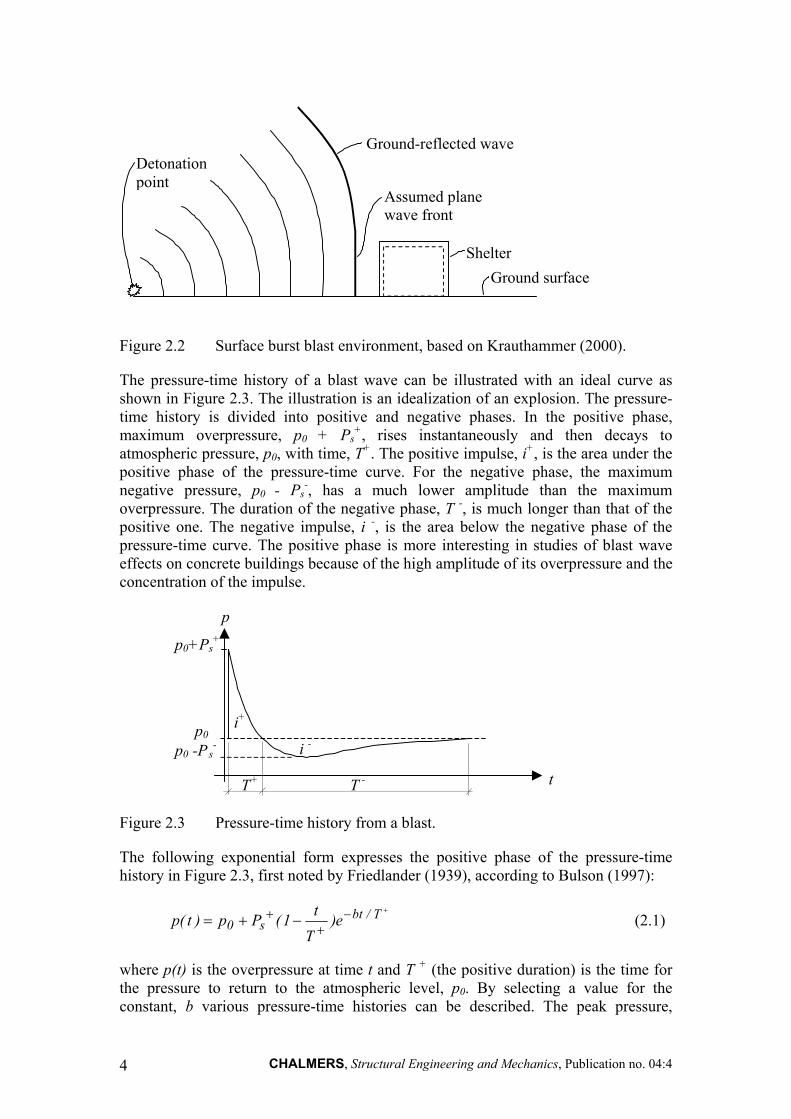
The pressure-time history of a blast wave can be illustrated with an ideal curve as shown in Figure 2.3. The illustration is an idealization of an explosion. The pressure-time history is divided into positive and negative phases. In the positive phase, maximum overpressure, p0 + Ps
+, rises instantaneously and then decays to atmospheric pressure, p0, with time, T+. The positive impulse, i+, is the area under the positive phase of the pressure-time curve. For the negative phase, the maximum negative pressure, p0 - Ps
-, has a much lower amplitude than the maximum overpressure. The duration of the negative phase, T -, is much longer than that of the positive one. The negative impulse, i -, is the area below the negative phase of the pressure-time curve. The positive phase is more interesting in studies of blast wave effects on concrete buildings because of the high amplitude of its overpressure and the concentration of the impulse.
p
i+
T + T -
i -
t
p 0 +P s +
p 0 p 0 -P s -
Figure 2.3 Pressure-time history from a blast.
The following exponential form expresses the positive phase of the pressure-time history in Figure 2.3, first noted by Friedlander (1939), according to Bulson (1997):
+−
++ −+= T/bt
s0 e)T
t1(Pp)t(p (2.1)
where p(t) is the overpressure at time t and T + (the positive duration) is the time for the pressure to return to the atmospheric level, p0. By selecting a value for the constant, b various pressure-time histories can be described. The peak pressure,
CHALMERS, Structural Engineering and Mechanics, Publication no. 04:4 4
p0 + Ps+, depends mainly on the distance from the charge and the weight of the
explosives. In addition, if the peak pressure, the positive impulse and the positive time duration are known, the constant, b, can be calculated, and then the pressure-time history can be obtained.
Equation (2.1) is often simplified with a triangular pressure-time curve; see Bulson (1997)
).1()( 0 ++ −+=
TtPptp s (2.2)
A detonation inside a building causes more damage than one outside the building, see Forsén (1989). The reason for this is that, in addition to the short duration of a blast wave, there is a long-duration wave, added by gas and heat, from the explosion, which cannot escape from the limited space. If the amplitude and the duration of the pressure are great enough, the walls and roof may be jerked apart. An important parameter for a building is the relationship between openings, known as the leakage area. With large leakage areas, the duration of the blast wave can be shortened and the damage possibly reduced.
2.2 Fragment impacts When high explosives such as grenades, bombs, torpedoes, missiles or robots detonate, fragments fly out in all directions when the casing is broken. The fragments from the same kind of weapon can vary in size. The fragmentation process is discussed in Janzon (1978); and fragment data from different types of bombs can be found, for instance in Forsén and Sten (1994), Nordström (1995) or Andersson et al. (1989).
To explain the fragmentation process Janzon (1978) studied a cylinder. When an explosive detonates inside the cylinder, the cylinder expands and gets thinner. During the expansion, local radial tensile cracks develop from the outer surface inwards. However, the inner pressure caused by the shock wave from the detonation will delay or even stop the radial crack propagation; consequently, new radial cracks can be formed. This crack formation occurs simultaneously for the whole cylinder. When the radial crack formation is completed, shear cracks form from the inner surface. Again, this occurs simultaneously for the whole cylinder. The crack formations are completed when the shear cracks coincide with the radial cracks, which are schematically shown in Figure 2.4.
CHALMERS, Structural Engineering and Mechanics, Publication no. 04:4 5
r/r0 = 1.0 1.1
1.2
1.3 1.4
1.5
1.6
1.7
Figure 2.4 Schematic overview of the fragmentation process, plane view of the cross section from a bomb. Based on Janzon (1978).
The damage to concrete from fragment impacts depends on the properties of the fragments, i.e. the striking velocity, mass and area density [kg/m2]. Fragment impacts causes severe cracking and crushing in the concrete, which must be supported by reinforcement to prevent failure. When fragments strike a concrete structure, they penetrate into the concrete; the impact causes spalling at the point of contact and possible scabbing on the reverse side of the wall, see Figure 2.5. When 50 % penetration is reached, scabbing may become a problem according to Krauthammer (2000). Furthermore, the fragments can damage the reinforcement, and vibrations may reduce the bond between the concrete and reinforcement. When a stress wave propagates through the concrete and reaches the inside of a structure, it is reflected as a tensile wave; as concrete is weak in tension, this leads to scabbing on the inside. The amount of reinforcement is a highly critical parameter in regard to scabbing. Experiments show that the scabbing is reduced by increasing the amount of reinforcement since the reinforcement holds the concrete in place (the confinement effect), see Jonasson (1990).
CHALMERS, Structural Engineering and Mechanics, Publication no. 04:4 6
spalling
depth of penetration
scabbing
Figure 2.5 Definitions of depth of penetration, spalling and scabbing. Spalling takes place on the exposed side of the concrete wall and scabbing on the reverse side of the wall.
To estimate the fragment velocity, empirical formulas can be found in the literature, for example those proposed by von Essen (1973), Janzon (1978), Engberg and Karevik (1987), ConWep (1992) and Krauthammer (2000). The initial velocity of the fragments is determined by the amount of explosive material and size of the casing, which can be estimated with an equation. The fragment velocity is retarded in the air, in relation to the initial fragment velocity, the fragment mass and the type of fragment. Fragments from an explosion can fly through the air over very long distances, more than 1 000 m for heavy fragments, according to Engberg and Karevik (1987). For illustration, an example of fragment impacts is given with varying masses, as shown in Figure 2.6. As can be seen, the fragment velocity is highly dependent on the mass: for light fragments, the velocity is retarded faster than for heavy fragments. From the design bomb, see Section 1.1, the fragment weights are normally distributed from 1 to 50 grams, and the impact velocity varies approximately between 1 650 and 1 950 m/s. In Figure 2.6 the velocity for six fragment weights is shown, ranging from 5 to 400 grams; the equation can be found in Engberg and Karevik (1987) and in Appendix A.
CHALMERS, Structural Engineering and Mechanics, Publication no. 04:4 7

1500
1700
1900
2100
0 2 4 6 8 10 12Distance from explosion [m]
400
200
100
50
25
5
Fragment velocity [m/s]
[g]
Figure 2.6 Fragment velocity from a design bomb, for fragment weights from 5 to 400 grams, based on equations from Engberg and Karevik (1987).
For comparison of different materials, the approximate depth of penetration is given by multiples of the depth of penetration for soft steel by using a factor; the factors are given in Table 2.1, taken from Engberg and Karevik (1987). By using a direct formula, from ConWep (1992), von Essen (1973) or Erkander and Pettersson (1985), the depth of penetration can be estimated for fragments penetrating concrete, as shown in Figure 2.7. The equations for these can be found in Appendix A. The assumptions in these formulations are not the same. The formulation in Erkander and Pettersson (1985) is a curve fit to their experimental results; it will not be discussed further here. In ConWep, the depth of penetration is a function of the fragment mass, the striking velocity and the concrete compressive strength. When using the equation from von Essen (1973) to estimate the depth of penetration, the concrete strength is not taken into account; the depth of penetration is a function of the fragment mass, and the striking velocity. Furthermore, the formulation in ConWep is designed to estimate penetration into massive concrete, while the von Essen one is for reinforced concrete. This may explain the divergence in estimations, such as the wide variation for heavy fragments in the high velocity impact region.
Figure 2.7 shows also experimental data from Erkander and Pettersson (1985) and Leppänen (2003); the data from Leppänen consists of both single and multiple fragment impacts. From these experimental data it can be seen that the formulation according to ConWep estimates the depth of penetration more accurately than the formulation in von Essen (1973).
CHALMERS, Structural Engineering and Mechanics, Publication no. 04:4 8
Table 2.1 Penetration depth of common materials, taken from Engberg and Karevik (1987).
Material Factor
Armour-plate 0.75
Soft steel 1.0
Aluminium 2
Reinforced fibre-glass plastic 4
Reinforced concrete 6
Pine wood 15
Sand 18
Water 50
Wet snow 70
Dry snow 140
0
50
100
150
200
0 500 1000 1500 2000Striking velocity [m/s]
ConWep: m = 35.9 gvon Essen: m = 35.9 gErkander and Pettersson: m = 35.9 gExperimental data: m = 35.9 g (Erkander and Pettersson)ConWep: m = 2 gvon Essen: m = 2 gExperimental data: m = 2 g (Leppänen, single impact)Experimental data: m = 2 g (Leppänen, multiple impacts)
Depth of penetration [mm]
Figure 2.7 Comparison of empirical formulations of fragment impacts. ConWep (1992), von Essen (1973) and Erkander and Pettersson (1985); with experimental data from Erkander and Pettersson (1985) and Leppänen (2003).
CHALMERS, Structural Engineering and Mechanics, Publication no. 04:4 9
The designer is interested of the thickness of the concrete wall that just prevents perforation. A rule of thumb is that when 70% penetration is obtained one may expect perforation, according to Krauthammer (2000). The thickness that prevents perforation can also be estimated by equations, see Krauthammer (2000) or Appendix A. For illustration, an example is given here: according to Swedish Rescue Services Agency shelter regulations, Ekengren (2003), a Swedish shelter above ground must have a minimum thickness of 350 mm. Table 2.2 shows the thickness required for a concrete wall that just prevents perforation by fragment weights from 5 to 400 grams with striking velocities up to 3 000 m/s. As shown, both the striking velocity and the mass are vital factors in the design of protective structures. The area marked grey indicates a thickness above 350 mm massive concrete (the required minimum thickness of a civil defence shelter above ground). For the normally distributed (1–50 grams) fragments from the design bomb, perforation would not be a problem, since the striking velocity for the 50 gram fragment is approximately 1 950 m/s. However, if single fragments of larges size than approximately 100 grams are released from the bomb, at a distance of 5 meters, perforation may occur.
Table 2.2 Thickness of concrete wall that just prevents perforation, compressive strength 30 MPa, for fragment weights from 5 to 400 grams with striking velocities up to 3 000 m/s, based on equations from Krauthammer (2000), see Appendix A.
Fragment mass [g] Striking velocity [m/s] 5 25 50 100 200 400
300 22 39 50 65 84 108
600 30 54 70 91 118 153
900 39 74 97 127 167 220
1 200 53 101 134 177 235 312
1 500 70 135 180 239 318 424
1 800 90 175 233 312 416 556
2 100 112 220 295 394 528 707
2 400 138 271 363 487 653 877
2 700 166 327 439 590 792 1 064
3 000 196 389 522 702 943 1 268
A building is exposed not only to fragments or only a blast wave: the loading from a bomb is a combination of both the blast wave and flying fragments. Experiments show that a concrete building which is exposed to a combination of blast wave and fragments collapses more easily than one exposed only to a blast wave or to fragments, see Forsén and Edin (1991). Forsén (1997) showed that a 200 mm thick concrete plate collapsed when a combination of blast load and fragment impacts from
CHALMERS, Structural Engineering and Mechanics, Publication no. 04:4 10
a distance of 14 m was applied; however, a similar concrete plate could withstand the same blast load at a distance of 5 m without fragment impacts.
The load from a detonation can be separated into a blast wave and a fragment impacts. Depending on the charge and the distance between the bomb and the target, the fragments may strike the concrete surface before, at the same time as, or after the blast wave. Figure 2.8 shows an example of the design bomb to compare the arrival time of the blast wave calculated according to ConWep (1992) and the arrival time of the fragments; for equations see Appendix A. For this type of bomb, the arrival times for the blast and the fragments coincide at a distance of approximately 5 m; at a greater distance, the fragments strike the target before the blast wave.
0
2
4
6
8
10
0 2 4 6 8 10Distance [m]
FragmentsBlast wave
Arrival time [ms]
Figure 2.8 Calculated arrival time for a blast wave and fragments from the design bomb.
The difference in arrival time for a blast and fragments is less important for short distances, according to Forsén and Nordström (1992). This is so because the response time of a reinforced concrete wall is usually much longer than the difference between the arrival times of a blast and the fragments. The fragments would damage the wall before it is deformed. A very good estimation of the deflection can be made by simply superposing the impulse of the fragment impacts on the positive impulse of the blast wave, at the maximum blast pressure. Then the impulse can be simplified and estimated by using a triangular shape; the resistance of the wall can be assumed to be reduced by the fragments that comprise the very beginning of the load, see Forsén and Nordström (1992).
2.3 The behaviour of concrete under static loading Concrete is often characterized by the uniaxial stress-strain relationship, as shown in Figure 2.9. Concrete is weak in tension: for normal-strength concrete, the ultimate tensile strength is less than one tenth of the ultimate compressive strength. Moreover, concrete is very brittle in tension: the softening phase is very steep when the peak-load has reached. The post-peak behaviour is normally characterised by the fracture energy, GF. However, real structures are subjected to multiaxial stresses.
CHALMERS, Structural Engineering and Mechanics, Publication no. 04:4 11
Richart et al. (1928) observed that confined concrete has greater strength and stiffness, and furthermore, strains are extended. In Figure 2.10. the stress-strain relationship for concrete in compression is shown for increasing lateral pressure (confined concrete).
σ
ε
σ
ε
Figure 2.9 Schematic view of stress-strain relationship under uniaxial loading for concrete.
σ c
εc
σlat = p3
σ lat = p2
σ lat = 0
σ lat = p 1 0 < p1 < p2 < p3
σ lat
σc
σc
Figure 2.10 Schematic view of stress-strain relationship for rising lateral pressure in compressed concrete. Based on research by Richart et al. (1928).
2.4 The behaviour of concrete under high lateral pressure When concrete is subjected to extremely high pressures, as in an impact situation, the lateral pressure suddenly becomes much higher. During fragment impacts, concrete is exposed to enormous confining pressures and behaves plastically, dissipating a large amount of energy. In addition, civil defence shelters have heavy reinforcement, which provides further confinement effects. The confining pressure in impact loading can be several hundred MPa. In a standard static triaxial test, the ultimate strength of concrete can increase greatly. Experiments by Bažant et al. (1996), with a uniaxial compressive strength of 46 MPa, showed that the ultimate strength increased up to 800 MPa, and the strains were extended as shown in Figure 2.11.
CHALMERS, Structural Engineering and Mechanics, Publication no. 04:4 12

0
200
400
600
800
1000
0 10 20 30 40 50Strain [mm/m]
Axial Stress [MPa]
σ lat = 20 MPa
σ lat = 100 MPa
σ lat = 200 MPa
σ lat = 400 MPa
Figure 2.11 Stress-strain relationship for concrete at high lateral pressures, based on triaxial compression test data from Bažant et al. (1996). Uniaxial compressive strength 46 MPa.
Another characteristic of concrete behaviour is that it is not linear for hydrostatic pressure (mean value of the principal stress components); this can be illustrated by the relationship between hydrostatic pressure and density. However, for low-pressure levels the relationship is linear (elastic loading); with further loading, at a certain pressure level, micro cracking occurs in concrete, and the relationship becomes non-linear. Since concrete is porous, the pores collapse and the material is compacted. At a very high-pressure level, all of the pores are collapsed, and the relationship between hydrostatic pressure and density becomes linear again. The equation of state (EOS) relates the pressure to the local density and the local specific internal energy. In Figure 2.12 the EOS is illustrated for concrete. The initial density is designated ρ0 and the solid density is ρs which is defined as the density at zero pressure of the fully compacted solid. The phase when the material is compacting is known as plastic compaction.
To determine the EOS, contact detonation experiments or flyer-plate impact tests can be conducted, see further Rinehart and Welch (1995), Grady (1996), and Gebbeken (2001).
CHALMERS, Structural Engineering and Mechanics, Publication no. 04:4 13
p ρ 0 ρ s ρ
Elastic unloading/reloading
Elastic loading
Pla stic compaction
Fully compacted
Figure 2.12 EOS for concrete. Based on AUTODYN (2004).
2.5 Strain rate effects for concrete under uniaxial loading The strength, deformation capacity, and fracture energy are important parameters for characterizing and describing the response of concrete. For dynamic loading, these parameters are not the same as for static loading. When concrete is subjected to impact loading, the material strength becomes greater. The behaviour of concrete is determined by the loading rate; this is called the strain rate effect. The strain rate in the material depends on the type of loading, as shown in Figure 2.13 for five kinds of loading, such as creep, static, earthquake, hard impact and blast loads.
10 - 8 10 - 7 10 - 6 10 - 5 10 - 4 10 - 3 10-1 1 10 102 103
CREEP STATIC EARTHQUAKE HARD IMPACT BLAST
Strain rate [s-1]
Figure 2.13 Strain rates for some types of loading; based on Bischoff and Perry (1991).
At Delft University, Zielinski (1982) followed a phenomenological approach when he compared static and impact tensions. He observed that the geometry of the fracture plane changed. With increasing loading rate, the amount of aggregate fracture became greater. Furthermore, multiple fractures were observed at high loading rates, as shown in Figure 2.14. These fracture mechanisms have a direct influence upon the stress-strain relationship for concrete in dynamic loading; the energy absorption is higher for the multiple fracture planes. Moreover, for high loading rates; the stiffness is increased, failure stress and deformation capacity are higher. In addition, the elastic stiffness is increased. This is schematically shown in Figure 2.15.
CHALMERS, Structural Engineering and Mechanics, Publication no. 04:4 14
STATIC IMPACT Microcracks
Macrocracks
Aggregate particles
Cement matrix
Figure 2.14 Crack path for tensile static and dynamic loading; based on Zielinski (1982).
σ
ε
Impact
Static
Effect of changed fracture path for a single macrocrack
Effect of multiple cracking
Figure 2.15 Schematic view of the effect of fracture mechanisms on the stress-strain relationship; based on Zielinski (1982).
The concrete strengths are increased by the strain rate effects. The dynamic increase factor (DIF) is the proportional rise of the dynamic ultimate strength relative to the static ultimate strength. The ultimate compressive strength can be more than doubled, see Bischoff and Perry (1991); experimental results are shown in Figure 2.16. Moreover, according to Ross et al. (1996), the concrete ultimate uniaxial strength in tension increases by multiples of 5 to 7 at very high strain rates; experimental results are shown in Figure 2.17. The greater strength is explained by the change in the fracture plane. At a higher loading rate, concrete is subject to multiple fractures, and the amount of aggregate fracture increases, see Figure 2.14. Other explanations for the increased strength are the viscous effects and the forces of inertia. This is further discussed in Paper I.
CHALMERS, Structural Engineering and Mechanics, Publication no. 04:4 15
DIF (Dynamic increase factor)
10-8 10-7 10-6 10-5 10-4 10-3 10-2 10-1 100 101 102 103
Strain rate [s-1]
2.5
2.0
0.5
1.5
1.0
Figure 2.16 Strain rate dependency for concrete in compression; based on Bischoff
and Perry (1991).
0
1
2
3
4
5
6
7
8
Strain rate [s-1]
Cowell 63 MPa Cowell 38 MPa
Cowell 32 MPa Hatano 23 MPa
Takeda/Tachikawa Mellinger/Birkimer 36 MPa
Birkimer 47 MPa McVay 35 MPa
Ross split tension Ross direct tension
Ross mixes E-J Kormeling et al
John et al. 53 MPa Antoun 57 MPa
DIF (Dynamic increase factor)
10-6 10-5 10-4 10-3 10-2 10-1 100 101 102 103
Figure 2.17 Strain rate dependency for concrete in tension; based on Malvar and Ross (1998).
CHALMERS, Structural Engineering and Mechanics, Publication no. 04:4 16
3 Experiments on fragment impacts into concrete
3.1 Introduction To study the concrete material properties for fragment impacts on concrete, experiments were conducted. Here a brief summary and the main results of the experiments are given; for further details, see Leppänen (2003) and Paper III. In the literature most previous experiments have been done on structural level, where beams, walls or even entire structures were analysed, see Forsén (1989), Forsén and Edin (1991), Forsén and Nordström (1992), Nordström (1992), Nordström (1993) or Nordström (1995). Spherical fragments were shot by a detonation, in the thesis experiments, with either octol or hexotol, against thick non-reinforced concrete blocks (slightly reinforced in the edges). In a real bomb detonation, the fragments are not spherical, and the structure is reinforced. The purpose of the simplifications in the experimental set-up was to have as few uncertain parameters as possible. The depth of penetration and cratering were measured after the concrete blocks were shot. Next, to study the damage, the blocks were cut into halves so that global macro cracking could be observed. Uniaxial compressive and splitting tensile tests were made on drilled cylinders to study the change in strength. Furthermore, thin-ground specimens were prepared from the blocks, to facilitate analysis of micro-cracking with a microscope. Another aim was to investigate how numerical methods can simulate the experiments including the loading of combined blast wave and fragment impacts; the experimental set-up was chosen in order to have clear boundary conditions for the numerical analyses. The numerical analyses are further discussed in Chapters 4 and 5 and in Paper III. The dimensions of the blocks for the multiple fragment impacts were 750 x 750 x 500 mm3, and the fragments were spherical with a radius of 4 mm. A total of seven charges were fired at an impact velocity of around 1 650 m/s. For the single fragment impacts, the dimensions of the blocks were 750 x 375 x 500 mm3; the fragments were of the same kind as for the multiple impacts. Eight single fragments were shot, however, for which the impact velocity was somewhat higher, approximately 1 850 m/s.
3.2 Concrete blocks that have been shot The concrete blocks, after being struck by fragments, were photographed as shown in Figure 3.1. The cracks were marked to improve the visualization. The depth of penetration varied between 30 and 50 mm, and the crater diameter varied between 45 and 60 mm for the concrete blocks shot with multiple fragments. To study the macro cracking in the blocks, they were cut into halves and the crack pattern was examined, see Figure 3.1 in which the crack patterns are marked. The blocks had similar overall crack patterns, with clear spalling in the impact zone; the depth of the damage zone was approximately 50 mm. At the boundaries of the blocks, a global crack pattern developed; this is caused by reflections of the stress wave generated by the impulse from the blast and fragment impacts.
CHALMERS, Structural Engineering and Mechanics, Publication no. 04:4 17
Figure 3.1 Left: Top view of concrete block No. 3 after being shot with multiple fragments. Right: Macro-crack pattern in the cross section of concrete block No. 3 (after cutting into halves).
The blocks of the single fragment impacts are shown in a photo in Figure 3.2. The average depth of penetration was approximately 55 mm, and the average crater diameter was approximately 90 mm.
Figure 3.2 Left: Top view of concrete block No. 8 after being shot with single fragments. Right: Macro-crack pattern in the cross section of concrete block No. 8 (after cutting into halves).
3.3 Uniaxial compressive and tensile tests To study the change in material properties, uniaxial compressive and splitting tensile tests were conducted on cylinders drilled from the concrete blocks. From the drilled cylinders, φ 50 x 100 mm specimens were sawed out at various heights and smoothed for uniaxial compressive and splitting tensile tests. Cylinders were drilled in two directions: horizontally (perpendicular to the direction of the fragment impacts) and vertically. In the uniaxial compressive test on cylinders drilled in the horizontal direction, the strength was hardly affected at all by the fragment impacts, as shown in
CHALMERS, Structural Engineering and Mechanics, Publication no. 04:4 18
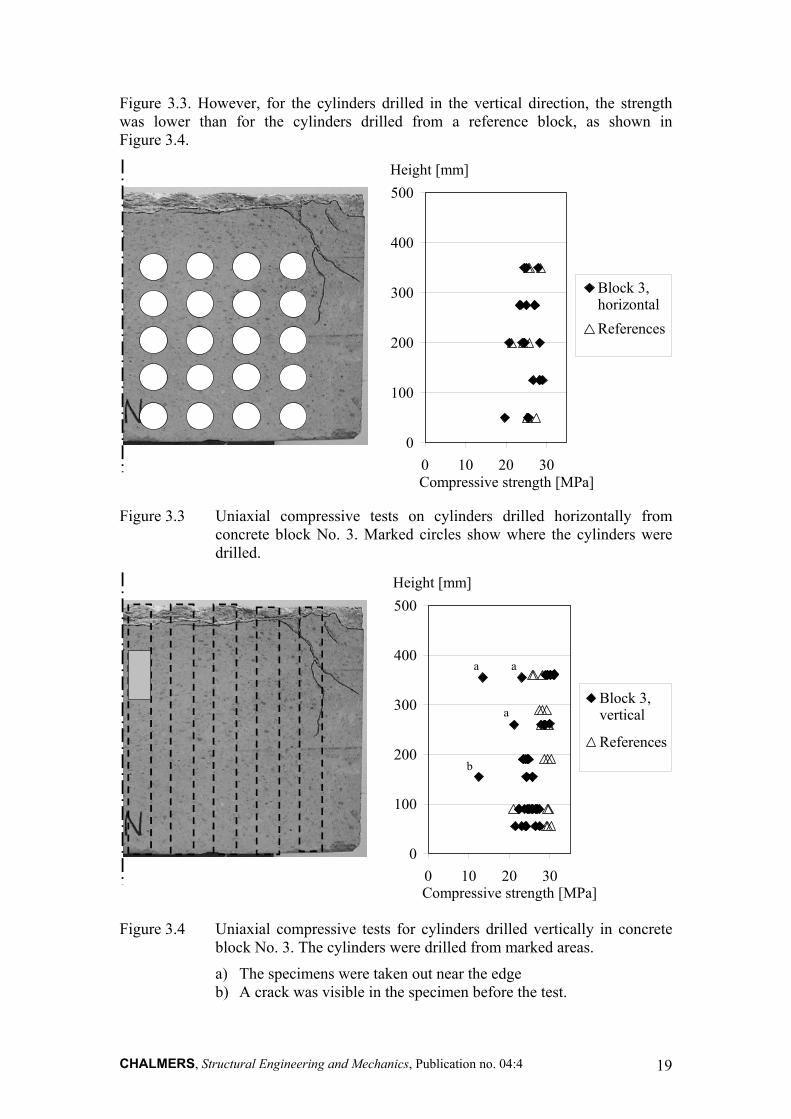
Figure 3.3. However, for the cylinders drilled in the vertical direction, the strength was lower than for the cylinders drilled from a reference block, as shown in Figure 3.4.
0
100
200
300
400
500
0 10 20 30Compressive strength [MPa]
Block 3,horizontalReferences
Height [mm]
Figure 3.3 Uniaxial compressive tests on cylinders drilled horizontally from
concrete block No. 3. Marked circles show where the cylinders were drilled.
0
100
200
300
400
500
0 10 20 30Compressive strength [MPa]
Block 3,vertical
References
Height [mm]
a
a a
b
Figure 3.4 Uniaxial compressive tests for cylinders drilled vertically in concrete
block No. 3. The cylinders were drilled from marked areas.
a) The specimens were taken out near the edge b) A crack was visible in the specimen before the test.
CHALMERS, Structural Engineering and Mechanics, Publication no. 04:4 19
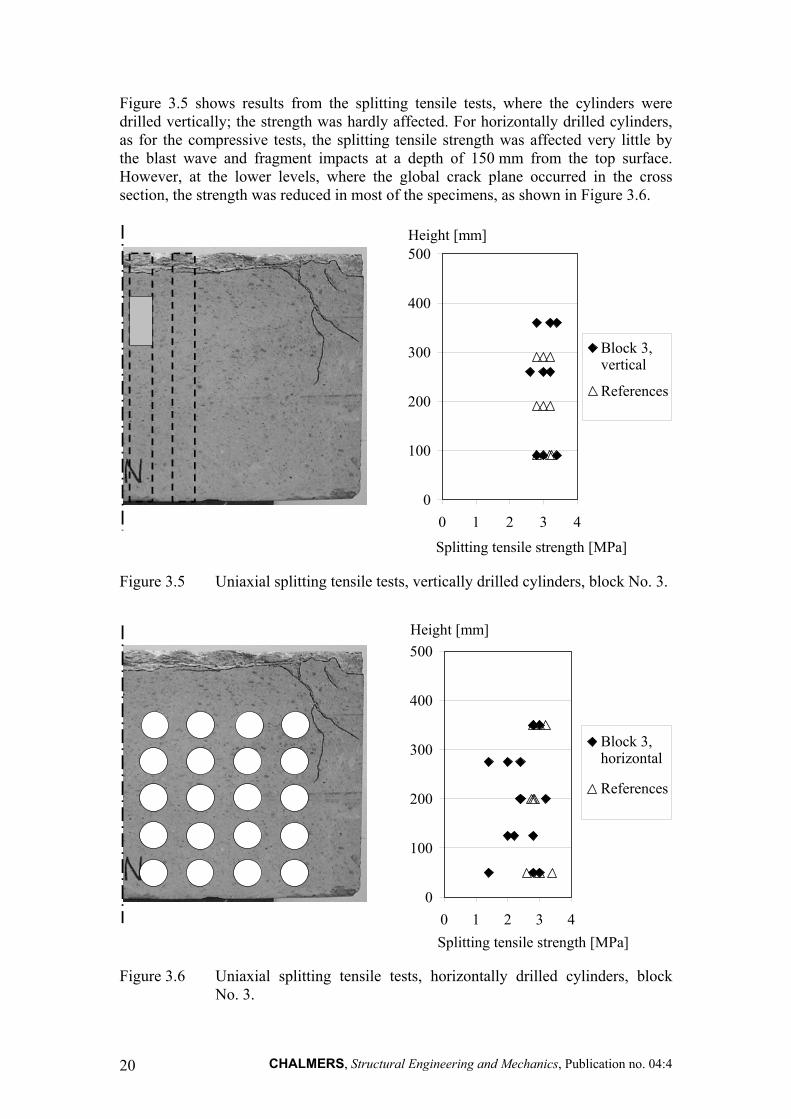
Figure 3.5 shows results from the splitting tensile tests, where the cylinders were drilled vertically; the strength was hardly affected. For horizontally drilled cylinders, as for the compressive tests, the splitting tensile strength was affected very little by the blast wave and fragment impacts at a depth of 150 mm from the top surface. However, at the lower levels, where the global crack plane occurred in the cross section, the strength was reduced in most of the specimens, as shown in Figure 3.6.
0
100
200
300
400
500
0 1 2 3 4
Block 3,vertical
References
Height [mm]
Splitting tensile strength [MPa]
Figure 3.5 Uniaxial splitting tensile tests, vertically drilled cylinders, block No. 3.
0
100
200
300
400
500
0 1 2 3 4
Block 3,horizontal
References
Height [mm]
Splitting tensile strength [MPa]
Figure 3.6 Uniaxial splitting tensile tests, horizontally drilled cylinders, block No. 3.
CHALMERS, Structural Engineering and Mechanics, Publication no. 04:4 20
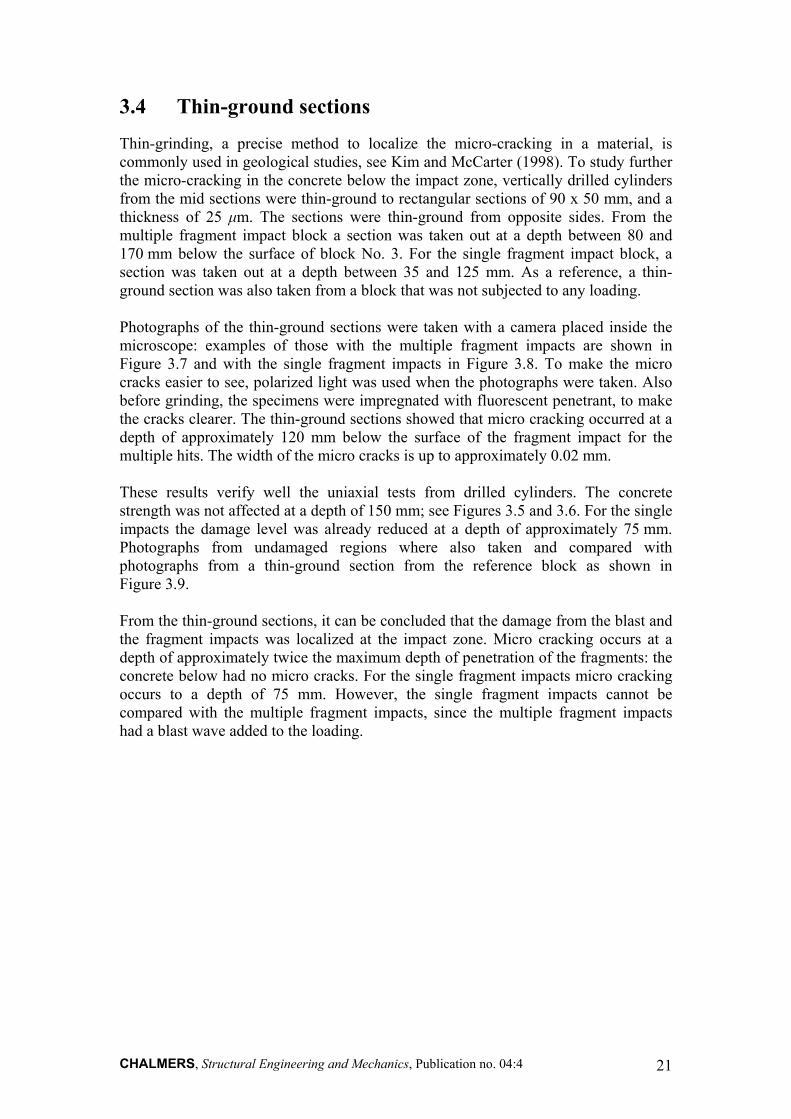
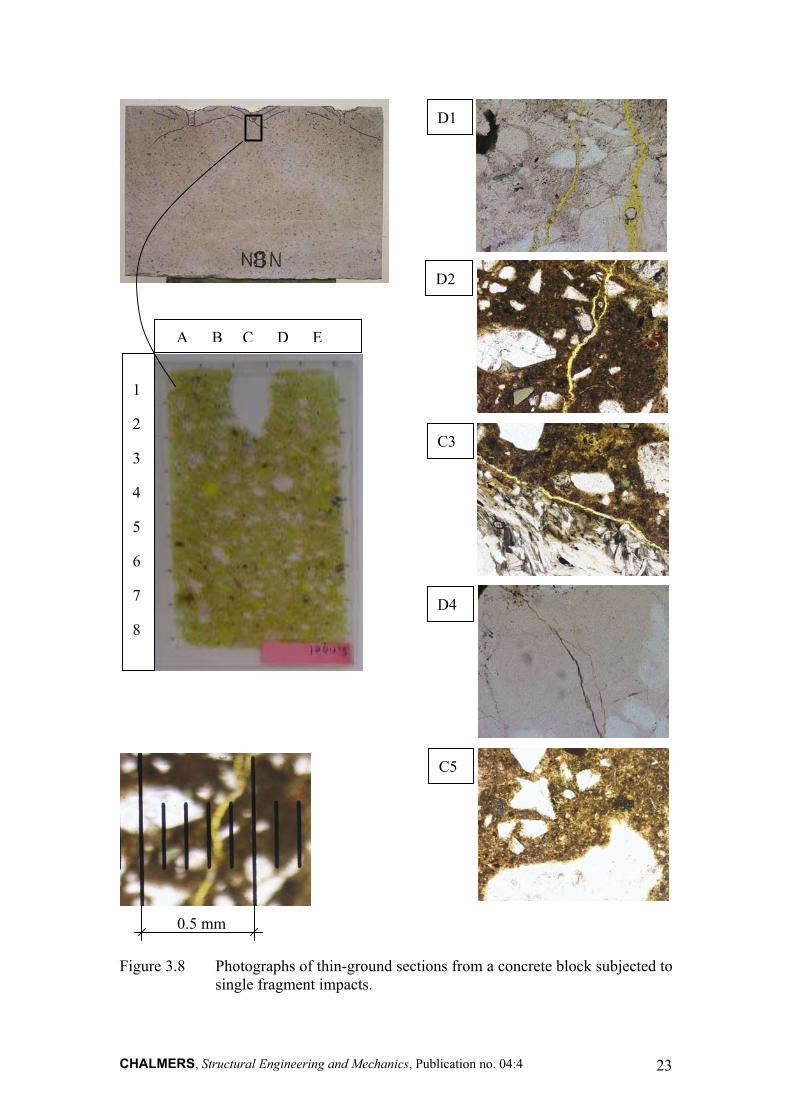
3.4 Thin-ground sections Thin-grinding, a precise method to localize the micro-cracking in a material, is commonly used in geological studies, see Kim and McCarter (1998). To study further the micro-cracking in the concrete below the impact zone, vertically drilled cylinders from the mid sections were thin-ground to rectangular sections of 90 x 50 mm, and a thickness of 25 µm. The sections were thin-ground from opposite sides. From the multiple fragment impact block a section was taken out at a depth between 80 and 170 mm below the surface of block No. 3. For the single fragment impact block, a section was taken out at a depth between 35 and 125 mm. As a reference, a thin-ground section was also taken from a block that was not subjected to any loading. Photographs of the thin-ground sections were taken with a camera placed inside the microscope: examples of those with the multiple fragment impacts are shown in Figure 3.7 and with the single fragment impacts in Figure 3.8. To make the micro cracks easier to see, polarized light was used when the photographs were taken. Also before grinding, the specimens were impregnated with fluorescent penetrant, to make the cracks clearer. The thin-ground sections showed that micro cracking occurred at a depth of approximately 120 mm below the surface of the fragment impact for the multiple hits. The width of the micro cracks is up to approximately 0.02 mm. These results verify well the uniaxial tests from drilled cylinders. The concrete strength was not affected at a depth of 150 mm; see Figures 3.5 and 3.6. For the single impacts the damage level was already reduced at a depth of approximately 75 mm. Photographs from undamaged regions where also taken and compared with photographs from a thin-ground section from the reference block as shown in Figure 3.9. From the thin-ground sections, it can be concluded that the damage from the blast and the fragment impacts was localized at the impact zone. Micro cracking occurs at a depth of approximately twice the maximum depth of penetration of the fragments: the concrete below had no micro cracks. For the single fragment impacts micro cracking occurs to a depth of 75 mm. However, the single fragment impacts cannot be compared with the multiple fragment impacts, since the multiple fragment impacts had a blast wave added to the loading.
CHALMERS, Structural Engineering and Mechanics, Publication no. 04:4 21
m
Figure 3.7 Photographs of thin-ground sectmultiple fragment impacts.
CHALMERS, Structural En22
A1
D2
D3
D4
C5
0.5 m
A B C D E
1
2
3
4
5
6
7
8
ions from a concrete block subjected to
gineering and Mechanics, Publication no. 04:4
D2
Figure 3.8 Photographs of thin-ground sectiosingle fragment impacts.
CHALMERS, Structural Engineering and Mechanics, Pu
D4
b
C5
0.5 mm
1
2
3
4
5
6
7
8
D1
C3
A B C D E
ns from a concrete block subjected to
lication no. 04:4 23
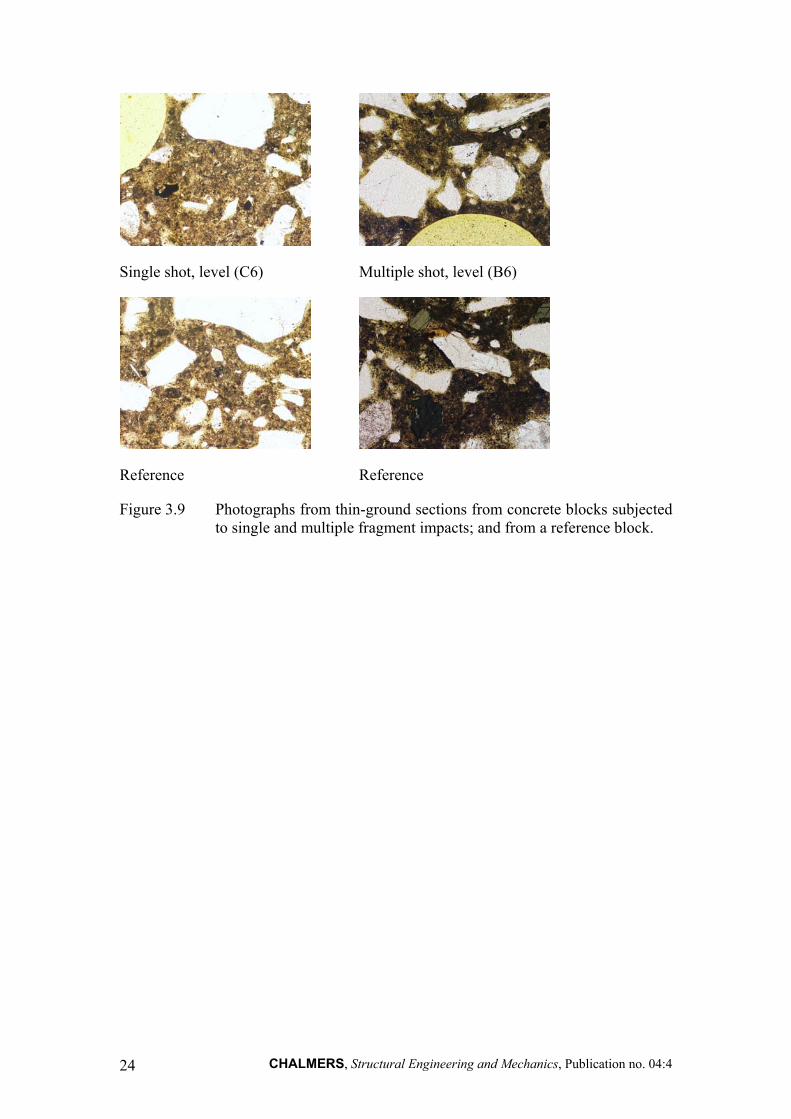
Single shot, level (C6) Multiple shot, level (B6)
Reference Reference
Figure 3.9 Photographs from thin-ground sections from concrete blocks subjected to single and multiple fragment impacts; and from a reference block.
CHALMERS, Structural Engineering and Mechanics, Publication no. 04:4 24
4 NUMERICAL MODELLING
4.1 Numerical techniques The development of computers in recent decades has made it possible to use numerical methods for severe dynamic loading, such as blast waves, or for penetration analyses of concrete. In the literature several papers deal with numerical analyses of projectile penetration, as in Hayhurst et al. (1996), Clegg et al. (1997), Hansson (1998), Zukas and Scheffler (2000) or Johnson et al. (2002). Numerical analyses of blast waves against concrete structures were carried out by Ågårdh (1997), Krauthammer (1999) and Johansson (2000). Numerical analyses of single fragment impacts were made by Bryntse (1997), Ågårdh and Laine (1999); Papados (2000) conducted numerical analyses of multiple fragment impacts.
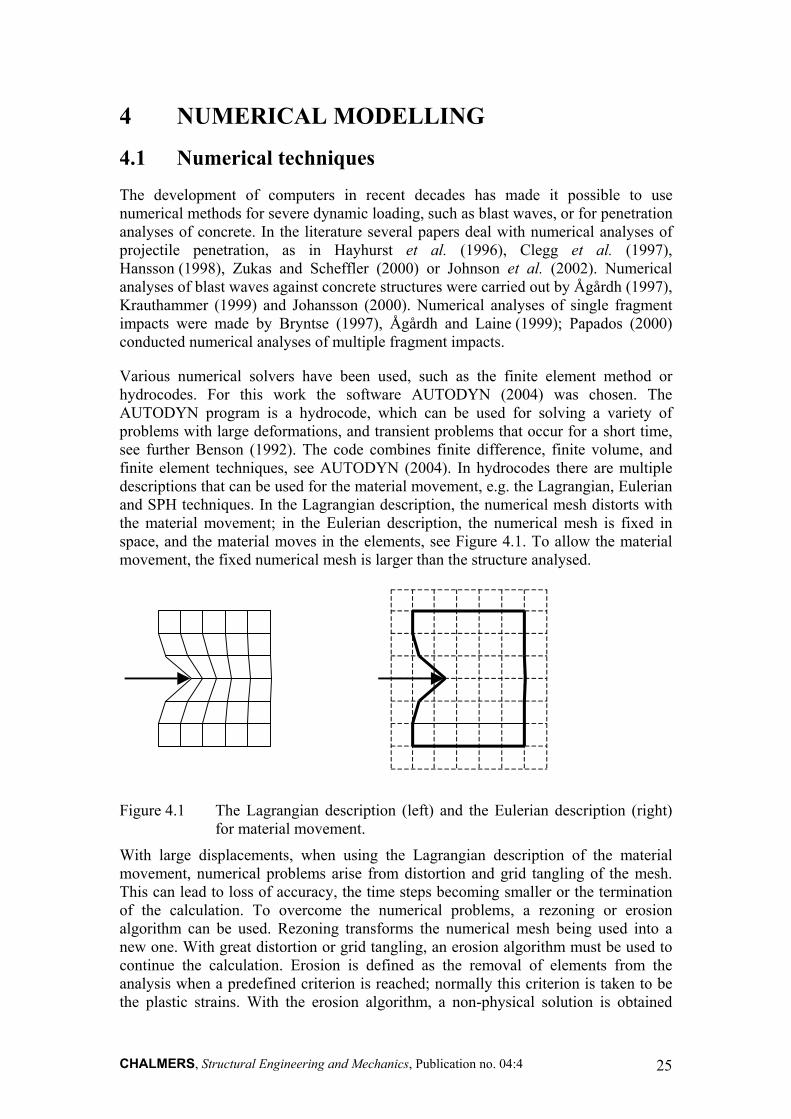
Various numerical solvers have been used, such as the finite element method or hydrocodes. For this work the software AUTODYN (2004) was chosen. The AUTODYN program is a hydrocode, which can be used for solving a variety of problems with large deformations, and transient problems that occur for a short time, see further Benson (1992). The code combines finite difference, finite volume, and finite element techniques, see AUTODYN (2004). In hydrocodes there are multiple descriptions that can be used for the material movement, e.g. the Lagrangian, Eulerian and SPH techniques. In the Lagrangian description, the numerical mesh distorts with the material movement; in the Eulerian description, the numerical mesh is fixed in space, and the material moves in the elements, see Figure 4.1. To allow the material movement, the fixed numerical mesh is larger than the structure analysed.
Figure 4.1 The Lagrangian description (left) and the Eulerian description (right) for material movement.
With large displacements, when using the Lagrangian description of the material movement, numerical problems arise from distortion and grid tangling of the mesh. This can lead to loss of accuracy, the time steps becoming smaller or the termination of the calculation. To overcome the numerical problems, a rezoning or erosion algorithm can be used. Rezoning transforms the numerical mesh being used into a new one. With great distortion or grid tangling, an erosion algorithm must be used to continue the calculation. Erosion is defined as the removal of elements from the analysis when a predefined criterion is reached; normally this criterion is taken to be the plastic strains. With the erosion algorithm, a non-physical solution is obtained
CHALMERS, Structural Engineering and Mechanics, Publication no. 04:4 25
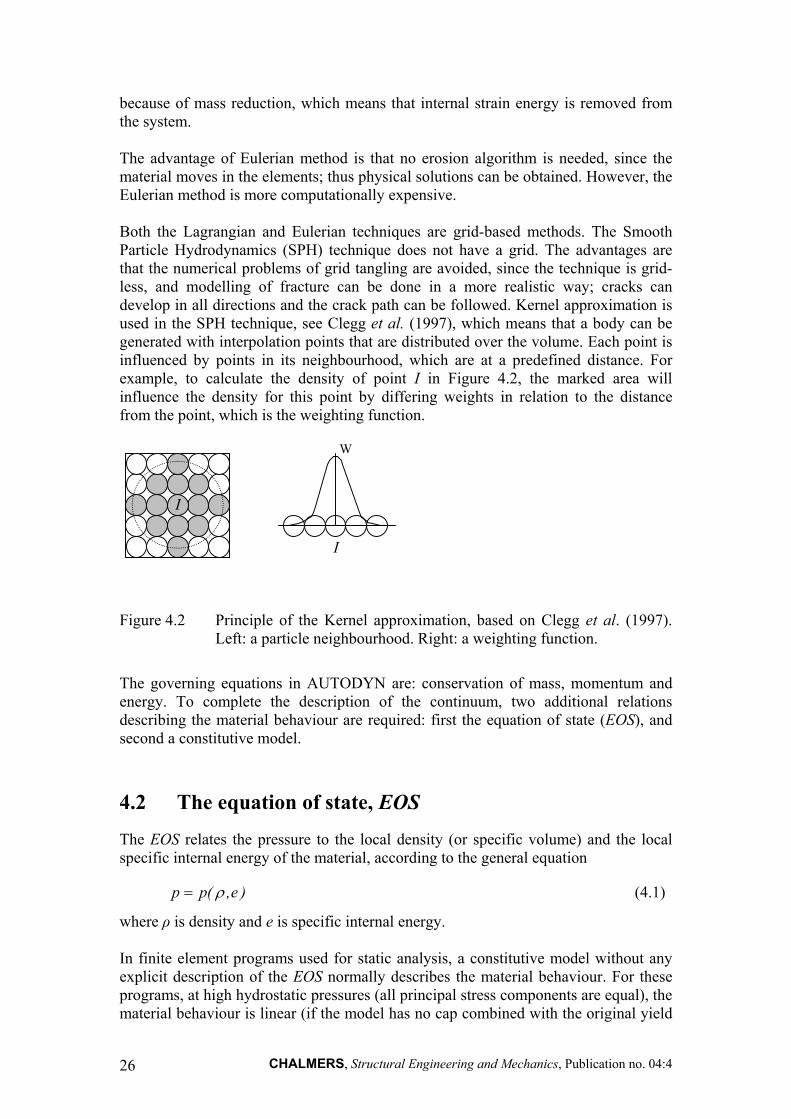
because of mass reduction, which means that internal strain energy is removed from the system. The advantage of Eulerian method is that no erosion algorithm is needed, since the material moves in the elements; thus physical solutions can be obtained. However, the Eulerian method is more computationally expensive. Both the Lagrangian and Eulerian techniques are grid-based methods. The Smooth Particle Hydrodynamics (SPH) technique does not have a grid. The advantages are that the numerical problems of grid tangling are avoided, since the technique is grid- less, and modelling of fracture can be done in a more realistic way; cracks can develop in all directions and the crack path can be followed. Kernel approximation is used in the SPH technique, see Clegg et al. (1997), which means that a body can be generated with interpolation points that are distributed over the volume. Each point is influenced by points in its neighbourhood, which are at a predefined distance. For example, to calculate the density of point I in Figure 4.2, the marked area will influence the density for this point by differing weights in relation to the distance from the point, which is the weighting function.
I
W
I
Figure 4.2 Principle of the Kernel approximation, based on Clegg et al. (1997). Left: a particle neighbourhood. Right: a weighting function.
The governing equations in AUTODYN are: conservation of mass, momentum and energy. To complete the description of the continuum, two additional relations describing the material behaviour are required: first the equation of state (EOS), and second a constitutive model.
4.2 The equation of state, EOS The EOS relates the pressure to the local density (or specific volume) and the local specific internal energy of the material, according to the general equation
)e,(pp ρ= (4.1)
where ρ is density and e is specific internal energy. In finite element programs used for static analysis, a constitutive model without any explicit description of the EOS normally describes the material behaviour. For these programs, at high hydrostatic pressures (all principal stress components are equal), the material behaviour is linear (if the model has no cap combined with the original yield
CHALMERS, Structural Engineering and Mechanics, Publication no. 04:4 26
surface). For severe loading, e.g. explosion or penetration into concrete, the hydrostatic pressure levels are so high that the non-linearity of the material behaviour must be taken into account. The EOS used in the analyses carried out here is a combined P-Alpha (P stands for pressure, and Alpha is defined as the current porosity) and polynomial. In Figure 4.3 the initial density, ρ0, is the undisturbed concrete density, and the solid density, ρs, is defined as the density at zero pressure of the fully compacted solid. The material behaves elastically until the initial compaction pressure, pcrush, is reached; thereafter, the plastic compaction phase takes place. Since no three-axial material tests were included in this project, the EOS, used in the numerical analyses in this thesis, is the one from AUTODYN standard library. p
ρ 0 ρ s ρ
p crush Elastic unloading/reloading
Elastic loading
Plastic compaction Fully compacted
Figure 4.3 The EOS for concrete, combined P-Alpha and polynomial; based on AUTODYN (2004).
For hydrostatic pressure, steel compression is approximately proportional to the pressure level. Hence, a linear EOS for steel (fragments and projectiles) is used. The pressure level depends on the bulk modulus, K, and the compression, µ, as shown in Figure 4.4.
ρ0
K
p
µ
p=K µ
ρ
1−=0ρ
ρµ
Figure 4.4 The EOS for steel; based on AUTODYN (2004).
CHALMERS, Structural Engineering and Mechanics, Publication no. 04:4 27
4.3 The RHT model for concrete The constitutive model used in the analyses with AUTODYN is the RHT model (Riedel, Hiermaier and Thoma), developed by Riedel (2000), as shown in Figure 4.5. Here, a short summary of the model is given: for detailed description of the material model, see Riedel (2000) and AUTODYN (2004). The model includes pressure hardening, strain hardening and strain rate hardening. Furthermore, the deviatoric section of the surfaces depends on the third-invariant. A damage model is included for strain softening. The model consists of three pressure-dependent surfaces: an elastic limit surface, a failure surface, and a surface for residual strength. The elastic limit surface limits the elastic stresses, and the hardening is linear up to the peak load.
Residual Strength
Elastic Limit Surface
Failure Surface
Yield strength, Y
Pressure, p
Figure 4.5 The RHT model used for concrete; based on Riedel (2000).
The failure surface is defined as
.FRFY),,,p(f )(RATE)(3)p(CAP)p(TXCeqeq εθσεθσ && −= (4.2)
The pressure dependency is defined as
[ ]NRATEspall
**cTXC )Fpp(AfY −= (4.3)
where A and N define the form of the failure surface as a function of pressure, p* is the pressure normalized by fc, and p*
spall is defined as p*(ft/fc). The failure surface is a function of the pressure and the strain rate. The third-invariant dependence is included in the failure surface with a function, R3(θ), which defines the transfer from the compressive meridian to the tensile meridian and the stress states between these. Several expressions for the pressure dependent yield surface have been proposed, as in Ansari and Li (1998). However, the one proposed by Attard and Setunge (1996) was used in this thesis, see Figure 4.6. The failure surface (static and compressive meridian), is determined by two parameters, A and N, the values for these can be found in Appendix C. As shown in the figure, the failure surface also fits to experimental data for high confinement pressure: data from Bažant et al. (1996).
CHALMERS, Structural Engineering and Mechanics, Publication no. 04:4 28
Figure 4.7 shows the failure surface for low pressures. The uniaxial compressive, tensile strengths and data from Attard and Setunge (1996) are shown as well.
0123456789
10
-1 0 1 2 3
Failure surface
Data from Attard andSetunge (1996)
Experimental data fromBazant et. al. (1996)
Y *
Y = f c Y * 7
Figure 4.6 Failure surfacnormalized by
0.0
0.5
1.0
1.5
2.0
-0.5 0.0
Y *
Figure 4.7 Failure surfacY* and p* are n
Furthermore, the RHT modeviatoric stresses under hydsurface is defined as
CHALMERS, Structural Engineer
see Figure 4.
4 5 6 7 8 9 10
p *
p = f c p *
e (static, and compressive meridian); Y* and p* are fc.
0.5 1.0
Failure surface
Data from Attard andSetunge (1996)Uniaxial compression
Uniaxial tension
p *
Y = f c Y *
p = f c p *
e (static, and compressive meridian) for low pressures; ormalized by fc.
del has a function, FCAP(p), which limits the elastic rostatic compression. The rate dependency in the yield
ing and Mechanics, Publication no. 04:4 29
⋅=<
⋅=>
=−
−
1-60t
0
1-60c
0RATE
s103 (tension), f 3/1 p for
s1030 on),(compressi f 3/1 p for F
εεε
εεε
δ
α
&&
&
&&
&
(4.4)
where α is the strain rate factor for compression and δ is the strain rate factor for tension. When the failure surface is reached, the softening phase starts, and continues until the residual strength surface is reached. The residual strength is defined by parameters B and M, and is a function of the pressure level:
(4.5) . ** Mresidual pBY ⋅=
The residual strength of the concrete, as shown in Figure 4.8, is calculated on the basis of the model proposed by Attard and Setunge (1996). The experiments and model, they used are for static loading with confinement pressure varying between 1 and 20 MPa. However, for projectile and fragment impacts, the confining pressure exceeds this range. Furthermore, it is not obvious that the residual strength is equal for both static and dynamic loading. Nevertheless, the Attard and Setunge (1996) model indicates the level of the residual strength. Imran and Pantazopoulou (2001) proposed a model in which the residual strength converges against the failure surface for high confinement pressures. In the numerical analyses in Section 5 and Paper IV, a new calibration of the residual strength was made, which is higher than one in the analyses reported in Papers II and III.
0
1
2
3
4
5
6
0 1 2 3 4
Failure surface
Residual strength
Data from Attard andSetunge (1996)
Y *
p*
Y = f c Y *
p = f c p *
Figure 4.8 Residual strength of concrete; Y* and p* are normalized by fc.
CHALMERS, Structural Engineering and Mechanics, Publication no. 04:4 30
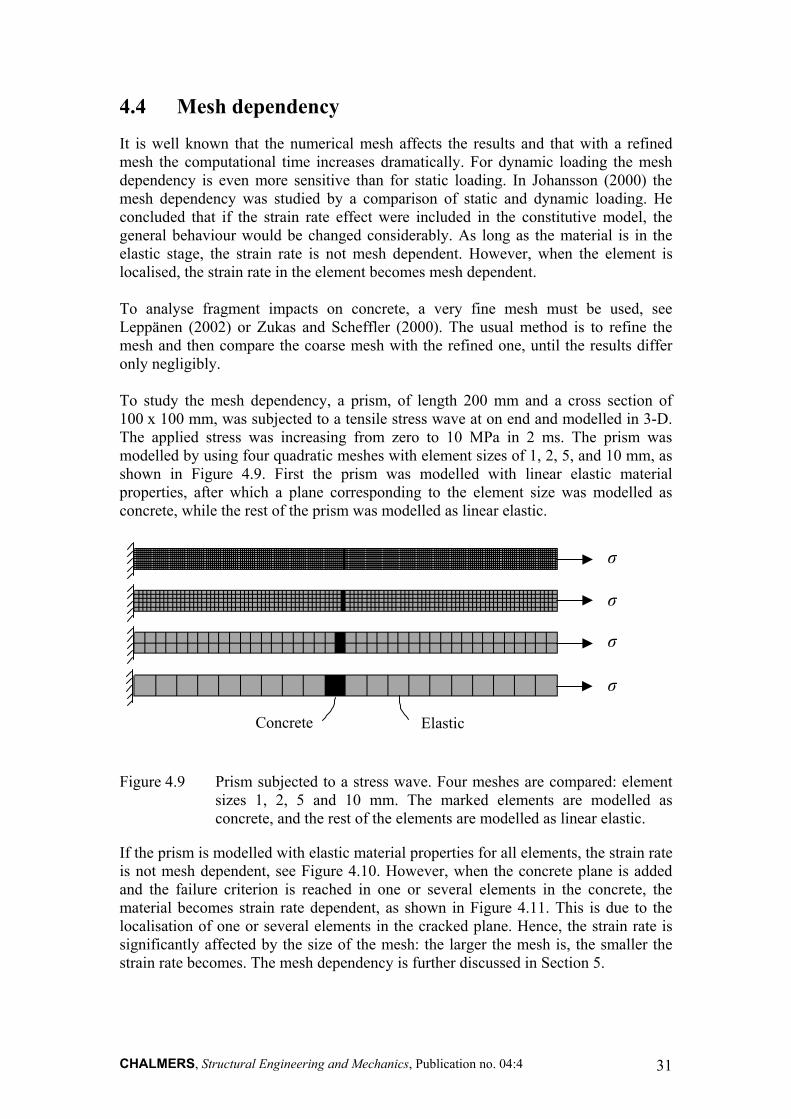
4.4 Mesh dependency It is well known that the numerical mesh affects the results and that with a refined mesh the computational time increases dramatically. For dynamic loading the mesh dependency is even more sensitive than for static loading. In Johansson (2000) the mesh dependency was studied by a comparison of static and dynamic loading. He concluded that if the strain rate effect were included in the constitutive model, the general behaviour would be changed considerably. As long as the material is in the elastic stage, the strain rate is not mesh dependent. However, when the element is localised, the strain rate in the element becomes mesh dependent. To analyse fragment impacts on concrete, a very fine mesh must be used, see Leppänen (2002) or Zukas and Scheffler (2000). The usual method is to refine the mesh and then compare the coarse mesh with the refined one, until the results differ only negligibly. To study the mesh dependency, a prism, of length 200 mm and a cross section of 100 x 100 mm, was subjected to a tensile stress wave at on end and modelled in 3-D. The applied stress was increasing from zero to 10 MPa in 2 ms. The prism was modelled by using four quadratic meshes with element sizes of 1, 2, 5, and 10 mm, as shown in Figure 4.9. First the prism was modelled with linear elastic material properties, after which a plane corresponding to the element size was modelled as concrete, while the rest of the prism was modelled as linear elastic.
Concrete Elastic
σ
σ
σ
σ
Figure 4.9 Prism subjected to a stress wave. Four meshes are compared: element sizes 1, 2, 5 and 10 mm. The marked elements are modelled as concrete, and the rest of the elements are modelled as linear elastic.
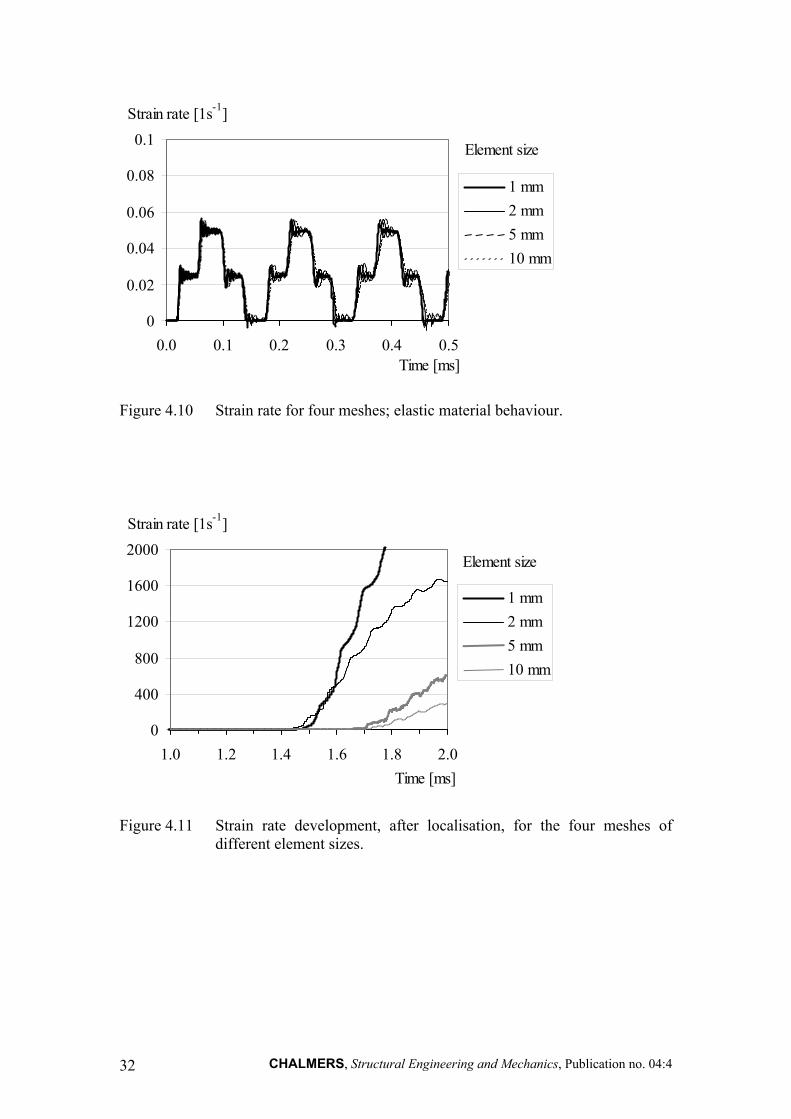
If the prism is modelled with elastic material properties for all elements, the strain rate is not mesh dependent, see Figure 4.10. However, when the concrete plane is added and the failure criterion is reached in one or several elements in the concrete, the material becomes strain rate dependent, as shown in Figure 4.11. This is due to the localisation of one or several elements in the cracked plane. Hence, the strain rate is significantly affected by the size of the mesh: the larger the mesh is, the smaller the strain rate becomes. The mesh dependency is further discussed in Section 5.
CHALMERS, Structural Engineering and Mechanics, Publication no. 04:4 31
0
0.02
0.04
0.06
0.08
0.1
0.0 0.1 0.2 0.3 0.4 0.5Time [ms]
1 mm2 mm5 mm10 mm
Strain rate [1s-1]
Element size
Figure 4.10 Strain rate for four meshes; elastic material behaviour.
0
400
800
1200
1600
2000
1.0 1.2 1.4 1.6 1.8 2.0Time [ms]
1 mm2 mm5 mm10 mm
Strain rate [1s-1]
Element size
Figure 4.11 Strain rate development, after localisation, for the four meshes of different element sizes.
CHALMERS, Structural Engineering and Mechanics, Publication no. 04:4 32
5 THE IMPROVED MATERIAL MODEL
5.1 General background The RHT model in AUTODYN includes a linear softening law to model the post-failure response of concrete in tension. However, concrete is very brittle material and the strength decreases rapidly after the failure initiation. Hillerborg (1976) published a linear crack softening law for practical use of the finite element method by using fracture mechanics. The softening slope was based on the stress-crack opening relationship. The crack opening was a function of the fracture energy and the ultimate tensile strength. Later, Hillerborg introduced a stepwise-linear crack softening law to improve the accuracy of the material response, see Hillerborg (1980). Since Hillerborg presented his work, several proposals for crack softening have appeared in the literature, for example, Gylltoft (1983) and Hillerborg (1985). The formulation proposed by Gylltoft was implemented in AUTODYN, as a part of this work, and it is discussed in Section 5.2. Since, the strain rate dependency is not accurately taken into account in the RHT model, a proposal for a strain rate law by Malvar and Ross (1998) is implemented in the model used here and discussed in Section 5.3. Mesh dependency is discussed in Section 5.4, and results with the improved model are given in Section 5.5 and Paper IV.
5.2 The modified crack softening law The bi-linear softening law proposed by Gylltoft (1983) was implemented in the RHT model. The softening law is based on the stress-crack opening relationship. To calculate the crack width, wu, when the stress has fallen to zero and a real crack has formed, the fracture energy, GF, and the tensile strength, ft, of concrete are used, as shown in Figure 5.1. However, AUTODYN follows a smeared crack approach, and consequently the stress-strain relation is used; the maximum cracking strain is calculated from the maximum crack opening. The crack width is smeared out to a distance, l. In two-dimensional models for un-reinforced concrete, this distance is normally approximated by the square root of the area of the element, see Johansson (2000). For three-dimensional models, the length is taken to be the third root of the volume of the element. The maximum cracking strain is:
lfG4
lw
t
Fuu ==ε
(5.1)
The two slopes, k1 and k2 in Figure 5.1 for the bi-linear softening are:
F
t
Gf
k2
1 =
.10
2
2t
Gf
k⋅
=d
CHALMERS, Structu
an
F (5.2)ral Engineering and Mechanics, Publication no. 04:4 33

σ σ ft wu = 4G F /f t ε ft/3 GF wu/6 w u w
k1
k2
Figure 5.1 The bi-linear uniaxial stress-crack opening relationship; based on Gylltoft (1983).
For linear crack softening slope in the RHT model is
.2
2
F
t
Gf
k⋅
= (5.3)
When the tensile failure stress has been reached, the slopes in Eqs. (5.2), k1 and k2, can be described by using the slope in Eq. (5.3) as:
for kk ⋅= 21 uεε
61
≤
(5.4)
kk ⋅=
102
2
for uεε
61
> (5.5)
where ε is the cracking strain and ε u is the ultimate cracking strain (when the stress has fallen to zero).
5.3 The modified strain rate law for concrete in tension Concrete is very strain rate sensitive, as described in Section 2.5. In the CEB-FIB Model Code 1990 (1993), there is a relationship for the DIF (dynamic increase factor) of tension as a function of strain rate. The DIF in the CEB is a design value, which means that the increase in strength is given at a higher strain rate than the one shown in experiments, i.e 30 s-1. However, results presented in Malvar and Ross (1998) show that the sudden increase in the DIF for concrete in tension occurs at a strain rate of approximately 1 s-1. Figure 5.2 compares a model proposed by Malvar and Ross and the CEB. The model proposed by Malvar and Ross fits the experimental data, as shown in the figure. The equations used can be found in Appendix C.
CHALMERS, Structural Engineering and Mechanics, Publication no. 04:4 34

0
1
2
3
4
5
6
7
8
Strain rate [s-1]
CEB 30 MPa Modified CEB 30 MPaCEB 70 MPa Modified CEB 70 MPaCowell 63 MPa Cowell 38 MPaCowell 32 MPa Hatano 23 MPaTakeda/Tachikawa Mellinger/Birkimer 36 MPaBirkimer 47 MPa McVay 35 MPaRoss split tension Ross direct tensionRoss mixes E-J Kormeling et alJohn et al. 53 MPa Antoun 57 MPa
DIF (Dynamic increase factor)
10-6 10-5 10-4 10-3 10-2 10-1 100 101 102 103
Figure 5.2 The strain rate dependency for concrete in tension. Comparison with experimental data and modified CEB model by Malvar and Ross; recommendations according to the CEB-FIB Model Code 90. Based on Malvar and Ross (1998).
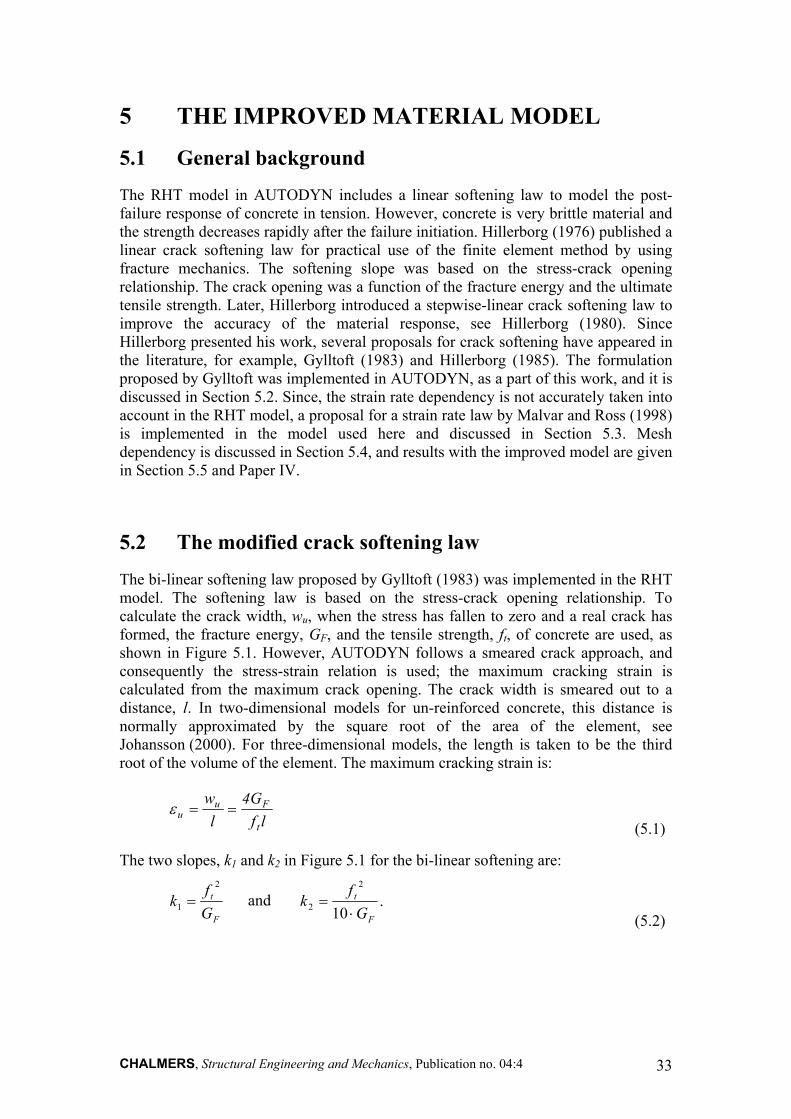
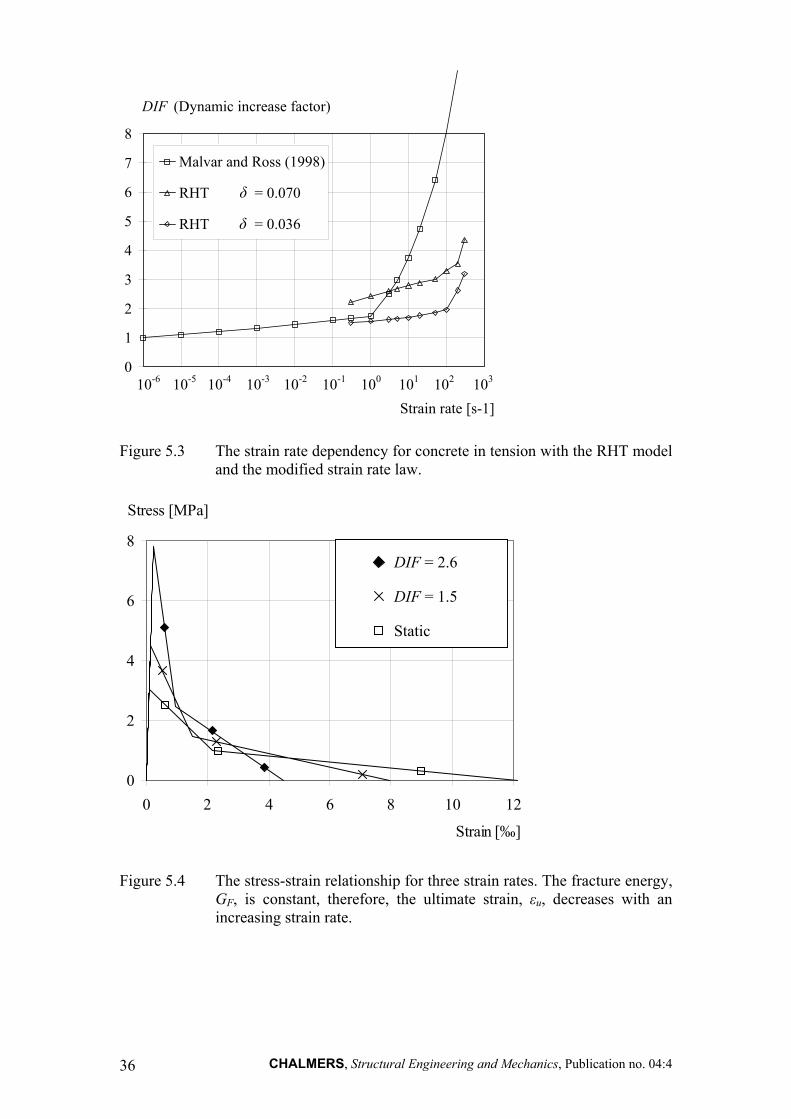
In the RHT model the DIF for tension is determined by the parameter δ, see Eq. (4.4). Figure 5.3 shows the DIF for two values of δ. As seen in the figure, this parameter cannot be chosen in a way that fits the experimental data in Figure 5.2. For this reason a strain rate law was implemented in the RHT model. The strain rate law was implemented as stepwise linear, which means any DIF relationship can be chosen by the user; in the figure the chosen DIF according to Malvar and Ross (1998) is shown.
Moreover, Weerheijm (1992) reported that the fracture energy was of the same value for static and dynamic loading. Thus, the fracture energy in the modified RHT model is assumed to be constant. A constant value for the fracture energy in combination with higher strength, due to the strain rate effect, causes the ultimate cracking strain to decrease. Hence, the material behaviour becomes more brittle at higher strain rates for a single crack. However, in impact loading several cracks develop simultaneously; consequently the absorbed energy increases, see Svahn (2003). An example of static and dynamic stress-strain relationships is shown in Figure 5.4.
CHALMERS, Structural Engineering and Mechanics, Publication no. 04:4 35
0
1
2
3
4
5
6
7
8
Strain rate [s-1]
Malvar and Ross (1998)
RHT = 0.070
RHT = 0.036
DIF (Dynamic increase factor)
10-6 10-5 10-4 10-3 10-2 10-1 100 101 102 103
Figure 5.3 The strain rate dependency for concrete in tension with the RHT model and the modified strain rate law.
0
2
4
6
8
0 2 4 6
Stress [MPa]
Figure 5.4 The stress-strain relGF, is constant, thincreasing strain rat
CHALMERS36
DIF = 2.6
DIF = 1.5
Static
δ
δ
8 10 1
Strain [‰]
2
ationship for three strain rates. The fracture energy, erefore, the ultimate strain, εu, decreases with an e.
, Structural Engineering and Mechanics, Publication no. 04:4
5.4 Mesh dependency Localisation of an element in a mesh leads to the material becoming strain rate dependent. The localisation has a large effect on the strain rate, and consequently on the DIF. Therefore, the tensile failure stress can increase after the localisation of one or several elements, as shown in Figure 5.5; this behaviour is not realistic.
For this reason, to overcome the mesh dependency problem, a cut-off is included in the modified material model. The cut-off limits the tensile failure stress; the value is determined while the material is still in the elastic stage. The stress value chosen starts from the time step when static tensile strength is reached. From this time step the DIF is calculated from the actual strain rate, and the failure stress is then determined from the DIF. Figure 5.6 shows the tensile failure stress for the four meshes tested in Section 4.4; it is shown that, when using the cut-off, the failure stress becomes approximately the same independent of the element size. Figure 5.6 also shows the stress-time history for these four meshes. For this example the static tensile strength is equal to 5 MPa. In the subroutine in AUTODYN, the failure stress is determined when the static tensile strength has been reached: for this example approximately at 1.0 ms. If the tensile stress is below the static tensile strength, the failure stress has a value of zero. At the point when the tensile stress has reached, the value of the failure stress, the softening starts.
0
10
20
30
40
0.0 0.5 1.0 1.5 2.0
Time [ms]
Strain rate
Failure stress[MPa]
[10s-1]
Figure 5.5 The crack softening failure stress and strain rate development after localisation.
CHALMERS, Structural Engineering and Mechanics, Publication no. 04:4 37
0
2
4
6
8
10
0.0 0.4 0.8 1.2 1.6 2.0Time [ms]
1 mm - Failure stress
1 mm - Stress
2 mm - Failure stress
2 mm - Stress
5 mm - Failure Stress
5 mm - Stress
10 mm - Failure stress
10 mm - Stress
Stress [MPa]
Figure 5.6 The failure stress and axial stress in the loading direction for the four meshes.
Zukas and Scheffler (2000) studied projectile impacts on concrete, and concluded that, for accuracy, there should be at least three elements across the radius of the projectile. Numerical analyses in this thesis were made for fragment impacts, with four meshes, see Table 5.1. In the analyses a spherical fragment with a radius of 10.3 mm strikes a concrete wall with a thickness of 250 mm. The fragment impact velocity was 1 201 m/s and the material parameters were the same as those in the last example in this section. Figure 5.7 shows the damage plot from the numerical analyses for the four meshes. The damage is approximately the same for element sizes 1 and 2 mm, and the depth of penetration converge for the element size of 2 mm.
Table 5.1 Mesh dependency, sizes and number of elements for the target. Crater diameter and depth of penetration.
Mesh Size of element [mm]
Number of elements
Crater diameter [mm]
Depth of penetration [mm]
a) 4 63 x 125 130 26.6
b) 3 83 x 167 132 45.9
c) 2 125 x 250 144 86.8
d) 1 250 x500 142 89.8
CHALMERS, Structural Engineering and Mechanics, Publication no. 04:4 38
103 100 115 118 [mm]
Figure 5.7 Effects of meshing on crater size. From left: mesh a, b, c and d.
5.5 Results with the improved material model A reliable model must be able to describe experimental results from several different experiments with varying mass and velocities. Numerical analyses with the improved RHT model were made, and examples can be found in Paper IV. Furthermore, a parametric study was conducted (Paper IV), in which the fracture energy, tensile strength, the softening slope and the strain rate were examined. The crack width and scabbing increase with decreasing static tensile strength. By increasing the fracture energy, the cracking and scabbing were greatly reduced. Using a bi-linear softening law for tension increases the damage and the diameter of scabbing only slightly more than using a linear one. Moreover, the scabbing was greatly influenced by the choice of strain rate law. Thus, it is important to have accurate material properties to capture the concrete behaviour. The tensile strength and fracture energy used are calculated according to the CEB-FIB Model Code 1990 (1993). The bi-linear softening law proposed by Gylltoft (1983) was used, which follows the softening slope in tension more accurately than a linear one. The strain rate law used is the one proposed by Malvar and Ross (1998), which fits the experimental data well.
In a example where a single fragment perforates a concrete wall, experiments reported by Erkander and Pettersson (1985) were analysed with the Lagrangian, Eulerian and SPH techniques. The wall was 1000 x 1000 mm with a thickness of 70 mm, and the fragments were spherical with a radius of 10.3 mm and an impact velocity of 358 m/s. The concrete had an average cube strength of 35 MPa (tested on 150 mm side cubes), which corresponds to a mean value of cylinder strength of 30 MPa according to the CEB-FIB Model Code 1990 (1993). The tensile strength and fracture energy were also calculated according to the CEB; tensile strength was 2.34 MPa and fracture energy was 82.5 Nm/m2. In the experiment, the depth of penetration was 14 mm, spalling diameter was 85 mm and the diameter of scabbing was 120 mm. For the numerical analyses a 2-D axisymmetric model was used and a mesh size of 1.25 mm was chosen; consequently there were 56 x 400 elements, grids or interpolation points. The numerical analysis was in good agreement with the experiment results, especially the SPH technique, as shown in Figure 5.8.
CHALMERS, Structural Engineering and Mechanics, Publication no. 04:4 39
Figure 5.8 Numerical analyses with different techniques. From left: Lagrangian,
Eulerian and SPH techniques. The white dashed lines show experimental results reported by Erkander and Pettersson (1985). Red area corresponds to damage equal to one, i.e. the ultimate cracking strain has been reached.
A comparison of numerical analyses with the SPH technique of fragment perforation, using the RHT model and the modified RHT model, was conducted (the same example as in Paper IV). The input data for the RHT model, and for the modified RHT model can be found in Appendix C. The spalling and depth of penetration was of the same order for both the RHT and the modified RHT models. However, the modified model improved the scabbing. The results from the numerical analyses are shown in Figure 5.9. The deviation, in scabbing diameter, between experiments and numerical analyses with the RHT model was between 6 and 28 %, while with the modified RHT model the deviation was only between 2 and 10 %.
CHALMERS, Structural Engineering and Mechanics, Publication no. 04:4 40
v = 1 024 m/s v = 1 163 m/s v = 1 283 m/s
172
mm
158
mm
176
mm
v = 1 024 m/s v = 1 163 m/s v = 1 283 m/s
149
mm
164
mm
158
mm
Figure 5.9 Numerical analyses of fragment penetration, concrete spalling and scabbing. White dashed lines show craters reported by Erkander and Pettersson (1985). Above: RHT model; Below: modified RHT model.
CHALMERS, Structural Engineering and Mechanics, Publication no. 04:4 41
6 CONCLUSIONS
6.1 General conclusions The aim of this thesis was to study explosive loading on civil defence shelters. The load is a combination of a blast wave and fragment impacts. However, the main focus was on the numerical modelling of projectile and fragment impacts on plain concrete members. In addition, experiments with a combination of numerical analyses were conducted to gain a deeper understanding of concrete subjected to blast and fragment impacts.
The numerical analyses carried out within the scope of this work show that this can be a very powerful tool and that fragment impacts can be modelled with advanced non-linear models. Such analyses can extend the comprehension of phenomena that cannot be revealed by conventional methods, i.e. experiments. Nevertheless, experiments are needed since they describe the reality. From previous experiments, found in the literature, empirical equations have been worked out to estimate the depth of penetration of projectiles or fragment impacts; they give quite good estimations. However, these empirical equations do not describe the material behaviour, such as cracking, failure modes or residual strength of a structure subjected to explosive loading.
Concrete structures subjected to blast and fragment impacts behave very differently from statically loaded structures. The initial stiffness and the ultimate strength, in both compression and tension, increase for dynamically loaded structures due to the strain rate effects. When a projectile or fragment hits a concrete target, the material is subjected to high strain rates, and it is also exposed to high confinement pressures. This influences greatly the depth of penetration, since the strength increases due to strain rate effects in compression, and the ultimate compressive strength increases with high pressure.
When a blast wave and fragments strike a concrete target, a compressive stress wave propagates through the concrete. When the stress wave reaches the boundaries, it will be reflected as a tensile stress wave. Since the tensile strength of the concrete is much less than the compressive strength, the reflected stress wave may cause scabbing on the side opposite the impact. The impact also causes spalling at the point of contact; the amount of spalling is influenced by the tensile strength of concrete. Furthermore, the concrete is severely cracked, and the level is influenced by the tensile strength and fracture energy of the concrete.
In the experiments thick concrete blocks were subjected to a blast wave and fragment impacts. Although both single and multiple fragments were shot, no blast wave resulted from the single fragment impacts, since these fragments were shot from a canon. In combination with the experiments, numerical analyses were made. It was concluded for the multiple impacts that the damage in the spalling zone was caused mainly by the fragment impacts. Cylinders, drilled from the shot concrete blocks, were used for uniaxial compressive and splitting tensile tests. The strength was hardly affected at a depth of approximately twice the maximum depth of penetration. Furthermore, when the blast wave was added, in the numerical analyses, there was
CHALMERS, Structural Engineering and Mechanics, Publication no. 04:4 42
greater damage inside the shot concrete blocks. The increased damage was caused by reflections at the boundaries.
The software AUTODYN was used in the numerical analyses, with the Lagrangian, the Eulerian and the SPH techniques. The Lagrangian method is preferable for quick estimations. However, the SPH technique gives the most accurate results, although it is computationally more expensive.
In AUTODYN, there is a model, the RHT, to simulate concrete. The RHT model captures realistically the behaviour of concrete subjected to high pressures and high strain rates in compression. However, the model does not accurately describe concrete behaviour in tension. The softening slope in tension is modelled as linear and the strain rate law does not fit experimental results. Thus, to get an improved numerical tool for analysing projectile and fragment impacts in concrete, a bi-linear softening law was implemented in the RHT model. In addition, to capture the behaviour for concrete in tension at high strain rates, a strain rate law was also implemented. The strain rate law can be adapted to the relationship chosen for the dynamic increase factor. In the model implementation, the fracture energy chosen is constant. Moreover, the mesh becomes strain rate dependent when an element is localised (cracked element) in the numerical analyses. A cut-off that limits the crack softening failure stress was also implemented in the material model to reduce the mesh dependency.
Furthermore, a parametric study was conducted, in which the fracture energy, tensile strength, the softening slope and the strain rate were examined. The crack width and scabbing increase with decreasing static tensile strength. By increasing the fracture energy, the cracking and scabbing were greatly reduced. Using a bi-linear softening law for tension increases the damage and the diameter of scabbing only slightly more than using a linear one. It was found that the scabbing was greatly influenced by the choice of strain rate law. Thus, it is important to have accurate material properties to capture the concrete behaviour, not only for concrete in compression, also for concrete in tension. The numerical model was tested in several different experiments with projectile and fragments striking a concrete target. The accuracy of the results was better with the new model than with the existing one in AUTODYN. Hence, this model meets the need of the next generation of analysts for greater practical and deeper theoretical understanding of concrete structures subjected to blast and fragment impacts.
6.2 Suggestions for future research The work presented in this thesis is part of a research project with the long-term aim to increase knowledge of reinforced concrete structures subjected to loading with a combination of blast and fragment impacts. In the future, it is important to have a tool, which can be used for general applications and can replace expensive experiments. However, experiments can be a complement for numerical analyses.
The numerical results presented in this thesis are valid for plain concrete members. A natural continuation would be to study reinforced concrete: the interaction between concrete and reinforcement, and the effects of confinement due to the reinforcement.
CHALMERS, Structural Engineering and Mechanics, Publication no. 04:4 43
The next step is structural elements, followed by whole structures. A limitation in this work is the shape of the fragments in the numerical analyses; only spherical fragments are used. To extend the work, the complexity of a whole cluster of heterogeneous fragments that fly from a bomb in combination with a blast wave can be analysed with AUTODYN.
From an explosion, besides the blast wave and fragment impacts, a lot of energy is released in the form of heat. The temperature effects were disregarded in this work. However, the time duration of the impacts is very short, and the temperature may not affect the overall response of the concrete for short-duration loads.
Finally, we need to know more about the phenomena of multi-axial dynamic loading in relation to the strain rate effects and residual strength. The material tests for residual strength are limited to static load: the question is whether the residual strength is the same for dynamic loading as for static loading.
CHALMERS, Structural Engineering and Mechanics, Publication no. 04:4 44

7 References Andersson, A., Axelsson, H. and Holmström, S. (1989): Splitter från flygbomber.
Sprängningar med 250 kg mb m/50 och 500 kg mb m/56 (In Swedish). Försvarets Forskningsanstalt, FOA Rapport, C 20744-2.3, Stockholm, Sweden, January, 37 pp.
Ansari, F. and Li, Q. B. (1998): High-strength concrete subjected to triaxial compression. ACI Materials Journal, Vol. 95, No. 6, Nov-Dec, pp. 747-755.
Attard, M. M. and Setunge, S. (1996): Stress-strain relationship of confined and unconfined concrete. ACI Materials Journal, Vol. 93, No. 5, Sep-Oct, pp. 432-442.
AUTODYN Manuals (2004): AUTODYN Manuals. Version 5, Century Dynamics, Inc., Concord, CA, USA.
Baker, W. E. (1973): Explosions in Air. Univ. of Texas Press. Austin, TX, USA, 268 pp.
Bažant, Z. P., Xiang, Y. Y., Adley, M. D., Prat, P. C. and Akers, S. A. (1996): Microplane Model for Concrete: II: Data Delocalization and Verification. Journal of Engineering Mechanics, Vol. 122, No. 3, March, pp. 255-262.
Benson, D. J. (1992): Computational methods in Lagrangian and Eulerian hydrocodes. Computer Methods in Applied Mechanics and Engineering, Vol. 99, No. 2-3, September, pp. 235-394.
Bischoff, P. H. and Perry, S. H. (1991): Compressive behaviour of concrete at high strain rates. Materials and Structures, Vol. 24, pp. 425-450.
Bryntse, A. (1997): Penetration av stålsplitter vid 1 500 m/s mot armerad betong (Förstudie) (In Swedish). Försvarets Forskningsanstalt, FOA-D--97-00304-311-SE, Stockholm, Sweden, January, 9 pp.
Bulson, P. S. (1997): Explosive Loading of Engineering Structures. E & FN Spon. London, UK, 233 pp.
CEB-FIB Model Code 1990 (1993): CEB-FIB Model Code 1990. Design Code, Thomas Telford, Lausanne, Switzerland, 437 pp.
CHALMERS, Structural Engineering and Mechanics, Publication no. 04:4 45
Clegg, R. A., Sheridan, J., Hayhurst, C. J. and Francis, N. J. (1997): The application of SPH techniques in AUTODYN-2D to kinetic energy penetrator impacts on multi-layered soil and concrete targets. 8th International Symposium on Interaction of the Effects of Munitions with Structures, Virginia, USA, 22-25 April, 9 pp.
ConWep (1992): ConWep. Collection of conventional weapons effects calculations based on TM 5-855-1, Fundamentals of Protective Design for Conventional Weapons, U. S. Army Engineer Waterways Experiment Station, Vicksburg, VA, USA.
Ekengren, B. (2003): Skyddsrumsregler SR (Shelter Regulations, In Swedish). Swedish Rescue Services Agency, Publication B54-141/03, Karlstad, Sweden, 126 pp.
Engberg, T. and Karevik, S. (1987): Fortifikationshandbok del 1, FortH 1. Försvarets läromedelscentral (FLC), Stockholm, Sweden, 50 pp.
Erkander, Å. and Pettersson, L. (1985): Betong som splitterskydd: Skjutförsök på plattor av olika betongmaterial (Concrete as protective material against fragment impacts: Fragment impacts on concrete plates of different types of concrete, In Swedish). Försvarets Forskningsanstalt, C 20574-D6(D4), Stockholm, Sweden, May, 66 pp.
Forsén, R. (1989): Initialverkan, verkan på byggnader av inneslutna explosioner (In Swedish). Forsvarets Forskningsanstalt, FOA rapport C 20747-2.6, Stockholm, Sweden, February, 37 pp.
Forsén, R. (1997): Belastning av betongplattor med tryck och splitter från 250 kg minbomber (In Swedish). Försvarets Forskningsanstalt, FOA-R--97-00418-311-SE, Tumba, Sweden, February, 50 pp.
Forsén, R. and Edin, K. (1991): Vapenverkan mot flervånings betongbyggnad III. Bestämning av skador från splitterladdningar mot husfasad i skala 1:4 (In Swedish). Försvarets Forskningsanstalt, FOA rapport C 20860-2.3, Sundbyberg, Sweden, December, 40 pp.
Forsén, R. and Nordström, M. (1992): Damage to Reinforced Concrete Slabs Due to the Combination of Blast and Fragment Loading (In Swedish). National Defence Research Establishment (FOA), FOA Report B 20101-2.6, Tumba, Sweden, September, 12 pp.
CHALMERS, Structural Engineering and Mechanics, Publication no. 04:4 46

Forsén, R. and Sten, G. (1994): Utredning om splitterverkan/splitterskydd. Jämförelse mellan två 250 kg minbomber (In Swedish). Försvarets Forskningsanstalt, FOA dnr 94-2502/S, Sundbyberg, Sweden, April, 76 pp.
Gebbeken, N. (2001): Determination of shock equation of state properties of concrete using full-scale experiments and flyer-plate impact tests. Trends in computational structural mechanics, Barcelona, Spain, pp. 109-117.
Grady, D. (1996): Shock equation of state properties of concrete. Structures Under Shock and Impact IV, Udine, Italy, pp. 405-414.
Gylltoft, K. (1983): Fracture Mechanics Models for Fatigue in Concrete Structures. Doctoral Thesis. Division of Structural Engineering, Luleå University of Technology, Luleå, Sweden, 210 pp.
Hansson, H. (1998): Numerical simulation of concrete penetration. FOA-R, Defence Research Establishment, FOA-R--98-00816-311--SE, Tumba, Sweden, 17 pp.
Hayhurst, C. J., Clegg, R. A., Livingstone, I. A. and Francis, N. J. (1996): The application of SPH techniques in AUTODYN-2D to ballistic impact problems. 16th International Symposium on Ballistics, San Francisco, CA, USA, 23-28 September, 9 pp.
Hillerborg, A. (1976): Analysis of crack formation and crack growth in concrete by means of fracture mechanics and finite elements. Cement and Concrete Research, Vol. 6, pp. 773-782.
Hillerborg, A. (1980): Analysis of fracture by means of the fictitious crack model, particularly for fibre reinforced concrete. The International Journal of Cement Composites, Vol. 2, No. 4, November, pp. 177-184.
Hillerborg, A. (1985): The theoretical basis of a method to determine the fracture energy GF of concrete. RILEM TECHICAL COMMITTEES, Vol. 18, No. 106, pp. 291-296.
Imran, I. and Pantazopoulou, S. J. (2001): Plasticity model for concrete under triaxial compression. Journal of Engineering Mechanics, Vol. 127, No. 3, March, pp. 281- 290.
Janzon, B. (1978): Grundläggande Stridsdelsfysik (In Swedish). Försvarets Forskningsanstalt, FOA Rapport C 20261-D4, Stockholm, Sweden, September, 164 pp.
CHALMERS, Structural Engineering and Mechanics, Publication no. 04:4 47
Johansson, M. (2000): Structural Behaviour in Concrete Frame Corners of Civil Defence Shelters, Non-linear Finite Element Analyses and Experiments. Doctoral Thesis. Department of Structural Engineering, Concrete Structures, Chalmers University of Technology, Publication no. 00:2, Göteborg, Sweden, 204 pp.
Johnson, G. R., Stryk, R. A., Beissel, S. R. and Holmquist, T. J. (2002): An algorithm to automatically convert distorted finite elements into meshless particles during dynamic deformation. International Journal of Impact Engineering, Vol. 27, No. 10, pp. 997-1013.
Jonasson, T. (1990): Kontaktverkan 1, Sprängladdningars kontaktverkan på armerade betongplattor (In Swedish). Försvarets Forskningsanstalt, FOA-R, C 20809-2.6, Sundbyberg, August, 58 pp.
Kim, D. S. and McCarter, M. K. (1998): Quantitative assessment of extrinsic damage in rock materials. Rock Mechanics and Rock Engineering, Vol. 31, No. 1, January - March, pp. 43-62.
Krauthammer, T. (1999): Blast-resistant structural concrete and steel connections. International Journal of Impact Engineering, Vol. 22, No. 9-10, pp. 887-910.
Krauthammer, T. (2000): Modern Protective Structures, Design, Analysis and Evaluation. Course notes. The Pennsylvania State University, 358 pp.
Leppänen, J. (2002): Dynamic Behaviour of Concrete Structures subjected to Blast and Fragment Impacts. Licentiate Thesis. Department of Structural Engineering, Concrete Structures, Chalmers University of Technology, Publication no. 02:4, Archive no. 31, Göteborg, Sweden, 71 pp.
Leppänen, J. (2003): Splitterbelastad betong - Experiment och numeriska analyser (Fragment Impacts into Concrete - Experiments and Numerical analyses, In Swedish). Department of Structural Engineering and Mechanics, Concrete Structures, Chalmers University of Technology, Report no. 03:6, Göteborg, Sweden, August, 76 pp.
Malvar, L. J. and Ross, C. A. (1998): Review of Strain Rate Effects for Concrete in Tension. ACI Materials Journal, Vol. 95, No. 6, November-December, pp. 735-739.
CHALMERS, Structural Engineering and Mechanics, Publication no. 04:4 48
Nordström, M. (1992): Splitterbelastning av betongplattor 1, Metodik för bestämning av energiupptagande förmåga hos armerade betongplattor belastade med olika splittertätheter (In Swedish). Försvarets Forskningsanstalt, FOA rapport, D 20209-2.3, Sundbyberg, October, 54 pp.
Nordström, M. (1993): Splitterbelastning av betongplattor II, Energiupptagande förmåga hos armerade betongplattor belastade med olika splittertätheter (In Swedish). Försvarets Forskningsanstalt, FOA rapport, D 20226-2.3, Sundbyberg, June, 30 pp.
Nordström, M. (1995): Försök med experimentladdningar för simulering av splitterlast från spränggranater och minbomber (In Swedish). Försvarets Forskningsanstalt, FOA-R--95-00109-7(6,2.6)--SE, Stockholm, Sweden, March, 54 pp.
Nordström, M. (1995): Splitterbelastning av betongplattor III, Energiupptagande förmåga hos armerade betongplattor belastade med olika kombinationer av splitterhastigheter, splittertätheter och splitterstorlekar (In Swedish). Försvarets Forskningsanstalt, FOA-R--95-00094-7(6,2.6)--SE, Stockholm, Sweden, March, 101 pp.
Papados, P. P. (2000): A reinforced concrete structure under impact: Response to high rate loads. Sixth International Conference on Structures Under Shock and Impact, Cambridge, UK, July, pp. 501-510.
Plos, M. (1995): Application of fracture mechanics to concrete bridges, Finite Element Analyses and Experiments. Doctoral Thesis. Department of Structural Engineering, Division of Concrete Structures, Chalmers University of Technology, Göteborg, Sweden, 57 pp.
Rempling, R. (2004): Concrete wall subjected to fragment impacts - Numerical analyses of perforation and scabbing. Master´s Thesis. Department of Structural Engineering and Mechanics, Concrete Structures, Chalmers University of Technology, 04:1, Göteborg, Sweden, 54 pp.
Richart, F. E., Brandtzaeg, A. and Brown, R. L. (1928): A Study of the Failure of Concrete under Combined Compressive Stresses. Bulletin No.185, University of Illinois, Engineering Experimental Station, Urbana, Illinois, USA.
Riedel, W. (2000): Beton unter dynamischen Lasten Meso- und makromechanische Modelle und ihre Parameter. In German, Doctoral Thesis. Institut Kurzzeitdynamik, Ernst-Mach-Institut, der Bundeswehr Munchen, Freiburg, 210 pp.
CHALMERS, Structural Engineering and Mechanics, Publication no. 04:4 49
Rinehart, E. J. and Welch, C. R. (1995): Material properties testing using high explosives. International Journal of Impact Engineering, Vol. 17, No. 4-6, pp. 673-684.
Ross, C. A., Jerome, D. M., Tedesco, J. W. and Hughes, M. L. (1996): Moisture and strain rate effects on concrete strength. ACI Materials Journal, Vol. 93, No. 3, May-June, pp. 293-300.
Svahn, P. O. (2003): Impact-Loaded Concrete Piles - Theoretical and experimental study of load effects and capacity. Licentiate Thesis. Department of Structural Engineering, Concrete Structures, Chalmers University of Technology, Publication no. 02:4, Archive no. 38, Göteborg, Sweden, 51 pp.
von Essen, W. (1973): Provisoriska anvisningar för dimensionering av armerade betongkonstruktioner som skydd mot verkan av konventionella vapen inom närmissområde. Kommentarer (In Swedish). Fortifikationsförvaltningen, Publ. 25:2, May, 34 pp.
Weerheijm, J. (1992): Concrete under impact tensile loading and lateral compression. Doctoral Thesis. Delft University of Technology, The Netherlands, 157 pp.
Zielinski, A. J. (1982): Fracture of concrete and mortar under uniaxial impact tensile loading. Doctoral Thesis. Delft University of Technology. 148 pp.
Zukas, J. A. and Scheffler, D. R. (2000): Practical aspects of numerical simulations of dynamic events: Effects of meshing. International Journal of Impact Engineering, Vol. 24, No. 9, October, pp. 925-945.
Ågårdh, L. (1997): Fe-modeling of fibre reinforced concrete slabs subjected to blast load. Journal De Physique IV, Vol. 7, No. C3, Aug, pp. 723-728.
Ågårdh, L. and Laine, L. (1999): 3D FE-simulation of high-velocity fragment perforation of reinforced concrete slabs: International Journal of Impact Engineering, Vol. 22, No. 9, pp. 911-922.
CHALMERS, Structural Engineering and Mechanics, Publication no. 04:4 50

APPENDIX A Empirical equations
Fragment velocity (equations used in Figure 2.6)
The initial velocity of the fragments is determined by the amount of explosive material and size of the casing, which can be estimated with an equation, where Q is the charge weight [kg] and Mh is the weight of the casing [kg], see Engberg and Karevik (1987):
[m/s] (A.1)
The fragment velocity is retarded in the air, depending on the initial fragment velocity, the fragment mass and the type of fragment. The retardation of the velocity after a distance, r, and for steel fragments can be calculated as, see von Essen (1973):
)e1(2400v hM/Q2i
−−=
3/00456.0 fmr
ir evv −= [m/s] (A.2)
where r is the distance [m], vi is the initial fragment velocity from Eq.(A.1) and mf is the fragment mass [kg].
Depth of penetration (equations used in Figure 2.7)
By using a direct formula, from ConWep (1992), the depth of penetration, x (in inches) can be estimated for fragments penetrating massive concrete:
25.0c
9.0s
37.0f
f
Vm95.0x = for x ≤ 1.4mf
1/3 (A.3)
or
3/1f5.0
c
8.1s
4.0f m487.0
f
Vm464.0x += for x > 1.4mf
1/3 (A.4)
where mf is fragment weight [oz.], Vs is the fragment striking velocity [kfps] and fc is the concrete compressive strength [ksi]. By using conversion factors, as shown in Table A.1, the penetration depth of fragments can be calculated in SI units.
The depth of penetration, x, according to von Essen (1973) can be estimated with following equation:
3610180 fr mvx ⋅⋅⋅= − [m] (A.5)
where vr is the fragment velocity, see Eq.(A.2), and mf is the fragment mass [kg].
CHALMERS, Structural Engineering and Mechanics, Publication no. 04:4 A.1
The depth of penetration, x, for a spherical fragment of 35.9 g (i.e. 20.6 mm in diameter) according to Erkander and Petterson (1985) can be estimated as:
)170(10288 36 −⋅⋅⋅= −rf vmx [m] (A.6)
where vr is the fragment velocity, see Eq.(A.2), and mf is the fragment mass [kg].
Thickness to prevent perforation (equations used in Table 2.2)
The thickness of a concrete wall that just prevents perforation, dpf, can be estimated with the following equation, from Krauthammer (2000):
dpf = 1.09xmf0.033 + 0.91mf
0.33 inches (A.7)
where x is the depth of penetration from Eqs.(A.3) and (A.4), and mf is the fragment weight in ounce [oz]. To convert to SI units, see Table A.1.
Table A.1 Conversion factors: Inch-pound to SI units (metric), according to the ACI Manual of Concrete Practice (2002).
To convert from to multiply by
inches millimeters [mm] 25.4
feet meters [m] 0.3048
kip-force/square inch [ksi] megapascal [MPa] 6.895
ounces [oz] grams [g] 28.34
A.2 CHALMERS, Structural Engineering and Mechanics, Publication no. 04:4
APPENDIX B Equations to determine the dynamic increase factor
The equations to determine the DIF (dynamic increase factor), given by Malvar and Ross (1998) are:
ts
t
ff
δ
εε
=
s&
& for ≤& 11 −sε
3/1
=
sts
t
ff
εεβ&
& for >&
where
f
11 −sε
t = dynamic tensile strength at ε&
s
fts = static tensile strength at ε&
ft / fts = DIF (dynamic increase factor)
ε&
s
= strain rate in the range of 10-6 to 160 s-1
ε& = 10-6 s-1 (static strain rate)
log β = 6 δ – 2
δ =
co
c
ff´´81
1
+
f´co = 10 MPa
CHALMERS, Structural Engineering and Mechanics, Publication no. 04:4 B.1
APPENDIX C Input data for the numerical model
C.1 RHT model, equation of state (EOS)
Table C.1 Input data for modelling concrete: RHT model, equation of state (EOS).
Parameter Value
Porous density (g/cm3) ρ0a
Porous sound speed (m/s) 2 920
Initial compaction pressure (kPa) 2.33·104
Solid compaction pressure (kPa) 6·106
Compaction exponent n 3
Solid EOS: Polynomial
Compaction curve: Standard
A1 (kPa) 3.527·107
A2 (kPa) 3.958·107
A3 (kPa) 9.04·106
B0 1.22
B1 1.22
T1 (kPa) 3.527·107
T2 (kPa) 0
a. 2 400 g/cm3 for the experiments with 6.28 kg projectile, Hansson (1998),
2 225 g/cm3 for experiments with fragment impacts by Leppänen (2003), and
2 350 g/cm3 for the experiments with fragment impacts by Erkander and
Pettersson (1985).
C.1 CHALMERS, Structural Engineering and Mechanics, Publication no. 04:4
C.2 Constitutive model
Table C.2 Input data for modelling concrete: constitutive model.
Parameter Value Comments
Shear Modulus (kPa) G a
Compressive Strength fc (MPa) fc a
Tensile Strength ft/fc 0.071 - 0.091 a
Shear Strength fs/fc 0.18 (default)
Failure Surface Parameter A 2 b
Failure Surface Parameter N 0.7 b
Tens./Compr. Meridian Ratio 0.6805 (default)
Brittle to Ductile Transition 0.0105 (default)
G(elas.)/G(elas-plas.) 2 (default)
Elastic Strength/ft 0.7 (default)
Elastic Strength/fc 0.53 (default)
Use Cap on Elastic Surface Yes (default)
Residual Strength Const. B 1.8 b, c and d
Residual Strength Exp. M 0.7 b
Comp. Strain Rate Exp. α 0.032 (default)
Tens. Strain Rate Exp. δ User-subroutine d
Max. Fracture Strength Ratio 1·1020 (default)
Damage constant D1 0.04 (default)
Min. Strain to Failure 0.01 (default)
Residual Shear Modulus Frac. 0.13 (default)
Tensile Failure model User-subroutine dErosion Strain/instantaneous geometric strain (only for Lagrange) 1.5 c
a. Material tests or calculated according to the CEB-FIB Model Code 1990 (1993).
b. Calculated with a model proposed by Attard and Setunge (1996).
c. Calibrated by parametric studies.
d. RHT model without user-subroutine, B = 1.5 and δ = 0.025 were used. The tensile failure model hydro was used.
CHALMERS, Structural Engineering and Mechanics, Publication no. 04:4 C.2


Paper I


J. Leppänen, K. Gylltoft / Nordic Concrete Research 29 (2003) 65-84 65
Concrete Structures Subjected to Blast and Fragment Impacts
Joosef Leppänen, Lic. Sc., Research Assistant E-mail: [email protected] Kent Gylltoft, Ph.D., Professor E-mail: [email protected] Department of Structural Engineering, Concrete Structures, Chalmers University of Technology, S-412 96 Göteborg, Sweden ABSTRACT Concrete structures subjected to explosive loading in a combination of blast and fragment impacts respond very differently from statically loaded structures. A literature study is made with emphasis on gathering the work that deals with blast waves, fragment impacts, dynamic behaviour and damage in concrete structures. The behaviour of concrete exposed to blast and fragment impacts leads to damage in the form of severe cracking as well as spalling. When fragments penetrate concrete deeply, scabbing may occur at the reverse side of a wall, or even perforation, with a risk of injury to people inside the structure.
Key words: concrete, blast waves, fragment impacts, penetration, perforation, dynamic loading.
1. INTRODUCTION Concrete structures, usually massive, are used for protection, e.g. civil defence shelters. For these shelters, the main threat arises from explosions caused by military weapons, such as conventional and nuclear weapons. A bomb explosion generates a blast wave and fragments fly in all directions. Chalmers University of Technology is collaborating with the Swedish Rescue Services Agency, to study the behaviour of concrete structures subjected to blast loads and fragment impacts; see Johansson [1], Leppänen [2] and Leppänen and Gylltoft [3]. A blast load is characterized by its short-duration. By computations, Johansson [1] showed how a shelter subjected to a blast wave responded at the most critical stage, i.e. the first few milliseconds. If the load was applied fast enough, some parts of the structure were not affected by the loading, while other parts of it had already failed. Furthermore, it was shown that the civil defence shelter could withstand the design load of the blast, according to the Swedish Rescue Services Agency, Shelter Regulations [4]. In addition to the blast wave, the detonation of a General Purpose (GP) bomb causes fragments to fly against the civil defence shelter. In Leppänen [2], the effects of fragment impacts were
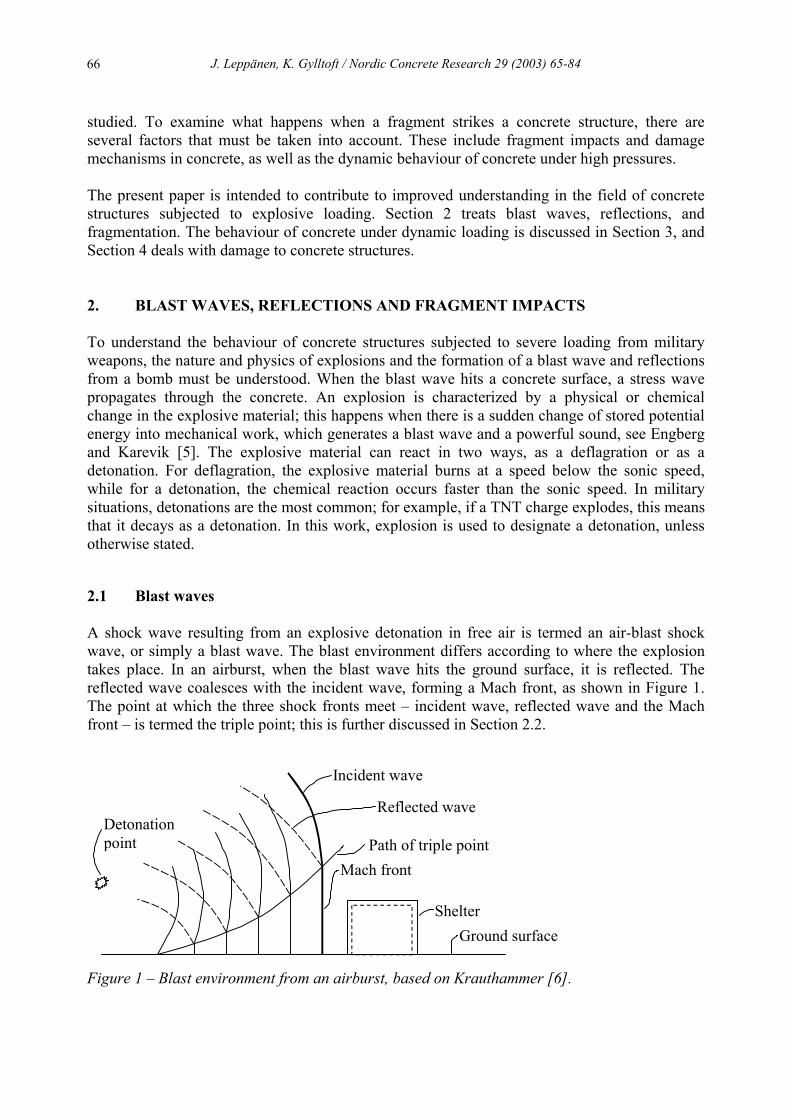
J. Leppänen, K. Gylltoft / Nordic Concrete Research 29 (2003) 65-84
66
studied. To examine what happens when a fragment strikes a concrete structure, there are several factors that must be taken into account. These include fragment impacts and damage mechanisms in concrete, as well as the dynamic behaviour of concrete under high pressures. The present paper is intended to contribute to improved understanding in the field of concrete structures subjected to explosive loading. Section 2 treats blast waves, reflections, and fragmentation. The behaviour of concrete under dynamic loading is discussed in Section 3, and Section 4 deals with damage to concrete structures. 2. BLAST WAVES, REFLECTIONS AND FRAGMENT IMPACTS To understand the behaviour of concrete structures subjected to severe loading from military weapons, the nature and physics of explosions and the formation of a blast wave and reflections from a bomb must be understood. When the blast wave hits a concrete surface, a stress wave propagates through the concrete. An explosion is characterized by a physical or chemical change in the explosive material; this happens when there is a sudden change of stored potential energy into mechanical work, which generates a blast wave and a powerful sound, see Engberg and Karevik [5]. The explosive material can react in two ways, as a deflagration or as a detonation. For deflagration, the explosive material burns at a speed below the sonic speed, while for a detonation, the chemical reaction occurs faster than the sonic speed. In military situations, detonations are the most common; for example, if a TNT charge explodes, this means that it decays as a detonation. In this work, explosion is used to designate a detonation, unless otherwise stated. 2.1 Blast waves A shock wave resulting from an explosive detonation in free air is termed an air-blast shock wave, or simply a blast wave. The blast environment differs according to where the explosion takes place. In an airburst, when the blast wave hits the ground surface, it is reflected. The reflected wave coalesces with the incident wave, forming a Mach front, as shown in Figure 1. The point at which the three shock fronts meet – incident wave, reflected wave and the Mach front – is termed the triple point; this is further discussed in Section 2.2.
Incident wave
Path of triple point
Ground surface
Mach front
Reflected wave
Shelter
Detonation point
Figure 1 – Blast environment from an airburst, based on Krauthammer [6].
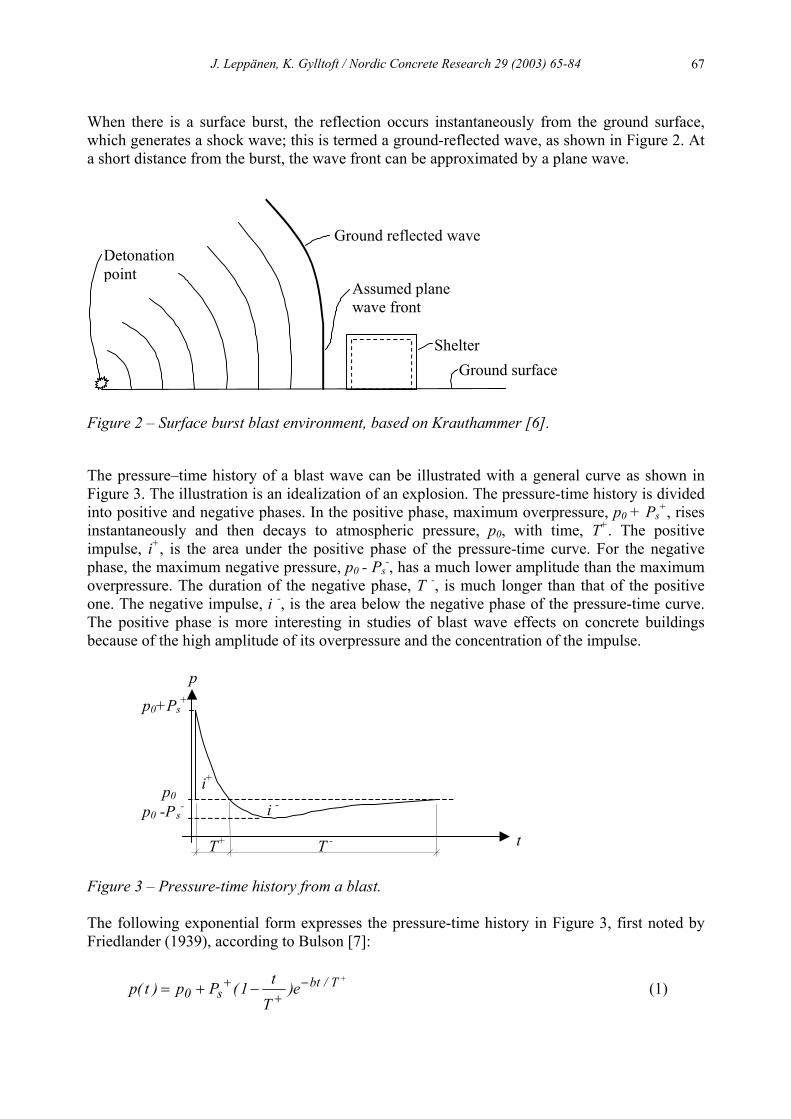
J. Leppänen, K. Gylltoft / Nordic Concrete Research 29 (2003) 65-84 67
When there is a surface burst, the reflection occurs instantaneously from the ground surface, which generates a shock wave; this is termed a ground-reflected wave, as shown in Figure 2. At a short distance from the burst, the wave front can be approximated by a plane wave.
Ground surface
Assumed plane wave front
Ground reflected wave
Shelter
Detonation point
Figure 2 – Surface burst blast environment, based on Krauthammer [6].
The pressure–time history of a blast wave can be illustrated with a general curve as shown in Figure 3. The illustration is an idealization of an explosion. The pressure-time history is divided into positive and negative phases. In the positive phase, maximum overpressure, p0 + Ps
+, rises instantaneously and then decays to atmospheric pressure, p0, with time, T+. The positive impulse, i+, is the area under the positive phase of the pressure-time curve. For the negative phase, the maximum negative pressure, p0 - Ps
-, has a much lower amplitude than the maximum overpressure. The duration of the negative phase, T -, is much longer than that of the positive one. The negative impulse, i -, is the area below the negative phase of the pressure-time curve. The positive phase is more interesting in studies of blast wave effects on concrete buildings because of the high amplitude of its overpressure and the concentration of the impulse. p
i +
T + T -
i -
t
p 0 +P s +
p 0 p 0 -P s -
Figure 3 – Pressure-time history from a blast. The following exponential form expresses the pressure-time history in Figure 3, first noted by Friedlander (1939), according to Bulson [7]:
+−
++ −+= T/bt
s0 e)T
t1(Pp)t(p (1)
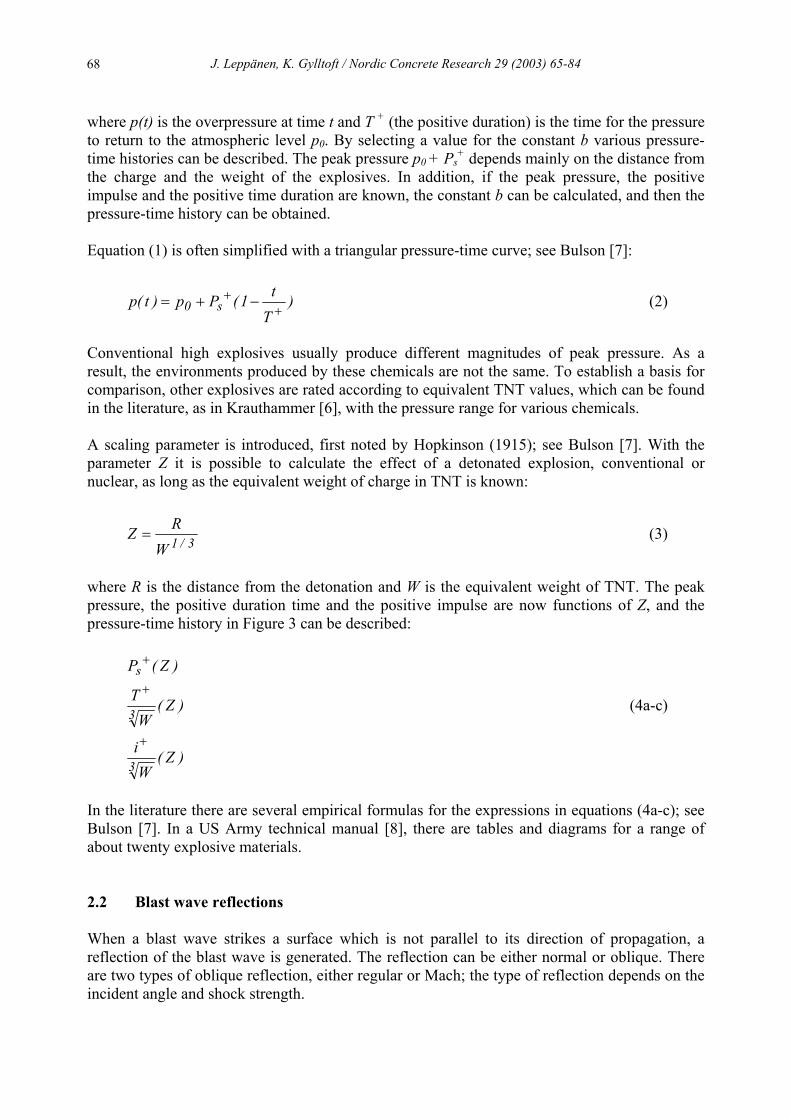
J. Leppänen, K. Gylltoft / Nordic Concrete Research 29 (2003) 65-84
68
where p(t) is the overpressure at time t and T + (the positive duration) is the time for the pressure to return to the atmospheric level p0. By selecting a value for the constant b various pressure-time histories can be described. The peak pressure p0 + Ps
+ depends mainly on the distance from the charge and the weight of the explosives. In addition, if the peak pressure, the positive impulse and the positive time duration are known, the constant b can be calculated, and then the pressure-time history can be obtained. Equation (1) is often simplified with a triangular pressure-time curve; see Bulson [7]:
)
Tt1(Pp)t(p s0 +
+ −+= (2)
Conventional high explosives usually produce different magnitudes of peak pressure. As a result, the environments produced by these chemicals are not the same. To establish a basis for comparison, other explosives are rated according to equivalent TNT values, which can be found in the literature, as in Krauthammer [6], with the pressure range for various chemicals. A scaling parameter is introduced, first noted by Hopkinson (1915); see Bulson [7]. With the parameter Z it is possible to calculate the effect of a detonated explosion, conventional or nuclear, as long as the equivalent weight of charge in TNT is known:
3/1W
RZ = (3)
where R is the distance from the detonation and W is the equivalent weight of TNT. The peak pressure, the positive duration time and the positive impulse are now functions of Z, and the pressure-time history in Figure 3 can be described:
)Z(W
i
)Z(W
T
)Z(P
3
3
s
+
+
+
(4a-c)
In the literature there are several empirical formulas for the expressions in equations (4a-c); see Bulson [7]. In a US Army technical manual [8], there are tables and diagrams for a range of about twenty explosive materials. 2.2 Blast wave reflections When a blast wave strikes a surface which is not parallel to its direction of propagation, a reflection of the blast wave is generated. The reflection can be either normal or oblique. There are two types of oblique reflection, either regular or Mach; the type of reflection depends on the incident angle and shock strength.
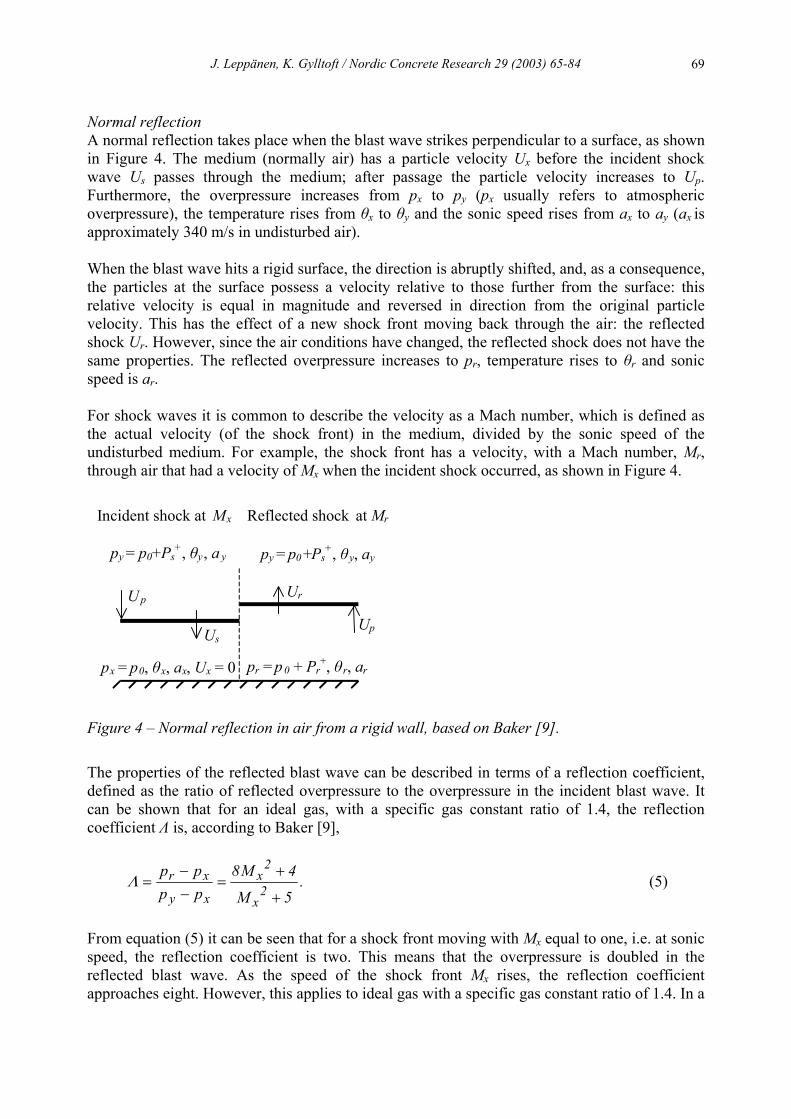
J. Leppänen, K. Gylltoft / Nordic Concrete Research 29 (2003) 65-84 69
Normal reflection A normal reflection takes place when the blast wave strikes perpendicular to a surface, as shown in Figure 4. The medium (normally air) has a particle velocity Ux before the incident shock wave Us passes through the medium; after passage the particle velocity increases to Up. Furthermore, the overpressure increases from px to py (px usually refers to atmospheric overpressure), the temperature rises from θx to θy and the sonic speed rises from ax to ay (ax is approximately 340 m/s in undisturbed air). When the blast wave hits a rigid surface, the direction is abruptly shifted, and, as a consequence, the particles at the surface possess a velocity relative to those further from the surface: this relative velocity is equal in magnitude and reversed in direction from the original particle velocity. This has the effect of a new shock front moving back through the air: the reflected shock Ur. However, since the air conditions have changed, the reflected shock does not have the same properties. The reflected overpressure increases to pr, temperature rises to θr and sonic speed is ar. For shock waves it is common to describe the velocity as a Mach number, which is defined as the actual velocity (of the shock front) in the medium, divided by the sonic speed of the undisturbed medium. For example, the shock front has a velocity, with a Mach number, Mr, through air that had a velocity of Mx when the incident shock occurred, as shown in Figure 4.
U r
p r = p 0 + P r + , θ r, ar p x = p 0 , θ x , a x , U x = 0
U s
Incident shock at M x
U p
U p
Reflected shock at Mr
p y = p 0 + P s + , θ y , a y p y = p 0 + P s + , θ y, a y
Figure 4 – Normal reflection in air from a rigid wall, based on Baker [9].
The properties of the reflected blast wave can be described in terms of a reflection coefficient, defined as the ratio of reflected overpressure to the overpressure in the incident blast wave. It can be shown that for an ideal gas, with a specific gas constant ratio of 1.4, the reflection coefficient Λ is, according to Baker [9],
. (5)
5M
4M8pppp
2x
2x
xy
xr
+
+=
−−
=Λ
From equation (5) it can be seen that for a shock front moving with Mx equal to one, i.e. at sonic speed, the reflection coefficient is two. This means that the overpressure is doubled in the reflected blast wave. As the speed of the shock front Mx rises, the reflection coefficient approaches eight. However, this applies to ideal gas with a specific gas constant ratio of 1.4. In a
J. Leppänen, K. Gylltoft / Nordic Concrete Research 29 (2003) 65-84
70
real blast wave, the specific gas constant ratio is not constant, and the coefficient is pressure-dependent, see Johansson [10]. The reflection coefficient rises with increasing pressure. Regular reflection In a regular reflection, the blast wave has an incident shock at Mx with an angle of β, and reflection takes place. The reflected shock at Mr has an angle of δ as shown in Figure 5. The angle of reflection is not usually equal to the angle of incidence. The air conditions in front of the incident shock (Region 1) are still at pressure px and temperature θx. Behind the incident shock (Region 2), the air is the same as for open-air shock, with pressure py and temperature θy. The air conditions from the reflected shock (Region 3), have pressure pr and temperature θr. Incident Shock at M xReflected Shock at Mr
p r ,θ r p x ,θ x p y ,θ y
δ β 3 1
2
Figure 5 – Oblique reflection, based on Baker [9].
Mach stem formation There is a critical angle, related to the shock strength, at which there cannot be an oblique reflection. According to Baker [9], Ernst Mach [Mach and Sommer (1877)] showed that the incident shock and the reflected shock coalesce to form a third shock front. This third shock front, termed the Mach stem or Mach front, moves approximately parallel to the ground surface, as shown in Figure 6, as the shock front rises. The point at which the three shock fronts meet is termed the triple point. The Mach front and the path of the triple point are also shown in Figure 1.
Incident Shock
Mach stem
Reflected Shock
Triple point
Figure 6 – Mach stem formation, based on Baker [9]. The arrows indicate the directions of the shock waves.
2.3 Fragment impacts When high explosives such as grenades, bombs, torpedoes, missiles or robots detonate, fragments fly out in all directions when the casing is broken. The fragments from the same kind of weapon can be of different sizes. The damage to concrete depends on the properties of the
J. Leppänen, K. Gylltoft / Nordic Concrete Research 29 (2003) 65-84 71
fragments, i.e. the striking velocity, mass and area density [kg/m2]. In the literature there are empirical formulas, such as the ones proposed by Engberg and Karevik [5], Krauthammer [6], ConWep [11] or Janzon [12], for estimating the velocity of the fragments. The initial velocity of the fragments is determined by the amount of explosive material and size of the casing, which can be estimated with an equation, where Q is the charge weight [kg] and Mh is the weight of the casing [kg], see Engberg and Karevik [5]:
[m/s]. (6)
)e1(2400v hM/Q2i
−−=
The fragment velocity is retarded in the air, depending on the initial fragment velocity, the fragment mass and the type of fragment. The velocity is retarded differently after a distance r, and for steel fragments can be calculated as, see Janzon [12]:
3 fm/r00456.0
ir evv−
= [m/s] (7) where r is the distance [m], vi is the initial fragment velocity from equation (6) and mf is the fragment mass [kg]. Fragments from an explosion can fly through the air over very long distances, more than 1000 m for heavy fragments, see Engberg and Karevik [5]. According to Swedish Rescue Services Agency [4], a shelter must be able to resist the effect of a 250 kg GP bomb (with 50 weight per cent TNT) that bursts freely outside at a distance of 5 m from the shelter. The masses of fragments from a 250 kg GP bomb are normally distributed from 1 to 50 gram, see Engberg and Karevik [5]. When using equations (6) and (7), the impact velocity at a distance of 5 m varies between 1650 and 1950 m/s for fragments with mass of 1 to 50 gram. The velocities of fragments from a 250 kg GP bomb are shown in Figure 7 for six fragment weights, ranging from 5 to 400 gram.
J. Leppänen, K. Gylltoft / Nordic Concrete Research 29 (2003) 65-84
72
1500
1700
1900
2100
0 2 4 6 8 10 12Distance from explosion [m]
5
25
50
100
200
400
Fragment velocity [m/s]
[g]
Figure 7 – Fragment velocity from a 250 kg GP bomb (with 50 weight per cent TNT) that bursts freely outside, for fragment weights from 5 to 400 gram, based on equations from Engberg and Karevik [5].
3 BEHAVIOUR OF CONCRETE UNDER DYNAMIC LOADING 3.1 Comparing dynamic and static loading The behaviour of concrete differs for dynamic loading and static loading. For dynamic loading, the initial stiffness as well the ultimate strength increases, in both compression and tension. Furthermore, the concrete strain capacity is extended in dynamic loading. At Delft University, Zielinski [13] followed a phenomenological approach when he compared static and impact tensions. He observed a changing geometry of the fracture plane. With increasing loading rate, the amount of aggregate fracture became greater. Furthermore, multiple fractures were observed at high loading rates, as shown in Figure 8. These fracture mechanisms have a direct influence upon the stress-strain relationship for concrete in dynamic loading; the energy absorption is much higher for the multiple fracture planes. Moreover, the stiffness is increased; stress levels at failure for high loading rates and deformation capacity are higher. In addition, the elastic stiffness is increased. This is schematically shown in Figure 9.

J. Leppänen, K. Gylltoft / Nordic Concrete Research 29 (2003) 65-84 73
STATIC IMPACT microcracks
macrocracks
aggregate particles
cement matrix
Figure 8 – Crack path for tensile static and dynamic loading; based on Zielinski [13].
σ
ε
Impact
Static
Effect of changed fracture path for a single macrocrack
Effect of multiple cracking
Figure 9 – Schematic view of the effect of fracture mechanisms on the stress - strain relationship, based on Zielinski [13].
3.2 Behaviour of concrete under static loading Concrete is often characterized with the uniaxial stress-strain relationship as shown in Figure 10. Concrete is weak in tension; for normal-strength concrete, the ultimate tensile strength is less than one tenth of the ultimate compressive strength. However, real structures are subjected to multiaxial stresses. Richart et al. [14] observed that confined concrete has greater strength and stiffness, and furthermore, strains are extended. In Figure 11 the stress-strain relationship for concrete in compression is shown for increasing lateral pressure (confined concrete).

J. Leppänen, K. Gylltoft / Nordic Concrete Research 29 (2003) 65-84
74
σc
εc
Figure 10 – Concrete stress-strain relationship under uniaxial loading.
σ c
εc
σ lat = p3
σ lat = p 2
σ lat = 0
σ lat = p 1 0 < p1 < p2 < p3
σlat
σc
σc
Figure 11 – Schematic view of stress-strain relationship for rising lateral pressure in compressed concrete. Based on research by Richart et al. [14].
When concrete is subjected to extremely high pressures, as in an impact situation, the lateral pressure suddenly becomes much higher. During fragment impacts, concrete is exposed to enormous confining pressures and behaves plastically, dissipating a large amount of energy. In addition, civil defence shelters have heavy reinforcement, which provides further confinement effects. The confining pressure in impact loading can be several hundred MPa. In a standard static triaxial test, the ultimate strength of concrete can increase enormously. Experiments by Bažant et al. [15], with a uniaxial compressive strength of 46 MPa, showed that the ultimate strength increased up to 800 MPa, and the strains were extended as shown in Figure 12.
J. Leppänen, K. Gylltoft / Nordic Concrete Research 29 (2003) 65-84 75
0
200
400
600
800
1000
0 10 20 30 40 50Strain [mm/m]
Axial Stress [MPa]
σ lat = 20 MPa
σ lat = 100 MPa
σ lat = 200 MPa
σ lat = 400 MPa
σlat
σc
σc
Figure 12 – Stress-strain relationship for confined concrete, based on triaxial compression test data from Bažant et al. [15].
If concrete is subjected to hydrostatic pressure (σ1 = σ2 = σ3), the relationship between hydrostatic pressure (mean value of the stress components σ1, σ2 and σ3) and density becomes non-linear at a certain pressure level. Initially, for low-pressure levels the relationship is linear (elastic loading). With further loading, micro cracking occurs in concrete. Since concrete is porous, the pores collapse and the material is compacted. At a very high-pressure level, all of the pores are collapsed, and the relationship between hydrostatic pressure and density becomes linear again. The equation of state (EOS) relates the pressure to the local density and the local specific internal energy. In Figure 13 the equation of state is illustrated for concrete. The initial density is noted as ρinitial and the solid density is noted as ρs which is defined as the density at zero pressure of the fully compacted solid. The phase when the material is compacting is the plastic compaction phase. p ρinitial ρs ρ
Elastic unloading/reloading
Elastic loading
Plastic compaction Fully compacted
Figure 13 – Equation of state for concrete. Based on AUTODYN Manuals [16].
J. Leppänen, K. Gylltoft / Nordic Concrete Research 29 (2003) 65-84
76
3.3 Strain rate effects for concrete under uniaxial loading The behaviour of concrete is determined by the loading rate; this is called the strain rate effect. The strain rate in the material depends on the type of loading, as shown in Figure 14 for five kinds of loading such as creep, static, earthquake, hard impact and blast loads.
10-8 10-7 10-6 10-5 10-4 10-3 10-1 1 10 102 103
CREEP STATIC EARTHQUAKE HARD IMPACT BLAST
Strain rate [s-1]
Figure 14 – Strain rates on different loading cases; based on Bischoff and Perry [17]. The strength, deformation capacity, and fracture energy are important parameters for characterizing and describing the response of concrete. For dynamic loading, these parameters are not the same as for static loading. When concrete is subjected to impact loading, the material strength becomes greater. The dynamic increase factor (DIF) is the proportional rise of the dynamic ultimate strength relative to the static ultimate strength. According to CEB-FIB Model Code 1990 [18] the DIF dependence on strain rate can be described as shown in Figure 15.
0.51.01.52.02.53.03.54.0
-4 -3 -2 -1 0 1 2 3log10 (strain rate s-1)
DIF
TensionCompression
Figure 15 – DIF according to CEB-FIB Model Code 1990 [18].
For dynamic loading, the ultimate compressive strength can be more than doubled, see Bischoff and Perry [17]. Moreover, according to Ross et al. [19], the concrete ultimate uniaxial strength in tension increases by multiples of 5 to 7 at very high strain rates. The greater strength is explained by the change in the fracture plane. At a higher loading rate, concrete is subject to multiple fractures, and the amount of aggregate fracture increases, see Figure 8. Other explanations of the increased strength are the viscous effects and the forces of the inertia. The viscous effects are explained by the following. When concrete is subjected to compressive loading, the pores in the concrete, which are filled with water, tend to close. Due to the viscosity
J. Leppänen, K. Gylltoft / Nordic Concrete Research 29 (2003) 65-84 77
of the water, an inner pressure is developed in the pores. As a consequence, the strength of the material becomes greater. For concrete in tension, the resistance force is generated when the pores that are filled with water are opening. The DIF curve has a flat part and a steep part as shown in Figure 15. For concrete in tension, when the strain rate is less than approximately 1 s-1, the viscous effects dominate (flat part), and when the strain rate exceeds approximately 10 s-1, the forces of inertia dominate (steep part). When concrete is compressed, the forces of inertia dominate at strain rates of approximately 60-80 s-1, see Ross et al. [19]. 4 DAMAGE ON CONCRETE STRUCTURES 4.1 Introduction During extreme loading, a concrete structure shakes and vibrates, severe crushing of concrete occurs and a crater forms (spalling) at the contact point; for deep penetration, scabbing may occur at inside of the wall, or even perforation, with a risk of injury for people inside the structure. Fragments are released from the bomb casing, and fly against the structure. The fragment size, area density [kg/m2] and striking (impact) velocity are important parameters for the fracture mechanism in concrete. Prediction of the depth of penetration is a crucial factor for design of protective structures. 4.2 Penetration of steel fragments into different kinds of materials The depth of penetration is determined by the fragment mass, form, velocity and inclination angle of impact, and the material of the target. For spherical fragments, it has been empirically found by Janzon [12] that the minimum velocity needed for perforation at different thicknesses of steel plates is
α C sin m d v 3 / 1
f p × × = [m/s] (8)
where C is a constant that takes into account the form of the fragment and the target material. The inclination of the impact is α, the mass of the fragments is mf [kg], and the thickness of the steel plate is d [m]. An example of penetration into soft steel by fragments from a 155 mm bursting shell is shown in Figure 16, with an impact inclination of 90°. The approximate depth of penetration into materials other than steel is given by multiples of the depth of penetration for soft steel by using a factor; the factors are given in Table 1.
J. Leppänen, K. Gylltoft / Nordic Concrete Research 29 (2003) 65-84
78
0
20
40
60
80
0 500 1000 1500 2000Striking velocity [m/s]
m = 1 gm = 10 gm = 25 gm = 100 gm = 400 gm = 800 g
Depth of penetration [mm]
Figure 16 – Depth of penetration into steel, from equation (8), impact inclination 90°, θ = 39 x 10-6, see Janzon [12].
Table 1 – Penetration depth of common materials, Engberg and Karevik [5]. Material Factor
Armour-plate 0.75
Soft steel 1.0
Aluminium 2
Reinforced fibre-glass plastic 4
Concrete (K40, reinforced) 6
Pine wood 15
Sand 18
Water 50
Wet snow 70
Dry snow 140
J. Leppänen, K. Gylltoft / Nordic Concrete Research 29 (2003) 65-84 79
By using a direct formula, from ConWep [11], the depth of penetration, x (in inches) can be estimated for fragments penetrating massive concrete:
25.0c
9.0s
37.0f
f
Vm95.0x = for x ≤ 1.4mf
1/3 (9)
or
3/1f5.0
c
8.1s
4.0f m487.0
f
Vm464.0x += for x > 1.4mf
1/3 (10)
where mf is fragment weight [oz.], Vs is the fragment striking velocity [kfps] and fc is the concrete compressive strength [ksi]. By using conversion factors, as shown in Table 2, the penetration depth of fragments can be calculated in SI-units. Table 2 – Conversion factors: Inch-pound to SI-units (metric), according to ACI Manual of Concrete Practice 2002 [20]. To convert from to multiply by inch millimeter [mm] 25.4 foot meter [m] 0.3048 kip-force/square inch [ksi] megapascal [MPa] 6.895 ounce-mass [oz] gram [g] 28.34
The penetration depth of fragments into massive concrete is shown in Figure 17. The depth of penetration is a function of the fragment weight, the striking velocity and the concrete compressive strength. However, it should be noted that for a concrete structure, when there is 70 % penetration, perforation may be expected; see Krauthammer [6].
0
200
400
600
0 500 1000 1500 2000Striking velocity [m/s]
m = 5 g m = 25 g m = 50 g m = 100 g m = 200 g m = 400 g
Depth of penetration [mm]
Figure 17 – Penetration of fragments into massive concrete, compressive strength 30 MPa, for fragment weights from 5 to 400 gram with striking velocities up to 2000 m/s, based on equations from ConWep [11].

J. Leppänen, K. Gylltoft / Nordic Concrete Research 29 (2003) 65-84
80
According to Swedish Rescue Services Agency shelter regulations [4], shelter above ground must have a minimum thickness of 350 mm. For the normally distributed (1–50 gram) fragments from a 250 kg GP bomb with 125 kg TNT, perforation would not be a problem. However, if single fragments of larges size than approximately 100 gram are released from the bomb, at a distance of 5 meters, perforation may occur anyway. Table 3 shows the thickness required for a concrete wall that just prevents perforation by fragment weights from 5 to 400 gram with striking velocities up to 3000 m/s. As shown, both the striking velocity and the mass are vital factors in the design of protective structures. The area marked grey indicates a thickness above 350 mm massive concrete (the required minimum thickness of a civil defence shelter above ground). The thickness of a concrete wall that just prevents perforation, dpf, can be estimated with the following equation, from Krauthammer [6]: dpf = 1.09xmf
0.033 + 0.91mf0.33 inches (11)
where x is the depth of penetration from equations (9) and (10), and mf is the fragment weight in ounce-mass [oz]. To convert to SI-units, see Table 2. Table 3 – Thickness of concrete wall that just prevents perforation, compressive strength 30 MPa, for fragment weights from 5 to 400 gram with striking velocities up to 3000 m/s, based on equations from Krauthammer [6].
Fragment mass [g] Striking velocity [m/s] 5 25 50 100 200 400
300 22 39 50 65 84 108
600 30 54 70 91 118 153
900 39 74 97 127 167 220
1200 53 101 134 177 235 312
1500 70 135 180 239 318 424
1800 90 175 233 312 416 556
2100 112 220 295 394 528 707
2400 138 271 363 487 653 877
2700 166 327 439 590 792 1064
3000 196 389 522 702 943 1268 4.3 Spalling and scabbing A fragment or projectile impact causes severe cracking and crushing in the concrete, which must be supported by reinforcement to prevent failure. When a fragment or a projectile strikes a concrete structure, it penetrates into the concrete and the impact causes crushing of the material at the point of contact (spalling) and possible scabbing on the reverse side of the wall, see Figure 18. When 50 % penetration is achieved, scabbing may become a problem, see
J. Leppänen, K. Gylltoft / Nordic Concrete Research 29 (2003) 65-84 81
Krauthammer [6]. When a stress wave propagates through the concrete and reaches the inside of a structure, it will reflect as a tensile wave; as concrete is weak in tension, this leads to scabbing at the inside. The amount of reinforcement is a highly critical parameter in regard to scabbing. Experiments show that the scabbing is reduced by increasing the amount of reinforcement since the reinforcement holds the concrete in place (confinement effect), see Jonasson [21].
Figure 18 – Spalling and scabbing. Spalling on the exposed side of the concrete wall and scabbing on the reverse side of the wall. Based on Engberg and Karevik [5].
4.4 Combined blast wave and fragment impact loading A building is exposed not only to fragments or only a blast wave: the loading from a bomb is a combination of both the blast wave and flying fragments. Experiments show that a concrete building which is exposed to a combination of blast wave and fragments collapses more easily than one exposed only to a blast wave or to fragments, see Forsén and Edin [22]. The load from a detonation can be separated into a blast wave and a stress wave which is caused by the direct impact of the fragments. Depending on the charge and the distance between the bomb and the target, the fragments may strike the concrete surface before, at the same time as, or after the blast wave. Figure 19 shows an example of a 250 kg GP bomb (with an equivalent charge weight of 125 kg) to compare the arrival time of the blast wave calculated according to ConWep [11] and the arrival time of the fragments, yielded by equation (7). For this type of bomb, the arrival times for the blast and the fragments coincide at a distance of approximately 5 m; at a greater distance, the fragments strike the target before the blast wave.
J. Leppänen, K. Gylltoft / Nordic Concrete Research 29 (2003) 65-84
82
0
2
4
6
8
10
0 2 4 6 8 10Distance [m]
FragmentsBlast wave
Arrival time [ms]
Figure 19 – Calculated arrival time for a blast wave and fragments from a 250 kg GP bomb.
The difference in arrival time for a blast and fragments is less important for short distances, see Forsén and Nordström [23]. This is due to the fact that the response time of a reinforced concrete wall is usually much longer than the difference between the arrival times of a blast and the fragments. The wall is going to be damaged by the fragments before it is deformed. A very good estimation of the deflection can be made by simply superposing the impulse of the fragment impacts on the positive impulse of the blast wave, at the maximum blast pressure. Then the impulse can be simplified and estimated with a triangular shape; and the resistance of the wall can be assumed to be reduced by the fragments, which comprise in the very beginning of the load, see Forsén and Nordström [23]. However, as the impulse of the fragment impacts is relatively small compared with the impulse from the blast wave, the greater damage of the structure caused by the combined blast and fragment impacts remains unexplained. The damage mechanisms are not known in detail. A possible explanation is that when a fragment strikes a concrete wall, the wall accelerates both horizontally and vertically; at same time as the blast wave hits the wall, the wall is suddenly displaced and any mass above accelerates, which increases the normal vertical force of the wall. By taking into account the accelerating mass and the reduced cross section caused by the fragments, the combination of blast and fragment impacts increases the risk of structural collapse. A detonation inside a building causes more damage than one outside the building. The reason for this is that, in addition to the short duration of a blast wave, there is a long-duration wave added by gas and heat from the explosion, which cannot escape from the limited space. If the amplitude and the duration of the pressure are great enough, the walls and roof may be jerked apart. An important parameter for buildings is the relationship between openings, known as the leakage area. With large leakage areas, the duration of the blast wave can be shortened and the damage possibly reduced.

J. Leppänen, K. Gylltoft / Nordic Concrete Research 29 (2003) 65-84 83
5 CONCLUSIONS The load generated by an explosion is characterized by a very short-duration with high pressure. When a bomb detonates, a blast wave and fragments from the bomb casing strike the target. The blast environment (pressure-level) differs depending on where the explosion takes place. During extreme loading the structure shakes and vibrates, severe crushing of concrete occurs and craters forms (spalling) in the exposed side of a concrete wall; for deep penetration, scabbing may occur at the inside of the wall, or even perforation, with a risk of injury for people inside the structure. For the design of protective structures, their penetration by fragments is an important issue; traditionally, empirical equations are used to predict the depth of penetration. In the literature there are empirical equations to predict the depth of penetration for fragments that strike concrete targets. Although the empirical equations give a good prediction of the depth of penetration, they do not describe fracture mechanisms and the structural behaviour of a concrete building. For deeper understanding there is need for more research in the field of concrete structures subjected to blast and fragment impacts. Traditionally, experiments in this field are in large-scale; for example, walls, slabs or even whole structures. And often, there is a lack of discussion of the behaviour of concrete for dynamic loading. For gain further knowledge, small-scale experiments combined with numerical methods have been started at Chalmers University of Technology, where the material fracture mechanisms will be studied in detail. 6 ACKNOWLEDGEMENTS This research project was financed by the Swedish Rescue Services Agency. The authors wish to thank the reference group members of the project, “Dynamic behaviour of concrete structures subjected to blast and fragments”: Björn Ekengren, M.Sc., the Swedish Rescue Services Agency, Mario Plos, Ph.D., Chalmers University of Technology, and Morgan Johansson, Ph.D., Reinertsen AB. 7 REFERENCES 1. Johansson, M., "Structural Behaviour in Concrete Frame Corners of Civil Defence Shelters,
Non-linear Finite Element Analyses and Experiments", Doctoral Thesis, Department of Structural Engineering, Concrete Structures, Chalmers University of Technology, Göteborg, Sweden, 2000, 204 pp.
2. Leppänen, J., "Dynamic Behaviour of Concrete Structures subjected to Blast and Fragment Impacts", Licentiate Thesis, Department of Structural Engineering, Concrete Structures, Chalmers University of Technology, Göteborg, 2002, 71 pp.
3. Leppänen, J. and Gylltoft, K., "Numerical simulation of concrete penetration with a steel projectile", XVIII Symposium on Nordic Concrete Research, Elsinore, Denmark, 2002, pp. 273-275.
4. Swedish Rescue Services Agency, "Skyddsrumsregler SR - Produktion och vidmakthållande, (Shelter Regulations - Production and Maintenance. In Swedish)", Publication B54-141/98, Karlstad, Sweden, 1998.
J. Leppänen, K. Gylltoft / Nordic Concrete Research 29 (2003) 65-84
84
5. Engberg, T. and Karevik, S., ”FortH1, Fortifikationshandbok del 1, Kapitel 1-3 (In Swedish)", Försvarets läromedelscentral (FLC), Stockholm, Sweden, 1987, 50 pp.
6. Krauthammer, T., "Modern Protective Structures, Design, Analysis and Evaluation", Course notes, Pennsylvania State University, State College, PA, 2000, 358 pp.
7. Bulson, P.S., "Explosive loading of engineering structures", E & FN Spon, London, 1997, 233 pp.
8. "US Army Fundamentals of Protective Design (Non-nuclear)", Department of Army Technical Manual TM5-855-1, Washington, D.C., 1965.
9. Baker, W.E., "Explosions in Air", Univ. of Texas Press, Austin, TX, 1973, 268 pp. 10. Johansson, M., "Stötvågsutbredning i luft (in Swedish)", Publication B54-223/02, Swedish
Rescue Service Agency, Karlstad, Sweden, 2002. 11. ConWep, "Collection of conventional weapons effects calculations based on TM 5-855-1,
Fundamentals of Protective Design for Conventional Weapons, U. S. Army Engineer Waterways Experiment Station", Vicksburg, VA, USA, 1992.
12. Janzon, B., "Grundläggande Stridsdelsfysik (in Swedish)", C 20261-D4, FOA Rapport, Försvarets forskningsanstalt, Stockholm, Sweden, 1978, 164 pp.
13. Zielinski, A.J., "Fracture of concrete and mortar under uniaxial impact tensile loading", Doctoral Thesis, Delft University of Technology, 1982.
14. Richart, F.E., Brandtzaeg, A. and Brown, R.L., "A Study of the Failure of Concrete under Combined Compressive Stresses," Bulletin No. 185, University of Illinois, Engineering Experimental Station, Urbana, Illinois, USA, November 1928, 104 pp.
15. Bažant, Z.P., Xiang, Y.Y., Adley, M.D., Prat, P.C. and Akers, S.A., "Microplane Model for Concrete: II: Data Delocalization and Verification," Journal of Engineering Mechanics-ASCE, Vol. 122, No. 3, Mar 1996, pp. 255-262.
16. AUTODYN Manuals, "AUTODYN Manuals, Version 4.2", Century Dynamics, Inc. 2001, Sam Ramon, USA.
17. Bischoff, P.H. and Perry, S.H., "Compressive behaviour of concrete at high strain rates," Materials and Structures, Vol. 24, 1991, pp. 425-450.
18. CEB-FIB Model Code 1990, "CEB-FIB Model Code 1990, Design Code, Thomas Telford", Lausanne, Switzerland, 1993, 437 pp.
19. Ross, C.A., Jerome, D.M., Tedesco, J.W. and Hughes, M.L., "Moisture and strain rate effects on concrete strength," ACI Materials Journal, Vol. 93, No. 3, May-June 1996, pp. 293-300.
20. ACI Manual of Concrete Practice 2002, "ACI Manual of Concrete Practice 2002, American Concrete Institute, Farmington Hills, MI, USA, 2002.
21. Jonasson, T., "Kontaktverkan 1, Sprängladdningars kontaktverkan på armerade betongplattor", C 20809-2.6, FOA rapport, Sundbyberg, Sweden, 1990, 58 pp.
22. Forsén, R. and Edin, K., "Vapenverkan mot flervånings betongbyggnad III. Bestämning av skador från splitterladdningar mot husfasad i skala 1:4 (in Swedish)", C 20860-2.3, FOA report, Sundbyberg, Sweden, 1991, 40 pp.
23. Forsén, R. and Nordström, M., "Damage to Reinforced Concrete Slabs Due to the Combination of Blast and Fragment Loading (In Swedish)", B 20101-2.6, National Defence Research Establishment (FOA), Tumba, Sweden, 1992, 12 pp.

Paper II

J. Leppänen / Nordic Concrete Research 30 (2003) 84-103 84
Numerical Simulation of Projectile Penetration in Concrete
Joosef Leppänen, Lic. Sc., Research Assistant Department of Structural Engineering and Mechanics, Concrete Structures, Chalmers University of Technology, S-412 96 Göteborg, Sweden E-mail: [email protected]
ABSTRACT
This paper presents numerical simulations of concrete penetration by steel projectiles. To predict the penetration depth of the projectile and the crater size in the concrete, material models are required in which the strain rate effect, large deformations and triaxial stress states are taken into account. The analyses are made with AUTODYN, and the results of the analyses are compared with experimental data from the literature for the depth of penetration and the crater diameter. Two experimental series have been compared, with varying projectile weights and impact velocities; for both series, the depth of penetration was simulated well. Key words: concrete, numerical simulation, projectile, impact, penetration.
1. INTRODUCTION For protective structures, reinforced concrete has been the most widely used material. Protective structures of concrete have been built since the beginning of the 20th century. During and after World War II, there were large research projects for studying penetration effects on concrete. For design of protective structures, the penetration by fragments and projectiles is a major concern; traditional empirical equations are used to predict the depth of penetration. In the literature there are empirical equations, such as, Bergman [1], Hughes [2], Forrestal et al. [3], and Chen and Li [4], to predict the depth of penetration for projectiles striking a concrete target. Although empirical equations give a good prediction of the depth of penetration, they do not describe the structural behaviour of the concrete structure. To improve the understanding of concrete subjected to severe loading, a combination of experiments and numerical methods is a powerful tool; it can be used for detailed analysis of the structural behaviour. This paper deals with examples of using numerical methods for projectile penetration. The work reported here is a part of research project at Chalmers University of Technology, the long-term aim of which is to increase knowledge of concrete structures subjected to blast and fragment impacts. Chalmers has collaborated with the Swedish Rescue Services Agency, on earlier projects including non-linear finite element analyses of the blast loads and falling debris by Johansson [5], and studies of projectiles that penetrate concrete by Leppänen [6].

J. Leppänen / Nordic Concrete Research 30 (2003) 84-103 85
2. BEHAVIOUR OF CONCRETE UNDER DYNAMIC LOADING 2.1 Introduction When a projectile or fragments hit a concrete target, the concrete crushes and cracks, and the structure shakes and vibrates. The pressure at the nose of the projectile is several times higher than the static uniaxial strength of concrete. This is due to strain rate and confining effects. In front of the nose of the projectile, the impact causes crushing. In addition, a stress wave propagates from the tip of the nose of the projectile. Since concrete is weak in tension, the tensile wave obtained when the compressive wave reaches the reverse side of a wall can cause scabbing there, and cracking in the lateral direction; when 50 % penetration is achieved, scabbing becomes a problem, according to Krauthammer [7]. Both the compressive strength and the tensile strength of concrete are important parameters for the depth of penetration and crater size. 2.2 Strain rate in concrete for uniaxial loading The behaviour of concrete depends on the loading rate, known as the strain rate effect. The strain rate in the material is determined by the type of loading, as shown in Figure 1, for five kinds of loading, such as creep, static, earthquake, hard impact and blast loads.
10-8 10-7 10-6 10-5 10-4 10-3 10-1 1 10 102 103
CREEP STATIC EARTHQUAKE HARD IMPACT BLAST
Strain rate [s-1]
Figure 1 – Strain rates for five load types; based on Bischoff and Perry [8]. The strength, deformation capacity, and fracture energy are important parameters for characterizing and describing the response of concrete. For dynamic loading, these parameters are not the same as for static loading. When concrete is subjected to impact loading, the material strength increases. The dynamic increase factor (DIF) is the ratio between the dynamic ultimate strength and the static ultimate strength. In dynamic loading, the ultimate compressive strength can become more than double, see Bischoff and Perry [8]. Moreover, according to Ross et al. [9] the concrete ultimate uniaxial strength in tension rises by multiples of 5 to 7 at very high strain rates. The greater strength is explained by a change in the fracture plane. As the loading rate becomes higher, concrete suffers multiple fractures and the amount of aggregate fracture also increases, see Zielinski [10]. Other explanations of the increased strength are the viscous effects and the forces of inertia. The viscous effects are explained by the following; when concrete is subjected to compressive loading, the pores tend to close. The pore water causes viscous effects, and develops an inner pressure in the pores that are filled with water, which augments the strength of the material. For concrete in tension, the resistance force arises when the pores are opening, see Rossi and Toutlemonde [11]. The DIF curve, as shown in Figure 2, calculated according to
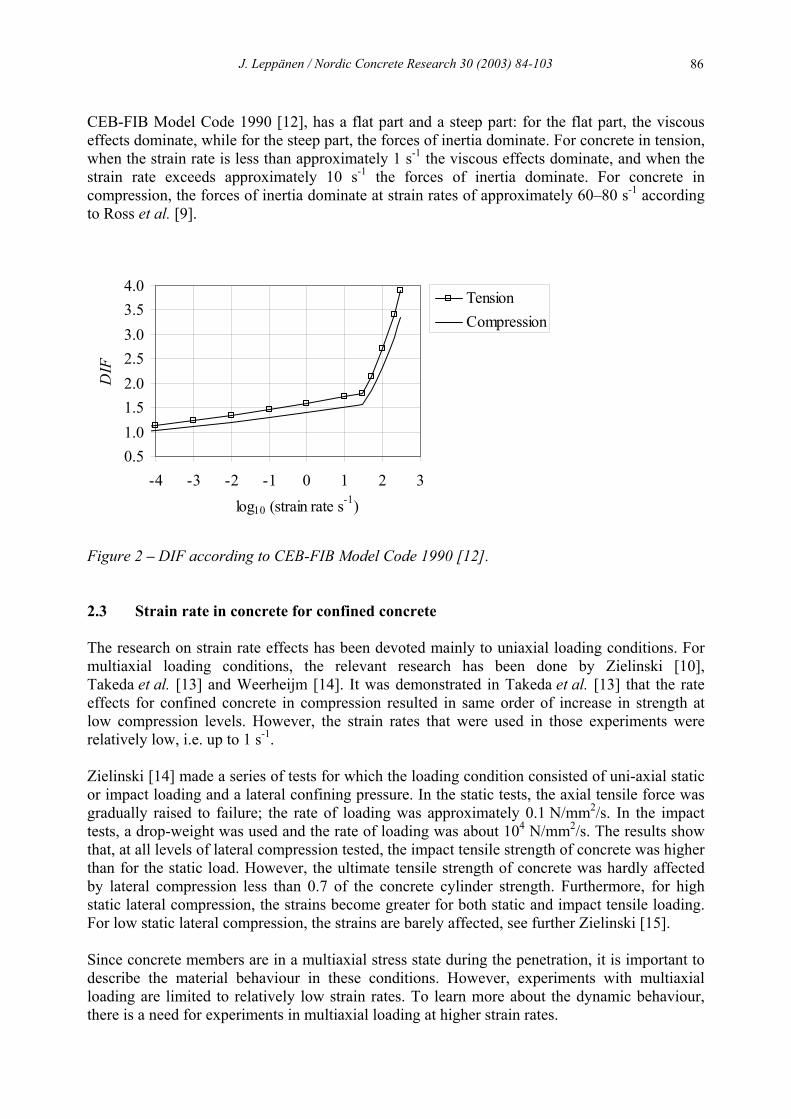
J. Leppänen / Nordic Concrete Research 30 (2003) 84-103 86
CEB-FIB Model Code 1990 [12], has a flat part and a steep part: for the flat part, the viscous effects dominate, while for the steep part, the forces of inertia dominate. For concrete in tension, when the strain rate is less than approximately 1 s-1 the viscous effects dominate, and when the strain rate exceeds approximately 10 s-1 the forces of inertia dominate. For concrete in compression, the forces of inertia dominate at strain rates of approximately 60–80 s-1 according to Ross et al. [9].
0.51.01.52.02.53.03.54.0
-4 -3 -2 -1 0 1 2 3log10 (strain rate s-1)
DIF
TensionCompression
Figure 2 – DIF according to CEB-FIB Model Code 1990 [12]. 2.3 Strain rate in concrete for confined concrete The research on strain rate effects has been devoted mainly to uniaxial loading conditions. For multiaxial loading conditions, the relevant research has been done by Zielinski [10], Takeda et al. [13] and Weerheijm [14]. It was demonstrated in Takeda et al. [13] that the rate effects for confined concrete in compression resulted in same order of increase in strength at low compression levels. However, the strain rates that were used in those experiments were relatively low, i.e. up to 1 s-1. Zielinski [14] made a series of tests for which the loading condition consisted of uni-axial static or impact loading and a lateral confining pressure. In the static tests, the axial tensile force was gradually raised to failure; the rate of loading was approximately 0.1 N/mm2/s. In the impact tests, a drop-weight was used and the rate of loading was about 104 N/mm2/s. The results show that, at all levels of lateral compression tested, the impact tensile strength of concrete was higher than for the static load. However, the ultimate tensile strength of concrete was hardly affected by lateral compression less than 0.7 of the concrete cylinder strength. Furthermore, for high static lateral compression, the strains become greater for both static and impact tensile loading. For low static lateral compression, the strains are barely affected, see further Zielinski [15]. Since concrete members are in a multiaxial stress state during the penetration, it is important to describe the material behaviour in these conditions. However, experiments with multiaxial loading are limited to relatively low strain rates. To learn more about the dynamic behaviour, there is a need for experiments in multiaxial loading at higher strain rates.
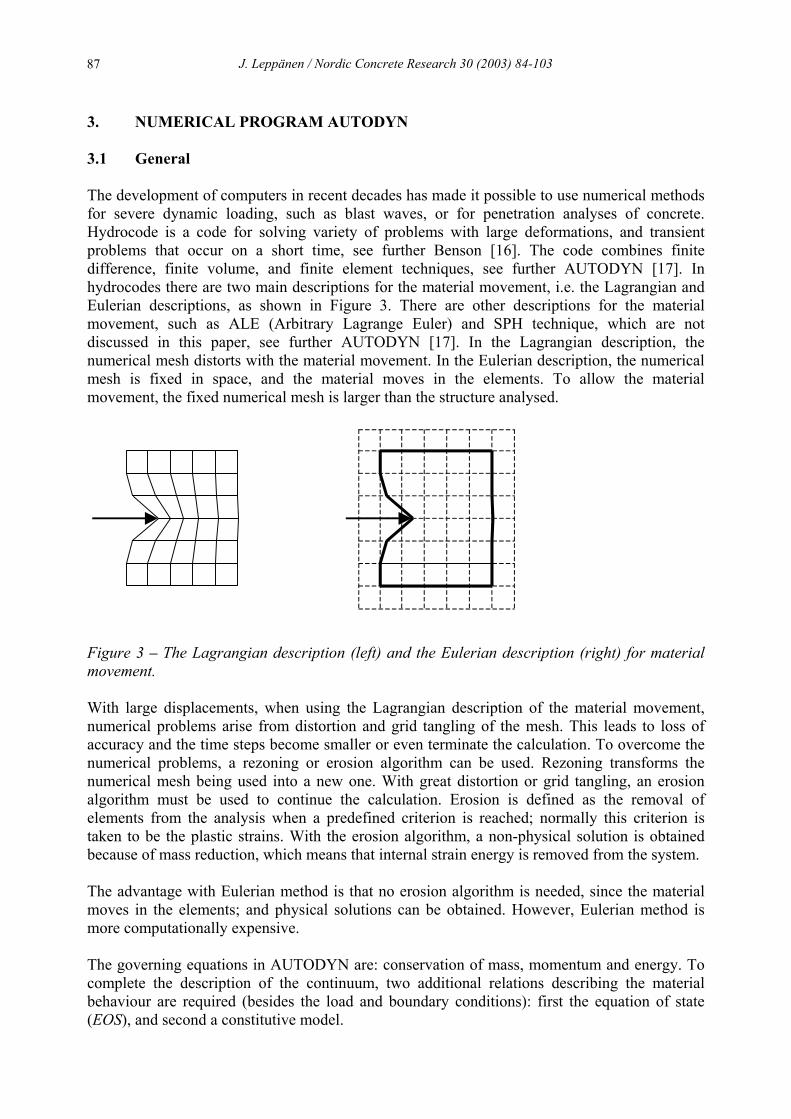
J. Leppänen / Nordic Concrete Research 30 (2003) 84-103 87
3. NUMERICAL PROGRAM AUTODYN 3.1 General The development of computers in recent decades has made it possible to use numerical methods for severe dynamic loading, such as blast waves, or for penetration analyses of concrete. Hydrocode is a code for solving variety of problems with large deformations, and transient problems that occur on a short time, see further Benson [16]. The code combines finite difference, finite volume, and finite element techniques, see further AUTODYN [17]. In hydrocodes there are two main descriptions for the material movement, i.e. the Lagrangian and Eulerian descriptions, as shown in Figure 3. There are other descriptions for the material movement, such as ALE (Arbitrary Lagrange Euler) and SPH technique, which are not discussed in this paper, see further AUTODYN [17]. In the Lagrangian description, the numerical mesh distorts with the material movement. In the Eulerian description, the numerical mesh is fixed in space, and the material moves in the elements. To allow the material movement, the fixed numerical mesh is larger than the structure analysed.
Figure 3 – The Lagrangian description (left) and the Eulerian description (right) for material movement. With large displacements, when using the Lagrangian description of the material movement, numerical problems arise from distortion and grid tangling of the mesh. This leads to loss of accuracy and the time steps become smaller or even terminate the calculation. To overcome the numerical problems, a rezoning or erosion algorithm can be used. Rezoning transforms the numerical mesh being used into a new one. With great distortion or grid tangling, an erosion algorithm must be used to continue the calculation. Erosion is defined as the removal of elements from the analysis when a predefined criterion is reached; normally this criterion is taken to be the plastic strains. With the erosion algorithm, a non-physical solution is obtained because of mass reduction, which means that internal strain energy is removed from the system. The advantage with Eulerian method is that no erosion algorithm is needed, since the material moves in the elements; and physical solutions can be obtained. However, Eulerian method is more computationally expensive. The governing equations in AUTODYN are: conservation of mass, momentum and energy. To complete the description of the continuum, two additional relations describing the material behaviour are required (besides the load and boundary conditions): first the equation of state (EOS), and second a constitutive model.
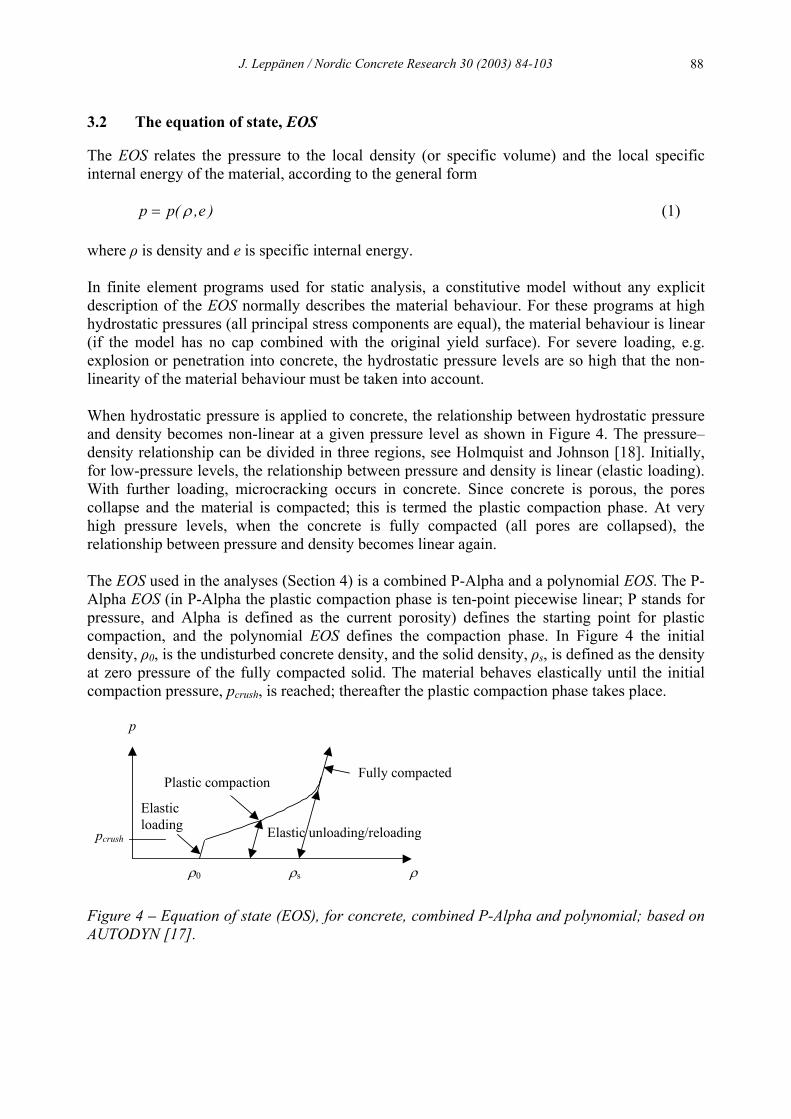
J. Leppänen / Nordic Concrete Research 30 (2003) 84-103 88
3.2 The equation of state, EOS The EOS relates the pressure to the local density (or specific volume) and the local specific internal energy of the material, according to the general form )e,(pp ρ= (1) where ρ is density and e is specific internal energy. In finite element programs used for static analysis, a constitutive model without any explicit description of the EOS normally describes the material behaviour. For these programs at high hydrostatic pressures (all principal stress components are equal), the material behaviour is linear (if the model has no cap combined with the original yield surface). For severe loading, e.g. explosion or penetration into concrete, the hydrostatic pressure levels are so high that the non-linearity of the material behaviour must be taken into account. When hydrostatic pressure is applied to concrete, the relationship between hydrostatic pressure and density becomes non-linear at a given pressure level as shown in Figure 4. The pressure–density relationship can be divided in three regions, see Holmquist and Johnson [18]. Initially, for low-pressure levels, the relationship between pressure and density is linear (elastic loading). With further loading, microcracking occurs in concrete. Since concrete is porous, the pores collapse and the material is compacted; this is termed the plastic compaction phase. At very high pressure levels, when the concrete is fully compacted (all pores are collapsed), the relationship between pressure and density becomes linear again. The EOS used in the analyses (Section 4) is a combined P-Alpha and a polynomial EOS. The P-Alpha EOS (in P-Alpha the plastic compaction phase is ten-point piecewise linear; P stands for pressure, and Alpha is defined as the current porosity) defines the starting point for plastic compaction, and the polynomial EOS defines the compaction phase. In Figure 4 the initial density, ρ0, is the undisturbed concrete density, and the solid density, ρs, is defined as the density at zero pressure of the fully compacted solid. The material behaves elastically until the initial compaction pressure, pcrush, is reached; thereafter the plastic compaction phase takes place. p ρ0 ρs ρ
pcrush Elastic unloading/reloading
Elastic loading
Plastic compaction Fully compacted
Figure 4 – Equation of state (EOS), for concrete, combined P-Alpha and polynomial; based on AUTODYN [17].
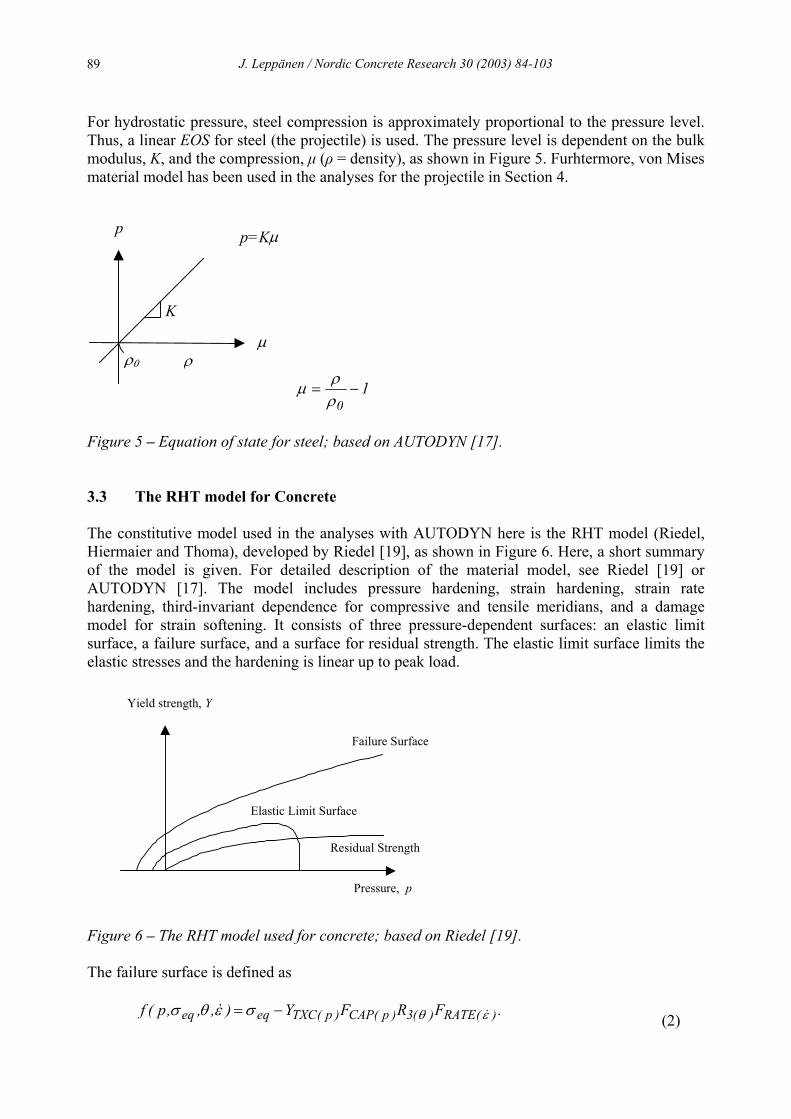
J. Leppänen / Nordic Concrete Research 30 (2003) 84-103 89
For hydrostatic pressure, steel compression is approximately proportional to the pressure level. Thus, a linear EOS for steel (the projectile) is used. The pressure level is dependent on the bulk modulus, K, and the compression, µ (ρ = density), as shown in Figure 5. Furhtermore, von Mises material model has been used in the analyses for the projectile in Section 4.
ρ0
K
p
µ
p=K µ
ρ
1−=0ρρµ
Figure 5 – Equation of state for steel; based on AUTODYN [17]. 3.3 The RHT model for Concrete The constitutive model used in the analyses with AUTODYN here is the RHT model (Riedel, Hiermaier and Thoma), developed by Riedel [19], as shown in Figure 6. Here, a short summary of the model is given. For detailed description of the material model, see Riedel [19] or AUTODYN [17]. The model includes pressure hardening, strain hardening, strain rate hardening, third-invariant dependence for compressive and tensile meridians, and a damage model for strain softening. It consists of three pressure-dependent surfaces: an elastic limit surface, a failure surface, and a surface for residual strength. The elastic limit surface limits the elastic stresses and the hardening is linear up to peak load.
Residual Strength
Elastic Limit Surface
Failure Surface
Yield strength, Y
Pressure, p
Figure 6 – The RHT model used for concrete; based on Riedel [19]. The failure surface is defined as
.FRFY),,,p(f )(RATE)(3)p(CAP)p(TXCeqeq εθσεθσ && −= (2)
J. Leppänen / Nordic Concrete Research 30 (2003) 84-103 90
The pressure dependency is defined as [ ]N
RATEspall**
cTXC )Fpp(AfY −= (3) where A and N define the form of the failure surface as a function of pressure, p* is the pressure normalized by fc, and p*
spall is defined as p*(ft/fc). The failure surface is a function of the pressure and the strain rate. The third-invariant dependence is included in the failure surface with a function R3(θ), which defines the transfusion from the compressive meridian to tensile meridian and stress states between these. Furthermore the model has a function, FCAP(p), which limits the elastic deviatoric stresses under hydrostatic compression. The rate dependency in the yield surface is defined as
⋅=<
⋅=>
=−
−
1-60t
0
1-60c
0RATE
s103 (tension), f 3/1 p for
s1030 on),(compressi f 3/1 p for F
εεε
εεε
δ
α
&&
&
&&
&
(4)
where α is the strain rate factor for compression and δ is the strain rate factor for tension. When the failure surface is reached, the softening phase starts, and continues until the residual strength surface is reached. The residual strength surface is defined by parameters B and M, and is a function of the pressure level as by
(5) .p BY M*residual
* ×=
4. NUMERICAL MODELLING OF CONCRETE PENETRATION 4.1 The experimental series To ensure that a numerical model can predict the depth of penetration and crater size, results from more than one experiment must be reproduced. In this work two experimental series with a total of 6 shots were compared. Analyses with AUTODYN by using the RHT model for the concrete target were made. Two experimental series were compared with numerical analyses: first, a 6.28 kg projectile striking a concrete cylinder at a velocity of 485 m/s, experiments by Hansson [20]; and second experiments with a 0.906 kg projectile striking a concrete cylinder, the results of four striking velocities from 277 m/s to 800 m/s are compared with experiments by Forrestal et al. [3]. For the first experimental series, both the Lagrangian and Eulerian methods were used, while for the second experimental series, only the Lagrangian method was used for the numerical analyses. The heavy steel projectile In the experimental series reported by Hansson [20], the 6.28 kg ogive-nose steel projectile used had a length of 225 mm, diameter of 75 mm, density of 7 830 kg/m3, bulk modulus of 159 GPa, shear modulus of 81.8 GPa, and yield stress of 792 MPa.
J. Leppänen / Nordic Concrete Research 30 (2003) 84-103 91
The target was a concrete cylinder, cast in a steel culvert, with a diameter of 1.6 m and a length of 2 m. The concrete cube strength was approximately 40 MPa (tested on a 150 mm cube). Two shots were fired at the same impact velocity, the first with support and the second without support at the opposite end of the target; the results are shown in Table 1. Table 1 – Data summary for the experiments with 6.28 kg projectile striking a concrete cylinder. After Hansson [20].
Striking velocity (m/s)
Projectile mass (kg)
fc,cube (MPa)
Depth of penetration (m)
485 6.28 40 0.655 - 0.660 a a. Two shots were fired, first with support and second without support at the reverse side of the target. The light steel projectile In the series reported by Forrestal et al. [3], ogive-nose projectiles comprising from 4 340 steel rods and heat-treated to a hardness of Rc 43 - 45 were used. Moreover, filler material was used in the projectiles, with a density of 1 580 kg/m3. The projectile length, l, was 242.4 mm, the diameter, d, was 26.9 mm, and the ogival radius, s, was 53.8 mm. The concrete targets were cast, in galvanized corrugated steel cylinders, with a diameter of 1.37 m and target length of 0.76 m. The shots had striking velocities of 277 m/s and 499 m/s. For two other experiments with impact velocities of 642 m/s and 800 m/s, the target diameter was 1.22 m and the length 1.83 m. The concrete had a density of 2 370 kg/m3, and the unconfined uniaxial compressive cylinder strength varied between 32.4 MPa and 35.2 MPa. The four experiments with the 0.906 kg projectile are compared in this paper, and their results are summarized in Table 2. Table 2 – Data summary for the experiments with 0.906 kg projectile striking a concrete cylinder. After Forrestal et al. [3].
Striking velocity (m/s)
Projectile mass (kg)
fc (MPa)
Depth of penetration (m)
277 0.906 35.2 0.173 499 0.912 33.5 0.480
642 0.905 34.7 0.620
800 0.904 32.4 0.958 4.2 Mesh descriptions It is well known that the size of a numerical mesh affects the results, and that a refined mesh extends the computational time dramatically. For dynamic loading, the mesh dependency is even more important, since more terms are added to the constitutive models (the strain rate effect). Johansson [5] studied the mesh dependency by comparing static and dynamic loading. He concluded that, when the strain rate effect was included in a constitutive model, the general
J. Leppänen / Nordic Concrete Research 30 (2003) 84-103 92
behaviour changed considerably. Since, the strain rate depends on the numerical mesh, the increase in dynamic strength is also mesh-dependent. To assess the mesh dependency, the common method is to halve the mesh and compare the first coarse mesh with the halved finer mesh; if the results differ only negligibly, the analyst is satisfied. In numerical analyses with dynamic loading, it is necessary to use several meshes to ensure the accuracy of the results. Moreover, changing a mesh size in the structure must be done with great care. When Zukas and Scheffler [21] made a study on the effects of meshing, they concluded that, for accuracy, there should be at least three elements across the radius of the projectile. The mesh dependency was chosen, by starting, as a rule of thumb, with three elements across the radius of the projectile, after which the mesh was further refined. In this paper, only the final mesh is presented; for further details, see Leppänen [6]. The numerical mesh 1 is shown in Figure 7, which is used to analyse the experiments by Hansson [20] in Section 4.4. The target is of concrete, cast in a steel cylinder. The model is axisymmetric, formed by quadratic elements with an element length of 6.25 mm, totaling 128 x 320 elements (for the target).
steel cylinder
projectile
Figure 7 – Numerical mesh 1, 6.28 kg projectile. Numerical mesh 2 is shown in Figure 8, which is used to analyse the experiments by Forrestal et al. [3] in Section 4.4. The target is of concrete, cast in a galvanized steel cylinder. The model is axisymmetric, generated by rectangular elements with an element length of approximately 4 mm. For a target length of 0.76 m, the mesh size is 190 x 172 elements as seen in the figure, while for a target length of 1.83 m, the mesh size is 153 x 458 elements.
filler
steel cylinder
projectile
Figure 8 – Numerical mesh 2, 0.906 kg projectile.
J. Leppänen / Nordic Concrete Research 30 (2003) 84-103 93
4.3 Analyses with AUTODYN A lack of data of dynamic material properties makes selection of parameters difficult and crucial. In this section, description of, and discussion on choosing the proper material parameters is given. The EOS used in the numerical model combines a P-Alpha EOS with a polynomial one, see Figure 4. The material parameters are given in Table 3. Detailing of the material parameters is described in AUTODYN [17]; here, the compaction phase (polynomial EOS) is chosen to have the default values from the material library in AUTODYN. In the experimental series with 6.28 kg projectile, the density of the concrete is assumed to be 2 400 kg/m3. Table 3 – Input data for modelling concrete: RHT model, equation of state (EOS).
Parameter Value
Porous density (g/cm3) ρ0 a
Porous sound speed (m/s) 2920
Initial compaction pressure (kPa) 2.33·104
Solid compaction pressure (kPa) 6·106
Compaction exponent n 3
Solid EOS: Polynomial
Compaction curve: Standard
A1 (kPa) 3.527·107
A2 (kPa) 3.958·107
A3 (kPa) 9.04·106
B0 1.22
B1 1.22
T1 (kPa) 3.527·107
T2 (kPa) 0 a. 2 400 g/cm3 for the experiments with 6.28 kg projectile, and 2 370 g/cm3 for the one with 0.906 kg projectile. The constitutive model used in the study is the RHT one shown in Figure 6 and described in Section 3.3. The material parameters of the concrete are shown in Table 4. Parameters A and N describe the failure surface (compressive meridian), see equation (3). From knowledge of the concrete behaviour in tri-axial stress states, the parameters can be determined. In the work reported here, the parameters used are calculated according to the model proposed by Attard and Setunge [22], as shown in Figure 9, for low confining pressures. However, parameters A and N used in the work here fit the experimental data presented by Bažant et al. [23], with fc = 46 MPa, see Figure 9. In the experiments compared here, the ultimate uniaxial strength is approximately 34 MPa. Since, the pressure in the model is normalized by fc, it is assumed that the behaviour is similar for the lower strength concrete.
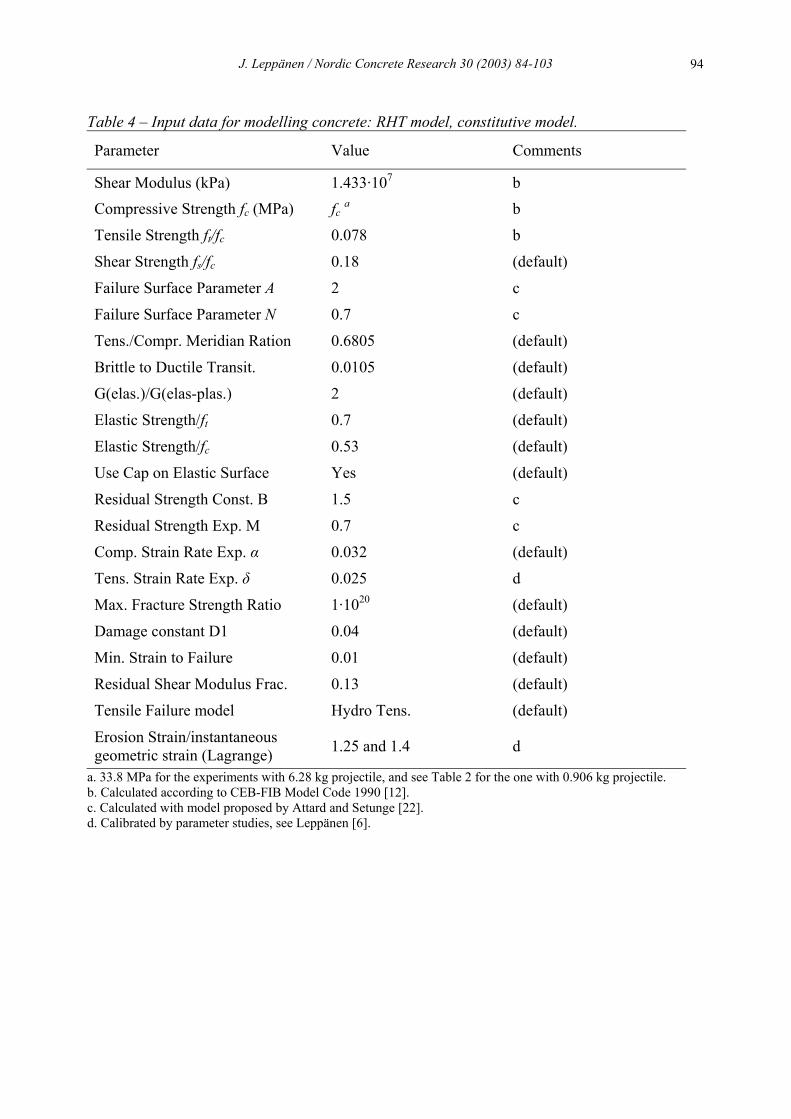
J. Leppänen / Nordic Concrete Research 30 (2003) 84-103 94
Table 4 – Input data for modelling concrete: RHT model, constitutive model.
Parameter Value Comments
Shear Modulus (kPa) 1.433·107 b Compressive Strength fc (MPa) fc a b
Tensile Strength ft/fc 0.078 b
Shear Strength fs/fc 0.18 (default)
Failure Surface Parameter A 2 c
Failure Surface Parameter N 0.7 c
Tens./Compr. Meridian Ration 0.6805 (default)
Brittle to Ductile Transit. 0.0105 (default)
G(elas.)/G(elas-plas.) 2 (default)
Elastic Strength/ft 0.7 (default)
Elastic Strength/fc 0.53 (default)
Use Cap on Elastic Surface Yes (default)
Residual Strength Const. B 1.5 c
Residual Strength Exp. M 0.7 c
Comp. Strain Rate Exp. α 0.032 (default)
Tens. Strain Rate Exp. δ 0.025 d
Max. Fracture Strength Ratio 1·1020 (default)
Damage constant D1 0.04 (default)
Min. Strain to Failure 0.01 (default)
Residual Shear Modulus Frac. 0.13 (default)
Tensile Failure model Hydro Tens. (default)
Erosion Strain/instantaneous geometric strain (Lagrange) 1.25 and 1.4 d
a. 33.8 MPa for the experiments with 6.28 kg projectile, and see Table 2 for the one with 0.906 kg projectile. b. Calculated according to CEB-FIB Model Code 1990 [12]. c. Calculated with model proposed by Attard and Setunge [22]. d. Calibrated by parameter studies, see Leppänen [6].
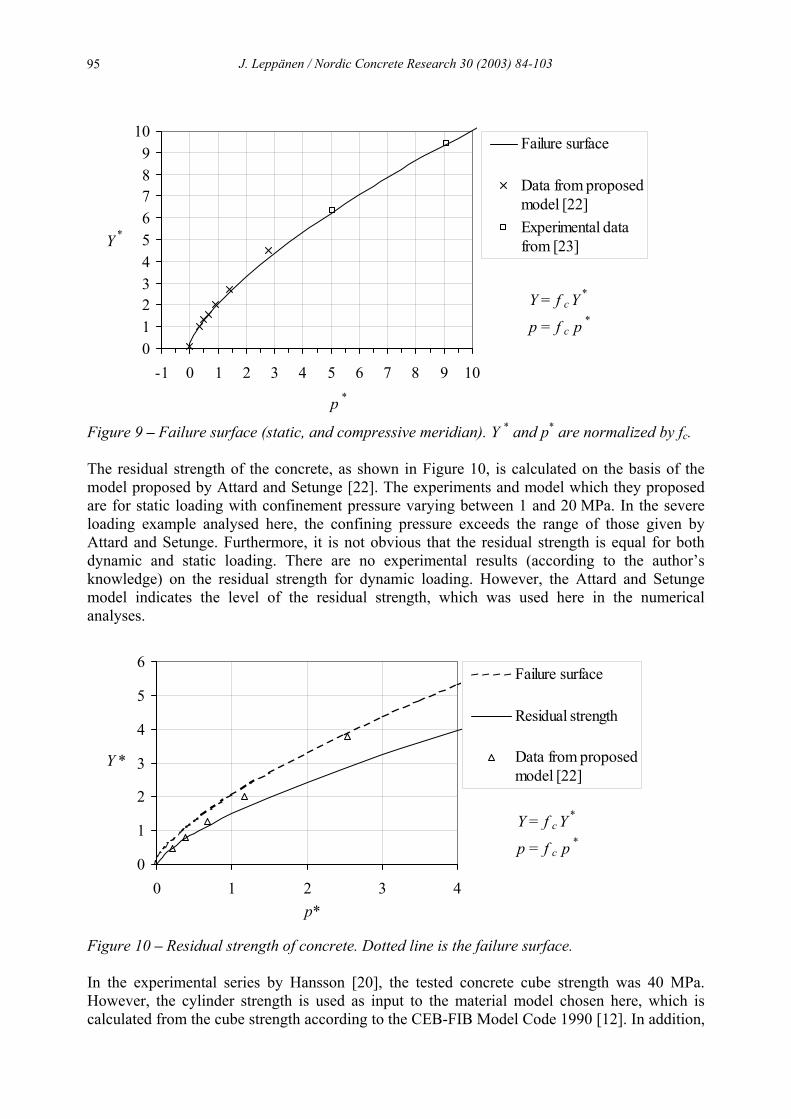
J. Leppänen / Nordic Concrete Research 30 (2003) 84-103 95
0123456789
10
-1 0 1 2 3 4 5 6 7 8 9 10
Failure surface
Data from proposedmodel [22]Experimental datafrom [23]
p *
Y *
Y = f c Y *
p = f c p*
Figure 9 – Failure surface (static, and compressive meridian). Y * and p* are normalized by fc. The residual strength of the concrete, as shown in Figure 10, is calculated on the basis of the model proposed by Attard and Setunge [22]. The experiments and model which they proposed are for static loading with confinement pressure varying between 1 and 20 MPa. In the severe loading example analysed here, the confining pressure exceeds the range of those given by Attard and Setunge. Furthermore, it is not obvious that the residual strength is equal for both dynamic and static loading. There are no experimental results (according to the author’s knowledge) on the residual strength for dynamic loading. However, the Attard and Setunge model indicates the level of the residual strength, which was used here in the numerical analyses.
0
1
2
3
4
5
6
0 1 2 3 4
Failure surface
Residual strength
Data from proposedmodel [22]
Y *
p*
Y = f c Y *
p = f c p*
Figure 10 – Residual strength of concrete. Dotted line is the failure surface. In the experimental series by Hansson [20], the tested concrete cube strength was 40 MPa. However, the cylinder strength is used as input to the material model chosen here, which is calculated from the cube strength according to the CEB-FIB Model Code 1990 [12]. In addition,
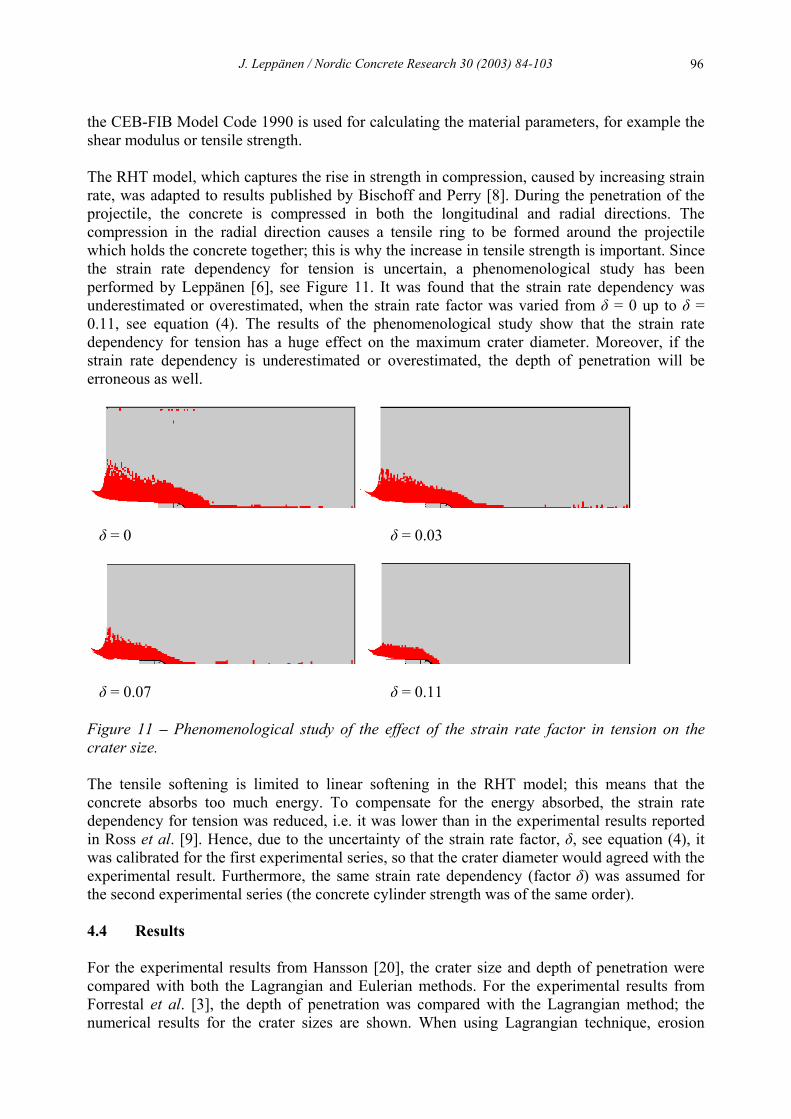
J. Leppänen / Nordic Concrete Research 30 (2003) 84-103 96
the CEB-FIB Model Code 1990 is used for calculating the material parameters, for example the shear modulus or tensile strength. The RHT model, which captures the rise in strength in compression, caused by increasing strain rate, was adapted to results published by Bischoff and Perry [8]. During the penetration of the projectile, the concrete is compressed in both the longitudinal and radial directions. The compression in the radial direction causes a tensile ring to be formed around the projectile which holds the concrete together; this is why the increase in tensile strength is important. Since the strain rate dependency for tension is uncertain, a phenomenological study has been performed by Leppänen [6], see Figure 11. It was found that the strain rate dependency was underestimated or overestimated, when the strain rate factor was varied from δ = 0 up to δ = 0.11, see equation (4). The results of the phenomenological study show that the strain rate dependency for tension has a huge effect on the maximum crater diameter. Moreover, if the strain rate dependency is underestimated or overestimated, the depth of penetration will be erroneous as well.
δ = 0 δ = 0.03
δ = 0.07 δ = 0.11
Figure 11 – Phenomenological study of the effect of the strain rate factor in tension on the crater size. The tensile softening is limited to linear softening in the RHT model; this means that the concrete absorbs too much energy. To compensate for the energy absorbed, the strain rate dependency for tension was reduced, i.e. it was lower than in the experimental results reported in Ross et al. [9]. Hence, due to the uncertainty of the strain rate factor, δ, see equation (4), it was calibrated for the first experimental series, so that the crater diameter would agreed with the experimental result. Furthermore, the same strain rate dependency (factor δ) was assumed for the second experimental series (the concrete cylinder strength was of the same order). 4.4 Results For the experimental results from Hansson [20], the crater size and depth of penetration were compared with both the Lagrangian and Eulerian methods. For the experimental results from Forrestal et al. [3], the depth of penetration was compared with the Lagrangian method; the numerical results for the crater sizes are shown. When using Lagrangian technique, erosion
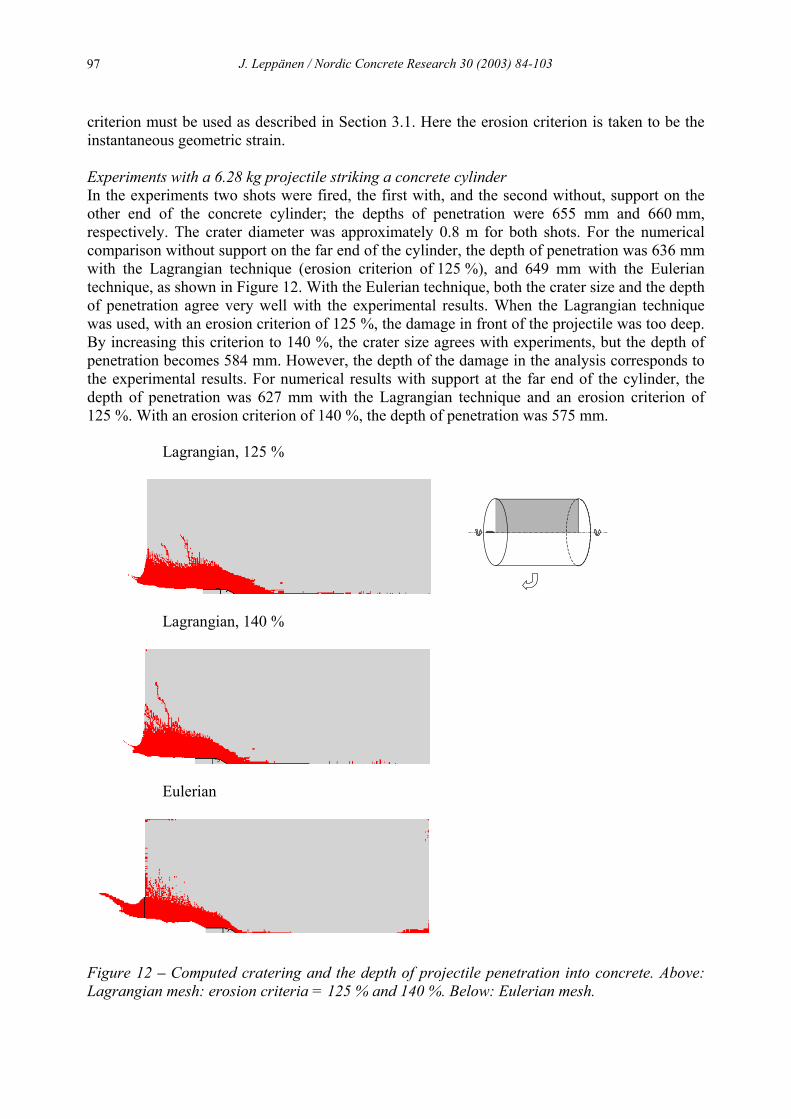
J. Leppänen / Nordic Concrete Research 30 (2003) 84-103 97
criterion must be used as described in Section 3.1. Here the erosion criterion is taken to be the instantaneous geometric strain. Experiments with a 6.28 kg projectile striking a concrete cylinder In the experiments two shots were fired, the first with, and the second without, support on the other end of the concrete cylinder; the depths of penetration were 655 mm and 660 mm, respectively. The crater diameter was approximately 0.8 m for both shots. For the numerical comparison without support on the far end of the cylinder, the depth of penetration was 636 mm with the Lagrangian technique (erosion criterion of 125 %), and 649 mm with the Eulerian technique, as shown in Figure 12. With the Eulerian technique, both the crater size and the depth of penetration agree very well with the experimental results. When the Lagrangian technique was used, with an erosion criterion of 125 %, the damage in front of the projectile was too deep. By increasing this criterion to 140 %, the crater size agrees with experiments, but the depth of penetration becomes 584 mm. However, the depth of the damage in the analysis corresponds to the experimental results. For numerical results with support at the far end of the cylinder, the depth of penetration was 627 mm with the Lagrangian technique and an erosion criterion of 125 %. With an erosion criterion of 140 %, the depth of penetration was 575 mm. Lagrangian, 125 %
Lagrangian, 140 %
Eulerian
Figure 12 – Computed cratering and the depth of projectile penetration into concrete. Above: Lagrangian mesh: erosion criteria = 125 % and 140 %. Below: Eulerian mesh.
J. Leppänen / Nordic Concrete Research 30 (2003) 84-103 98
Experiments with a 0.906 kg projectile striking a concrete cylinder A total of four experimental results were compared with experiments by Forrestal et al. [3], all for a projectile diameter of 26.9 mm, and with differing impact velocities. The results from the analysis are shown in Figure 13, where the depth of penetration is analysed with the RHT model for the impact velocities.
0.0
0.2
0.4
0.6
0.8
1.0
1.2
0 200 400 600 800 1000Impact velocity [m/s]
Empirical formula 1
Experimental data 1
AUTODYN 2
AUTODYN 3
Depth of penetration [m]
Figure 13 – Comparison of numerical results with experimental results [3]. 1 Forrestal et al. [3]. 2 Yield strength of steel is 1 448 MPa (true ultimate strength). 3 Yield strength of steel is 972 MPa (true yield strength). The projectile was made of steel with a hardness of Rc 43 – 45; the yield strength of this Rc 43 - 45 steel is 972 MPa, and the ultimate strength is 1 448 MPa. In the numerical model, a von Mises material model is used for the steel. Since the von Mises material model has no hardening in AUTODYN, the yield strengths of 972 MPa and 1 448 MPa were used in the analyses; this gives upper and lower limits of the strength of the steel (if the strain rate effect is neglected). In Figure 14 the crater size and depth of penetration from the analyses are shown. The depth of penetration, maximum crater diameter and the lateral damage are greater for higher impact velocities. In these analyses the yield strength of the steel in the projectile was 1 448 MPa. The crater size is smaller for the light projectile than in experiments with the heavier projectile; the maximum crater diameter was between 0.20 and 0.40 m depending on the impact velocity.
J. Leppänen / Nordic Concrete Research 30 (2003) 84-103 99
Vs = 277 m/s Vs = 499 m/s
Vs = 642 m/s
Vs = 800 m/s
Figure 14 – Computed cratering and the depth of penetration of four projectile striking velocities. Lagrangian mesh: erosion criterion = 140 %. The yield strength for the steel of the projectile in the analyses was 1 448 MPa. In analyses where the yield strength of the steel used for the projectile was 972 MPa, the results were very similar at low impact velocities, i.e. 277 m/s and 499 m/s. For the experiments with higher impact velocities, i.e. 642 m/s and 800 m/s, the depth of penetration is less when using the yield strength than when using the ultimate strength of steel in the analyses, see Figure 13. The results of the analyses are shown in Figure 15 for the two higher impact velocities.
J. Leppänen / Nordic Concrete Research 30 (2003) 84-103 100
Vs = 642 m/s
Vs = 800 m/s
Figure 15 – Computed cratering and the depth of penetration. Lagrangian mesh: erosion criterion = 140 %. The yield strength for the steel of the projectile in the analyses was 972 MPa. For the higher impact velocities, the steel strength of the projectile is important. The projectile deforms when using the true yield strength of the material in the material model (von Mises), as shown in Figure 16. However, when using the ultimate strength of the steel, the projectile did not deform. Steel has, as does concrete, a strain rate dependency. In this paper, the strain rate dependency is not taken into account for the projectile. Therefore, when using a material model that does not take into account the hardening and strain rate effects, it is proposed that the true ultimate strength be used, instead of the true yield strength, as the yield strength in the material model (here von Mises, no hardening and no strain rate effects).
Figure 16 – Projectile deformations for two yield strengths of steel. Impact velocity of 800 m/s. Above: The yield strength for steel of the projectile in the analysis was 1 448 MPa. Below: The yield strength was 972 MPa.
J. Leppänen / Nordic Concrete Research 30 (2003) 84-103 101
4.5 Discussion To achieve a reliable model, results from several experiments must be reproduced, for both the crater size and the depth of penetration. For example, accurate results for depth of penetration can be obtained by changing the residual strength or the erosion criterion (with the Lagrangian method). In this paper, numerical comparisons with experiments by Hansson [20] were made with both Lagrangian and Eulerian methods. The erosion criterion, which is the instantaneous geometric strain for Lagrangian analyses, was calibrated to fit the experimental results. This erosion criterion was then used for further comparison with another experimental series, in Forrestal et al. [3], with four impact velocities for the projectile. For these experiments, the projectile was modelled with the von Mises material model. Since this model has no hardening, the difference between the ultimate strength and the yield strength of the steel is so great that, by using the yield strength of the material, the depth of penetration becomes underestimated. Therefore, analyses using the ultimate strength as the yield strength in the model were also carried out. This gives lower and upper limits (if the strain rate effect is not taken into account) according to the strength of the steel in the projectile. At low impact velocities, the difference in depth of penetration is negligible, but for the higher impact velocities the higher steel strength is important as shown in Figure 13. In the experiments, non-deforming projectiles were used. As shown in Figure 16, in the analysis the projectile deforms when the increase in steel strength is not modelled. Hence, modelling the steel accurately, i.e. including hardening and strain rate effects in the material model, is important. 5. CONCLUSIONS The behaviour of concrete changes under dynamic loading: the initial stiffness, as well as the ultimate strength, in both compression and tension, increase. Furthermore, the fracture of a concrete member changes under dynamic loading and multiple fracture planes are obtained. When the behaviour of concrete under tri–axial stress states (failure surface, residual strength etc.) is known, and with sophisticated material models, such as the RHT model in AUTODYN, the depth of penetration and the crater size can be computed. In this paper numerical analyses were compared with two test series, with different projectile weights and impact velocities; in all cases the depth of penetration was simulated well. The Eulerian method is preferable. With the Lagrangian method, by using the erosion algorithm, elements are removed from the model and, thus, also mass and strain energy, which yields non-physical results. However, the Lagrangian method is faster and may still give reliable results by using large erosion criteria. The main material parameters that influence the depth of penetration are the concrete compressive strength, the strain rate dependency for compression, and the level of residual strength. The material parameters that have the most influence on the size of the crater are the tensile strength, the fracture energy and the strain rate dependency for tension.
J. Leppänen / Nordic Concrete Research 30 (2003) 84-103 102
Acknowledgements The author would like to thank Professor Kent Gylltoft and the reference group members of the project “Dynamic behaviour of concrete structures subjected to blast and fragment impacts”. The members are Björn Ekengren, M.Sc., from the Swedish Rescue Services Agency, Mario Plos, Ph.D., from Chalmers University of Technology and Morgan Johansson, Ph.D., from Reinertsen AB. This research project was financed by the Swedish Rescue Services Agency. References 1. Bergman, S.G.A., ”Inträngning av pansarbrytande projektiler och bomber i armerad betong”
(in Swedish), FortF/F TM B 2, 1950, pp. 179-217. 2. Hughes, G., “Hard Missile Impact on Reinforced Concrete,” Nuclear Engineering and
Design, Vol. 77, 1984, pp. 23-35. 3. Forrestal, M.J., Altman, B.S., Cargile, J.D. and Hanchak, S.J. “An Empirical Equation for
Penetration Depth of Ogive-Nose Projectiles into Concrete Targets,” International Journal of Impact Engineering, Vol. 15, No. 4, Aug 1994, pp. 395-405.
4. Chen, X.W. and Q.M. Li, “Deep Penetration of a Non-deformable Projectile with Different Geometrical Characteristics,” International Journal of Impact Engineering, Vol. 27, No. 6, 2002/7 2002, pp. 619-637.
5. Johansson, M., “Structural Behaviour in Concrete Frame Corners of Civil Defence Shelters, Non-linear Finite Element Analyses and Experiments”, Doctoral Thesis, Department of Structural Engineering, Concrete Structures, Chalmers University of Technology, Göteborg, Sweden, 2000, 204 pp.
6. Leppänen, J., “Dynamic Behaviour of Concrete Structures subjected to Blast and Fragment Impacts”, Licentiate Thesis, Department of Structural Engineering, Concrete Structures, Chalmers University of Technology, Göteborg, 2002, 71 pp.
7. Krauthammer, T., “Modern Protective Structures, Design, Analysis and Evaluation”, Course notes, The Pennsylvania State University, 2000, 358 pp.
8. Bischoff, P.H. and Perry, S.H. “Compressive Behaviour of Concrete at High Strain Rates,” Materials and Structures, Vol. 24, 1991, pp. 425-450.
9. Ross, C.A., Jerome, D.M., Tedesco, J.W. and Hughes, M.L. “Moisture and Strain Rate Effects on Concrete Strength,” ACI Materials Journal, Vol. 93, No. 3, May-Jun 1996, pp. 293-300.
10. Zielinski, A.J., “Fracture of Concrete and Mortar under Uniaxial Impact Tensile Loading”, Doctoral Thesis, Delft University of Technology, 1982.
11. Rossi, P. and Toutlemonde, F. “Effect of Loading Rate on the Tensile Behaviour of Concrete: Description of the Physical Mechanisms,” Materials and Structures/Materiaux et Constructions, Vol. 29, No. 186, Mars 1996, pp. 116-118.
12. CEB-FIB Model Code 1990, “CEB-FIB Model Code 1990, Design Code, Thomas Telford”, Lausanne, Switzerland, 1993, 437 pp.
13. Takeda, J., Tachikawa, H. and Fujimoto, K. “Mechanical Behavior of Concrete under Higher Rate Loading than in Static Test”, Proc. Mechanical Behaviour of Materials 1974, pp. 479-486.
14. Weerheijm, J., “Concrete under Impact Tensile Loading and Lateral Compression”, Doctoral Thesis, Delft University of Technology, The Netherlands, 1992, 157 pp.
15. Zielinski, A.J., “Concrete under Biaxial Loading: Static Compression-impact Tension”, 5-85-1, Delft University of Technology, 1985.

J. Leppänen / Nordic Concrete Research 30 (2003) 84-103 103
16. Benson, D., J. “ Computational methods in Lagrangian and Eulerian hydrocodes”, Computer Methods in Applied Mechanics and Engineering, Vol. 99, n. 2-3, Sept 1992, pp. 235-394.
17. AUTODYN Manuals, “Version 4.2, Century Dynamics, Inc. 2001”, Sam Ramon, USA, 2001.
18. Holmquist, T., J. and Johnson, G. R. “A Computational Constitutive Model for Concrete subjected to Large Strains, High Strain Rates, and High Pressures”, 14th International Symposium on Ballistics, Québec, Canada, 26-29 Sept 1993, pp. 591-600.
19. Riedel, W., “Beton unter dynamischen Lasten Meso- und makromechanische Modelle und ihre Parameter” (in German), Doctoral Thesis, Institut Kurzzeitdynamik, Ernst-Mach-Institut, der Bundeswehr Munchen, Freiburg, 2000, 210 pp.
20. Hansson, H., “Numerical Simulation of Concrete Penetration”, 98-00816-311--SE, FOA-R, Defence Research Establishment, Tumba, 1998, 17 pp.
21. Zukas, J.A. and Scheffler, D.R. “Practical Aspects of Numerical Simulations of Dynamic Events: Effects of Meshing,” International Journal of Impact Engineering, Vol. 24, No. 9, Oct 2000, pp. 925-945.
22. Attard, M.M. and Setunge, S. “Stress-strain Relationship of Confined and Unconfined Concrete,” ACI Materials Journal, Vol. 93, No. 5, Sep-Oct 1996, pp. 432-442.
23. Bažant, Z.P., Xiang, Y.Y., Adley, M.D., Prat, P.C. and S.A. Akers, “Microplane Model for Concrete: II: Data Delocalization and Verification,” Journal of Engineering Mechanics-ASCE, Vol. 122, No. 3, Mar 1996, pp. 255-262.

Paper III

International Journal of Impact Engineering ] (]]]]) ]]]–]]]
Experiments and numerical analyses of blast and fragmentimpacts on concrete
Joosef Lepp.anen*
Department of Structural Engineering and Mechanics, Concrete Structures, Chalmers University of Technology,
SE-412 96 G .oteborg, Sweden
Received 11 November 2003; received in revised form 20 April 2004; accepted 23 April 2004
Abstract
Concrete structures are commonly used as protective structures. An important issue is how the blastwave and fragment impacts from an explosion affect the concrete. It is well known that the fragmentspenetrate or even perforate the structure. Moreover, spalling occurs in the impact zone and scabbing mayoccur on the reverse side of a wall that receives an impact. However, knowledge of how the blast wave andfragment impacts influence the material properties of concrete is quite limited. Experiments and numericalanalyses were carried out to examine the extent to which the concrete, at various distances, is affected bythe blast wave and fragment impacts. The fragments, which were spherical, were shot against thick concreteblocks by using the explosives octol or hexotol; the fragment velocity was approximately 1650m/s. Afterthe concrete blocks were shot, the depths of penetration and spalling were measured. Next, the concreteblocks were cut into halves, and the global macro-cracking could be observed. To study how the materialproperties of concrete were influenced, uniaxial compressive and splitting tensile tests were carried out oncylinders drilled from selected positions in the block. Furthermore, specimens from the blocks were thin-ground to facilitate analysing the micro-cracking with a microscope. The experiments and numericalanalyses presented here showed that the damage in the concrete, from the blast wave and fragment impacts,is localized in the impact zone. The concrete below this zone, at a depth of approximately twice the depth ofthe maximum penetration, was hardly affected at all by the blast wave and fragment impacts. This indicatesthat it is possible to distinguish between the global load effects and the local damage effects that are causedby the fragment impacts. Consequently, it may be possible to separate the loads, at the design stage, from ablast wave and fragment impacts.r 2004 Elsevier Ltd. All rights reserved.
Keywords: Concrete; Fragment impacts; Blast wave; Experiment; Numerical analysis
ARTICLE IN PRESS
*Fax: +46-(0)31-772-2260.
E-mail address: [email protected] (J. Lepp.anen).
0734-743X/$ - see front matter r 2004 Elsevier Ltd. All rights reserved.
doi:10.1016/j.ijimpeng.2004.04.012
1. Introduction
Since massive concrete structures withstand blast waves and fragment impacts effectively, theyare often used as protective structures. According to the Swedish Shelter Regulations [1], a sheltershall withstand: the effect of a pressure wave corresponding to that produced by a 250-kg GPbomb with 50% by weight TNT that bursts freely outside at a distance of 5.0m from the outsideof the shelter during free pressure release. Furthermore, according to these regulations, the sheltershall withstand the effect of fragment impacts from the same type of bomb. In design, normally,the thickness of concrete is dimensioned to withstand the fragment impacts; a static load, with adynamic increase factor, approximates the blast load.Experiments show that a concrete structure exposed to a combination of blast wave and
fragments collapses more easily than one that is exposed only to a blast wave or fragment impacts,see Fors!en and Edin [2]. The impulse density of fragment impacts is usually much lower that of ablast wave; therefore, the slightly increased impulse density observed for the combined blast waveand fragment impacts cannot explain the greater damage to the structure. It is believed that thereason for the increased damage is a combination of the spalling effect and the increased impulsedensity [2]. Fors!en and Nordstr .om [3] experimented with combined blast wave and fragmentimpacts against concrete slabs. They showed that a very good estimation of the deflection can beobtained, by taking into account that the resistance of the slab is decreased by the fragmentimpacts and by adding the fragment impulse density to the positive impulse density of the blastwave. The pressure–time history was rearranged to a triangular shape by using the maximumpressure from the blast wave.Earlier experiments have dealt with the structural level: beams, walls or even entire structures
were analysed [2,3] and Nordstr .om [4]. Nevertheless, the effect of the blast wave and fragmentimpacts on the concrete material properties is not known in detail. The study reported in thispaper aims to add to the knowledge of how the damage to concrete is affected by the blast waveand fragment impacts. The spherical fragments were shot by a detonation, with either octol orhexotol, against thick non-reinforced concrete blocks. However, in a real bomb detonation, thefragments are not spherical, and the structure is reinforced. The purpose of the simplifications inthe experimental set-up was to have as few uncertain parameters as possible. With improvedunderstanding of how the concrete material properties are influenced by the loading, otherparameters can be added, for example, irregular fragments, reinforced concrete, structuralelements, or even reinforced concrete structures.The depth of penetration and cratering were measured after the concrete blocks were shot.
Next, to study the damage, the blocks were cut into halves so that global macro-cracking could beobserved. Uniaxial compressive and splitting tensile tests were made on drilled cylinders to studythe change in strength. Furthermore, thin-ground specimens were prepared from the blocks, tofacilitate analysis of micro-cracking with microscope.Another aim was to investigate how numerical methods can simulate the experiments with the
loading of combined blast wave and fragment impacts; the experimental set-up was chosen inorder to have clear boundary conditions for the numerical analyses presented in this paper. In theliterature several papers deal with numerical analyses of projectile penetration, as in Clegg et al.[5], Johnson and Beissel [6], Johnson et al. [7], Lepp.anen [8], Scheffler and Zukas [9], Zukas andScheffler [10]. Numerical analyses of a blast wave against concrete structures were carried out by
ARTICLE IN PRESS
J. Lepp .anen / International Journal of Impact Engineering ] (]]]]) ]]]–]]]2
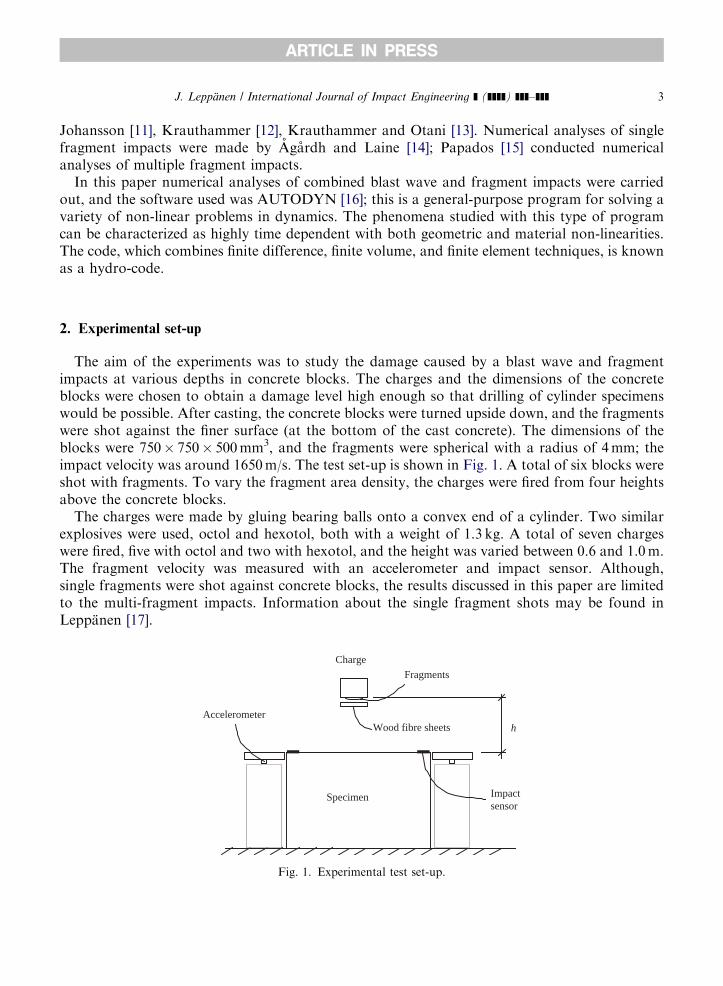
Johansson [11], Krauthammer [12], Krauthammer and Otani [13]. Numerical analyses of singlefragment impacts were made by (Ag(ardh and Laine [14]; Papados [15] conducted numericalanalyses of multiple fragment impacts.In this paper numerical analyses of combined blast wave and fragment impacts were carried
out, and the software used was AUTODYN [16]; this is a general-purpose program for solving avariety of non-linear problems in dynamics. The phenomena studied with this type of programcan be characterized as highly time dependent with both geometric and material non-linearities.The code, which combines finite difference, finite volume, and finite element techniques, is knownas a hydro-code.
2. Experimental set-up
The aim of the experiments was to study the damage caused by a blast wave and fragmentimpacts at various depths in concrete blocks. The charges and the dimensions of the concreteblocks were chosen to obtain a damage level high enough so that drilling of cylinder specimenswould be possible. After casting, the concrete blocks were turned upside down, and the fragmentswere shot against the finer surface (at the bottom of the cast concrete). The dimensions of theblocks were 750� 750� 500mm3, and the fragments were spherical with a radius of 4mm; theimpact velocity was around 1650m/s. The test set-up is shown in Fig. 1. A total of six blocks wereshot with fragments. To vary the fragment area density, the charges were fired from four heightsabove the concrete blocks.The charges were made by gluing bearing balls onto a convex end of a cylinder. Two similar
explosives were used, octol and hexotol, both with a weight of 1.3 kg. A total of seven chargeswere fired, five with octol and two with hexotol, and the height was varied between 0.6 and 1.0m.The fragment velocity was measured with an accelerometer and impact sensor. Although,single fragments were shot against concrete blocks, the results discussed in this paper are limitedto the multi-fragment impacts. Information about the single fragment shots may be found inLepp.anen [17].
ARTICLE IN PRESS
Specimen
Charge
Impactsensor
AccelerometerWood fibre sheets h
Fragments
Fig. 1. Experimental test set-up.
J. Lepp .anen / International Journal of Impact Engineering ] (]]]]) ]]]–]]] 3

The first two charges were fired against block one. For the first shot, four sheets of wood fibrewere placed below the charge to reduce the velocity. The fragment impact velocity for this shotwas 1450m/s. To increase the impact velocity, the wood fibre sheets were removed for theremaining shots. For charge two, the velocity was raised to 1680m/s. In block two (charge three)the damage at the edge was high. To facilitate drilling cylinders from the blocks (as described inSection 3.2), a steel frame was used to reduce the damage at the edges for the remaining shots. Thesteel frame was made of a 10mm thick L-profile that covered 70mm of the concrete edges. Thefragment impact velocities and the experimental set-up for the seven charges fired are shown inTable 1.
3. Experimental results
After shooting fragments at the concrete blocks, photographs were taken; the depth ofpenetration, crater depth and diameter were measured. To study how the material properties werechanged, drilled cylinders with dimensions of f50� 100mm2 were used for uniaxial compressiveand tensile tests. Furthermore, the concrete blocks were cut into halves so that the macro-crackingcould be examined. To analyse micro-cracking, thin-ground sections were taken from the blocks;using a microscope, the cracks could be observed.
3.1. Photographing the concrete blocks
Five concrete blocks (numbered from two to six), after being struck by fragments, werephotographed as shown in Fig. 2. The cracks were marked to improve the visualization. Thedepth of penetration varied between 30 and 50mm, and the crater diameter varied between 45 and60mm for the concrete blocks. To study the macro-cracking in the blocks, they were cut intohalves and the crack pattern was examined, see Fig. 3 with the crack patterns marked. All fiveblocks had similar overall crack patterns, with clear spalling in the impact zone; the depth of thedamage zone was approximately 50mm. At the boundaries of the blocks, a global crack patterndeveloped; this is caused by reflections of the stress wave generated by the impulse from the blastand fragment impacts.
ARTICLE IN PRESS
Table 1
Fragment impact velocities and experimental set up
Charge nr. Block nr. Velocity (m/s) Explosive material Height (m) Frame
1a 1 1450 Octol 1.0 No
2 1 1680 Octol 1.0 No
3 2 1660 Octol 0.8 No
4 3 1650 Hexotol 0.6 Yes
5 4 1650 Octol 0.7 Yes
6b 5 — Octol 0.7 Yes
7b 6 — Hexotol 0.6 Yes
aFour wood fibre sheets with a total thickness of 51mm were placed below the charge.bFor charges six and seven, the velocity could not be registered; the signal that registered the velocity did not work.
J. Lepp .anen / International Journal of Impact Engineering ] (]]]]) ]]]–]]]4
To study the change in material properties, uniaxial compressive and splitting tensile tests wereconducted on cylinders drilled from the concrete blocks. However, during drilling, most of thecylinders broke into two pieces. The broken cylinders were measured and drawn, as shown inFig. 4. For the cylinders drilled from the middle section, the micro-cracks could not be seen fromthe cross section (compare Fig. 3). Still, the cylinders broke, due to micro-cracking. Cylinders
ARTICLE IN PRESS
Fig. 2. Top view of concrete blocks two to six after being shot with fragments.
J. Lepp .anen / International Journal of Impact Engineering ] (]]]]) ]]]–]]] 5
were also drilled from a reference block that was not subjected to any loading; these cylinderscould be drilled out in whole pieces.
3.2. Uniaxial compressive tests
From the drilled cylinders, f50� 100mm2 specimens were sawed out at various heights andsmoothed for uniaxial compressive tests. Cylinders were drilled in two directions: horizontally
ARTICLE IN PRESS
Fig. 3. Macro-crack patterns in the cross section of concrete blocks (after cutting into halves).
Fig. 4. Crack plane drawn from drilled cylinders.
J. Lepp .anen / International Journal of Impact Engineering ] (]]]]) ]]]–]]]6
(perpendicular to the direction of the fragment impacts) and vertically. In concrete block three,the first one analysed, the cylinders were drilled horizontally at heights of 50, 125, 200, 275, 350and 425mm measured from the side of the block opposite the surface struck by the fragment. Thecylinders drilled at a level of 425mm were so severely damaged that none of them could be usedfor the uniaxial tests. In the uniaxial compressive test on cylinders drilled in the horizontaldirection, the strength was hardly affected at all by the fragment impacts, as shown in Fig. 5.In the vertical direction, f50� 100mm2 specimen were saved out from the drilled cylinders at
heights of 55, 90, 190, 260, 290 and 360mm, as shown in Fig. 6. The compressive strength wasvery little affected at a depth of 140mm below the fragment impacts. Instead, the uniaxialcompressive tests showed somewhat higher strength than in the reference cylinders (concreteblock that was not exposed to any loading). However, the specimen that was drilled near theglobal crack pattern at the block edges had much less strength. For the specimen drilled from themiddle section, where micro-cracking occurred, the strength was reduced up to one-third of theuniaxial compressive strength of cylinders drilled from the reference block.To verify the results of the compressive test on block three, additional specimens were taken
from drilled cylinders from blocks four and block six. Three specimens were taken out at variousheights, all from the centre of the blocks; the area is marked in Fig. 7, as well as the results fromthese tests. The overall response was very similar to that of block three. Below the spalling zone, ata depth of 140mm below the surface of the fragment impacts, the strength of concrete was slightlyhigher than in test samples taken from a reference block. At the bottom of the blocks, the strengthwas less.
3.3. Uniaxial splitting tensile tests
From the drilled cylinders specimens were sawed out at various heights and smoothed also foruniaxial splitting tensile tests. For these, the orientation when testing is important, as shown in
ARTICLE IN PRESS
0
100
200
300
400
500
Compressive strength [MPa]
Block 3,horizontal
References
Hei
ght [
mm
]0 10 20 30
Fig. 5. Uniaxial compressive tests on cylinders drilled horizontally from concrete block three. Marked circles show
where the cylinders were drilled.
J. Lepp .anen / International Journal of Impact Engineering ] (]]]]) ]]]–]]] 7
Fig. 8: if a specimen is loaded where there are cracks parallel to the loading, the strength isreduced, but if it is loaded perpendicular to the cracks, the strength is hardly affected. The firstconcrete block analysed was number three. In the tests, cylinders that were drilled verticallyshowed very little change in strength, as shown in Fig. 9. This is due to the effect of the crackorientation, as already noted; the main global crack pattern was perpendicular to the direction ofthe drilling.
ARTICLE IN PRESS
a a
a
b
0
100
200
300
400
500
Compressive strength [MPa]
Block 3,horizontal
References
Hei
ght [
mm
]0 10 20 30
Fig. 6. Uniaxial compressive tests for cylinders drilled vertically in concrete block three. The cylinders are drilled from
marked areas. Results at different heights correspond to the centre of gravity for each cylinder. (a) The specimens were
taken out near the edge. (b) A crack was visible in the specimen before the test.
0
100
200
300
400
500
Compressive strength [MPa]
Block 4,vertical
Block 6,vertical
ReferencesHei
ght [
mm
]
0 10 20 30
Fig. 7. Uniaxial compressive tests for vertically drilled cylinders: concrete blocks 4 and 6. The cylinders are drilled from
marked areas.
J. Lepp .anen / International Journal of Impact Engineering ] (]]]]) ]]]–]]]8
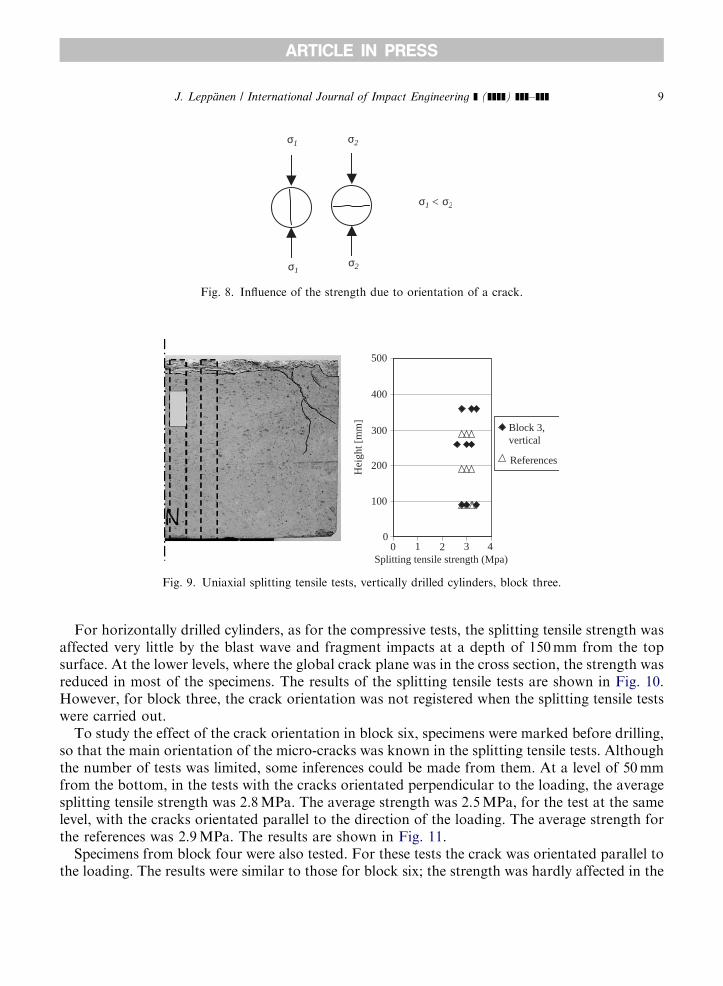
For horizontally drilled cylinders, as for the compressive tests, the splitting tensile strength wasaffected very little by the blast wave and fragment impacts at a depth of 150mm from the topsurface. At the lower levels, where the global crack plane was in the cross section, the strength wasreduced in most of the specimens. The results of the splitting tensile tests are shown in Fig. 10.However, for block three, the crack orientation was not registered when the splitting tensile testswere carried out.To study the effect of the crack orientation in block six, specimens were marked before drilling,
so that the main orientation of the micro-cracks was known in the splitting tensile tests. Althoughthe number of tests was limited, some inferences could be made from them. At a level of 50mmfrom the bottom, in the tests with the cracks orientated perpendicular to the loading, the averagesplitting tensile strength was 2.8MPa. The average strength was 2.5MPa, for the test at the samelevel, with the cracks orientated parallel to the direction of the loading. The average strength forthe references was 2.9MPa. The results are shown in Fig. 11.Specimens from block four were also tested. For these tests the crack was orientated parallel to
the loading. The results were similar to those for block six; the strength was hardly affected in the
ARTICLE IN PRESS
σ1 σ2
σ2
σ2σ1
σ1 <
Fig. 8. Influence of the strength due to orientation of a crack.
0
100
200
300
400
500
Block 3,vertical
References
Hei
ght [
mm
]
0 1 2 3 4Splitting tensile strength (Mpa)
Fig. 9. Uniaxial splitting tensile tests, vertically drilled cylinders, block three.
J. Lepp .anen / International Journal of Impact Engineering ] (]]]]) ]]]–]]] 9
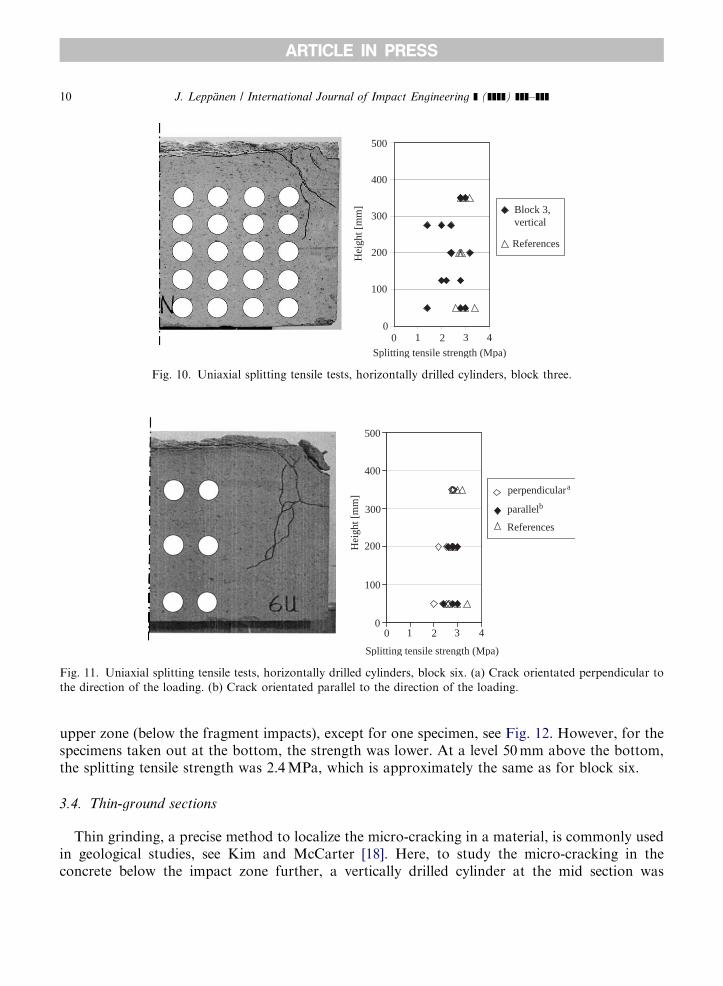
upper zone (below the fragment impacts), except for one specimen, see Fig. 12. However, for thespecimens taken out at the bottom, the strength was lower. At a level 50mm above the bottom,the splitting tensile strength was 2.4MPa, which is approximately the same as for block six.
3.4. Thin-ground sections
Thin grinding, a precise method to localize the micro-cracking in a material, is commonly usedin geological studies, see Kim and McCarter [18]. Here, to study the micro-cracking in theconcrete below the impact zone further, a vertically drilled cylinder at the mid section was
ARTICLE IN PRESS
0
100
200
300
400
500
References
Hei
ght [
mm
]
0 1 2 3 4
Splitting tensile strength (Mpa)
perpendiculara
parallelb
Fig. 11. Uniaxial splitting tensile tests, horizontally drilled cylinders, block six. (a) Crack orientated perpendicular to
the direction of the loading. (b) Crack orientated parallel to the direction of the loading.
0
100
200
300
400
500
Block 3,vertical
References
Hei
ght [
mm
]
0 1 2 3 4
Splitting tensile strength (Mpa)
Fig. 10. Uniaxial splitting tensile tests, horizontally drilled cylinders, block three.
J. Lepp .anen / International Journal of Impact Engineering ] (]]]]) ]]]–]]]10
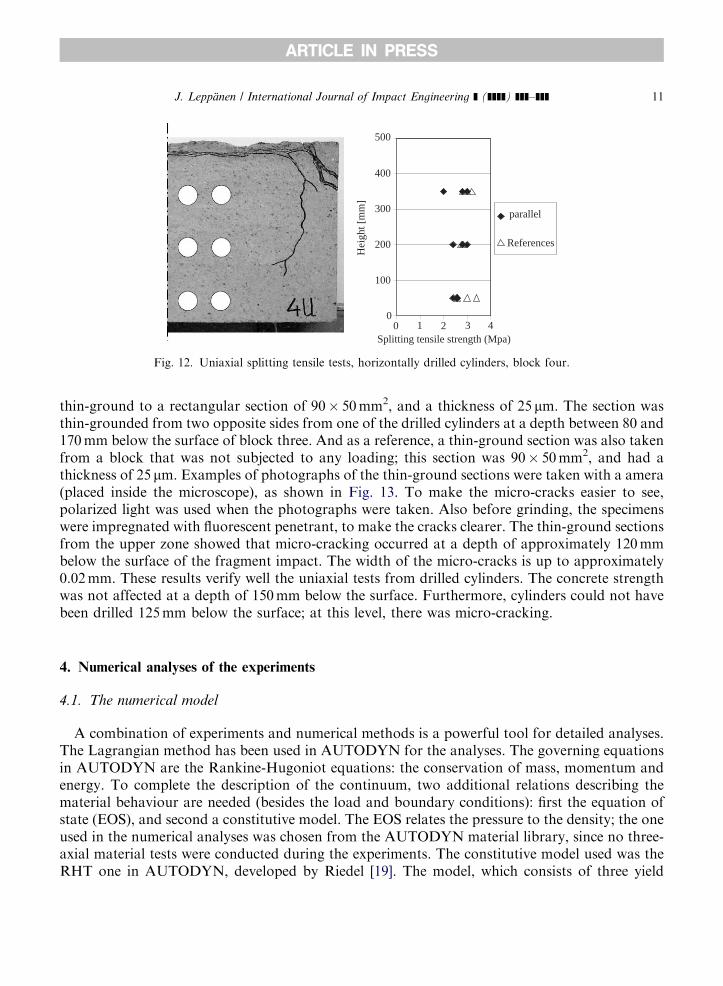
thin-ground to a rectangular section of 90� 50mm2, and a thickness of 25 mm. The section wasthin-grounded from two opposite sides from one of the drilled cylinders at a depth between 80 and170mm below the surface of block three. And as a reference, a thin-ground section was also takenfrom a block that was not subjected to any loading; this section was 90� 50mm2, and had athickness of 25 mm. Examples of photographs of the thin-ground sections were taken with a amera(placed inside the microscope), as shown in Fig. 13. To make the micro-cracks easier to see,polarized light was used when the photographs were taken. Also before grinding, the specimenswere impregnated with fluorescent penetrant, to make the cracks clearer. The thin-ground sectionsfrom the upper zone showed that micro-cracking occurred at a depth of approximately 120mmbelow the surface of the fragment impact. The width of the micro-cracks is up to approximately0.02mm. These results verify well the uniaxial tests from drilled cylinders. The concrete strengthwas not affected at a depth of 150mm below the surface. Furthermore, cylinders could not havebeen drilled 125mm below the surface; at this level, there was micro-cracking.
4. Numerical analyses of the experiments
4.1. The numerical model
A combination of experiments and numerical methods is a powerful tool for detailed analyses.The Lagrangian method has been used in AUTODYN for the analyses. The governing equationsin AUTODYN are the Rankine-Hugoniot equations: the conservation of mass, momentum andenergy. To complete the description of the continuum, two additional relations describing thematerial behaviour are needed (besides the load and boundary conditions): first the equation ofstate (EOS), and second a constitutive model. The EOS relates the pressure to the density; the oneused in the numerical analyses was chosen from the AUTODYN material library, since no three-axial material tests were conducted during the experiments. The constitutive model used was theRHT one in AUTODYN, developed by Riedel [19]. The model, which consists of three yield
ARTICLE IN PRESS
0
100
200
300
400
500
References
Hei
ght [
mm
]
0 1 2 3 4Splitting tensile strength (Mpa)
parallel
Fig. 12. Uniaxial splitting tensile tests, horizontally drilled cylinders, block four.
J. Lepp .anen / International Journal of Impact Engineering ] (]]]]) ]]]–]]] 11

surfaces, as shown in Fig. 14, includes pressure hardening, strain hardening, strain rate hardening,third-invariant dependence for compressive and tensile meridians, and a damage model for strainsoftening. For a detailed description of the material model, see AUTODYN [16] and Riedel [19].
ARTICLE IN PRESS
Residual Strength
Elastic Limit Surface
Failure Surface
Yield strength,Y
Pressure, p
Fig. 14. The RHT constitutive model used for concrete [19].
Fig. 13. Photographs of thin-ground sections at three depths (block 3, and reference). Numbers refer to depth below
the surface.
J. Lepp .anen / International Journal of Impact Engineering ] (]]]]) ]]]–]]]12
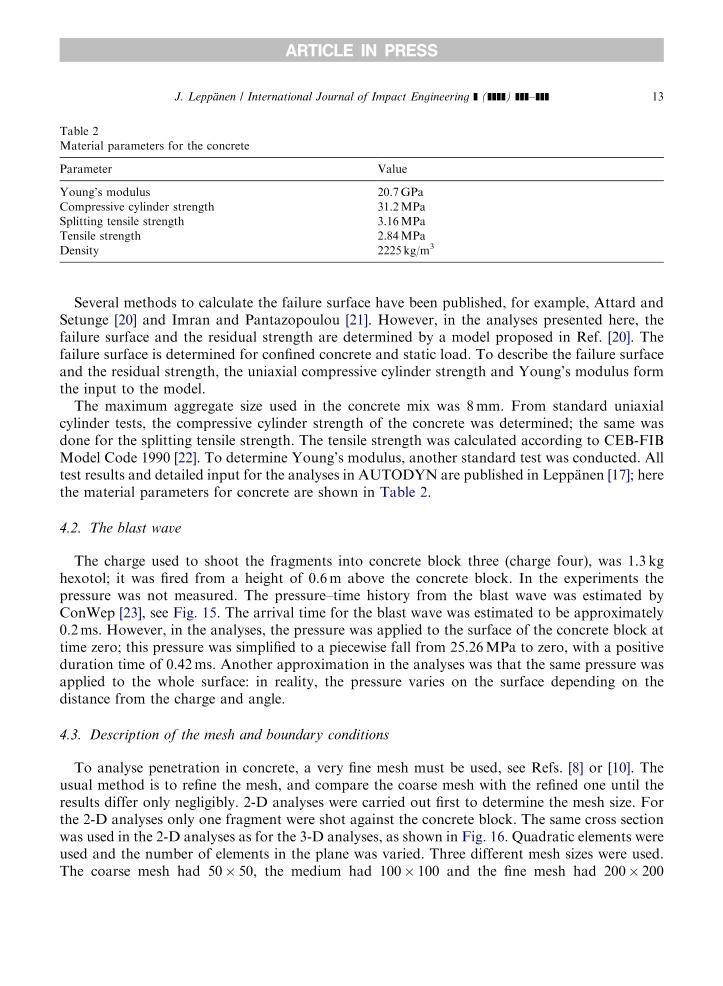
Several methods to calculate the failure surface have been published, for example, Attard andSetunge [20] and Imran and Pantazopoulou [21]. However, in the analyses presented here, thefailure surface and the residual strength are determined by a model proposed in Ref. [20]. Thefailure surface is determined for confined concrete and static load. To describe the failure surfaceand the residual strength, the uniaxial compressive cylinder strength and Young’s modulus formthe input to the model.The maximum aggregate size used in the concrete mix was 8mm. From standard uniaxial
cylinder tests, the compressive cylinder strength of the concrete was determined; the same wasdone for the splitting tensile strength. The tensile strength was calculated according to CEB-FIBModel Code 1990 [22]. To determine Young’s modulus, another standard test was conducted. Alltest results and detailed input for the analyses in AUTODYN are published in Lepp.anen [17]; herethe material parameters for concrete are shown in Table 2.
4.2. The blast wave
The charge used to shoot the fragments into concrete block three (charge four), was 1.3 kghexotol; it was fired from a height of 0.6m above the concrete block. In the experiments thepressure was not measured. The pressure–time history from the blast wave was estimated byConWep [23], see Fig. 15. The arrival time for the blast wave was estimated to be approximately0.2ms. However, in the analyses, the pressure was applied to the surface of the concrete block attime zero; this pressure was simplified to a piecewise fall from 25.26MPa to zero, with a positiveduration time of 0.42ms. Another approximation in the analyses was that the same pressure wasapplied to the whole surface: in reality, the pressure varies on the surface depending on thedistance from the charge and angle.
4.3. Description of the mesh and boundary conditions
To analyse penetration in concrete, a very fine mesh must be used, see Refs. [8] or [10]. Theusual method is to refine the mesh, and compare the coarse mesh with the refined one until theresults differ only negligibly. 2-D analyses were carried out first to determine the mesh size. Forthe 2-D analyses only one fragment were shot against the concrete block. The same cross sectionwas used in the 2-D analyses as for the 3-D analyses, as shown in Fig. 16. Quadratic elements wereused and the number of elements in the plane was varied. Three different mesh sizes were used.The coarse mesh had 50� 50, the medium had 100� 100 and the fine mesh had 200� 200
ARTICLE IN PRESS
Table 2
Material parameters for the concrete
Parameter Value
Young’s modulus 20.7GPa
Compressive cylinder strength 31.2MPa
Splitting tensile strength 3.16MPa
Tensile strength 2.84MPa
Density 2225 kg/m3
J. Lepp .anen / International Journal of Impact Engineering ] (]]]]) ]]]–]]] 13
ARTICLE IN PRESS
0
5000
10000
15000
20000
25000
0.0 0.1 0.2 0.3 0.4 0.5
Time [ms]
Pressure fromConWep [23]
Simplified relationused in the analyses
Pres
sure
[kP
a]
Fig. 15. Pressure–time history from the blast wave; 1.3 kg hexotol.
57 e
lem
ents
Plane view
Cross section
Blast wave
Fragments
100
elem
ents
100 elements
Fig. 16. Numerical mesh. One quarter of the block is modelled.
J. Lepp .anen / International Journal of Impact Engineering ] (]]]]) ]]]–]]]14
elements in the plane. The difference in the spalling between the coarse mesh and the mediummesh was 29% and the difference was 4% between the medium mesh and the fine mesh. Themedium mesh was chosen for the 3-D analyses. The final 3-D mesh that was used in the analyses isshown in Fig. 16. One quarter of a block (with symmetry boundaries) was modelled; it consistedof 100� 100� 57 elements. For the first 100mm below the surface of the fragment impacts, 27fixed size elements were used, and for the 400mm below this zone, 30 elements were used. The sizeof the elements increases, the closer to the bottom they are.The arrival time for the fragments was calculated as 0.36ms (based on an average fragment
velocity of 1650m/s and a height of 0.6m). The blast wave hits the concrete block before thefragments do; the difference between the arrival times is approximately 0.16ms. In the analysesthe blast wave was applied at time zero, and the fragments were placed 0.264m above the concreteblock. This corresponds to a time difference of 0.16ms, when the fragments strike at a velocity of1650m/s. The location of the fragments in the plane were determined from the experiments, seeFig. 2. The analyses were simplified by designating the angle of impact as 90�. Anothersimplification was that all of the fragments arrived simultaneously. Furthermore, in theexperiment the blocks were placed on a concrete floor, and the stress wave can propagate to it.Whereas in the analyses, at the bottom of the concrete block, both free and fixed boundaryconditions in the direction of the loading were used, and in both analyses the energy remains inthe block.
4.4. Results from the numerical analyses
For concrete block three, three types of analyses were carried out. In the first, only the fragmentimpacts were taken into account, while in the second and third, both combined blast wave andfragment impacts were analysed, with free and with fixed boundary conditions. In these analyses,the spalling zone was well simulated. A comparison of experiments and an analysis that takes intoaccount only the fragment impacts, viewed from above, is shown in Fig. 17. The results of all ofthe analyses, first with fragment impacts and then with combined blast wave and fragmentimpacts, were very similar, viewed from above. However, inside the concrete block below thespalling zone, the blast wave was found to cause more damage in the concrete than in analyses
ARTICLE IN PRESS
Fig. 17. Comparison of experiments and a contour damage plot from the numerical analysis, as seen from above.
J. Lepp .anen / International Journal of Impact Engineering ] (]]]]) ]]]–]]] 15
where only the fragment impacts where considered. A comparison of experiments and numericalanalyses of a cross section, where the fragment impacts alone, and then combined blast wave andfragment impacts, both with free and fixed boundary were studied, see Fig. 18.For the analyses with the fragment impacts alone, the damage inside the concrete block was
localized. When the blast wave was also included in the analyses, the damage zone was larger.There was a minor difference in the damage inside the block by using either free or fixedboundary. When the stress wave propagates, caused by the blast wave, it reflects at theboundaries; if the boundary is free, the stress wave reflects as a tensile wave, and in case of fixedboundary, it reflects as a compressive wave. However, when using fixed boundary, the block isrestrained to lift, resulting in tensile stresses at the bottom of the block. Furthermore, when thereflected wave reaches the top surface, energy is consumed to increase the damage that is causedby the fragments that have already struck the surface; this is further discussed in [17]. The damagein the concrete corresponds well with the uniaxial compressive and splitting tensile tests; seeresults in Fig. 10. At a level 150mm below the impact zone, the concrete strength was not affectedby the combined blast wave and fragment impacts. At lower levels, the strength was less in theuniaxial tests. The contour damage plots in Fig. 18 show similar behaviour.
5. Summary and conclusions
Experiments and numerical analyses presented here show that the damage from a blast waveand fragment impacts is localized at the surface of the impact zone. Thin grinding is an accuratemethod of finding micro-cracks, and in the experiments here micro-cracking occurred at a depth
ARTICLE IN PRESS
Fig. 18. Comparison of experiments and contour damage plots from the numerical analyses, cross section. The variable
damage monitors the cracking strain. Damage is defined to be 0.0 for intact cell and 1.0 for fully failed cell.
J. Lepp .anen / International Journal of Impact Engineering ] (]]]]) ]]]–]]]16
of approximately 120mm below the surface struck by the fragments. The concrete strength belowthis zone, however, was not affected at all. At the boundaries the strength was decreased byreflections of the stress wave.The uniaxial compressive tests showed some increase in strength below the spalling zone; this is
probably due to compaction of the concrete. In the numerical analyses, this zone was undamaged.From the splitting tensile tests, it was also found that the strength was not affected below thespalling zone. Furthermore, it was noted that the orientation when testing the drilled cylindersaffected their strength. If a specimen is loaded where the cracks are parallel to the loading, thestrength is decreased. The strength of the test specimens that were loaded perpendicular to thecracks was not affected.In the numerical analyses, the damage in the spalling zone is caused by the fragment impacts.
To capture the response of the concrete material behaviour, both fragment impacts and the blastwave must be taken into account. The results from analyses with combined blast wave andfragment impacts showed greater damage inside the concrete block. This indicates that it ispossible to distinguish between the global load effects and the local damage effects that are causedby the fragment impacts. Consequently, it may be possible for designers to separate the loadsfrom the blast wave and fragment impacts: the structure could be analysed as a pre-damagedstructure with decreased effective depth or width, and the impulse from the fragment impactscould be added to the impulse from the blast wave.
Acknowledgements
The research presented in this paper was financed by the Swedish Rescue Services Agency. Theauthor would like to thank his supervisor, the Head of the Department of Structural Engineeringand Mechanics, Professor Kent Gylltoft, and the reference group members of the project,‘‘Dynamic behaviour of concrete structures subjected to blast and fragment impacts’’: Bj .ornEkengren, M.Sc., from the Swedish Rescue Services Agency, Mario Plos, Ph.D., ChalmersUniversity of Technology, and Morgan Johansson, Ph.D., from Reinertsen AB.
References
[1] Ekengren B. Shelter Regulations, SR—English edition, Swedish Rescue Services Board, Publication B54-168/94,
Karlstad, Sweden; 1994. 94pp.
[2] Fors!en R, Edin K. Vapenverkan mot flerv(anings betongbyggnad III: Best.amning av skador fr(an splitterladdningar
mot husfasad i skala 1:4 (in Swedish). (Weapon effects on multi-storeyed concrete structures III: Determination of
the damage from fragment impacts to fa@ades on a scale of 1:4). FOA report C 20860-2.3, Sundbyberg, Sweden:
Swedish Defence Research Agency; 1991. 140pp.
[3] Fors!en R, Nordstr .om M. Damage to Reinforced Concrete Slabs Due to the Combination of Blast and Fragment
Loading. FOA report B 20101-2.6, Tumba, Sweden: Swedish Defence Research Agency; 1992. 12pp.
[4] Nordstr .om M. Splitterbelastning av betongplattor III: Energiupptagande f .orm(aga hos armerade betongplattor
belastade med olika splittert.atheter (in Swedish). (Fragment impacts on concrete slabs III: Energy-absorbing
ability of reinforced concrete slabs loaded with various fragment impact densities). FOA report 95-000094-
7(6,2.6)—SE, Stockholm, Sweden: Swedish Defence Research Agency; 1995. 101pp.
ARTICLE IN PRESS
J. Lepp .anen / International Journal of Impact Engineering ] (]]]]) ]]]–]]] 17
[5] Clegg RA, Sheridan J, Hayhurst CJ, Francis NJ. The application of SPH techniques in AUTODYN-2D to kinetic
energy penetrator impacts on multi-layered soil and concrete targets. Eighth International Symposium on
Interaction of the Effects of Mutions with Structures, 22–25 April 1997, Virginia, USA.
[6] Johnson GR, Beissel SR. Computed radial stresses in a concrete target penetrated by a steel projectile. Fifth
International Conference on Structures Under Shock and Impact V 1998. p. 793–806.
[7] Johnson GR, Stryk RA, Beissel SR, Holmquist TJ. An algorithm to automatically convert distorted finite elements
into meshless particles during dynamic deformation. Int J Impact Eng 2002;27(10):997–1013.
[8] Lepp.anen J. Dynamic Behaviour of Concrete Structures subjected to Blast, Fragment Impacts. Licentiate Thesis,
Department of Structural Engineering, Concrete Structures, G .oteborg, Sweden: Chalmers University of
Technology; 2002. 71pp.
[9] Scheffler DR, Zukas JA. Practical aspects of numerical simulations of dynamic events: material interfaces. Int J
Impact Eng 2000;24(8):821–42.
[10] Zukas JA, Scheffler DR. Practical aspects of numerical simulations of dynamic events: effects of meshing. Int J
Impact Eng 2000;24(9):925–45.
[11] Johansson M. Structural Behaviour in Concrete Frame Corners of Civil Defence Shelters, Non-linear Finite
Element Analyses and Experiments. DoctoralThesis, Department of Structural Engineering, Concrete Structures,
G .oteborg, Sweden: Chalmers University of Technology; 2000. 204pp.
[12] Krauthammer T. Blast-resistant structural concrete and steel connections. Int J Impact Eng 1999;22(9-10):
887–910.
[13] Krauthammer T, Otani RK. Mesh, gravity and load effects on finite element simulations of blast loaded reinforced
concrete structures. Comput Struct 1997;63(6):1113–20.
[14] (Ag(ardh L, Laine L. 3D FE-simulation of high-velocity fragment perforation of reinforced concrete slabs. Int J
Impact Eng 1999;22(9):911–22.
[15] Papados PP. A reinforced concrete structure under impact: response to high rate loads. Sixth International
Conference on Structures Under Shock and Impact VI 2000. p. 501–510.
[16] AUTODYN Manuals. Version 4.3, Concord, CA, USA: Century Dynamics, Inc. 2003.
[17] Lepp.anen J. Splitterbelastad betong, Experiment och numeriska analyser. Fragment impacts into concrete,
Experiments and numerical analyses. Department of Structural Engineering and Mechanics, Concrete Structures,
report nr. 03:6, G .oteborg, Sweden: Chalmers University of Technology; 2003. 74pp [In Swedish].
[18] Kim DS, McCarter MK. Quantitative assessment of extrinsic damage in rock materials. Rock Mech Rock Eng
1998;31(1):43–62.
[19] Riedel W. Beton unter dynamischen Lasten Meso-und makromechanische Modelle und ihre Parameter. Doctoral
Thesis, der Bundeswehr Munchen, Freiburg, Germany: Institut Kurzzeitdynamik, Ernst-Mach-Institut; 2000 [in
German].
[20] Attard MM, Setunge S. Stress–strain relationship of confined and unconfined concrete. ACI Mater J
1996;93(5):432–42.
[21] Imran I, Pantazopoulou SJ. Plasticity model for concrete under triaxial compression. J Eng Mech-ASCE
2001;127(3):281–90.
[22] CEB-FIB Model Code 1990. Design Code, Lausanne, Switzerland: Thomas Telford; 1993.
[23] ConWep. Collection of conventional weapons effects calculations based on TM 5-855-1, Fundamentals of
Protective Design for Conventional Weapons, Vicksburg, USA: US Army Engineer Waterways Experiment
Station, 1992.
ARTICLE IN PRESS
J. Lepp .anen / International Journal of Impact Engineering ] (]]]]) ]]]–]]]18

Paper IV

J. Leppänen / Submitted to International Journal of Impact Engineering 1
Concrete subjected to projectile and fragment impacts: Modelling of crack softening and strain rate dependency in tension
Joosef Leppänen
Department of Structural Engineering and Mechanics, Concrete Structures,
Chalmers University of Technology, SE-412 96 Göteborg, Sweden
Submitted in September 2004 _____________________________________________________________________
Abstract
This paper deals with modelling of plain concrete in tension. The aim is to improve the accuracy of the numerical analyses for projectile and fragment impacts on concrete. A bi-linear crack softening law and a strain rate dependent law are implemented in the hydrocode AUTODYN. Parametric studies are made, and numerical analyses are compared with experiments conducted and with experiments found in the literature. The depth of penetration is mainly dependent on the compressive strength of the concrete. However, to correctly model spalling, cracking and scabbing in concrete, the tensile strength, fracture energy, and strain rate in tension are very important. It is shown that the accuracy of the results in the numerical analyses of concrete subjected to projectile and fragment impacts was improved, when using a bi-linear softening law and the modified strain rate dependency for tension. Key words: concrete; projectile and fragment impacts; numerical modelling; crack softening; strain rate in tension. _____________________________________________________________________ Fax: +46(0)31-772 2260. E-mail address: [email protected] (J. Leppänen)
J. Leppänen / Submitted to International Journal of Impact Engineering 2
1. Introduction High velocity impact on concrete structures has been a subject of numerical analyses in recent decades. The main focus has been on modelling the compressive behaviour of concrete. However, when a compressive stress wave reflects at free boundaries, tensile stress waves are generated. These tensile stress waves may cause scabbing on the side opposite the impact. Spalling also depends on the tensile behaviour of the concrete. In the literature several papers deal with numerical analyses of projectile penetration into concrete, as in Clegg et al. [1], Johnson et al. [2], and Leppänen [3]. The focus in the material modelling for the past few decades has been to improve the compressive behaviour of concrete. The depth of penetration is mainly determined by the compressive pressure and strain rate dependent response of concrete in compression. Fragment impacts have been studied by Leppänen [4], Rempling [5], Papados [6], and Ågardh [7]. This paper examines both projectile impact and fragment impacts by 2D axisymmetric numerical analyses using the smooth particle hydrodynamics (SPH) technique. The RHT model in AUTODYN is used, and it captures realistically the behaviour of concrete in compression, taking into account the pressure dependency and strain rate effects. In Leppänen [3], it was shown by parametric studies that the strain rate in tension was of great importance when studying spalling of projectile impacts. Rempling [5] showed that the tensile behaviour is also important in simulating scabbing for fragment impacts. In the RHT model, the post-peak response of concrete in tension is modelled by a linear softening law. In the previous work done by Leppänen [3] and Rempling [5], the linear crack softening law was used in the numerical simulations. To get even more accurate results, a bi-linear softening law has been implemented in the hydrocode AUTODYN. Hillerborg [8] introduced a stepwise linear softening law to describe concrete crack softening behaviour. However, a bi-linear softening law proposed by Gylltoft [9] is used in the material model presented in this paper. In CEB-FIB Model Code 90 [10] a formulation for strain rate dependency is given for tension. However, it was shown by Malvar and Ross [11], that the CEB formulation does not fit very well with experimental results. They collected experimental data from the literature and modified this formulation of the strain rate dependency. In the work done here, a stepwise linear strain rate law is also implemented in the material model, by which the user can determine the strain rate dependency. 2. Description of the numerical model
2.1 The RHT model in AUTODYN In the numerical analyses, the RHT model was used, and the software was AUTODYN [12]. The governing equations in AUTODYN are the Rankine-Hugoniot equations: the conservation of mass, momentum and energy. To complete the description of the continuum, two additional relations describing the material behaviour are needed: first the equation of state (EOS), and second a constitutive model. The EOS relates the pressure to the density; the one used in the numerical analyses was chosen from the AUTODYN material library, since no three axial material tests were available. The constitutive model chosen was the RHT one in AUTODYN, developed by Riedel [13]. The model, which consists of three yield surfaces, as shown in Fig. 1, includes pressure hardening, strain hardening and strain rate hardening. Furthermore, the deviatoric section of the surfaces depends on the third invariant.
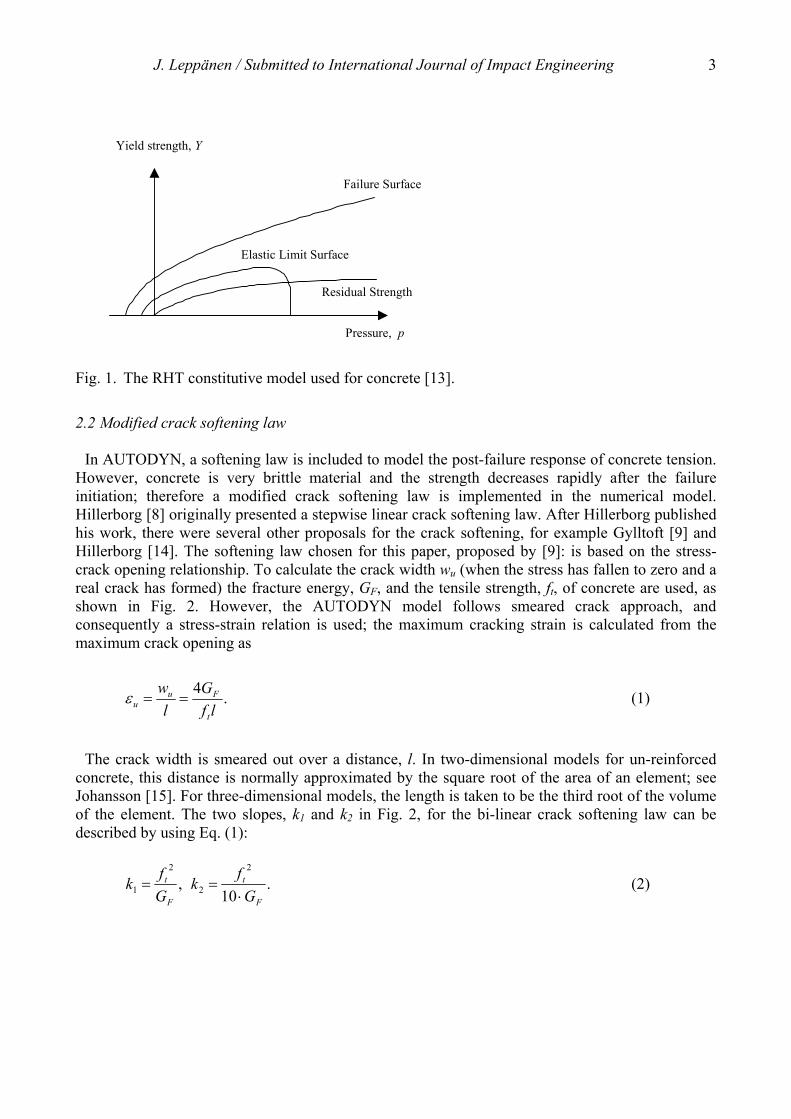
J. Leppänen / Submitted to International Journal of Impact Engineering 3
Residual Strength
Elastic Limit Surface
Failure Surface
Yield strength, Y
Pressure, p
Fig. 1. The RHT constitutive model used for concrete [13].
2.2 Modified crack softening law In AUTODYN, a softening law is included to model the post-failure response of concrete tension. However, concrete is very brittle material and the strength decreases rapidly after the failure initiation; therefore a modified crack softening law is implemented in the numerical model. Hillerborg [8] originally presented a stepwise linear crack softening law. After Hillerborg published his work, there were several other proposals for the crack softening, for example Gylltoft [9] and Hillerborg [14]. The softening law chosen for this paper, proposed by [9]: is based on the stress-crack opening relationship. To calculate the crack width wu (when the stress has fallen to zero and a real crack has formed) the fracture energy, GF, and the tensile strength, ft, of concrete are used, as shown in Fig. 2. However, the AUTODYN model follows smeared crack approach, and consequently a stress-strain relation is used; the maximum cracking strain is calculated from the maximum crack opening as
.4
lfG
lw
t
Fuu ==ε
(1)
The crack width is smeared out over a distance, l. In two-dimensional models for un-reinforced concrete, this distance is normally approximated by the square root of the area of an element; see Johansson [15]. For three-dimensional models, the length is taken to be the third root of the volume of the element. The two slopes, k1 and k2 in Fig. 2, for the bi-linear crack softening law can be described by using Eq. (1):
,
2
1F
t
Gfk =
.
10
2
2F
t
Gfk⋅
=
(2)
J. Leppänen / Submitted to International Journal of Impact Engineering 4
σ σ ft wu = 4GF/ft ε f t/3 GF wu/6 w u w
k1
k2
Fig. 2. Bi-linear uniaxial stress-crack opening relationship; based on Gylltoft [9].
In AUTODYN the bi-linear crack softening law was implemented with subroutines. The predefined slope for linear crack softening was used. The linear softening slope is defined as
.
2
2
F
t
Gfk⋅
=
(3)
When the tensile failure stress has been reached, the slopes, k1 and k2, can be described by using the predefined slope in AUTODYN:
for kk ⋅= 21 uεε
61
≤
(4)
kk ⋅=
102
2
for uεε
61
> (5)
where ε is the cracking strain and ε u is the ultimate cracking strain (when the stress has fallen to zero). 2.3 Modified strain rate law for concrete in tension Concrete is very strain rate sensitive. In the CEB-FIB Model Code [10], there is a relationship for DIF (dynamic increase factor) for tension at varying strain rates. The DIF in the code is a design value, which means the increase in strength is given at a higher strain rate than in the experiments. Results presented [11] show that the sudden increase in DIF for concrete in tension occurs at a strain rate of approximately 1 s-1. Fig. 3 shows a comparison of a proposed model [11] and the code [10]. The model fits to the experimental data, as shown in the figure. The equations are, [11]:
J. Leppänen / Submitted to International Journal of Impact Engineering 5
cts
ct
ff
δ
εε
=
s&
& for &
(6)
11 −≤ sε
3/1
=
scts
ct
ff
εεβ&
& for
(7)
11 −> sε&
where fct is dynamic tensile strength at, ε& fcts is static tensile strength at, sε& fct/ fcts is the DIF (dynamic increase factor), ε& is the strain rate in the range of 10-6 to 160 s-1, sε& = 10-6 s-1 (static strain rate),
log β = 6 δ – 2,
δ = ,81
1
co
co
ff′′
+
= 10 MPa. cof ′ In the RHT model the strain rate law was implemented as stepwise linear by using subroutines in AUTODYN, for which the DIF relationship can be chosen.

J. Leppänen / Submitted to International Journal of Impact Engineering 6
0
1
2
3
4
5
6
7
8
Strain rate [s-1]
CEB 30 MPa Modified CEB 30 MPaCEB 70 MPa Modified CEB 70 MPaCowell 63 MPa Cowell 38 MPaCowell 32 MPa Hatano 23 MPaTakeda/Tachikawa Mellinger/Birkimer 36 MPaBirkimer 47 MPa McVay 35 MPaRoss split tension Ross direct tensionRoss mixes E-J Kormeling et alJohn et al. 53 MPa Antoun 57 MPa
DIF (Dynamic increase factor)
10-6 10-5 10-4 10-3 10-2 10-1 100 101 102 103
Fig. 3. Strain rate dependency for concrete in tension. Comparison of experimental data: the proposed model by [11], and recommendations according to [10]. Based on [11]. 3. Parametric studies Parametric studies were conducted with the modified RHT model to study the effects of the softening slope, the strain rate law, variations of the fracture energy and the tensile strength. The impact of a fragment on a disc-shaped concrete target with a diameter of 1 m and thickness of 140 mm at a velocity of 1 163 m/s was examined. The values are taken from an experiment analysed in Section 4 (example 3), and the material parameters used in the study are from the same example. When using a bi-linear softening slope, there was a minor difference in the damage in comparison with a linear softening slope, as shown in Fig. 4. In the analyses, bi-linear softening slope and the linear softening slope had the same fracture energy; the modified strain rate law was used. The depth of penetration was approximately the same for both analyses. However, due to the more brittle material behaviour in the bi-linear analyses, there was slightly more damage: the diameter of scabbing increased only by 2.0 % and there were more cracks.
J. Leppänen / Submitted to International Journal of Impact Engineering 7
158
mm
155
mm
Fig. 4. Comparison of the effects of two crack-softening slopes. Left: Linear; Right: Bi-linear. To study the effect of the strain rate law that was implemented in the RHT model, a comparison of the proposed model [11] and the code [10] was made. Results in Fig. 5 show that the cracking is reduced, and the diameter of scabbing is reduced by 11 % when using the first model [11]. This is due to the increase in dynamic tensile strength.
158
mm
178
mm
Fig. 5. Comparison of the effects of the strain rate law. Left: CEB-FIB [10]; Right: Malvar and Ross [11].
J. Leppänen / Submitted to International Journal of Impact Engineering 8
To study the effect of the tensile strength three values of the static tensile strength, 0.05, 0.071 and 0.1, of the mean value of the compressive strength were used. The results of the analyses show that the crack width increases when using lower static tensile strength, Fig. 6. Furthermore, for the highest tensile strength, the crack has not fully extended to the side opposite the impact.
fctm = 0.05 fcm fctm = 0.071 fcm fctm = 0.1 fcm
151
mm
158
mm
149
mm
Fig. 6. Comparison of the effects of three static tensile strengths. To find the effect of fracture energy, it was varied between 85 and 205 Nm/m2, as shown in Fig. 7. It was found that the fracture energy has a minor effect on the depth of penetration and spalling. However, by increasing the fracture energy, scabbing and cracking were highly reduced.
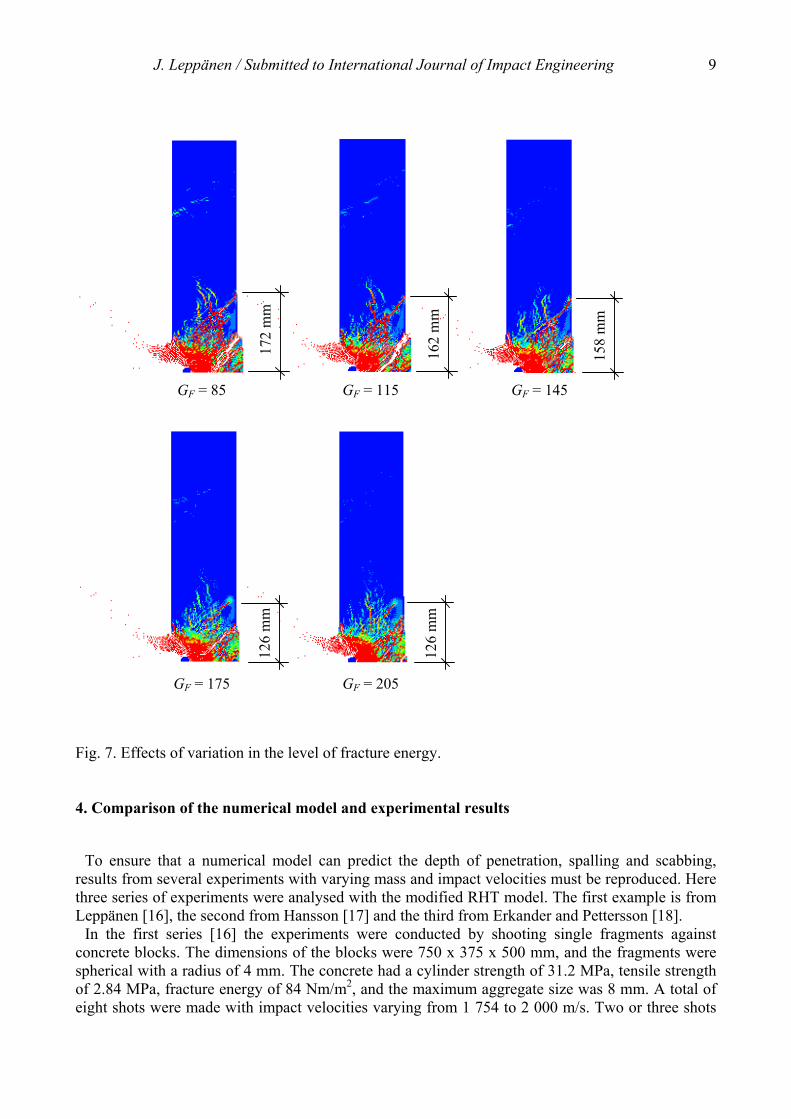
J. Leppänen / Submitted to International Journal of Impact Engineering 9
GF = 85 GF = 115 GF = 145
GF = 175 GF = 205
172
mm
162
mm
158
mm
126
mm
126
mm
Fig. 7. Effects of variation in the level of fracture energy. 4. Comparison of the numerical model and experimental results
To ensure that a numerical model can predict the depth of penetration, spalling and scabbing, results from several experiments with varying mass and impact velocities must be reproduced. Here three series of experiments were analysed with the modified RHT model. The first example is from Leppänen [16], the second from Hansson [17] and the third from Erkander and Pettersson [18]. In the first series [16] the experiments were conducted by shooting single fragments against concrete blocks. The dimensions of the blocks were 750 x 375 x 500 mm, and the fragments were spherical with a radius of 4 mm. The concrete had a cylinder strength of 31.2 MPa, tensile strength of 2.84 MPa, fracture energy of 84 Nm/m2, and the maximum aggregate size was 8 mm. A total of eight shots were made with impact velocities varying from 1 754 to 2 000 m/s. Two or three shots
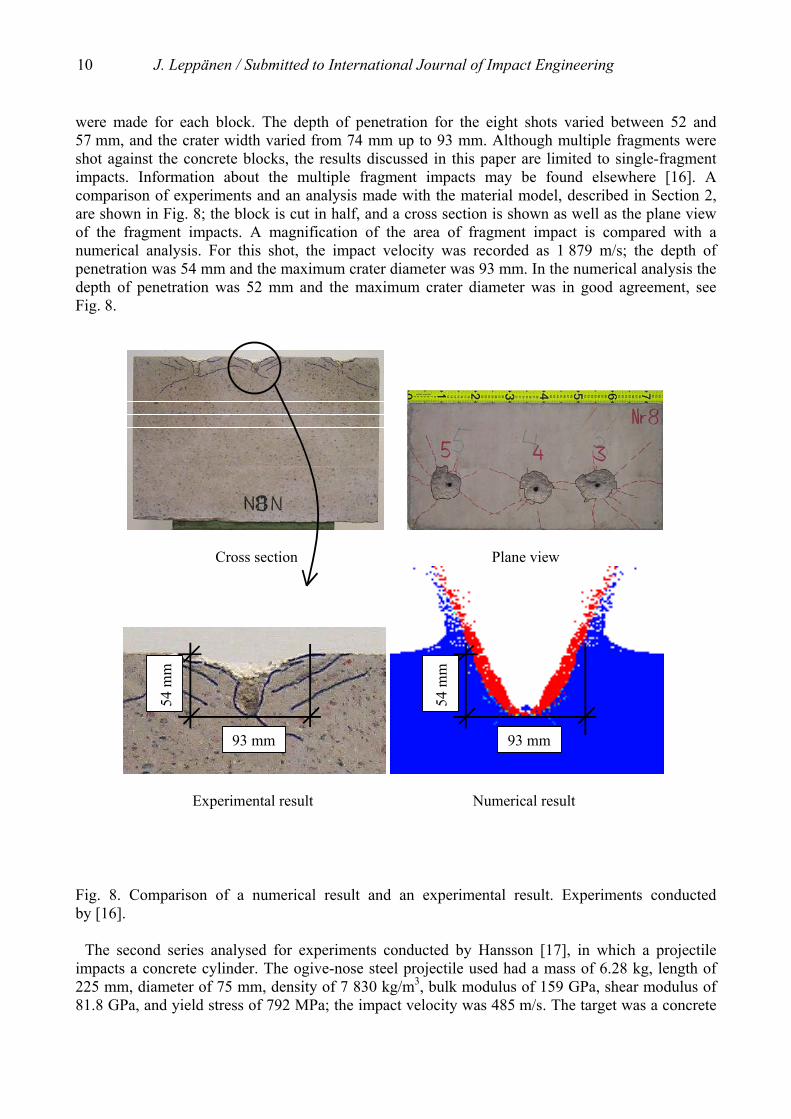
J. Leppänen / Submitted to International Journal of Impact Engineering 10
were made for each block. The depth of penetration for the eight shots varied between 52 and 57 mm, and the crater width varied from 74 mm up to 93 mm. Although multiple fragments were shot against the concrete blocks, the results discussed in this paper are limited to single-fragment impacts. Information about the multiple fragment impacts may be found elsewhere [16]. A comparison of experiments and an analysis made with the material model, described in Section 2, are shown in Fig. 8; the block is cut in half, and a cross section is shown as well as the plane view of the fragment impacts. A magnification of the area of fragment impact is compared with a numerical analysis. For this shot, the impact velocity was recorded as 1 879 m/s; the depth of penetration was 54 mm and the maximum crater diameter was 93 mm. In the numerical analysis the depth of penetration was 52 mm and the maximum crater diameter was in good agreement, see Fig. 8.
Cross section Plane view
Experimental result Numerical result
93 mm
54 m
m
93 mm
54 m
m
Fig. 8. Comparison of a numerical result and an experimental result. Experiments conducted by [16].
The second series analysed for experiments conducted by Hansson [17], in which a projectile impacts a concrete cylinder. The ogive-nose steel projectile used had a mass of 6.28 kg, length of 225 mm, diameter of 75 mm, density of 7 830 kg/m3, bulk modulus of 159 GPa, shear modulus of 81.8 GPa, and yield stress of 792 MPa; the impact velocity was 485 m/s. The target was a concrete
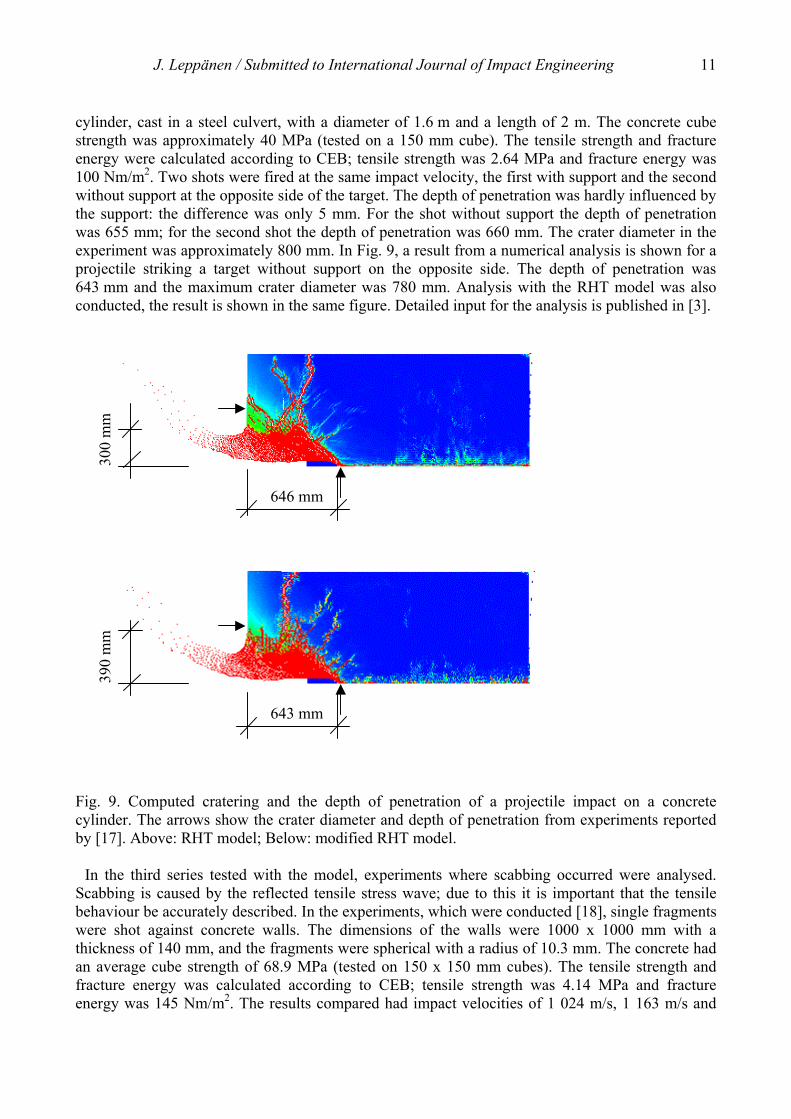
J. Leppänen / Submitted to International Journal of Impact Engineering 11
cylinder, cast in a steel culvert, with a diameter of 1.6 m and a length of 2 m. The concrete cube strength was approximately 40 MPa (tested on a 150 mm cube). The tensile strength and fracture energy were calculated according to CEB; tensile strength was 2.64 MPa and fracture energy was 100 Nm/m2. Two shots were fired at the same impact velocity, the first with support and the second without support at the opposite side of the target. The depth of penetration was hardly influenced by the support: the difference was only 5 mm. For the shot without support the depth of penetration was 655 mm; for the second shot the depth of penetration was 660 mm. The crater diameter in the experiment was approximately 800 mm. In Fig. 9, a result from a numerical analysis is shown for a projectile striking a target without support on the opposite side. The depth of penetration was 643 mm and the maximum crater diameter was 780 mm. Analysis with the RHT model was also conducted, the result is shown in the same figure. Detailed input for the analysis is published in [3].
646 mm
300
mm
643 mm
390
mm
Fig. 9. Computed cratering and the depth of penetration of a projectile impact on a concrete cylinder. The arrows show the crater diameter and depth of penetration from experiments reported by [17]. Above: RHT model; Below: modified RHT model. In the third series tested with the model, experiments where scabbing occurred were analysed. Scabbing is caused by the reflected tensile stress wave; due to this it is important that the tensile behaviour be accurately described. In the experiments, which were conducted [18], single fragments were shot against concrete walls. The dimensions of the walls were 1000 x 1000 mm with a thickness of 140 mm, and the fragments were spherical with a radius of 10.3 mm. The concrete had an average cube strength of 68.9 MPa (tested on 150 x 150 mm cubes). The tensile strength and fracture energy was calculated according to CEB; tensile strength was 4.14 MPa and fracture energy was 145 Nm/m2. The results compared had impact velocities of 1 024 m/s, 1 163 m/s and
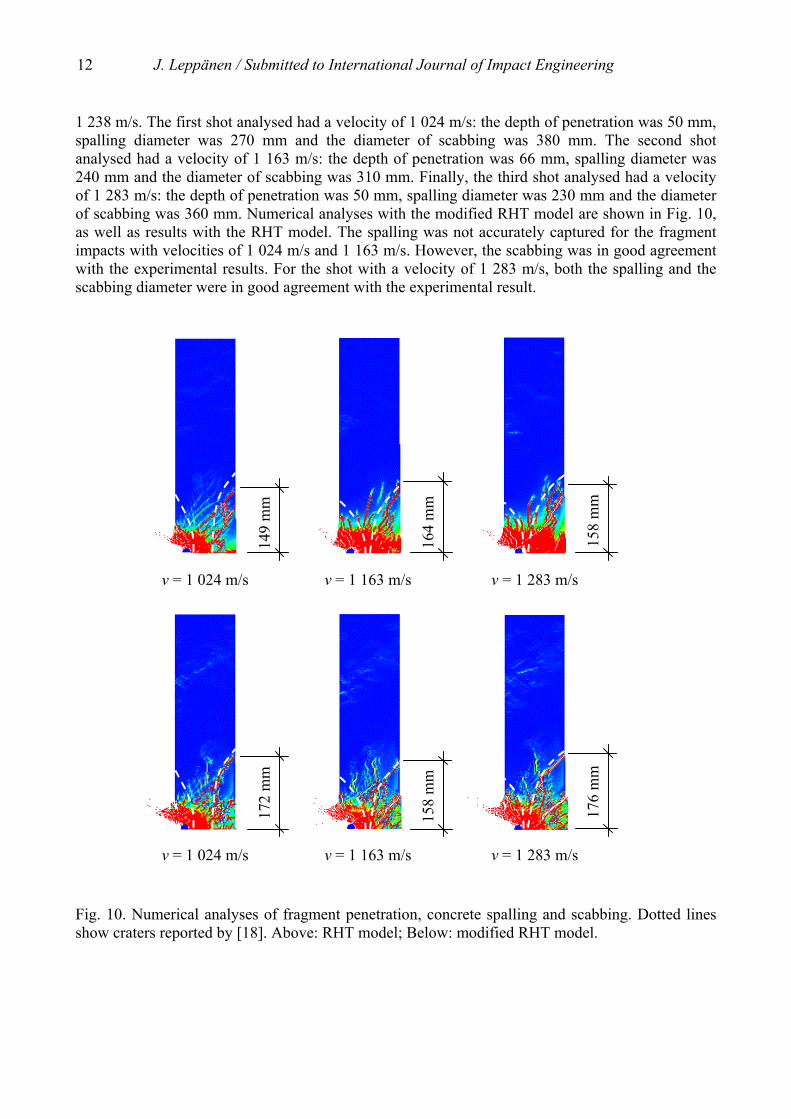
J. Leppänen / Submitted to International Journal of Impact Engineering 12
1 238 m/s. The first shot analysed had a velocity of 1 024 m/s: the depth of penetration was 50 mm, spalling diameter was 270 mm and the diameter of scabbing was 380 mm. The second shot analysed had a velocity of 1 163 m/s: the depth of penetration was 66 mm, spalling diameter was 240 mm and the diameter of scabbing was 310 mm. Finally, the third shot analysed had a velocity of 1 283 m/s: the depth of penetration was 50 mm, spalling diameter was 230 mm and the diameter of scabbing was 360 mm. Numerical analyses with the modified RHT model are shown in Fig. 10, as well as results with the RHT model. The spalling was not accurately captured for the fragment impacts with velocities of 1 024 m/s and 1 163 m/s. However, the scabbing was in good agreement with the experimental results. For the shot with a velocity of 1 283 m/s, both the spalling and the scabbing diameter were in good agreement with the experimental result.
v = 1 024 m/s v = 1 163 m/s v = 1 283 m/s
172
mm
158
mm
176
mm
v = 1 024 m/s v = 1 163 m/s v = 1 283 m/s
149
mm
164
mm
158
mm
Fig. 10. Numerical analyses of fragment penetration, concrete spalling and scabbing. Dotted lines show craters reported by [18]. Above: RHT model; Below: modified RHT model.
J. Leppänen / Submitted to International Journal of Impact Engineering 13
5. Summary and conclusions For projectile and fragment impacts, the depth of penetration is mainly influenced by the pressure and strain rate dependent behaviour of concrete in compression. However, cracking and scabbing are mainly influenced by the tensile strength, fracture energy and the strain rate in tension. For fragment impacts, spalling is caused by the direct impact due to crushing of the concrete. For projectile impacts, the spalling crater size also depends on the strain rate in tension as shown. Parametric studies of fragment impacts were conducted. The crack width and scabbing increase with decreasing static tensile strength. By increasing the fracture energy, the cracking and scabbing were greatly reduced. However, this increase had a minor effect on the depth of penetration and spalling. Using a bi-linear softening law for tension increases the damage and the diameter of scabbing only slightly more than a linear one. Moreover, the scabbing was greatly influenced by the strain rate law. By using a DIF in tension, where the sudden increase in strength occurs at lower strain rates, the scabbing is decreased. The strain rate in tension for concrete depends on the projectile or fragment mass and the impact velocity. Thus, to predict the depth of penetration, spalling and scabbing, a material model that can accurately describe the DIF for tension must be used. To increase the accuracy of numerical analyses for both projectile and fragment impacts, a bi-linear crack softening law and a strain rate law were implemented in the RHT model in the software AUTODYN. It is also shown that the implementation gives results that are in good agreement with experimental results for the spalling, cracking and scabbing of plain concrete subjected to fragment and projectile impacts. Acknowledgements For the research presented in this paper financial support was obtained from the Swedish Rescue Services Agency. The author would like to thank his supervisor, the Head of the Department of Structural Engineering and Mechanics, Professor Kent Gylltoft, and members of the reference group for the project, “Dynamic behaviour of concrete structures subjected to blast and fragment impacts”: Björn Ekengren, M.Sc., at the Swedish Rescue Services Agency, Mario Plos, Ph.D., at Chalmers University of Technology, and Morgan Johansson, Ph.D., at Reinertsen AB. References [1] Clegg RA, Sheridan J, Hayhurst CJ, Francis NJ. The application of SPH techniques in
AUTODYN-2D to kinetic energy penetrator impacts on multi-layered soil and concrete targets. 8th International Symposium on Interaction of the Effects of Munitions with Structures, 22-25 April 1997, VA, USA. 9 pp.
[2] Johnson GR, Stryk RA, Beissel SR, Holmquist TJ. An algorithm to automatically convert distorted finite elements into meshless particles during dynamic deformation. Int J Impact Engng 2002; 27(10): 997-1013.
[3] Leppänen J. Dynamic Behaviour of Concrete Structures subjected to Blast and Fragment Impacts. Licentiate Thesis, Department of Structural Engineering, Concrete Structures, Göteborg, Sweden: Chalmers University of Technology, 2002. 71 pp.
[4] Leppänen J. Experiments and numerical analyses of blast and fragment impacts on concrete. Int J Impact Engng 2004; article in press. 18 pp.
J. Leppänen / Submitted to International Journal of Impact Engineering 14
[5] Rempling R. Concrete wall subjected to fragment impacts: Numerical analyses of perforation and scabbing. Department of Structural Engineering and Mechanics, Concrete Structures, Master´s thesis nr. 04:1, Göteborg, Sweden: Chalmers University of Technology, 2004. 55 pp.
[6] Papados PP. A reinforced concrete structure under impact: Response to high rate loads. 6th International Conference on Structures Under Shock and Impact VI 2000: 501-510.
[7] Ågårdh L, Laine L. 3D FE-simulation of high-velocity fragment perforation of reinforced concrete slabs. Int J Impact Engng 1999; 22(9): 911-922.
[8] Hillerborg A. Analysis of fracture by means of the fictitious crack model, particularly for fibre reinforced concrete. The Int J Cement Composites 1980; 2(4): 177-184.
[9] Gylltoft K. Fracture mechanics models for fatigue in concrete structures. Doctoral Thesis, Division of Structural Engineering, Luleå University of Technology, Luleå, Sweden, 1983. 210 pp.
[10] CEB-FIB Model Code 1990. Design Code, Lausanne, Switzerland: Thomas Telford. 1993. 437 pp.
[11] Malvar LJ, Ross CA. Review of Strain Rate Effects for Concrete in Tension. ACI Materials J 1998; 95(6): 735-739.
[12] AUTODYN Manuals. Version 5, Concord, CA, USA: Century Dynamics, Inc. 2004. [13] Riedel W. Beton unter dynamischen Lasten Meso- und makromechanische Modelle und ihre
Parameter (in German). Doctoral Thesis, der Bundeswehr Munchen, Freiburg, Germany: Institut Kurzzeitdynamik, Ernst-Mach-Institut, 2000. 210 pp.
[14] Hillerborg A. The theoretical basis of a method to determine the fracture energy GF of concrete. RILEM TECHNICAL COMMITTEES 1985; 18(106): 291-296.
[15] Johansson M. Structural Behaviour in Concrete Frame Corners of Civil Defence Shelters, Non-linear Finite Element Analyses and Experiments. Doctoral Thesis, Department of Structural Engineering, Concrete Structures, Göteborg, Sweden: Chalmers University of Technology, 2000. 204 pp.
[16] Leppänen J. Splitterbelastad betong, Experiment och numeriska analyser (In Swedish). Fragment impacts on concrete: Experiments and numerical analyses. Department of Structural Engineering and Mechanics, Concrete Structures, Report nr. 03:6, Göteborg, Sweden: Chalmers University of Technology, 2003. 74 pp.
[17] Hansson H. Numerical simulation of concrete penetration. FOA report 98-00816-311-SE, Defence research establisment, Tumba, Sweden, 1998, 17 pp.
[18] Erkander Å, Pettersson L. Betong som splitterskydd: Skjutförsök på plattor av olika betongmaterial (in Swedish). (Concrete as a protective barrier against fragment impacts: Fragment impacts on plates made of different concretes. FOA report C 20574-D6(D4), Stockholm, Sweden: Swedish Defence Research Agency, 1985. 66 pp.


Licentiate Theses and Doctoral Theses, Concrete Structures,
Chalmers University of Technology, 1990-
90:1 Stig Öberg: Post Tensioned Shear Reinforcement in Rectangular RC Beams. Publication 90:1. Göteborg, April 1990. 603 pp. (No. 1021). Doctoral Thesis.
90:2 Johan Hedin: Långtidsegenskaper hos samverkanskonstruktioner av stål och betong (Long Time Behaviour of Composite Steel Concrete Structures). Publication 90:2. Göteborg, August 1990. 53 pp. (No. 1079). Licentiate Thesis.
92:1 Björn Engström: Ductility of Tie Connections in Precast Structures. Publication 92:1. Göteborg, October 1992. 368 pp. (Nos. 936, 999, 1023, 1052). Doctoral Thesis.
93:1 Mario Plos: Shear Behaviour in Concrete Bridges - Full Scale Shear Test. Fracture Mechanics Analyses and Evaluation of Code Model. Publication 93:1. Göteborg, April 1993. 70 pp. (Nos. 1088, 1084). Licentiate Thesis.
93:2 Marianne Grauers: Composite Columns of Hollow Steel Sections Filled with High Strength Concrete. Publication 93:2. Göteborg, June 1993. 140 pp. (No. 1077). Doctoral Thesis.
93:4 Li An: Load Bearing Capacity and Behaviour of Composite Slabs with Profiled Steel Sheet. Publication 93:4. Göteborg, September 1993. 134 pp. (No. 1075). Doctoral Thesis.
93:5 Magnus Åkesson: Fracture Mechanics Analysis of the Transmission in Zone in Prestressed Hollow Core Slabs. Publication 93:5. Göteborg, November, 1993. 64 pp. (No 1112). Licentiate Thesis.
95:1 Christina Claeson: Behavior of Reinforced High Strength Concrete Columns. Publication 95:1. Göteborg, June 1995. 54 pp. (No. 1105). Licentiate Thesis.
95:2 Karin Lundgren: Slender Precast Systems with Load-Bearing Facades. Publication 95:2. Göteborg, November 1995. 60 pp. (No. 1098). Licentiate Thesis.
95:3 Mario Plos: Application of Fracture Mechanics to Concrete Bridges. Finite Element Analysis and Experiments. Publication 95:3. Göteborg, November 1995. 127 pp. (Nos. 1067, 1084, 1088, 1106). Doctoral Thesis.
96:1 Morgan Johansson: New Reinforcement Detailing in Concrete Frame Corners of Civil Shelters. Non-linear Finite Element Analyses and Experiments. Publication 96:1. Göteborg, November 1996. 77 pp. (No. 1106). Licentiate Thesis.
96:2 Magnus Åkesson: Implementation and Application of Fracture Mechanics Models for Concrete Structures. Publication 96:2. Göteborg, November 1996. 159 pp. (No. 1112). Doctoral Thesis.
97:1 Jonas Magnusson: Bond and Anchorage of Deformed Bars in High-Strength Concrete. Publication 97:1. Göteborg, November 1997. 234 pp. (No. 1113). Licentiate Thesis.
98:1 Christina Claeson: Structural Behavior of Reinforced High-Strength Concrete Columns. Publication 98:1. Göteborg 1998. 92 pp + I-IV, 75 pp. (No. 1105). Doctoral Thesis.
99:1 Karin Lundgren: Three-Dimensional Modelling of Bond in Reinforced Concrete. Theoretical Model, Experiments and Applications. Publication 99:1. Göteborg, November 1999. 129 pp. (No. 37). Doctoral Thesis.
00:1 Jonas Magnusson: Bond and Anchorage of Ribbed Bars in High-Strength Concrete. Publication 00:1. Göteborg, February 2000. 300 pp. (No. 1113). Doctoral Thesis.
00:2 Morgan Johansson: Structural Behaviour in Concrete Frame Corners of Civil Defence Shelters. Publication 00:2. Göteborg, March 2000. 220 pp. (No. 1106). Doctoral Thesis.
00:3 Rikard Gustavsson: Static and Dynamic Finite Element Analyses of Concrete Sleepers. Publication 00:3. Göteborg, March 2000. 58 pp. (No. 41). Licentiate Thesis.
00:4 Mathias Johansson: Structural Behaviour of Circular Steel-Concrete Columns. Non-linear Finite Element Analyses and Experiments. Publication 00:4. Göteborg, March 2000. 64 pp. (No. 48). Licentiate Thesis.
01:3 Gunnar Holmberg: Fatigue of Concrete Piles of High Strength Concrete Exposed to Impact Load. Publication 01:3. Göteborg, August 2001. 69 pp. (No. 55). Licentiate Thesis.
02:1 Peter Harryson: Industrial Bridge Construction – merging developments of process, productivity and products with technical solutions. Publication 02:1. Göteborg, January 2002. 90 pp. (No. 34). Licentiate Thesis.
02:2 Ingemar Löfgren: In-situ concrete building systems – developments for industrial constructions. Publication 02:2. Göteborg, March 2002. 125 pp. (No. 35). Licentiate Thesis.
02:4 Joosef Leppänen: Dynamic Behaviour of Concrete Structures subjected to Blast and Fragment Impacts. Publication 02:4. Göteborg, April 2002. 78 pp. (No. 31). Licentiate Thesis.
02:5 Peter Grassl: Constitutive Modelling of Concrete in Compression. Publication 02:5. Göteborg, May 2002. 95 pp. (No. 37). Licentiate Thesis.
02:6 Rikard Gustavson: Structural Behaviour of Concrete Railway Sleepers. Publication 02:6. Göteborg, September 2002. 180 pp. (No. 32). Doctoral Thesis.
02:8 Mathias Johansson: Composite Action and Confinement Effects in Tubular Steel-Concrete Columns. Publication 02:8. Göteborg, November 2002. 173 pp. (No. 33). Doctoral Thesis.
03:1 Per-Ola Svahn: Impact-Loaded Concrete Piles – Theoretical and experimental study of load effects and capacity. Publication 03:1. Göteborg, May 2002. 99 pp. (No. 38). Licentiate Thesis.
04:3 Peter Grassl: Plasticity and Damage Mechanics for Modeling Concrete Failure. Publication 04:3. Göteborg, September 2004. 159 pp. Doctoral Thesis.