CONCESSION IN REGISTRATION CHARGES...
65
CONCESSION IN REGISTRATION CHARGES INCLUDING STAMP DUTY TO WOMEN PROPERTY BUYERS: A TOOL FOR EMPOWERMENT -A CASE OF GUJARAT Prem Singh Varsha Ganguly Saroj Arora Centre for Rural Studies, NIAR LBS National Academy of Administration Mussoorie -79 Contents List of Tables i List of Figures iv List of Abbreviations Preface Introduction Framework for Women’s Empowerment 1 Scheme of concession in stamp duty/ registration fee: Initiatives by different states in India 4 Concession in stamp duty/ registration fee to women property buyers: steps taken by Gujarat State 8 Objectives of the study 9 Methodology and sample universe 10 Part -I: Household Data Analysis of Women Beneficiaries of the Scheme Section 1: Brief socio demographic profile of Gujarat 13 Section 2: Profile of women respondents 16 Section 3: Awareness about the Scheme 36 Section 4: Details about purchase of the property under the scheme 46 Section 5: Impact of the Scheme on Women’s Empowerment 72 Section 6: Participation in Community and Political Arena 75 Section 7: Retention rate of the property registered
Transcript of CONCESSION IN REGISTRATION CHARGES...
CONCESSION IN REGISTRATION CHARGES INCLUDING STAMP DUTY TO WOMEN PROPERTY
BUYERS: A TOOL FOR EMPOWERMENT -A CASE OF GUJARAT
Prem Singh
Varsha Ganguly Saroj Arora
Centre for Rural Studies, NIAR
LBS National Academy of Administration
Mussoorie -79
Contents
List of Tables i
List of Figures iv
List of Abbreviations
Preface
Introduction
Framework for Women’s Empowerment
1
Scheme of concession in stamp duty/ registration
fee: Initiatives by different states in India
4
Concession in stamp duty/ registration fee to women
property buyers: steps taken by Gujarat State
8
Objectives of the study
9
Methodology and sample universe
10
Part -I: Household Data Analysis of Women
Beneficiaries of the Scheme
Section 1: Brief socio demographic profile of
Gujarat
13
Section 2: Profile of women respondents
16
Section 3: Awareness about the Scheme
36
Section 4: Details about purchase of the property
under the scheme
46
Section 5: Impact of the Scheme on Women’s
Empowerment
72
Section 6: Participation in Community and Political
Arena
75
Section 7: Retention rate of the property registered

on women’s name
87
Section 8: Revenue loss due to the implementation
of the scheme
93
Section 9: Main findings of the household survey of women beneficiaries of the scheme
94
Part II: Control Group Survey Report
Section 1: Profile of control group respondents
101
Section 2: Awareness about waiving off stamp duty
for women property buyers
102
Section 3: Asset ownership
103
Section 4: Respondents perception about property ownership by women
104
Section 5: Participation in socio-political activities
107
Section 6: Findings of the control group
108
Part III: Recommendations
108
References
113
Annexure I
Statement Showing Year –wise No. of Total Documents, Documents in Favour of Women, No. of Women and Remits of Registration Fees
v
Annexure II
Statement Showing of Remits of Registration fees in favours of Women’s Documents
vi
Annexure III
Women Beneficiaries in Gujarat, 2009-2010
vii
Annexure IV Urban localities in Ahmadabad district where household survey was conducted
viii
List of Abbreviations
GoI Government of India
GoG Government of Gujarat
HSA Hindu Succession Act
JNNURM Jawaharlal Nehru National Urban Renewal Mission
MDG Millennium Development Goals
ULB Urban Local Body
Preface
Inequality between men and women is probably the most disturbing aspect of many of the modern societies. Though, the gender inequality is a global phenomenon yet, it is more prominent in developing countries. The gender based discrimination in the accessibility and ownership of resources including productive resources was considered to be embedded in the social, legal, economic and political structures which further perpetuate inequalities in other spheres. It was argued that gender based discriminatory practices can be removed only by enabling women to gain equal access to and control over these resources. In practice, few women own productive resources, even fewer effectively control it. One of the significant reasons for this was found gender unequal laws/ policies and also the prevailing socio-cultural value system. This situation has drawn attention for changes in the policy framework at various levels. As a result, various corrective measures were introduced at different point of time.
In this regard, almost Government’s proposal to “incentivize” ownership of property by women is a bid to empower women in the hope that better economic status would make them less vulnerable to exploitation. Since the need for giving incentives to encourage property purchases by women was felt necessary therefore, some states have initiated in providing a lower registration charges for females, as compared to male property buyers. The Government of Gujarat has also revised and reduced stamp duty for women on 11th June 2004.
The basic purpose of the present study titled “Concession in Registration Charges including Stamp Duty to Women Property Buyers: a tool for Empowerment: a Case of Gujarat” is to study the impact of the scheme in empowering women. This report contains two parts. Part -I has 9 sections. It deals with the profile of the women beneficiaries, their
awareness about the scheme, asset holding and details about the property purchased, impact of the asset ownership in women’s empowerment, retention rate of the property registered on women’s name and the revenue loss due to the implementation of the scheme. 1000 women beneficiaries of the scheme were interviewed in three districts of Gujarat viz. Ahmedabad, Rajkot and Surat. Part –II deals with the control group respondents. It contains six sections. Control group respondents did not own property on their name. Women’s conditions in two different situations were compared. At the end, it highlights the main findings and lastly comes out with the recommendations.
The study has been conducted on behest of the Union Ministry of Women and Child Development, GoI. We are thankful to the Ministry for providing financial support for this study. We are confident that the study report will prove useful for the policy makers, administrators, development practitioners and others interested in this area.
July, 2013
Prem Singh
Saroj Arora
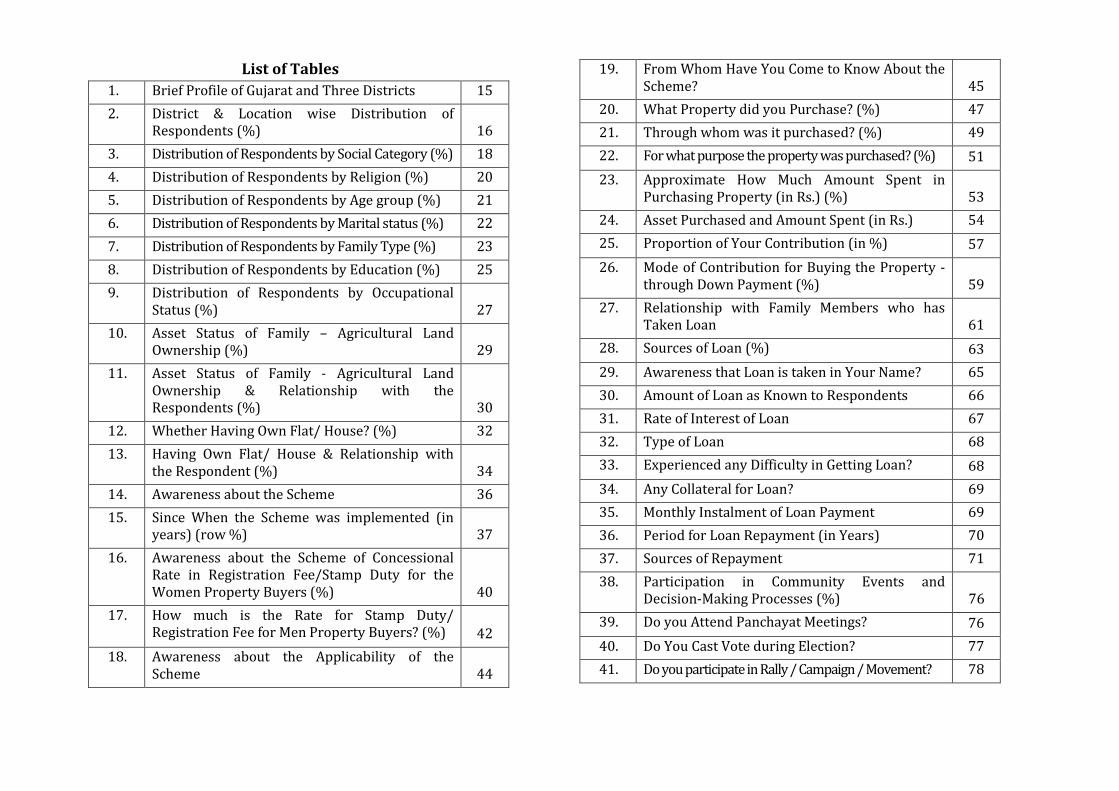
List of Tables
1. Brief Profile of Gujarat and Three Districts 15
2. District & Location wise Distribution of Respondents (%) 16
3. Distribution of Respondents by Social Category (%) 18
4. Distribution of Respondents by Religion (%) 20
5. Distribution of Respondents by Age group (%) 21
6. Distribution of Respondents by Marital status (%) 22
7. Distribution of Respondents by Family Type (%) 23
8. Distribution of Respondents by Education (%) 25
9. Distribution of Respondents by Occupational Status (%) 27
10. Asset Status of Family – Agricultural Land Ownership (%) 29
11. Asset Status of Family - Agricultural Land Ownership & Relationship with the Respondents (%) 30
12. Whether Having Own Flat/ House? (%) 32
13. Having Own Flat/ House & Relationship with the Respondent (%) 34
14. Awareness about the Scheme 36
15. Since When the Scheme was implemented (in years) (row %) 37
16. Awareness about the Scheme of Concessional Rate in Registration Fee/Stamp Duty for the Women Property Buyers (%) 40
17. How much is the Rate for Stamp Duty/ Registration Fee for Men Property Buyers? (%) 42
18. Awareness about the Applicability of the Scheme 44
19. From Whom Have You Come to Know About the Scheme? 45
20. What Property did you Purchase? (%) 47
21. Through whom was it purchased? (%) 49
22. For what purpose the property was purchased? (%) 51
23. Approximate How Much Amount Spent in Purchasing Property (in Rs.) (%) 53
24. Asset Purchased and Amount Spent (in Rs.) 54
25. Proportion of Your Contribution (in %) 57
26. Mode of Contribution for Buying the Property -through Down Payment (%) 59
27. Relationship with Family Members who has Taken Loan 61
28. Sources of Loan (%) 63
29. Awareness that Loan is taken in Your Name? 65
30. Amount of Loan as Known to Respondents 66
31. Rate of Interest of Loan 67
32. Type of Loan 68
33. Experienced any Difficulty in Getting Loan? 68
34. Any Collateral for Loan? 69
35. Monthly Instalment of Loan Payment 69
36. Period for Loan Repayment (in Years) 70
37. Sources of Repayment 71
38. Participation in Community Events and Decision-Making Processes (%) 776
39. Do you Attend Panchayat Meetings? 76
40. Do You Cast Vote during Election? 77
41. Do you participate in Rally / Campaign / Movement? 78
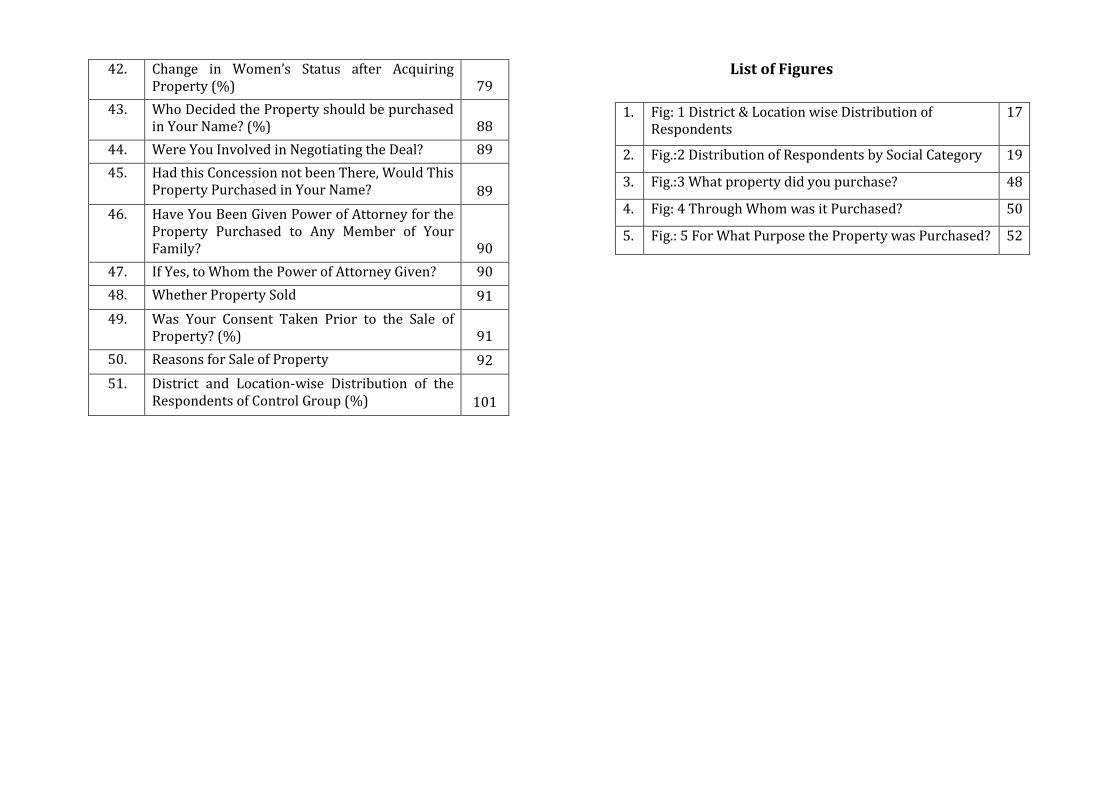
42. Change in Women’s Status after Acquiring Property (%) 79
43. Who Decided the Property should be purchased in Your Name? (%) 88
44. Were You Involved in Negotiating the Deal? 89
45. Had this Concession not been There, Would This Property Purchased in Your Name? 89
46. Have You Been Given Power of Attorney for the Property Purchased to Any Member of Your Family? 90
47. If Yes, to Whom the Power of Attorney Given? 90
48. Whether Property Sold 91
49. Was Your Consent Taken Prior to the Sale of Property? (%) 91
50. Reasons for Sale of Property 92
51. District and Location-wise Distribution of the Respondents of Control Group (%) 101
List of Figures
1. Fig: 1 District & Location wise Distribution of Respondents
17
2. Fig.:2 Distribution of Respondents by Social Category 19
3. Fig.:3 What property did you purchase? 48
4. Fig: 4 Through Whom was it Purchased? 50
5. Fig.: 5 For What Purpose the Property was Purchased? 52
1 2
Introduction
There are five leaves of the women’s empowerment framework, namely welfare, access, conscientistion, mobilization and control. In the present research study, the term empowerment has been considered from the view point of enabling women to gain access to and control over resources. More specifically, on three aspects:
1. To help identify the ‘missing governance links’ in the policy design and to help policy makers account for these ‘missing links’ in the assessment of various programmes;
2. To highlight the need for and suggest ‘empowerment checks’ on voice and accountability channels which need to be in place to redress unequal power relations and sustain pro-poor development outcomes;
3. To assist country-led development of pro-poor and gender sensitive indicators by policy-makers and beneficiaries about aspects of policy which are most crucial to monitor pro-poor and gender sensitive service delivery.1
Gender discrimination cannot be automatically corrected in the course of development. Some deliberate policy steps are critical to achieve gender equality. The institutions of economics, politics, sociology and the law must be considered in terms of how they relate to each other and how they play out across the different areas where gender discrimination occurs; and gender assessments have to be undertaken continuously to reveal gaps and monitor progress towards
1 Laberge, Marie. 2008. Claiming the MDGs: An Empowerment Framework (draft), UNDP Oslo Governance Centre, pg 2-5.
gender equality. Empowerment of women is essentially the vehicle of change to achieve gender equality that is meaningful and sustainable.
Empowerment of women is a socio-political ideal, encompassing notions of dignity and equality, envisioned in relation to the wider framework of women’s rights. It is a process of gaining control over self, resources and existing societal perceptions and attitudes and would be achieved only when an improvement in the ‘condition’ of women is accompanied by an advancement in their ‘position’ by enlarging the economic, social and political freedoms and choices available to them.
The National Policy for the Empowerment of Women, 2001 views empowerment as an enabling process that must lead to their economic as well as social transformation. Government has sought to operationalise this approach through legislative and programmatic interventions as well as by mainstreaming gender into the development planning process. Numerous such initiatives were taken during the Eleventh Five Year Plan period (2007-2012). Focussed efforts through development programmes, both multi sectoral as well as targeted, along with governance reforms were focussed. However, women, especially the vulnerable and marginalized, would need to be provided a level playing field to access social, economic and legal entitlements as a right.2 Besides At the international level, India is a signatory to the UN Convention on the Elimination of All Forms of Discrimination against Women (CEDAW). With that, it has reasserted its commitment to remove discrimination
2 XIIth Five Year Plan, 2011. ‘Report of the Working Group on Women’s Agency and Empowerment’, Government of India: Ministry of Women and Child Development, pg. 2-8.

3 4
against women in all forms, including the legal framework, by suitably modifying gender biased laws.
The Government of India realizing this fact that there has been gender discrimination in various spheres of life, and shifted its approach from ‘welfare to ‘development’ of women during the Sixth Five Year Plan (1982-1987). In this development approach, women for the first time were recognized as an economic actor and emphasis was made to make them economically empowered. The gender based discrimination in the accessibility and ownership of resources including productive resources was considered to be embedded in the social, legal, economic and political structures which further perpetuate inequalities in other spheres. It was argued that gender based discriminatory practices can be removed only by enabling women to gain equal access to and control over these resources and by transforming institutions and structure through which the ideology and practice of subordination are reinforced. In practice, few women own productive resources, even fewer effectively control it. One of the significant reasons for this was found gender unequal laws/ policies and also the prevailing socio-cultural value system.
This situation has drawn attention for changes in the policy framework at various levels. As a result various corrective measures were introduced. For instance, for the first time, the Ninth Five Year (1997-2002) Document included a section on ‘Gender and Land Rights’ and emphasized the need for land ownership by women. It was realized that the improved access to land was a key element of the anti-poverty strategy. Thereafter, the agenda of Ministry of Rural Development for land reforms in the Ninth Five Year Plan included the provision of adequate legal mechanisms for protecting the rights of women on land. This approach was also in consonance with the national policy of ensuring empowerment of women inter alia through
improved access, control and /or ownership of family/ community assets. Subsequently, during the Tenth Five Year Plan (2002-07) the Hindu Succession Act (1956) was amended in 20053.
In order to reduce the gender discrimination in ownership of property, some States have introduced a scheme in which women have been given incentive either by giving concession or exemption in registration charges/ registration duty, if the property was purchased by them.
At the insistence of Central Government, another important programme was introduced namely Indira Awas Yojana. In this programme, all dwelling units were registered in joint ownership of husband and wife, where the wife’s name figures first. Specific provisions were also made for single women such as deserted, separated, widow and unmarried.
Scheme of concession in stamp duty/registration fee: Initiatives by different states
Land being in a concurrent list, as a state subject, conveyance charges for transfer of property varies from state to state. It has been revised by many states in the country, more so in last decade, as there is a change in land-use pattern, need for land has increased so the prices of land has increased multi-fold. In this situation, a few changes on governance issues have been addressed from gender perspective.
Government’s proposal to “incentivize” ownership of property by women is a bid to empower women in the hope that better status would make them less vulnerable to exploitation4. Since the need for
3 HSA is applicable to Hindus, Sikhs, Jains and Budhitsts. 4 Ibid.
5 6
giving incentives to encourage property purchases by women was felt necessary therefore, some states are providing a lower registration charges for women’s, as compared to men property buyers.
The Jawaharlal Nehru National Urban Renewal Mission (JNNURM) inter alia aims at an efficient real estate market where transactions, that is, sale and purchase of properties, can take place smoothly, without any barriers, and in a transparent manner. One of the many barriers to the efficient functioning of the real estate market has been, and continues to be, the high rates of stamp duty on conveyance transactions. Although a few states have taken steps to bring down the stamp duty rates, in several states, the rates are in excess of 10 per cent, deterring individuals, businesses and industry from registering properties at actual, or market values. The JNNURM requires the rates of stamp duty to be brought down to 5 per cent or less, within the Mission period. It expects that a reduction in the rate will help develop a healthy real estate market, provide fillip (to the growth of the economy, and reduce the size of the black money. It also expects that reduction in stamp duty rates will lead to an increase in revenues both for the states as well as the Urban Local Bodies (ULBs).5
Stamp duties, it must be pointed out, are an important source of revenues for the state governments. The total revenues from stamp duty (and registration) were of the order of Rs. 30,903 crore or about 1.2 per cent of the total tax revenues of state governments during 2006/07. In Gujarat, the collection from stamp duty in 2004-2005 was Rs. 964.00 crores.
5 “Rationalization of Stamp Duty: State Level Reform”, JNNURM primer, 2005 website: http://www.indiaurbanportal.in/reforms/optional/Primer10.PPP.pdf accessed on 7th may 2013
In states such as Bihar, Gujarat, Kerala, Punjab and West Bengal, stamp duty/ registration fees are the second most important source of revenue, next to VAT/sales tax, and in others, the third most important revenue source. In JNNURM, it follows that any reduction in stamp duty rates that is undertaken as a part of the JNNURM should not result in revenue loss to the states or the ULBs. It is, therefore, important that reduction in stamp duty rates is carried out with adequate preparation and in a systematic manner, as mentioned below:
The expected outcomes of revision of stamp duty mentioned in the primer are:
(i) An environment that will have a broad-based development of the real estate market, with enhanced flows of Foreign Direct Investment and Non Resident Indians investment;
(ii) Purchase and sale of properties to become convenient for traders, developers and the common man, resulting in an increase in the volume of transactions and economic activities;
(iii) Legal and administrative remedies proposed along with rationalization of rate of duty to result not only in checking evasion and avoidance of duty but also in enhancing revenue from other taxes like property tax and wealth tax; and
(iv) The temporary loss in revenue from stamp duties, if it occurs, to be compensated by better valuation, checking of non-registration of property transfers, and increase in the volume of registered documents.”
Thus with that many states initiated revision of stamp duty and registration fee for transfer of the property. States such as Delhi, Gujarat, Haryana, Madhya Pradesh, Punjab and Uttar Pradesh have put

7 8
in place the policy of differential registration charges (including stamp duty) for the men and women. However, the states can be classified into three categories. One, states which have introduced and implemented the scheme; two, states which have implemented the scheme but later on, amended or withdrawn and the third category includes States/Union Territories which have not introduced this scheme at all.
The first categories of states that have reduced stamp duty or have exempted women property buyers, like Assam, Punjab, Rajasthan, Uttar Pradesh and Uttarakhand. In 2002 (during Tenth Five Year Plan), Delhi cut stamp duty rates from 13 per cent to 8 per cent for men registering property and brought it down to 6 per cent for women owners and 7 per cent for joint ownership. At present, in Delhi the stamp duty on registration of property for women was 4 per cent against 6 per cent for men. Similarly Haryana has reduced stamp duty on registration charges for women to 6 per cent, while it was 8 per cent for men for registration of land or property.
The second categories of states have been those which had introduced the scheme but later on withdrawn. For example, in case of Madhya Pradesh stamp duty on transaction of immovable property was 6 per cent if the vendor was a woman and 8 per cent if the vendor was a man. Later on, Madhya Pradesh Government has amended the scheme and restricted the benefit only for men and women of economically weaker section. Similarly, state like Andhra Pradesh has introduced the scheme but later on, withdrawn it. Although it would be interesting to study factors responsible for such drastic decision.
The third category of States/ UTs includes which have not introduced the scheme. For instance, none of the southern states viz. Andhra Pradesh, Karnataka, Kerala, Tamil Nadu and Maharashtra has
introduced this scheme. Besides eastern states like Bihar, Tripura and West Bengal and union territories like Daman & Diu and Andman & Nicobar have also no such provision for women property buyers.
It is felt that reduced registration charges including stamp duty on registration of property makes a considerable loss in the revenue collection of state. State governments may not be happy with the proposal of exemption in registration charges.
As mentioned in the expected outcomes of ‘The mandatory primer for JNNURM – Rationalization of Stamp Duty’, the differential rate in stamp duty was suggested to implement in the states. The proposal with special provisions for women was based on the basic premise that this would reduce gender inequality and enable in their economic empowerment. Thereafter, various states have made special efforts in this direction and introduced the scheme for women.
Concession in stamp duty and registration fees to women property buyers: steps taken by Gujarat state
Gujarat with many other states has taken initiative to revise stamp duty and registration fee while considering existing gender inequalities and a step forward for women’s empowerment as one of the concerns. As per the provision of Section 9 of Bombay Stamp Act 1958, the basic rate of stamp duty was 6 per cent, additional duty 2.4 per cent; registration fee 1.5 per cent, thus total was 9.9 per cent. The Government of Gujarat revised and reduced stamp duty on 11th June 2004. Land transaction in Gujarat takes place mainly through three ways viz. sale deed, gift and deed of release. However, the most prevalent form of transaction is through sale deed. Earlier only one woman was entitled to take benefit of the scheme. Later on, changes took place and more than one woman was allowed to take the benefit of the scheme. However, concession is given only on one registry
9 10
document. The stamp duty is calculated based on Jantri (valuation zone plan) published by Superintendent of Stamp duty. The Jantri is prepared based on prevailing market value.
Computerisation of property registration has been completed in all the 7 municipal corporation of the State (Ahmedabad, Surat, Vadodara, Rajkot, Jamnagar, Bhavnagar and Gandhinagar) but not linked with parallel Department6.
The policy decision for concession in stamp duty and registration fee for women property buyers considers women’s empowerment as one of the implicit impacts. In this context, the objectives of the study are:
Objectives
1. To assess the incremental increase in women’s ownership of land and property after the introduction of concession/exemption in registration charges including stamp duty;
2. To assess and analyze the impact of the scheme of concession in stamp duty/ registration fee resulting women’s empowerment;
3. To study the retention rate of property purchased on women’s name; and
4. Estimate the loss of revenue to the state exchequer due to implementation of the scheme.
Of these objectives, first and fourth are macro level enquiries while the second and third are micro level enquiries, which were fulfilled through primary data (household survey) from Gujarat state.
6 Details provided under ‘Checklist of reforms: Rationalization of stamp duty’, Government of Gujarat, 2006
Methodology
Initially, district–wise list of addresses of women beneficiaries was collected from the office of Inspector General of Registration (IGR). Based on random sampling, the beneficiaries representing different social cultural groups and regions were selected as respondents for the study, mainly from three districts – Ahmadabad from the Central Gujarat; Surat from South Gujarat and Rajkot from Saurashtra region. Thus, Gujarat was divided into three regions and one district from each zone was taken. The ratio of the areas, that is, urban and rural was planned approximately to 90:10 for primary data collection through household survey.
In Gujarat, the data collection was primarily carried out by a state level network, Working Group on Women and Land Ownership (WGWLO). As planned, total 1,000 households – the women beneficiaries of the scheme were interviewed through a structured interview schedule. As planned, 25 non beneficiary women were also interviewed through an interview schedule, as a unit of observation. The 25 women respondents were part of the control group. Besides data collection through interview schedule, quasi-observation method was also one of the important tools used during household survey. The household survey was conducted during later half of 2012.
The interview schedule was pre-tested on five women property buyers who availed the benefit of the scheme in different districts in Gujarat and accordingly interview schedule was modified. The interview schedule includes mainly the basic profile of women beneficiaries of the scheme, socio-economic status of the households, awareness about the scheme of concession in stamp duty/ registration fee, decision making process in purchasing property on women’s name, women’s own perception about the changes taken place in their

11 12
condition after owning property on their name, if any, the retention rate of the property purchased and revenue loss due to concession given to women property buyers. This is to mention that conducting household survey on an issue related to property was not an easy task. During household survey, various problems were faced by the field investigators. For instance, women respondents were reluctant to share information related to property. It was only after much persuasion about the purpose of the study, they got ready to respond. Also instances, of selling properties were also heard particularly in the posh/ high income group localities particularly, in New Ahmedabad area located on the other side of Sabarmati River.
After data collection, the data entry was completed using Statistical Package for the Social Sciences (SPSS) software and thereafter tables were generated for descriptive analysis. The report has been divided into three parts. Part-I deals with women beneficiaries of the Scheme; Part-II deals with the analysis of non- beneficiaries women of control group.
Part -I
Household data analysis: Scheme of concession in stamp duty/ registration fee to women property buyers in Gujarat
The household survey report has nine sections:
(i) The first and second section of the report presents profile of the respondents, that is, details about their place of residence (urban/rural), type and size of the family, social category they belong to, religion, education, marital status, occupation and asset holding including the property for which the benefit has been availed;
(ii) The third section of the report focuses on the awareness about the scheme of the state government regarding waiving off stamp duty – level of awareness, source of information about the scheme and other scheme related issues:
The fourth section explores details about the purchase of the property under the Scheme. It includes various dimensions of the property such as types of assets purchased, decision-making regarding purchase of property, financial contribution in purchasing property, sources of finance, seeking financial support and terms of repayment in case, loan was taken for purchase of the property;
(iii) The fifth section examines impact of the Scheme on women’s empowerment. It attempts to see whether ownership of property on women’s name lead to their empowerment particularly on their socio and economic aspects. These have been assessed through their participation in various activities and associations, their decision making in intra and inter household sphere. These responses were on scale of ‘strongly agree’ to ‘strongly disagree’;
(iv) The sixth section focuses on participation in community and political arena;
(v) The seventh section covers retention rate of the property purchased on women’s name; and
(vi) The eighth section highlights the revenue loss due to implementation of the scheme of waiving off in stamps duty/ registration fee to women property buyers;
(vii) Section nine is on the main findings of the household study.
13 14
Section 1: A brief socio –demographic profile of Gujarat
The Gujarat specific demographic characteristics are given in the following paras. Besides, it has also been explained in running text, along with the issue, based on Census data or socio-cultural traits, for example, large number of house-maker women, prevalence of higher number of joint families compared to nuclear families, etc. Similarly the category of ‘others’ are described as running text. The per cent are presented in bracket in each table and the total is mentioned with row and column per cent in order to portray comprehensive picture on the given issue.
Total population of Gujarat was 6.03,83,628 out of which 52.14 per cent were male and 47.87 per cent were female. Literacy rate was 91.83 per cent; male literacy rate was 87.23 per cent and female literacy rate was 70.73 per cent. Sex ratio was 920 in 2001 which has further declined to 918 in 2011. Demographic profile of three districts namely Ahmedabad, Surat and Rajkot is as follow: total population in Ahmedabad was 72,08,200 out of which male population was 52.54 per cent female population was 47.46 per cent. Literacy rate was 72,08,200 male literacy rate was 90.74 per cent and female literacy rate was 79.35 per cent. Sex ratio in Ahmadabad district was 892 in 2001 which improved in 2011 and went up to 903 in 2011. Total population in Surat district was 60,79,231. Out of which male population was 55.92 per cent and female population was 44.08 per cent. Literacy rate was 86.65 per cent. Male literacy rate was 91.05 per cent and female literacy rate was 81.02 per cent. Sex ratio was 810 in 2001 which has further declined to 788 in 2011. Total population of Rajkot district was 37,99,770 out of which male population was 51.98 per cent and female population was 48.02 per cent. Literacy rate was 82.20 per cent. Male literacy rate was 88.67 per cent and female
literacy rate was 75.26 per cent. Sex ratio was 930 in 2001 which further declined to 924 in 20117
Thus, the basic data reveals that literacy rate in Gujarat was higher than the All India literacy rate. But sex ratio in the state vis–a-vis districts portray a very dismal picture. It was less than the All India level sex ratio. Sex ratio in Surat district was much more alarming (Table 1).
7 www.census2011.co.in website accessed on 26 June, 2013 and 12 June, 2013.

15 16
Section 2: Profile of women respondents
Total 1000 households have been surveyed. Of total 1,000
respondents, district-wise and area-wise details are as follow:
Table 2: District & Location wise Distribution of Respondents (%)
Sl. District Urban row %
Rural row %
Total (row & col %)
1. 1. Ahmadabad 412 (89.8)
47 (10.2)
459 (100) (45.9)
2. 2. Surat 283 (93.1)
21 (6.9)
304 (100) (30.4)
3. 3. Rajkot 218 (92.0)
19 (8.0)
237 (100) (23.7)
Total 913 (91.3)
87 (8.7)
1000 (100)
The overview shows that the largest number of respondents
(about 45.9 per cent) were from Ahmadabad district followed by Surat
district (about 30.4 per cent) and Rajkot district (about 23.7 per cent).
These were the wealthiest cities in the state. Majority of the
respondents (91.3 per cent) belonged to urban area and almost 8.7 per
cent belonged to rural area (Fig. 1).

17 18
Fig: 1 District & Location wise Distribution of Respondents
Data analysis on the relationship between district and place reveals that of total 459 respondents in Ahmadabad district 89.8 per cent were from urban areas and 10.2 per cent were from rural areas. Of total 304 respondents from Surat district, 93.1 per cent were from urban area and 6.9 per cent were from rural area. Of total 237 respondents from Rajkot district, 92 per cent were from urban areas and 8 per cent were from rural area (Table 2).
Table 3: Distribution of Respondents by Social Category (%)
District Social category (row %) No. (row & col % ) General OBC SC ST Others
Ahmadabad 218 (47.5)
171 (37.3)
16 (3.5)
21 (4.6)
33 (7.2)
459 (100.1) (45.9)
Surat 92 (30.3)
76 (25.0)
13 (4.3)
03 (1.0)
120 (39.5)
304 (100) (30.4)
Rajkot 132 (55.7)
66 (27.8)
02 (0.8)
- 37 (15.6)
237 (99.9) (23.7)
Total 442 (44.2)
313 (31.3)
31 (3.1)
24 (2.4)
190 (19.0)
1000 (100)
Data analysis on social category of the sample population reveals that the largest number of the respondents (44.2 per cent) belonged to general category followed by 31.3 per cent belonged to Other Backward Castes, 3.1 per cent were Scheduled Castes, 2.4 per cent were Scheduled Tribe and 19.0 per cent belonged to ‘others’ category, which incorporates the communities that are not part of caste system like Sindhi and Parsi, etc. The Sindhis were believed to be migrated during and after partition in 1947 from Sindh region, which is now a part of Pakistan but they have continued their religion and they worship Zulelal and celebrate their new year as ‘Chettichand’. This is to mention that Gujarat is one of the states with considerable population of Sindhis, largely a trading community, of electronic items, cloth, and readymade garments. Thus, it is included as a separate category under social category as well as under religion (Table 3) (Fig.:2).

19 20
Fig.: 2 Distribution of Respondent by Social Category (%)
In Gujarat, there have been 104 communities belonging to OBCs as per central list while 146 communities in state list, having about 3.37 crore population in Gujarat. Thus, Gujarat’s socio-demographic construction could be described as - approximately 48 per cent OBCs (including Dalit Christians), 16 per cent Scheduled Tribe, 8 per cent general category, 8 per cent Scheduled Caste, 13 per cent Muslims and the rest belonging to other communities following different religions like Christianity, Sikhism, Jainsm, Zoroastrian and Judaism, etc.8
8 Census 2011 provisional data on caste is not available, thus these figures remain rough estimates and presented here as indicative social composition and regional variations in the context of asset holding.
21 22
Of total 1,000 respondents of the sample population, majority
(83.9 per cent) were found following Hindu religion, 10.3 per cent
were following Islam, 2.7 per cent were following Jainism and 0.3 per
cent each following Sikhism, Buddhism, and Christianity, and others
included Zoroastrians, Judaism and Sindhi (2.2 per cent) (Table 4).
Table 5: Distribution of Respondents by Age Group (%)
Sl. District Age (years) (row %) No. (row & col
%) 18-35 36-60 >61
1 Ahmadabad 57 (12.4)
392 (85.4)
10 (2.2)
459 (100) (45.9)
2 Surat 69 (22.7)
216 (71.0)
19 (6.3)
304 (100) (30.4)
3 Rajkot 23 (9.7)
200 (84.4)
14 (5.9)
237 (100) (23.7)
Total 149 (14.9)
808 (80.8)
43 (4.3)
1000 (100)
Of total 1,000 respondents in the sample population, 14.9 per
cent were aged between 18 to 35 years, and most of them (80.8 per
cent) aged between 36 and 60 years and few (4.3 per cent) were 61
years and above. Thus, the largest group was of aged between 36 to 60
years (Table 5).

23 24
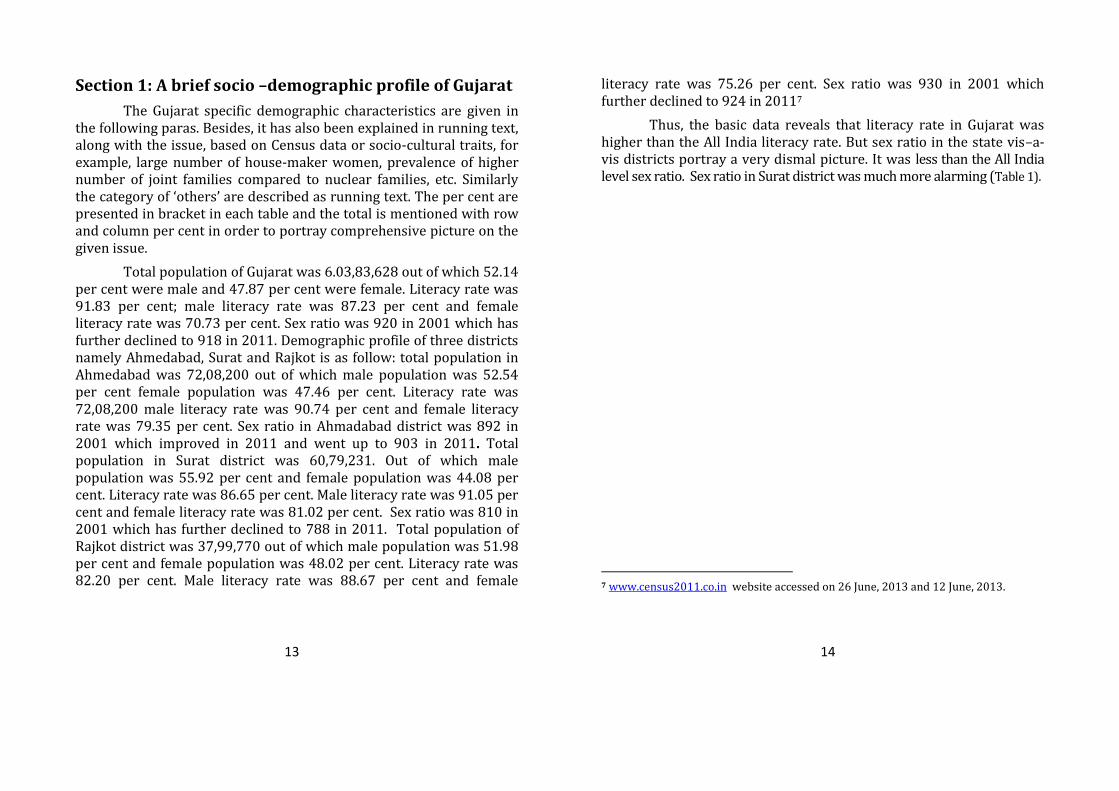
Data analysis of the marital status of women respondents who
have availed the benefit of the scheme of concession in stamp duty/
registration fee shows that majority of them (93.1 per cent) were
married. Of the rest, 5.7 per cent to the total respondents were
widowed, 0.7 per cent to the total respondents were single, 0.3 per
cent to the total respondents were separated 0.2 per cent to the total
respondents were divorcee. Ahmadabad district reported respondents
belonging to all the categories (Table 6).
Table 7: Distribution of Respondents by Family Type (%)
Sl. District Family type (row %) No. (row & col %) Joint Nuclear
1. Ahmadabad 219 (47.7)
240 (52.3)
459 (100) (45.9)
2. Surat 248 (81.6)
56 (18.4)
304 (100) (30.4)
3. Rajkot 120 (50.6)
117 (49.4)
237 (100) (23.7)
Total 587 (58.7)
413 (41.3)
1000 (100)
Data analysis on the type of family, it was found that more than
half of the respondents (58.7 per cent) lived with the joint family while
little more than two fifth (41.3 per cent) were nuclear families; similar
pattern was observed across all districts. As Gujarat having mercantile
culture, the business was usually owned by a family and therefore
usually it was seen that joint families were higher in number than the
nuclear families (Table 7).
Similarly, data analysis on the size of family reveals that there
were 65.8 per cent families (93.2 per cent residing in urban and 6.8
per cent in rural area) with less than five members, 31.2 per cent
families (87.5 per cent in urban and 12.5 per cent residing in rural
area) with members between 6 to 10. Few of them (3 per cent) were
having more than 10 members. This shows that barring 3.0 per cent
families (90 per cent in urban area and 10 per cent in rural area), half
of the joint families were not larger than 10 members and almost half
were less than five members.
25 26
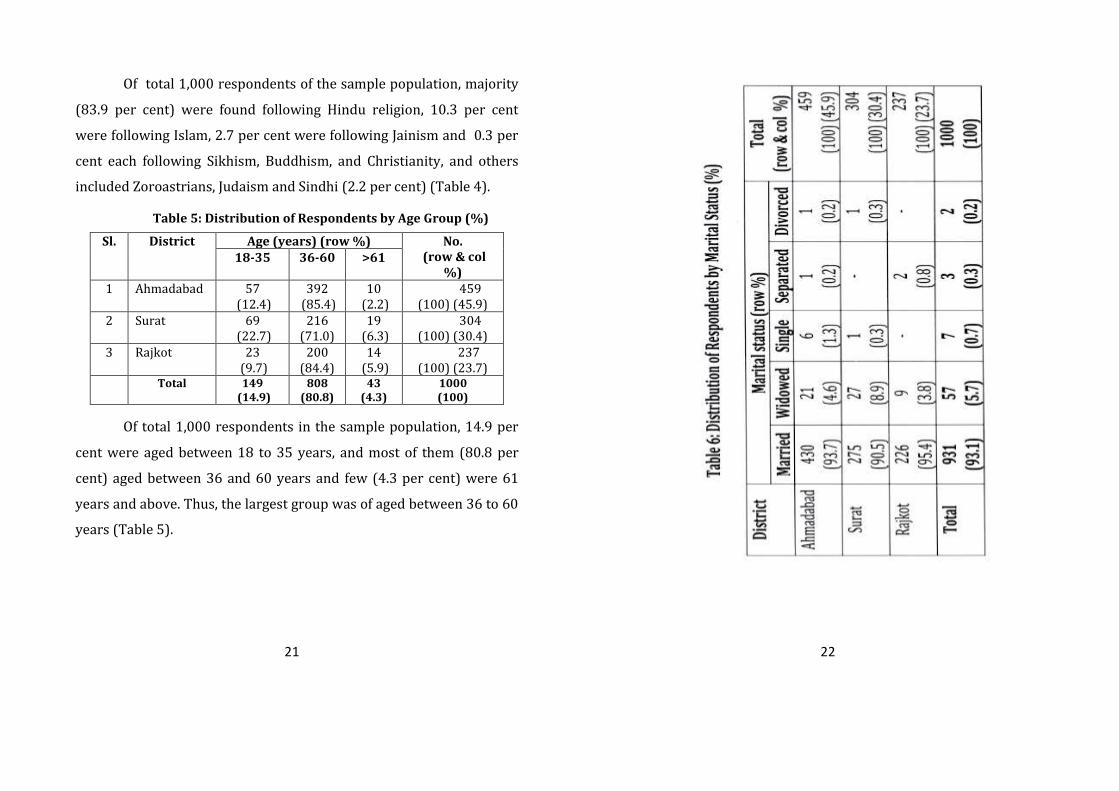
Educational status of women respondents who have got the
benefit of the scheme shows that of total 1,000 respondents, 6.9 per
cent was illiterate and 1.6 per cent could read and write (numerate-
literates). Of the rest (862), half of them (50.8 per cent) have passed
high school, little more than one-fifth of them (21.4 per cent) have
passed intermediate, 12.1 per cent were graduates and 1.9 per cent
has acquired technical/professional education. 5.3 per cent
respondents have not answered the question (Table 8).
All the categories of education were common across all social
categories, religion and type of family, except one Scheduled Tribe,
who was a graduate.
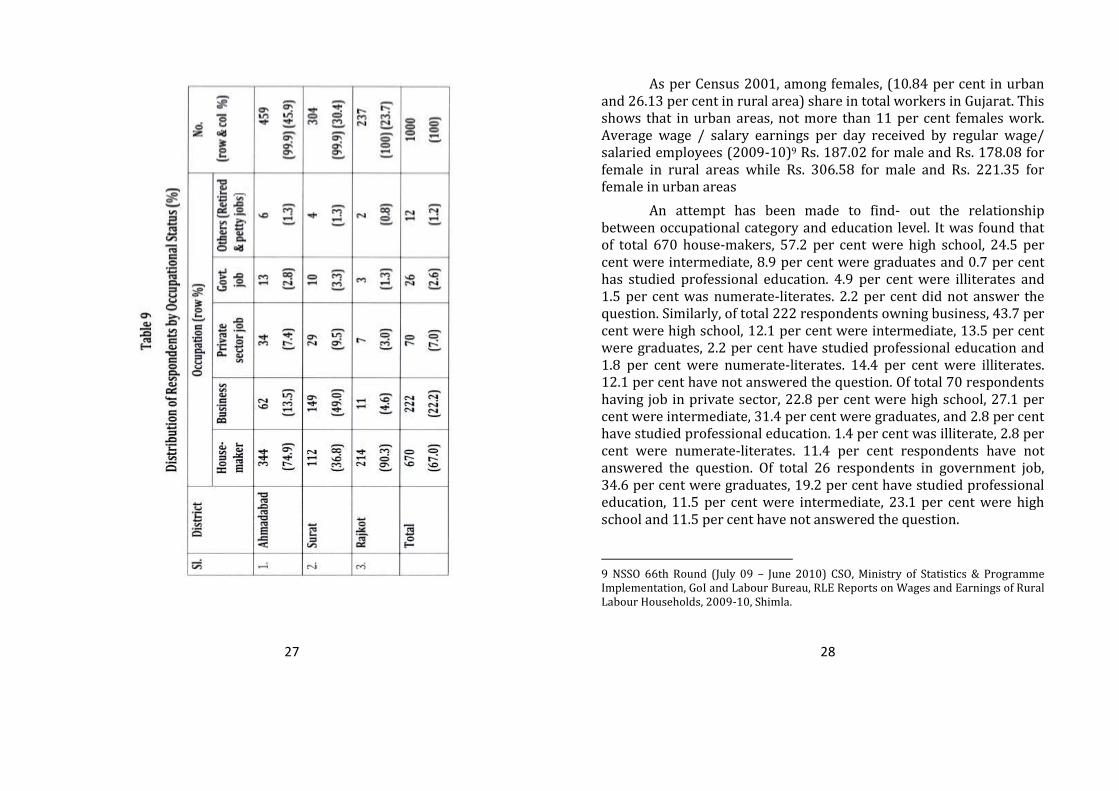
Occupational Status Of total 1,000 respondents, the largest number i.e. two-third of
the total (67 per cent) were of house-makers – across all the districts followed by 22.2 per cent having their own business, 7 per cent in private jobs and 2.6 per cent were in government jobs. The ‘others’ included petty jobs, not working on regular basis but earning livelihood, 1.2 per cent were found engaged in this category. Of the rest, 33.3 per cent were working as agriculture labourers, 22.2 per cent were engaged in animal husbandry, 22.2 per cent were retired, 11.1 per cent were doctors and engaged in private practice and similar number of them (11.1 per cent) were engaged in farming (see table 9).
27 28
As per Census 2001, among females, (10.84 per cent in urban and 26.13 per cent in rural area) share in total workers in Gujarat. This shows that in urban areas, not more than 11 per cent females work. Average wage / salary earnings per day received by regular wage/ salaried employees (2009-10)9 Rs. 187.02 for male and Rs. 178.08 for female in rural areas while Rs. 306.58 for male and Rs. 221.35 for female in urban areas
An attempt has been made to find- out the relationship between occupational category and education level. It was found that of total 670 house-makers, 57.2 per cent were high school, 24.5 per cent were intermediate, 8.9 per cent were graduates and 0.7 per cent has studied professional education. 4.9 per cent were illiterates and 1.5 per cent was numerate-literates. 2.2 per cent did not answer the question. Similarly, of total 222 respondents owning business, 43.7 per cent were high school, 12.1 per cent were intermediate, 13.5 per cent were graduates, 2.2 per cent have studied professional education and 1.8 per cent were numerate-literates. 14.4 per cent were illiterates. 12.1 per cent have not answered the question. Of total 70 respondents having job in private sector, 22.8 per cent were high school, 27.1 per cent were intermediate, 31.4 per cent were graduates, and 2.8 per cent have studied professional education. 1.4 per cent was illiterate, 2.8 per cent were numerate-literates. 11.4 per cent respondents have not answered the question. Of total 26 respondents in government job, 34.6 per cent were graduates, 19.2 per cent have studied professional education, 11.5 per cent were intermediate, 23.1 per cent were high school and 11.5 per cent have not answered the question.
9 NSSO 66th Round (July 09 – June 2010) CSO, Ministry of Statistics & Programme Implementation, GoI and Labour Bureau, RLE Reports on Wages and Earnings of Rural Labour Households, 2009-10, Shimla.
29 30
Thus, based on the above analysis, it may be said that most of the respondents were high school across the entire occupational category. However, those who were in govt. jobs were better qualified as most of them have acquired education upto graduation and professional courses.
Of total 1,000 respondents, little more than one- fifth of them (21.1 per cent) have told that the agricultural land was owned by their families, across all districts (Table 10).
Table 10: Asset Status of Family – Agricultural Land Ownership (%)
Sl. District Response (row %)
Total (row & col %)
Yes No 1. Ahmadabad 75
(16.3) 384
(83.7) 459
(100) (45.9) 2. Surat 59
(19.4) 245
(80.6) 304
(100) (30.4) 3. Rajkot 77
(32.5) 160
(67.5) 237
(100) (23.7) Total 211
(21.1) 789
(78.9) 1000
(100)
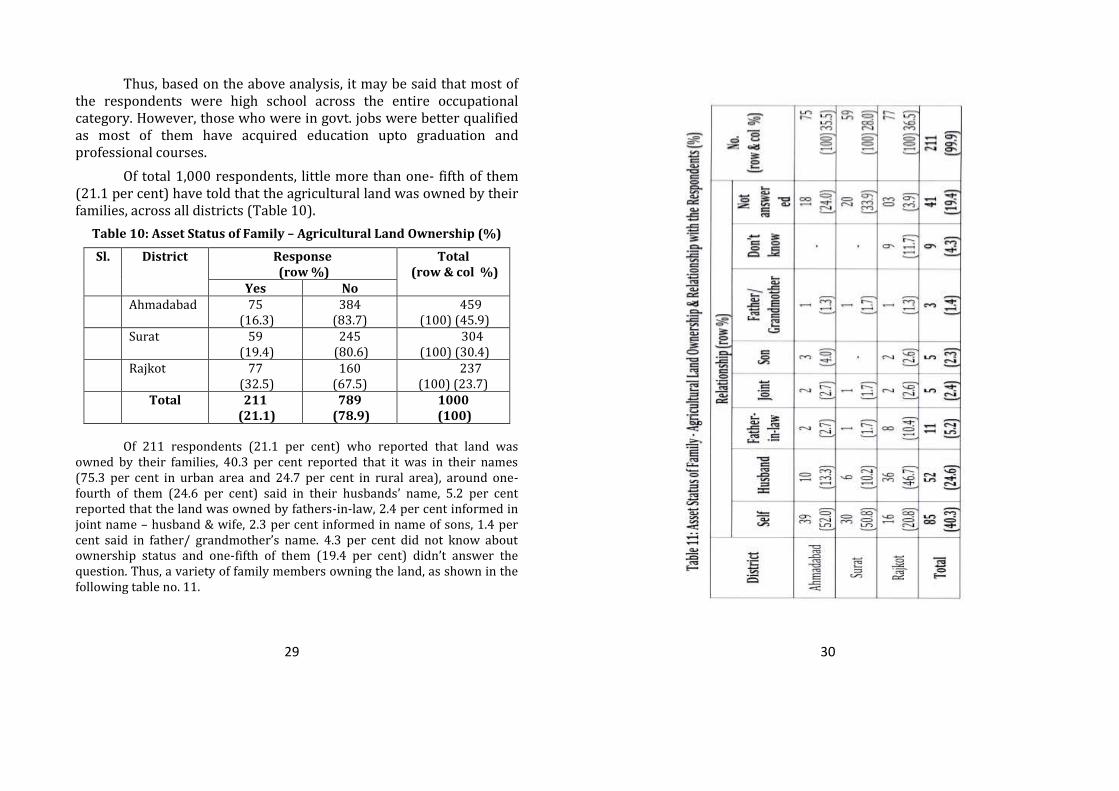
Of 211 respondents (21.1 per cent) who reported that land was owned by their families, 40.3 per cent reported that it was in their names (75.3 per cent in urban area and 24.7 per cent in rural area), around one-fourth of them (24.6 per cent) said in their husbands’ name, 5.2 per cent reported that the land was owned by fathers-in-law, 2.4 per cent informed in joint name – husband & wife, 2.3 per cent informed in name of sons, 1.4 per cent said in father/ grandmother’s name. 4.3 per cent did not know about ownership status and one-fifth of them (19.4 per cent) didn’t answer the question. Thus, a variety of family members owning the land, as shown in the following table no. 11.
31 32
An analysis has been made to find out the relationship between status of asset holding of family with social category, religion and occupational status.
Relationship between asset status of family and religion shows that among different religions, of total 211 land owners, 82.9 per cent were Hindus, 12.3 per cent were Muslims, 2.4 per cent Jains, 0.5 per cent Buddhist, 0.5 per cent were Sindhi and 1.4 per cent belonged to ‘other’ religions like Zoroastrian and Judaism. Relationship between status of asset holding of family and social category reveals that among different social categories, 40.2 per cent belonged to general category, 37.9 per cent were OBCs, 2.8 per cent belonged to Scheduled Castes, 1.9 per cent belonged to Scheduled Tribe and 17.1 per cent belonged to ‘others’, which did not belong to caste system, as explained earlier.
The analysis of land ownership by the family vis-à-vis social category shows that 19.3 per cent of total 442 general category respondents, 25.7 per cent of total 313 OBCs, 19.3 per cent of total 31 Scheduled Castes, 16.7 per cent of total 24 Scheduled Tribe and 19 per cent of total 190 ‘others’ own land. As mentioned earlier, the Other Backward Castes composed almost half the Gujarat population and they were largely rural and agriculture based, owning small to medium land holding and Other Backward Castes also included Dalit-Christian, largely located in central Gujarat.
Based on the analysis, it could be stated that asset was hold mainly by Hindus, followed by Muslims and Jains. Less number of followers of Buddhist, Sindhis and others were holding assets. Similarly, those belonging to general category and OBCs were having assets but lesser number of respondents from Scheduled Castes, Scheduled Tribes or other categories were holding assets.
Relationship between asset holding status of the family and occupational categories reveals that among different occupations, 1.4 per cent were in government jobs, 2.7 per cent have jobs in private sector, 23.2 per cent own
business, 69.2 per cent were house-makers, 1 per cent were agriculture labourers, 1 per cent were engaged in animal husbandry, 1 per cent were engaged in farming,
0.4 per cent were retired and 0.5 per cent were engaged in other occupations. Thus, the largest land ownership
was among the respondents engaged in business as well as by house makers, followed by respondents in other occupations and least among service class.
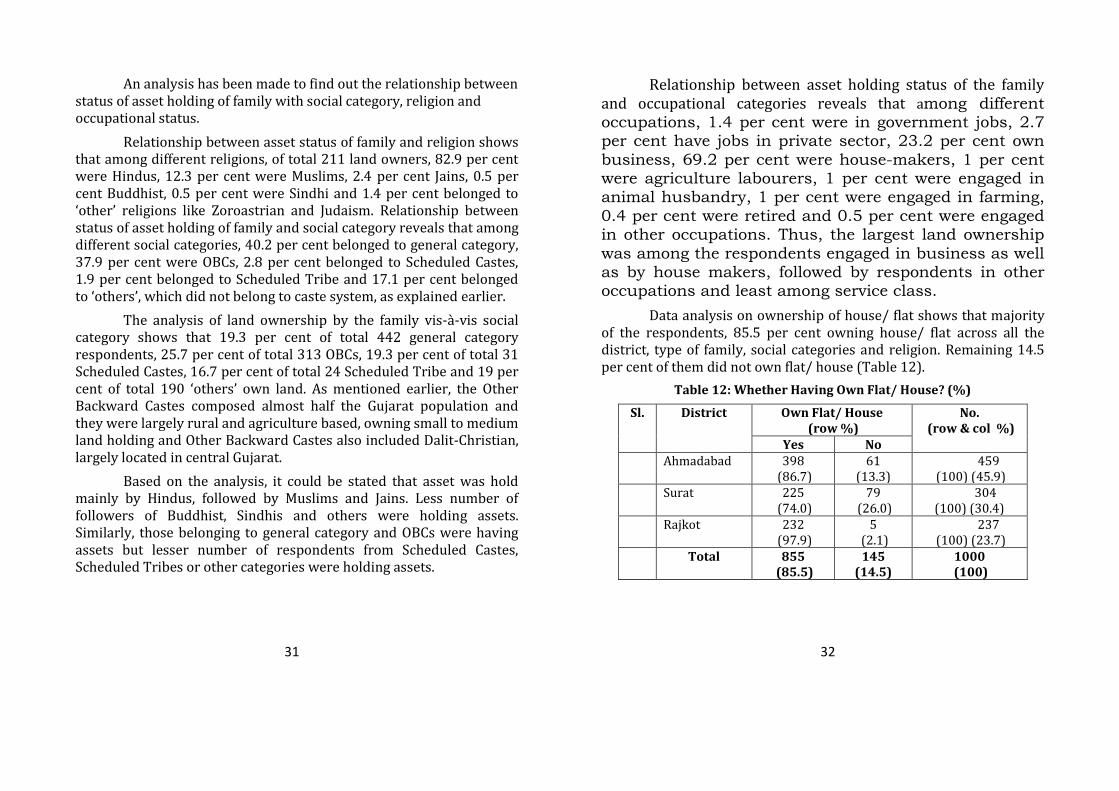
Data analysis on ownership of house/ flat shows that majority of the respondents, 85.5 per cent owning house/ flat across all the district, type of family, social categories and religion. Remaining 14.5 per cent of them did not own flat/ house (Table 12).
Table 12: Whether Having Own Flat/ House? (%)
Sl. District Own Flat/ House (row %)
No. (row & col %)
Yes No 1. Ahmadabad 398
(86.7) 61
(13.3) 459
(100) (45.9) 2. Surat 225
(74.0) 79
(26.0) 304
(100) (30.4) 3. Rajkot 232
(97.9) 5
(2.1) 237
(100) (23.7)
Total 855 (85.5)
145 (14.5)
1000 (100)

33 34
Of 855 respondents who reported having own flat/ house, 74
per cent reported that it was in their names (93.8 per cent in urban
area and 6.3 per cent in rural area), 8.9 per cent said in name of
husband; 2.0 per cent owned jointly with husband & wife, 1.7 per cent
said in father’s or father in laws’ name; 0.4 per cent informed that it
was in the name of mother-in-law, daughter-in-law, sister-in-law,
mother, sister and uncle, brother-in-law and grandmother. 1.1 per
cent respondents did not know about ownership status. 12 per cent
respondents didn’t answer the question (Table 13).
35 36
Thus a variety of family members owned the flat/ house; the pattern was different than land ownership, for example, no house was owned by the son, many different combinations of joint name ownership, and higher number of self-owned respondents, as shown in the above table.
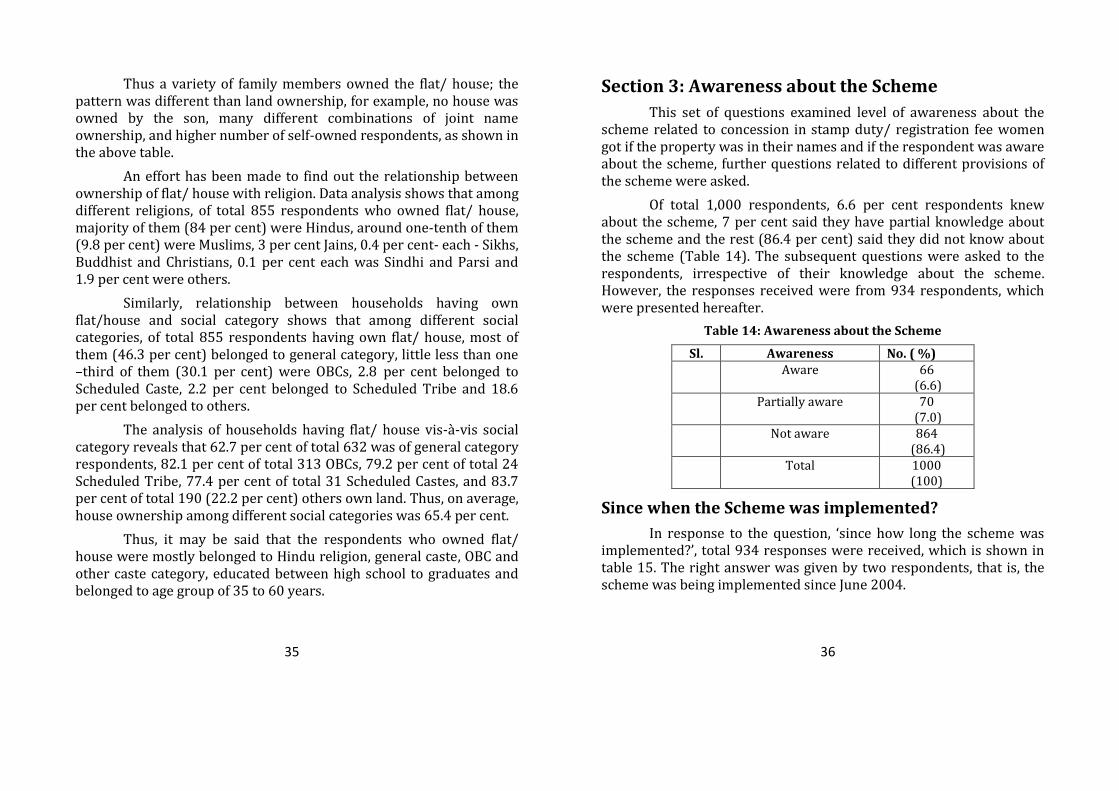
An effort has been made to find out the relationship between ownership of flat/ house with religion. Data analysis shows that among different religions, of total 855 respondents who owned flat/ house, majority of them (84 per cent) were Hindus, around one-tenth of them (9.8 per cent) were Muslims, 3 per cent Jains, 0.4 per cent- each - Sikhs, Buddhist and Christians, 0.1 per cent each was Sindhi and Parsi and 1.9 per cent were others.
Similarly, relationship between households having own flat/house and social category shows that among different social categories, of total 855 respondents having own flat/ house, most of them (46.3 per cent) belonged to general category, little less than one –third of them (30.1 per cent) were OBCs, 2.8 per cent belonged to Scheduled Caste, 2.2 per cent belonged to Scheduled Tribe and 18.6 per cent belonged to others.
The analysis of households having flat/ house vis-à-vis social category reveals that 62.7 per cent of total 632 was of general category respondents, 82.1 per cent of total 313 OBCs, 79.2 per cent of total 24 Scheduled Tribe, 77.4 per cent of total 31 Scheduled Castes, and 83.7 per cent of total 190 (22.2 per cent) others own land. Thus, on average, house ownership among different social categories was 65.4 per cent.
Thus, it may be said that the respondents who owned flat/ house were mostly belonged to Hindu religion, general caste, OBC and other caste category, educated between high school to graduates and belonged to age group of 35 to 60 years.
Section 3: Awareness about the Scheme
This set of questions examined level of awareness about the scheme related to concession in stamp duty/ registration fee women got if the property was in their names and if the respondent was aware about the scheme, further questions related to different provisions of the scheme were asked.
Of total 1,000 respondents, 6.6 per cent respondents knew about the scheme, 7 per cent said they have partial knowledge about the scheme and the rest (86.4 per cent) said they did not know about the scheme (Table 14). The subsequent questions were asked to the respondents, irrespective of their knowledge about the scheme. However, the responses received were from 934 respondents, which were presented hereafter.
Table 14: Awareness about the Scheme
Sl. Awareness No. ( %) 1. Aware 66
(6.6) 2. Partially aware 70
(7.0) 3. Not aware 864
(86.4) Total 1000
(100)
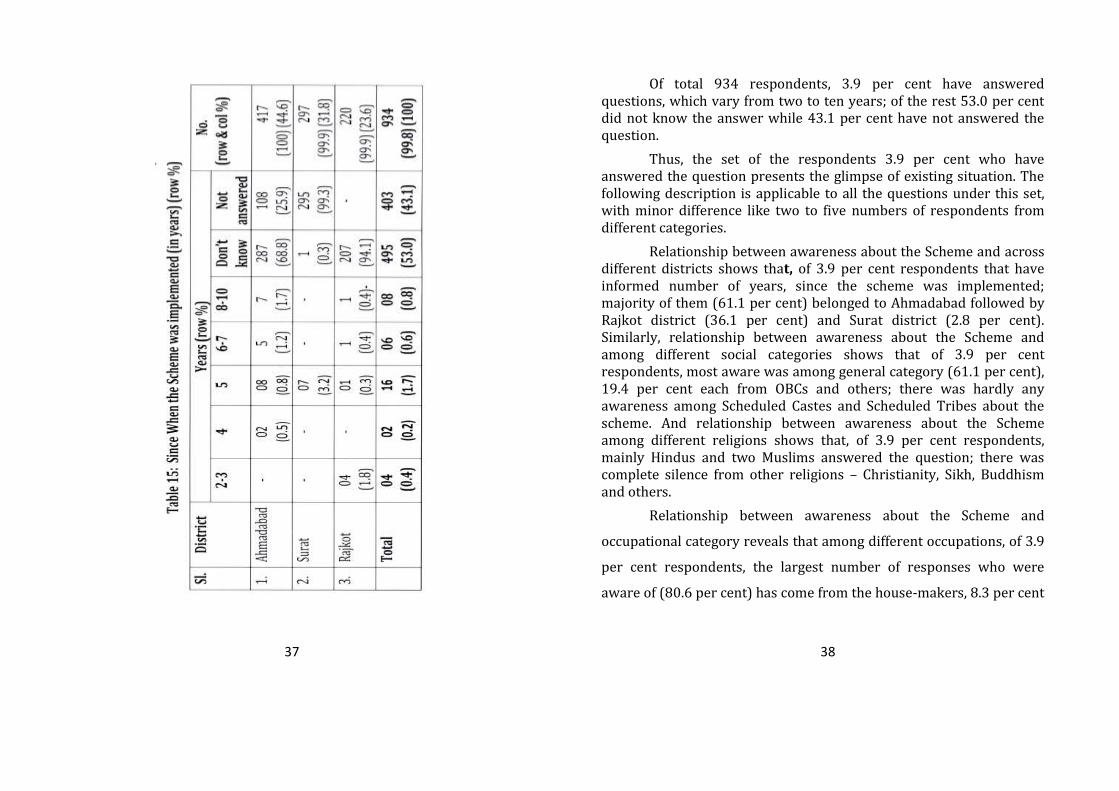
Since when the Scheme was implemented?
In response to the question, ‘since how long the scheme was implemented?’, total 934 responses were received, which is shown in table 15. The right answer was given by two respondents, that is, the scheme was being implemented since June 2004.
37 38
Of total 934 respondents, 3.9 per cent have answered questions, which vary from two to ten years; of the rest 53.0 per cent did not know the answer while 43.1 per cent have not answered the question.
Thus, the set of the respondents 3.9 per cent who have answered the question presents the glimpse of existing situation. The following description is applicable to all the questions under this set, with minor difference like two to five numbers of respondents from different categories.
Relationship between awareness about the Scheme and across different districts shows that, of 3.9 per cent respondents that have informed number of years, since the scheme was implemented; majority of them (61.1 per cent) belonged to Ahmadabad followed by Rajkot district (36.1 per cent) and Surat district (2.8 per cent). Similarly, relationship between awareness about the Scheme and among different social categories shows that of 3.9 per cent respondents, most aware was among general category (61.1 per cent), 19.4 per cent each from OBCs and others; there was hardly any awareness among Scheduled Castes and Scheduled Tribes about the scheme. And relationship between awareness about the Scheme among different religions shows that, of 3.9 per cent respondents, mainly Hindus and two Muslims answered the question; there was complete silence from other religions – Christianity, Sikh, Buddhism and others.
Relationship between awareness about the Scheme and
occupational category reveals that among different occupations, of 3.9
per cent respondents, the largest number of responses who were
aware of (80.6 per cent) has come from the house-makers, 8.3 per cent
39 40
from jobs in private sector, 5.5 per cent from government job and 2.8
per cent each from a doctor and a business person. Relationship
between awareness about the Scheme and education reveals that
largely, the educated group – high school to the graduates and
professional courses have answered the question. Relationship
between awareness about the Scheme and the age group shows that
among different age-groups, most of the respondents (80.6 per cent)
came from the age group of 35 to 60 years, little more than one-tenth
of them (11.1 per cent) from 18 to 35 years age group and the rest 8.3
per cent respondents belonging to more than 61 years of age.
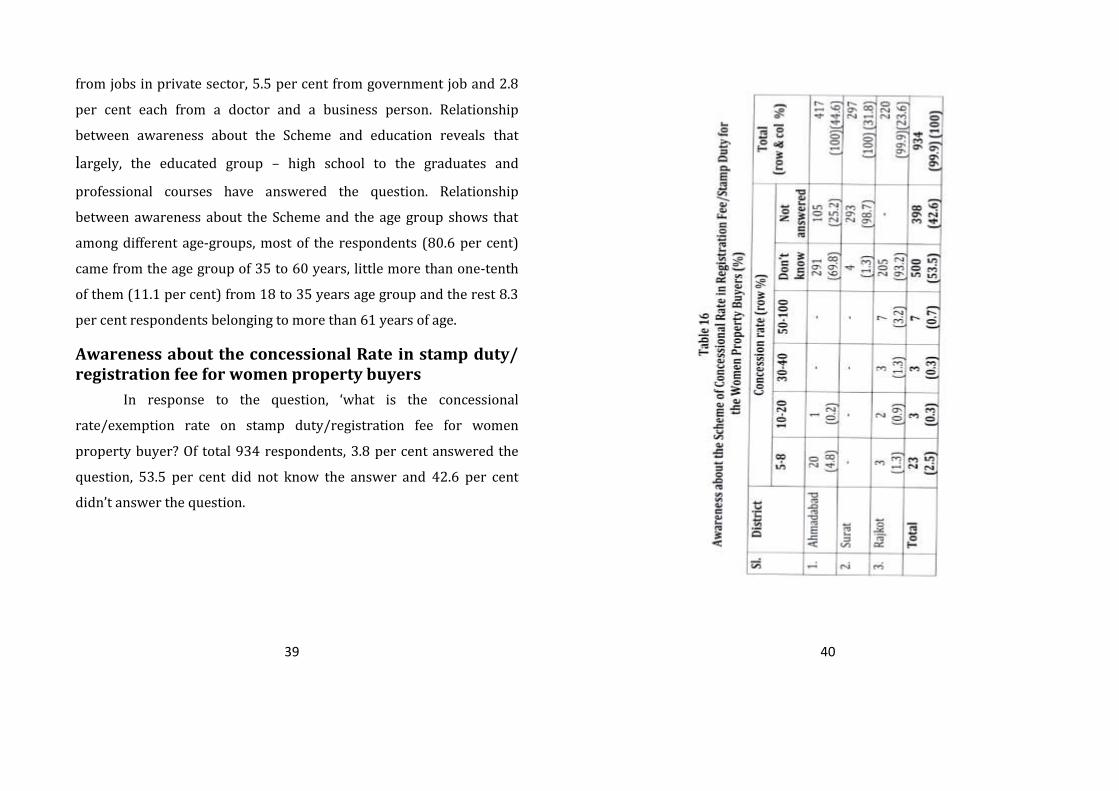
Awareness about the concessional Rate in stamp duty/ registration fee for women property buyers
In response to the question, ‘what is the concessional
rate/exemption rate on stamp duty/registration fee for women
property buyer? Of total 934 respondents, 3.8 per cent answered the
question, 53.5 per cent did not know the answer and 42.6 per cent
didn’t answer the question.
41 42
Data analysis on awareness about the concessional rate on
stamp duty/ registration fee shows that 2.5 per cent respondents told
the concession rate on stamp duty/ registration fee in the range of 5-8
per cent; 0.3 per cent respondents said that it was in the range of 10-
20 and similar number of them (0.3 per cent) said that it was in the
range of 30-40 and 0.7 per cent respondents said it was in the range of
50-100 per cent. 53.5 per cent respondents did not know the answer
while 42.6 per cent have not responded to the question (Table 16).
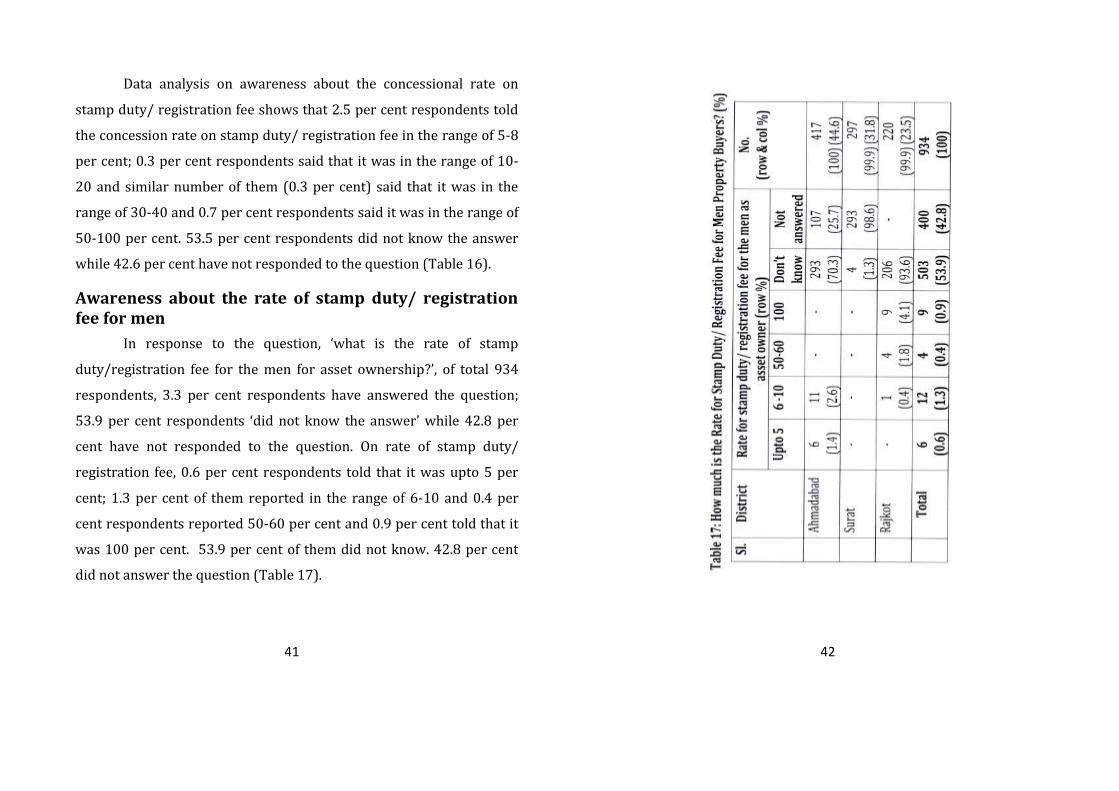
Awareness about the rate of stamp duty/ registration fee for men
In response to the question, ‘what is the rate of stamp
duty/registration fee for the men for asset ownership?’, of total 934
respondents, 3.3 per cent respondents have answered the question;
53.9 per cent respondents ‘did not know the answer’ while 42.8 per
cent have not responded to the question. On rate of stamp duty/
registration fee, 0.6 per cent respondents told that it was upto 5 per
cent; 1.3 per cent of them reported in the range of 6-10 and 0.4 per
cent respondents reported 50-60 per cent and 0.9 per cent told that it
was 100 per cent. 53.9 per cent of them did not know. 42.8 per cent
did not answer the question (Table 17).
43 44
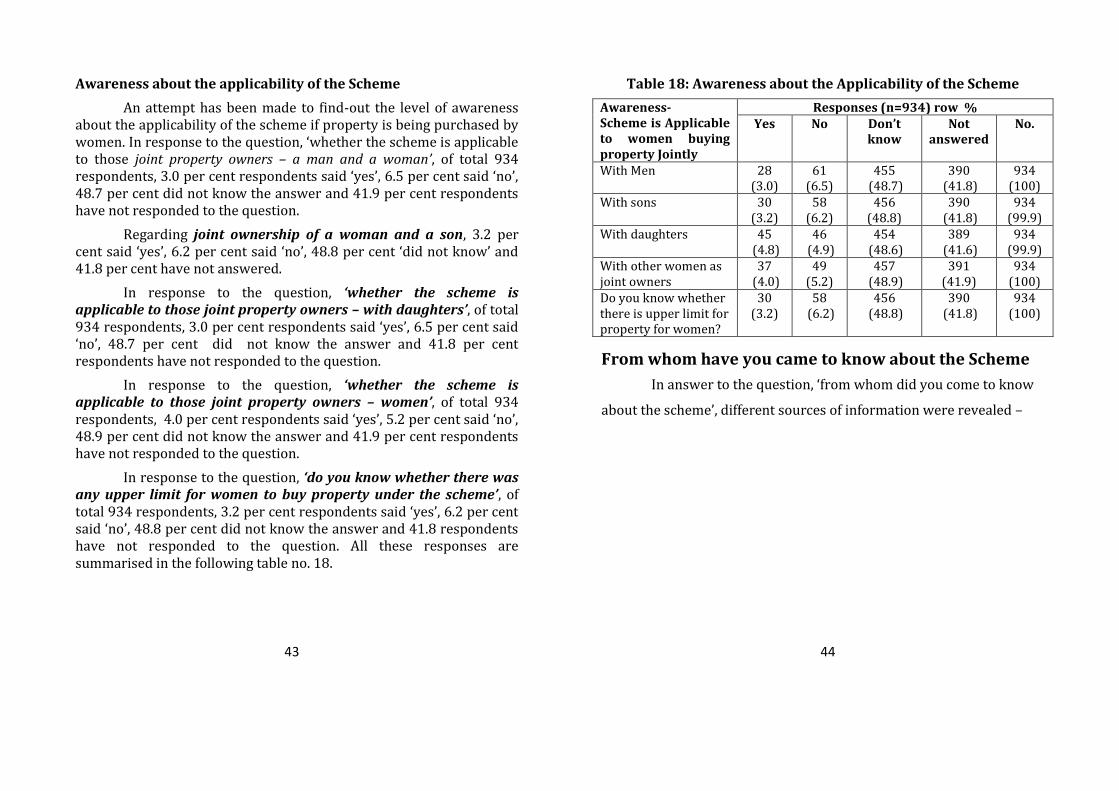
Awareness about the applicability of the Scheme
An attempt has been made to find-out the level of awareness about the applicability of the scheme if property is being purchased by women. In response to the question, ‘whether the scheme is applicable to those joint property owners – a man and a woman’, of total 934 respondents, 3.0 per cent respondents said ‘yes’, 6.5 per cent said ‘no’, 48.7 per cent did not know the answer and 41.9 per cent respondents have not responded to the question.
Regarding joint ownership of a woman and a son, 3.2 per cent said ‘yes’, 6.2 per cent said ‘no’, 48.8 per cent ‘did not know’ and 41.8 per cent have not answered.
In response to the question, ‘whether the scheme is applicable to those joint property owners – with daughters’, of total 934 respondents, 3.0 per cent respondents said ‘yes’, 6.5 per cent said ‘no’, 48.7 per cent did not know the answer and 41.8 per cent respondents have not responded to the question.
In response to the question, ‘whether the scheme is applicable to those joint property owners – women’, of total 934 respondents, 4.0 per cent respondents said ‘yes’, 5.2 per cent said ‘no’, 48.9 per cent did not know the answer and 41.9 per cent respondents have not responded to the question.
In response to the question, ‘do you know whether there was any upper limit for women to buy property under the scheme’, of total 934 respondents, 3.2 per cent respondents said ‘yes’, 6.2 per cent said ‘no’, 48.8 per cent did not know the answer and 41.8 respondents have not responded to the question. All these responses are summarised in the following table no. 18.
Table 18: Awareness about the Applicability of the Scheme
Awareness- Scheme is Applicable to women buying property Jointly
Responses (n=934) row % Yes No Don’t
know Not
answered No.
With Men 28 (3.0)
61 (6.5)
455 (48.7)
390 (41.8)
934 (100)
With sons 30 (3.2)
58 (6.2)
456 (48.8)
390 (41.8)
934 (99.9)
With daughters 45 (4.8)
46 (4.9)
454 (48.6)
389 (41.6)
934 (99.9)
With other women as joint owners
37 (4.0)
49 (5.2)
457 (48.9)
391 (41.9)
934 (100)
Do you know whether there is upper limit for property for women?
30 (3.2)
58 (6.2)
456 (48.8)
390 (41.8)
934 (100)
From whom have you came to know about the Scheme
In answer to the question, ‘from whom did you come to know
about the scheme’, different sources of information were revealed –
45 46
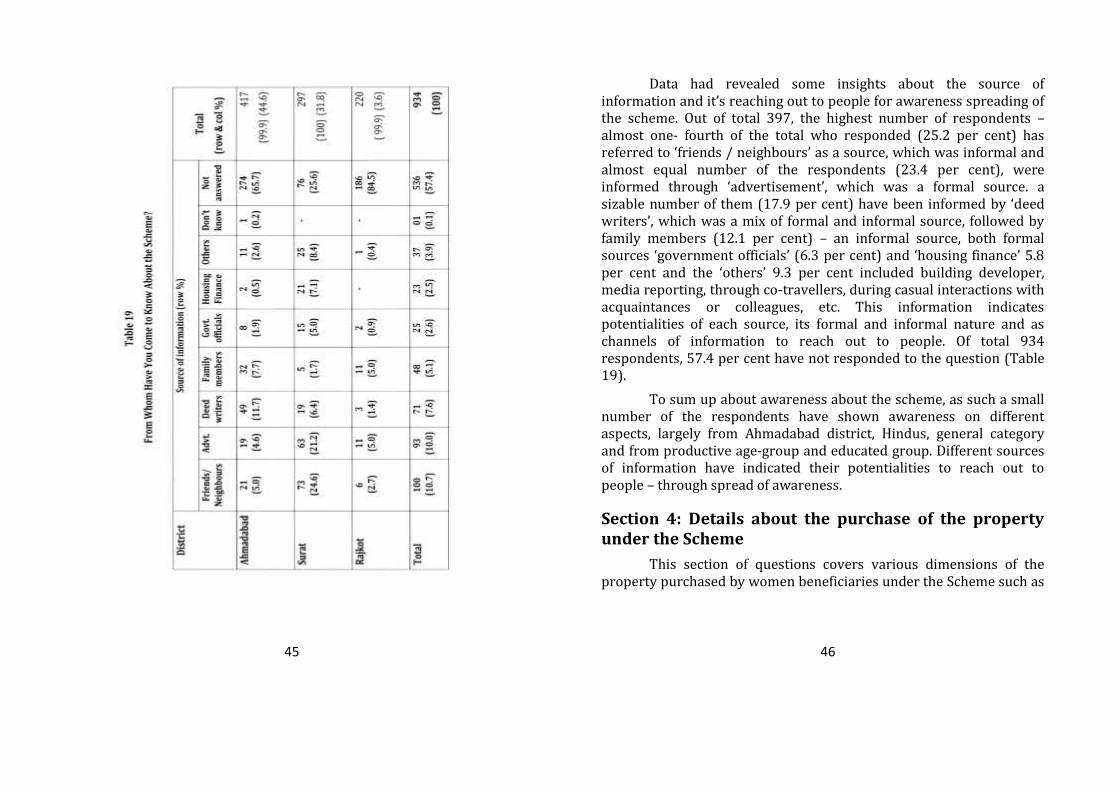
Data had revealed some insights about the source of information and it’s reaching out to people for awareness spreading of the scheme. Out of total 397, the highest number of respondents – almost one- fourth of the total who responded (25.2 per cent) has referred to ‘friends / neighbours’ as a source, which was informal and almost equal number of the respondents (23.4 per cent), were informed through ‘advertisement’, which was a formal source. a sizable number of them (17.9 per cent) have been informed by ‘deed writers’, which was a mix of formal and informal source, followed by family members (12.1 per cent) – an informal source, both formal sources ‘government officials’ (6.3 per cent) and ‘housing finance’ 5.8 per cent and the ‘others’ 9.3 per cent included building developer, media reporting, through co-travellers, during casual interactions with acquaintances or colleagues, etc. This information indicates potentialities of each source, its formal and informal nature and as channels of information to reach out to people. Of total 934 respondents, 57.4 per cent have not responded to the question (Table 19).
To sum up about awareness about the scheme, as such a small number of the respondents have shown awareness on different aspects, largely from Ahmadabad district, Hindus, general category and from productive age-group and educated group. Different sources of information have indicated their potentialities to reach out to people – through spread of awareness.
Section 4: Details about the purchase of the property under the Scheme
This section of questions covers various dimensions of the property purchased by women beneficiaries under the Scheme such as
47 48
details like which property purchased, from whom were it purchased, purpose and reasons for purchasing of the property.
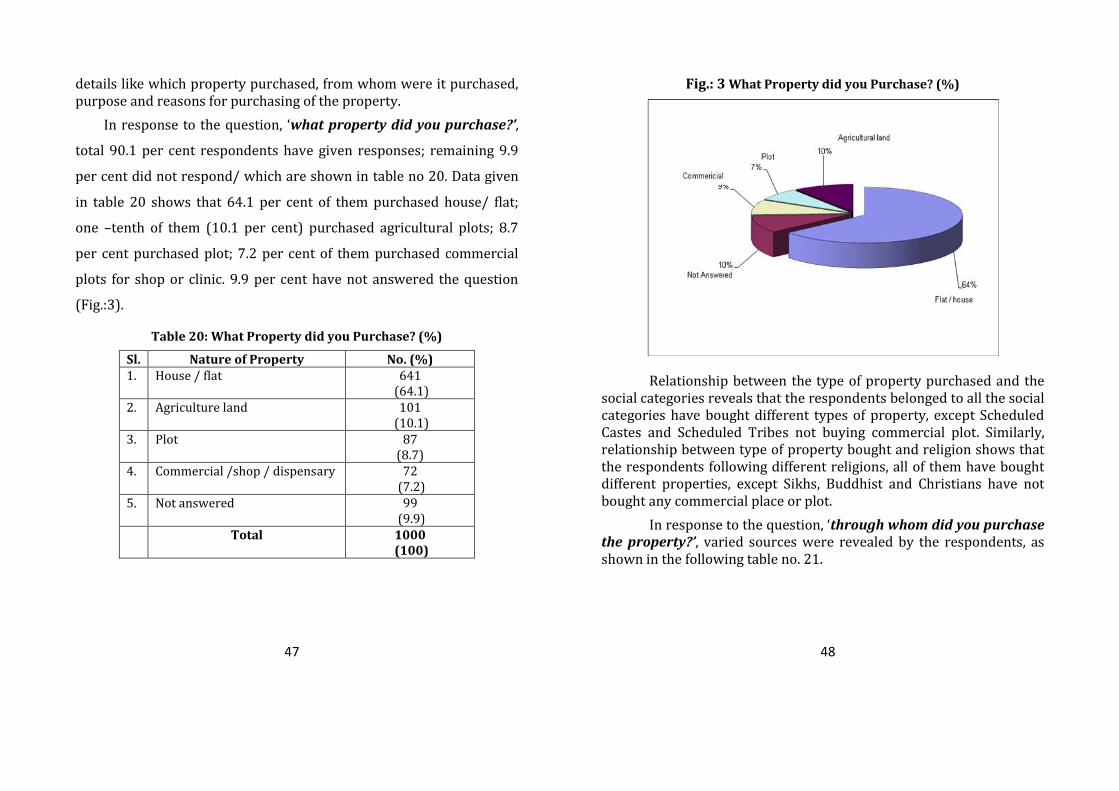
In response to the question, ‘what property did you purchase?’,
total 90.1 per cent respondents have given responses; remaining 9.9
per cent did not respond/ which are shown in table no 20. Data given
in table 20 shows that 64.1 per cent of them purchased house/ flat;
one –tenth of them (10.1 per cent) purchased agricultural plots; 8.7
per cent purchased plot; 7.2 per cent of them purchased commercial
plots for shop or clinic. 9.9 per cent have not answered the question
(Fig.:3).
Table 20: What Property did you Purchase? (%)
Sl. Nature of Property No. (%) 1. House / flat 641
(64.1) 2. Agriculture land 101
(10.1) 3. Plot 87
(8.7) 4. Commercial /shop / dispensary 72
(7.2) 5. Not answered 99
(9.9) Total 1000
(100)
Fig.: 3 What Property did you Purchase? (%)
Relationship between the type of property purchased and the social categories reveals that the respondents belonged to all the social categories have bought different types of property, except Scheduled Castes and Scheduled Tribes not buying commercial plot. Similarly, relationship between type of property bought and religion shows that the respondents following different religions, all of them have bought different properties, except Sikhs, Buddhist and Christians have not bought any commercial place or plot.
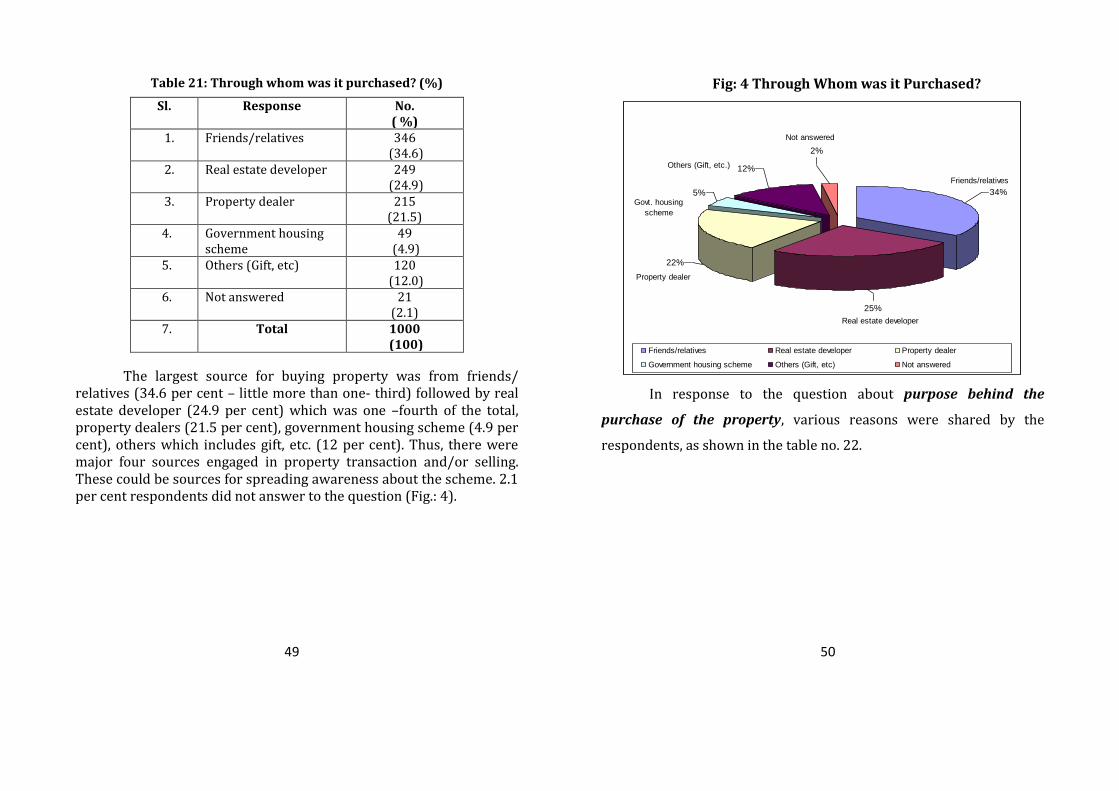
In response to the question, ‘through whom did you purchase the property?’, varied sources were revealed by the respondents, as shown in the following table no. 21.
49 50
Table 21: Through whom was it purchased? (%)
Sl. Response No. ( %)
1. Friends/relatives 346 (34.6)
2. Real estate developer 249 (24.9)
3. Property dealer 215 (21.5)
4. Government housing scheme
49 (4.9)
5. Others (Gift, etc) 120 (12.0)
6. Not answered 21 (2.1)
7. Total 1000 (100)
The largest source for buying property was from friends/ relatives (34.6 per cent – little more than one- third) followed by real estate developer (24.9 per cent) which was one –fourth of the total, property dealers (21.5 per cent), government housing scheme (4.9 per cent), others which includes gift, etc. (12 per cent). Thus, there were major four sources engaged in property transaction and/or selling. These could be sources for spreading awareness about the scheme. 2.1 per cent respondents did not answer to the question (Fig.: 4).
Fig: 4 Through Whom was it Purchased?
34%
25%
22%
5%
12%
2%
Friends/relatives Real estate developer Property dealer
Government housing scheme Others (Gift, etc) Not answered
Friends/relatives
Real estate developer
Property dealer
Govt. housing
scheme
Others (Gift, etc.)
Not answered
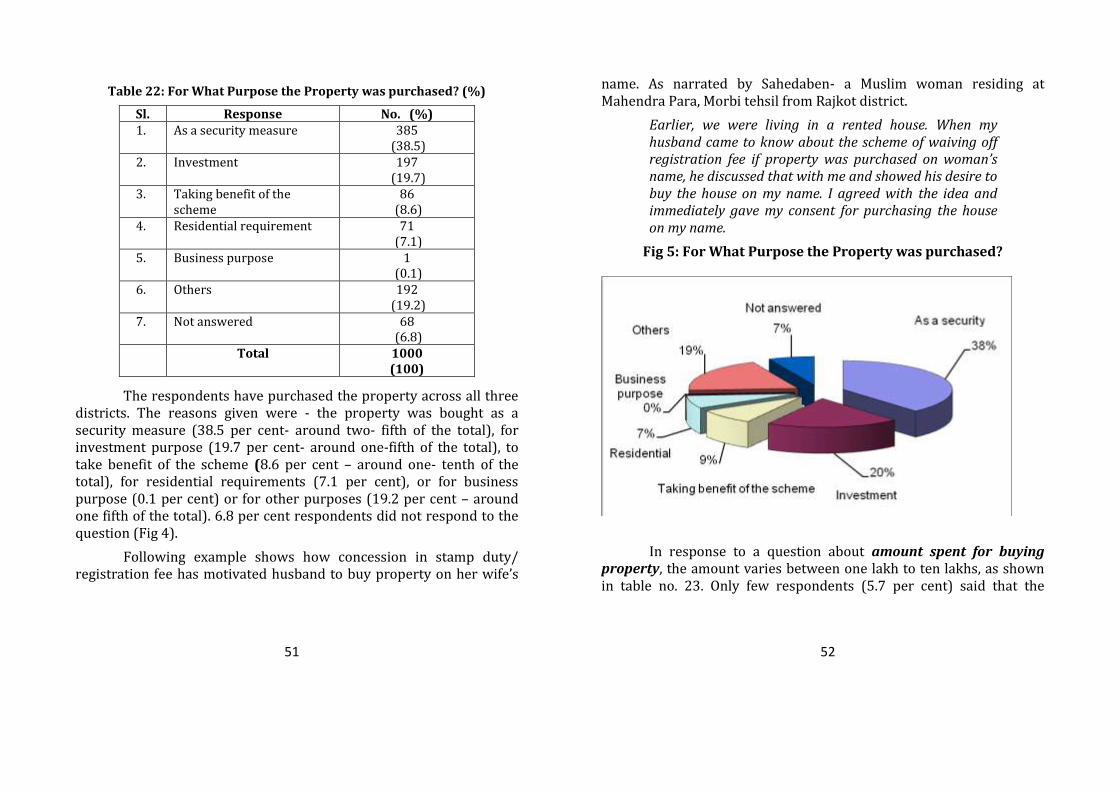
In response to the question about purpose behind the
purchase of the property, various reasons were shared by the
respondents, as shown in the table no. 22.
51 52
Table 22: For What Purpose the Property was purchased? (%)
Sl. Response No. (%) 1. As a security measure 385
(38.5) 2. Investment 197
(19.7) 3. Taking benefit of the
scheme 86
(8.6) 4. Residential requirement 71
(7.1) 5. Business purpose 1
(0.1) 6. Others 192
(19.2) 7. Not answered 68
(6.8) Total 1000
(100)
The respondents have purchased the property across all three districts. The reasons given were - the property was bought as a security measure (38.5 per cent- around two- fifth of the total), for investment purpose (19.7 per cent- around one-fifth of the total), to take benefit of the scheme (8.6 per cent – around one- tenth of the total), for residential requirements (7.1 per cent), or for business purpose (0.1 per cent) or for other purposes (19.2 per cent – around one fifth of the total). 6.8 per cent respondents did not respond to the question (Fig 4).
Following example shows how concession in stamp duty/ registration fee has motivated husband to buy property on her wife’s
name. As narrated by Sahedaben- a Muslim woman residing at Mahendra Para, Morbi tehsil from Rajkot district.
Earlier, we were living in a rented house. When my husband came to know about the scheme of waiving off registration fee if property was purchased on woman’s name, he discussed that with me and showed his desire to buy the house on my name. I agreed with the idea and immediately gave my consent for purchasing the house on my name.
Fig 5: For What Purpose the Property was purchased?
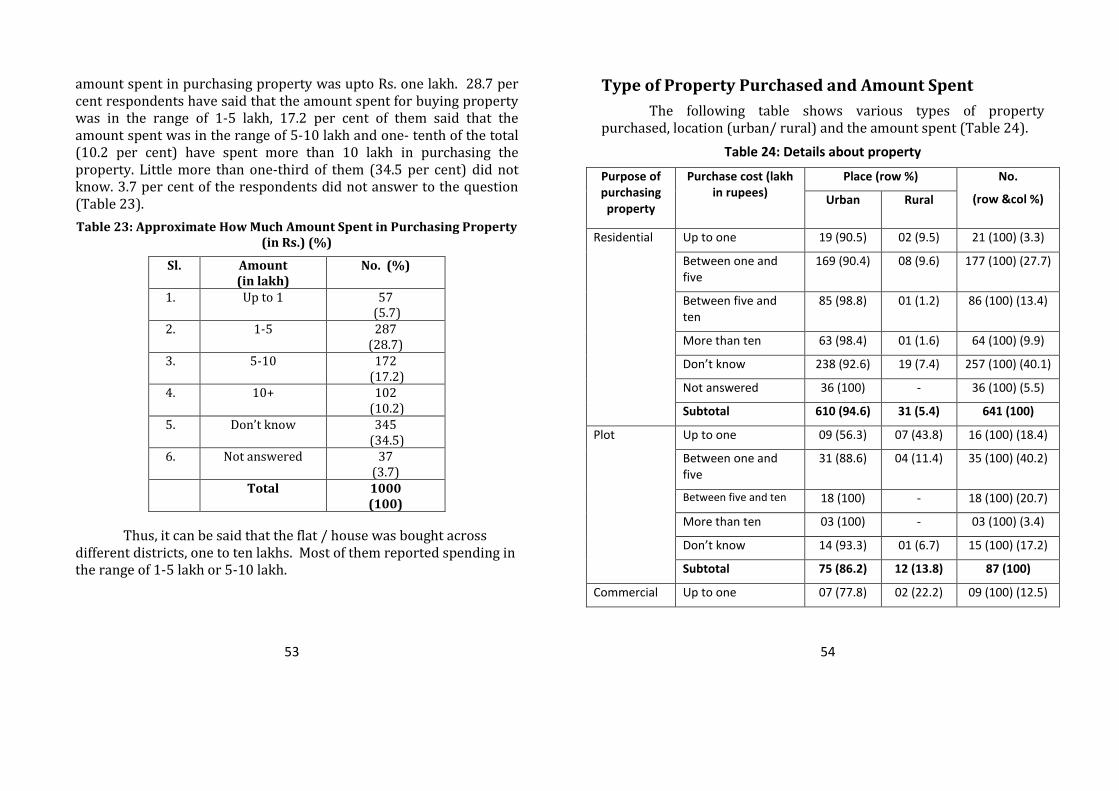
In response to a question about amount spent for buying property, the amount varies between one lakh to ten lakhs, as shown in table no. 23. Only few respondents (5.7 per cent) said that the
53 54
amount spent in purchasing property was upto Rs. one lakh. 28.7 per cent respondents have said that the amount spent for buying property was in the range of 1-5 lakh, 17.2 per cent of them said that the amount spent was in the range of 5-10 lakh and one- tenth of the total (10.2 per cent) have spent more than 10 lakh in purchasing the property. Little more than one-third of them (34.5 per cent) did not know. 3.7 per cent of the respondents did not answer to the question (Table 23).
Table 23: Approximate How Much Amount Spent in Purchasing Property (in Rs.) (%)
Sl. Amount (in lakh)
No. (%)
1. Up to 1 57 (5.7)
2. 1-5 287 (28.7)
3. 5-10 172 (17.2)
4. 10+ 102 (10.2)
5. Don’t know 345 (34.5)
6. Not answered 37 (3.7)
Total 1000 (100)
Thus, it can be said that the flat / house was bought across different districts, one to ten lakhs. Most of them reported spending in the range of 1-5 lakh or 5-10 lakh.
Type of Property Purchased and Amount Spent
The following table shows various types of property purchased, location (urban/ rural) and the amount spent (Table 24).
Table 24: Details about property
Purpose of purchasing property
Purchase cost (lakh in rupees)
Place (row %) No.
(row &col %) Urban Rural
Residential Up to one 19 (90.5) 02 (9.5) 21 (100) (3.3)
Between one and five
169 (90.4) 08 (9.6) 177 (100) (27.7)
Between five and ten
85 (98.8) 01 (1.2) 86 (100) (13.4)
More than ten 63 (98.4) 01 (1.6) 64 (100) (9.9)
Don’t know 238 (92.6) 19 (7.4) 257 (100) (40.1)
Not answered 36 (100) - 36 (100) (5.5)
Subtotal 610 (94.6) 31 (5.4) 641 (100)
Plot
Up to one 09 (56.3) 07 (43.8) 16 (100) (18.4)
Between one and five
31 (88.6) 04 (11.4) 35 (100) (40.2)
Between five and ten 18 (100) - 18 (100) (20.7)
More than ten 03 (100) - 03 (100) (3.4)
Don’t know 14 (93.3) 01 (6.7) 15 (100) (17.2)
Subtotal 75 (86.2) 12 (13.8) 87 (100)
Commercial Up to one 07 (77.8) 02 (22.2) 09 (100) (12.5)

55 56
/dispensary/ cattle shed
Between one and five
31 (93.9) 02 (6.1) 33 (100) (45.8)
Between five and ten
15 (88.2) 02 (11.8) 17 (100) (23.6)
More than ten 05 (100) - 05 (100) (6.9)
Don’t know 08 (100) - 08 (100) (11.1)
Subtotal 66 (91.7) 06 (8.3) 72 (100)
Agriculture Up to one 03 (33.3) 06 (66.7) 09 (100) (8.9)
Between one and five
15 (65.2) 08 (34.8) 23 (100) (22.8)
Between five and ten
10 (100) - 10 (100) (9.9)
More than ten 08 (88.9) 01 (11.1) 09 (100) (8.9)
Don’t know 29 (59.2) 20 (40.8) 49 (100) (48.5)
Not answered 01 (100) - 01 (100) (1.0)
Subtotal 66 (65.3) 35 (34.7) 101 (100)
Not answered
Up to one 18 (94.7) 01 (5.3) 19 (100) (19.2)
Between one and five
37 (97.7) 01 (2.3) 38 (100) (38.4)
Between five and ten
23 (95.8) 01 (4.2) 24 (100) (24.2)
More than ten 02 (100) - 2 (100) (2.02)
Don’t know 16 (100) - 16 (100) (16.2)
Subtotal 96 (97.0) 03 (3.0) 99 (100.02)
Of total 641 respondents who bought property for house/flat that is for the residential purpose, 3.3 per cent bought it within one lakh; 27.7 per cent spent Rs one to five lakh; 13.4 per cent spent in the range of Rs 5-10 lakh; 9.9 per cent spent more than Rs 10 lakh; 40.1 per cent did not know the price and 5.5 per cent have not answered the question.
Of total 87 respondents who bought house plot, 18.4 per cent bought it within one lakh; two-fifth of them (40.2 per cent) spent Rs one to five lakh; 20.7 per cent spent Rs five to ten lakh; 3.4 per cent spent more than Rs 10 lakh; 17.2 per cent of them did not know the price.
Of total 72 respondents who bought property for commercial purpose such as shop, dispensary, 12.5 per cent bought it within one lakh; 45.8 per cent spent Rs one to five lakh; little less than one- fourth of them (23.6 per cent) spent Rs five to ten lakh; 6.9 per cent spent more than Rs 10 lakh; little more than one- tenth of them (11.1 per cent) did not know the price.
Of total 101 respondents who bought property for agriculture purpose, little less than one-tenth of them (8.9 per cent) bought it within one lakh; little less than one- fourth of them (22.8 per cent) spent Rs one to five lakh; one- tenth of them (9.9 per cent) spent Rs five to ten lakh; 8.9 per cent spent more than Rs ten lakh. Around half of them (48.5 per cent) did not know the price and 1 per cent have not answered the question.
Of total 99 respondents who bought property but have not answered the question, around one- fifth of them (19.2 per cent) bought it within one lakh; little less than two- fifth of them (38.4 per cent) spent Rs one to five lakh; around one- fourth of them (24.2 per cent) spent Rs five to ten lakh; only few of them (2.02 per cent) spent

57 58
more than Rs 10 lakh; and 16.2 per cent respondents did not know the price.
Above data analysis reveals that most of the respondents have purchased residents following by residential plots, commercial plots and agricultural plot. Most of these respondents spent in the range of Rs. 1- lakh or 5-10 lakh. Respondents spending less than one lakh or more than ten lakh were lesser in number.
What was the proportion of contribution towards purchase of the property?
In response to the question, ‘What was the proportion of contribution towards purchase of the property?’, the proportion varied between 1 to 100 per cent, as shown in table no. 25.
Table 25: Proportion of Your Contribution (in %)
Sl. Proportion of Contribution (in %) No. ( %) 1. Up to 20 173
(17.3) 2. 21 – 40 59
(5.9) 3. 41 – 60 50
(5.0) 4. 61 – 80 74
(7.4) 5. 81 – 100 183
(18.3) 1. Don’t know 461
(46.1) Total 1000
(100)
Out of 539 respondent, around one-third of them (33 per cent) (94.2 per cent from urban and 5.8 per cent from rural area) paid up to 20 per cent, one- tenth of the respondents (10.9 per cent) (all from urban area) paid 21 to 40 per cent, around another one- tenth of them (9.3 per cent) (94 per cent from urban and 6 per cent from rural area) paid 41 to 60 per cent, 13.7 per cent respondents (94.6 per cent from urban and 5.4 from rural area) paid 61 to 80 per cent and 34 per cent respondents (92.9 per cent from urban and 7.1 per cent from rural area) paid 81 to 100 per cent. Of total 1,000 respondents, 46.1 per cent did not know the amount of contribution. Notably, most of the women respondents (17.3 per cent) reported contributing upto 20 per cent of the total amount and 18.3 per cent reported contributing 81-100 per cent.
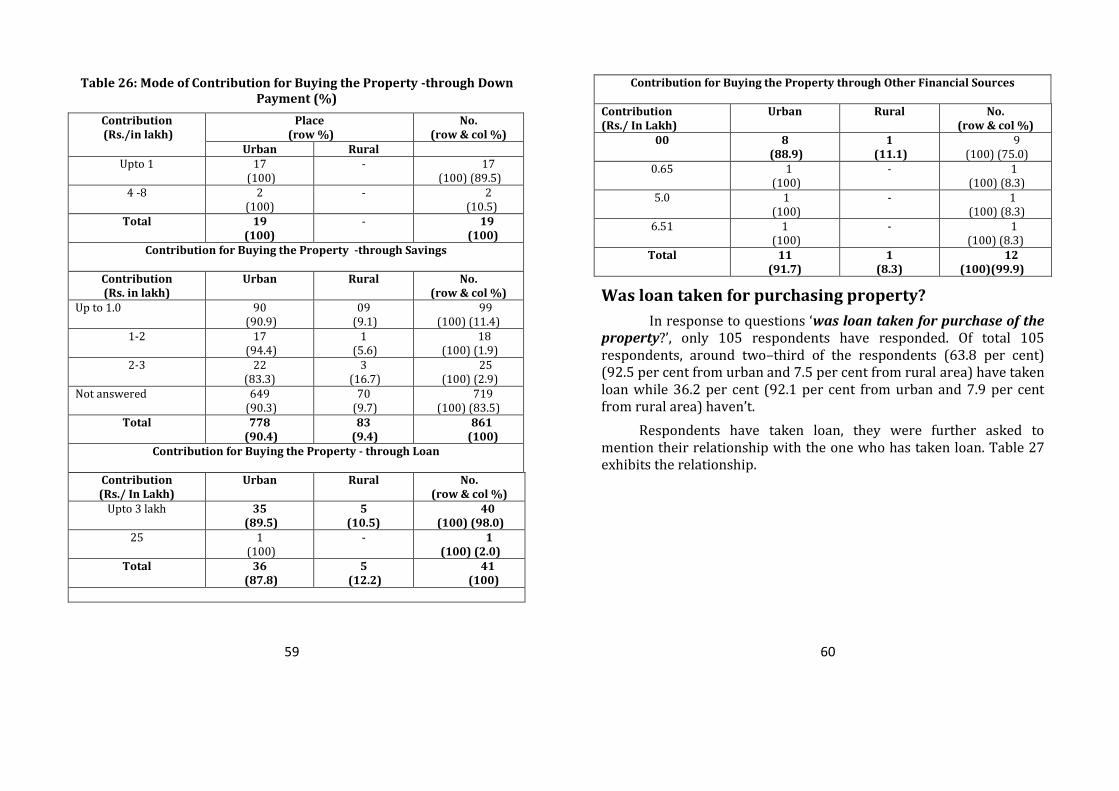
In response to the question, ‘how have you contributed to the amount for purchase of property? – through down payment, saving and loan, etc’, the responses and amount varies, which is shown in the following table no. 26.
Of total 933 respondents, 2 per cent have made down payment and all of them were from urban areas. Most of them (89.5 per cent) reported down payment upto 1.0 lakh. Remaining one-tenth of them (10.5 per cent) made down payment in the range of 4-8 lakh. 92.2 per cent have contributed from their saving. Saving was in the range of 1-3 lakhs. 4.4 per cent of the respondents have taken loan and 1.3 per cent has managed from other sources. Respondents who contributed through other sources, except one, all were from urban area (Table 26).
59 60
Table 26: Mode of Contribution for Buying the Property -through Down Payment (%)
Contribution (Rs./in lakh)
Place (row %)
No. (row & col %)
Urban Rural Upto 1 17
(100) - 17
(100) (89.5) 4 -8 2
(100) - 2
(10.5) Total 19
(100) - 19
(100) Contribution for Buying the Property -through Savings
Contribution (Rs. in lakh)
Urban Rural No. (row & col %)
Up to 1.0 90 (90.9)
09 (9.1)
99 (100) (11.4)
1-2 17 (94.4)
1 (5.6)
18 (100) (1.9)
2-3 22 (83.3)
3 (16.7)
25 (100) (2.9)
Not answered 649 (90.3)
70 (9.7)
719 (100) (83.5)
Total 778 (90.4)
83 (9.4)
861 (100)
Contribution for Buying the Property - through Loan
Contribution (Rs./ In Lakh)
Urban Rural No. (row & col %)
Upto 3 lakh 35 (89.5)
5 (10.5)
40 (100) (98.0)
25 1 (100)
- 1 (100) (2.0)
Total 36 (87.8)
5 (12.2)
41 (100)
Contribution for Buying the Property through Other Financial Sources
Contribution (Rs./ In Lakh)
Urban Rural No. (row & col %)
00 8 (88.9)
1 (11.1)
9 (100) (75.0)
0.65 1 (100)
- 1 (100) (8.3)
5.0 1 (100)
- 1 (100) (8.3)
6.51 1 (100)
- 1 (100) (8.3)
Total 11 (91.7)
1 (8.3)
12 (100)(99.9)
Was loan taken for purchasing property?
In response to questions ‘was loan taken for purchase of the property?’, only 105 respondents have responded. Of total 105 respondents, around two–third of the respondents (63.8 per cent) (92.5 per cent from urban and 7.5 per cent from rural area) have taken loan while 36.2 per cent (92.1 per cent from urban and 7.9 per cent from rural area) haven’t.
Respondents have taken loan, they were further asked to mention their relationship with the one who has taken loan. Table 27 exhibits the relationship.

61 62
Table 27: Relationship with Family Members who has Taken Loan
Relation with loan taker
Place (row %) No. (row & col %) Urban Rural
Husband 54 (93.1)
4 (6.9)
58 (100) (55.2)
Father / Brother/ Son 6 (100)
- 6 (100) (5.7)
Sister - 1 (100)
01 (100) (1.0)
Others 2 (100)
- 02 (100) (1.9)
Not answered 35 (92.1)
3 (7.9)
38 (100) (36.2)
Total 97 (92.4)
8 (7.6)
105 (100)
Of total 105, loan was taken mainly in urban area by the male members of the family (62.9 per cent) except in 1.0 per cent cases from rural area; a woman has taken loan, unlike by husband, father or brother. 36.2 per cent respondents have not answered to the question. Of total 66 respondents, little more than half of the respondents (51.5 per cent) were from Ahmadabad district, one- third of them (33.3 per cent) were from Surat district and 15.2 per cent were from Rajkot district.
Out of 105 respondents, majority of them (69.4 them) (94.3 per cent from urban and 5.7 per cent from rural area) took loan for purchase of residence, little more than one –tenth of them (12.2 per cent) each for investment and other purpose, 5.1 per cent for agriculture and 1.0 per cent for cattle shed (from rural area). Of total 105 cases, more than one- third of them (36.2 per cent) have not answered the question.
Of the 68 respondents who have taken loan for residential purpose, little more than two- fifth of them (42.6 per cent) belonged to nuclear family and more than half of the total (54.4 per cent) from joint family while no details were available about 2.9 per cent respondents. It was across all the age-groups in urban areas; majority of them from age-group of 36 to 60 years. These respondents belonged to all categories of education, that is, illiterate to graduates and also with professional education as well as all the occupational categories.
Majority of the respondents have reported annual income about a lakh. Barring 4.4 per cent Scheduled Castes respondents from urban areas and 2.9 per cent Scheduled Tribes (50 per cent each from urban and rural area), the loan was taken largely by the general category and Other Backward Castes.
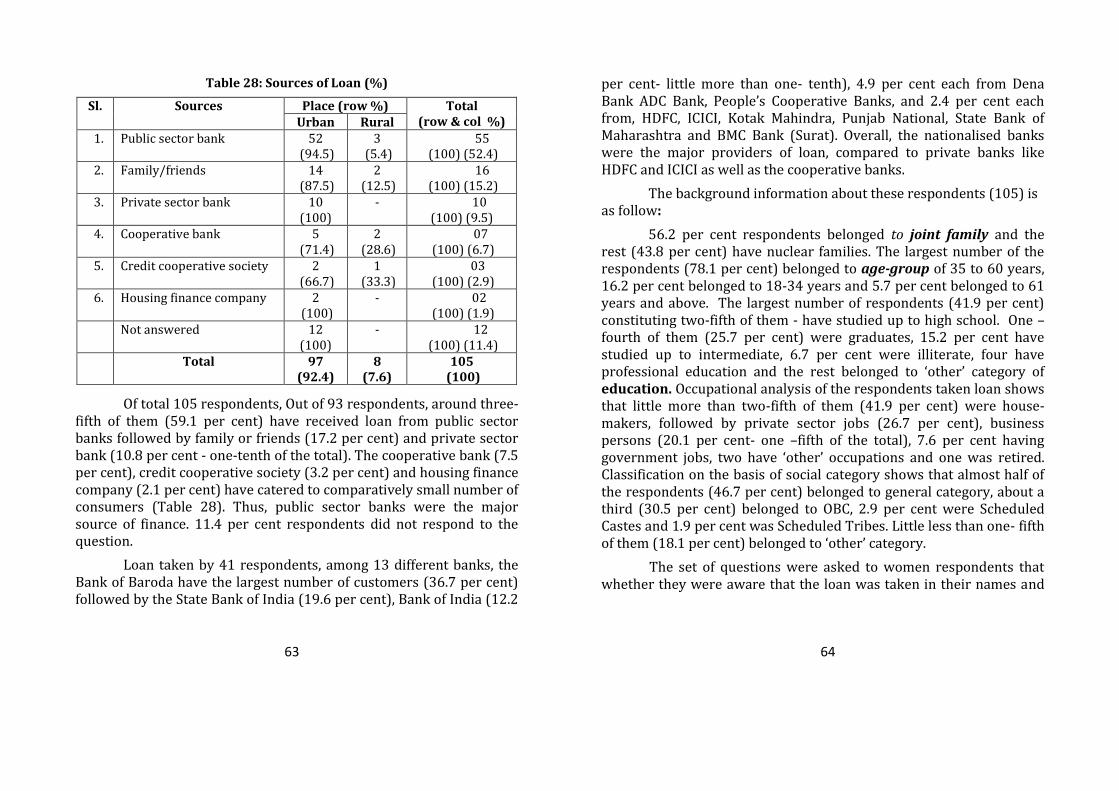
In response to the question ‘who provided loan?’, the following sources of loan provider were shared.
63 64
Table 28: Sources of Loan (%)
Sl. Sources Place (row %) Total (row & col %) Urban Rural
1. Public sector bank 52 (94.5)
3 (5.4)
55 (100) (52.4)
2. Family/friends 14 (87.5)
2 (12.5)
16 (100) (15.2)
3. Private sector bank 10 (100)
- 10 (100) (9.5)
4. Cooperative bank 5 (71.4)
2 (28.6)
07 (100) (6.7)
5. Credit cooperative society 2 (66.7)
1 (33.3)
03 (100) (2.9)
6. Housing finance company 2 (100)
- 02 (100) (1.9)
1. Not answered 12 (100)
- 12 (100) (11.4)
Total 97 (92.4)
8 (7.6)
105 (100)
Of total 105 respondents, Out of 93 respondents, around three- fifth of them (59.1 per cent) have received loan from public sector banks followed by family or friends (17.2 per cent) and private sector bank (10.8 per cent - one-tenth of the total). The cooperative bank (7.5 per cent), credit cooperative society (3.2 per cent) and housing finance company (2.1 per cent) have catered to comparatively small number of consumers (Table 28). Thus, public sector banks were the major source of finance. 11.4 per cent respondents did not respond to the question.
Loan taken by 41 respondents, among 13 different banks, the Bank of Baroda have the largest number of customers (36.7 per cent) followed by the State Bank of India (19.6 per cent), Bank of India (12.2
per cent- little more than one- tenth), 4.9 per cent each from Dena Bank ADC Bank, People’s Cooperative Banks, and 2.4 per cent each from, HDFC, ICICI, Kotak Mahindra, Punjab National, State Bank of Maharashtra and BMC Bank (Surat). Overall, the nationalised banks were the major providers of loan, compared to private banks like HDFC and ICICI as well as the cooperative banks.
The background information about these respondents (105) is as follow:
56.2 per cent respondents belonged to joint family and the rest (43.8 per cent) have nuclear families. The largest number of the respondents (78.1 per cent) belonged to age-group of 35 to 60 years, 16.2 per cent belonged to 18-34 years and 5.7 per cent belonged to 61 years and above. The largest number of respondents (41.9 per cent) constituting two-fifth of them - have studied up to high school. One –fourth of them (25.7 per cent) were graduates, 15.2 per cent have studied up to intermediate, 6.7 per cent were illiterate, four have professional education and the rest belonged to ‘other’ category of education. Occupational analysis of the respondents taken loan shows that little more than two-fifth of them (41.9 per cent) were house-makers, followed by private sector jobs (26.7 per cent), business persons (20.1 per cent- one –fifth of the total), 7.6 per cent having government jobs, two have ‘other’ occupations and one was retired. Classification on the basis of social category shows that almost half of the respondents (46.7 per cent) belonged to general category, about a third (30.5 per cent) belonged to OBC, 2.9 per cent were Scheduled Castes and 1.9 per cent was Scheduled Tribes. Little less than one- fifth of them (18.1 per cent) belonged to ‘other’ category.
The set of questions were asked to women respondents that whether they were aware that the loan was taken in their names and

65 66
details about loan, whether they faced difficulties in getting loan approved, terms of loan repayment, plan of loan repayment, etc. Out of total 105 respondents around two-fifth of them (39 per cent) (92.7 per cent from urban and 7.3 per cent from rural area) said that they were aware of and 3.8 per cent said they were not aware of. Large numbers of the respondents (57.1 per cent) have not answered to the question (Table 29).
Table 29: Awareness that Loan is taken in Your Name?
Response Place (row %) Total (row & col %) Urban Rural
Yes 38 (92.7)
3 (7.3)
41 (100) (39.0)
No 4 (100)
- 4 (100) (3.8)
Not answered 55 (91.7)
5 (8.3)
60 (100) (57.1)
Total 97 (92.4)
08 (7.6)
105 (99.9)
The 41 respondents aware about the loan taken most of them belonged to Ahmadabad (46.3 per cent) followed by Surat (36.6 per cent); and Rajkot district (17.1 per cent).
However, 71 respondents provided details about how much loan were taken – one –fourth of them (25.4 per cent) (77.8 per cent from urban and 22.2 per cent from rural area) have taken loan up to one lakh, One- third of them (33.8 per cent) (95.8 per cent urban and 4.2 per cent from rural area) have taken loan between one and five lakh, 25.4 per cent (all from urban area) have taken loan between five to ten; 15.5 per cent of them told that the loan was taken in the range of ten lakh or more respectively (Table 30).
Table 30: Amount of Loan as Known to Respondents
Amount (Rs./in lakh)
Place (row %) No. (row & col %)
Urban Rural Up to 1 14
(77.8) 4
(22.2) 18
(100) (17.1) 1-5 23
(95.8) 1
(4.2) 24
(100) (22.9) 5-10 18
(100) - 18
(100) (17.1) 10+ 11
(100) - 11
(100) (10.5) Not answered 31
(91.2) 3
(8.8) 34
(100) (32.4) Total 97
(92.4) 08
(7.6) 105
(100)
Occupational status of respondents who have taken loan is as follow: 8.6 per cent were house-makers, 7.6 per cent business persons, 1.9 per cent respondents having jobs in private sector and 0.95 per cent in government job. 6.7 per cent of each belonged to general category and OBC and the rest belonged to ‘others’ category across all the three districts. Majority of them were Hindu and one was Jain.
Rate of Interest
Regarding rate on interest of loan, out of 105 respondents, little more than three- fifth of them (61 per cent) (92.2 per cent from urban and 7.8 per cent from rural area) responded. Rate of interest varies from 1.5 per cent to 18 per cent a year. Thus, of total 64 respondents –one-fourth of them (25 per cent) respondents informed interest rate between 1.5 to 5 per cent, two-fifth of them (41 per cent) informed interest rate between 5.1 to 10 per cent, and little more than

67 68
one- third respondents (34 per cent) informed interest rate more than 10.1 to 18 per cent. 39 per cent respondents didn’t answer the question (Table 31).
Table 31: Rate of Interest of Loan
Loan – rate of interest (in %)
Place (row %)
Total (row & col %)
Urban Rural Between 1.5 - 5 14
(87.5) 2
(12.5) 16
(100) (15.2) Between 5.1 - 10 24
(92.3) 2
(7.7) 26
(100) (24.8) Between 10.1 to 18 21
(95.4) 1
(4.8) 22
(99.9) (21.0) Not answered 38
(92.7) 3
(7.3) 41
(100) (39.0) Total 97
(92.4) 8
(7.6) 105
(99.9)
Thus, it may be said that in majority of the cases, interest rate was in the rate of 5.1- 10 per cent or 10.1- 18 per cent.
Regarding type of interest, of total 105, 62 per cent responded the question. 80.6 per cent (94 per cent from urban and 6 per cent from rural area), across all three districts said it was fixed rate of interest while around one- fifth of them (19.4 per cent) all from urban area have chosen floated rate of interest. 41 per cent respondents have not answered the question (Table 32).
Table 32: Type of Loan
Type of loan Place (row %) Total (row & col %) Urban Rural
Fixed 47 (94.0)
3 (6.0)
50 (100) (47.6)
Floating 12 (100)
- 12 (100) (11.4)
Not answered 38 (88.4)
5 (11.6)
43 (100) (41.0)
Total 97 (92.4)
8 (7.6)
105 (100)
Respondents were asked whether they faced any difficulty in getting loan approval, out of total, little less than one- fifth of them (19 per cent) (95 per cent from urban and 5 per cent from rural area) told that they faced difficulties, across all the three districts while remaining 81 per cent (91.8 per cent from urban and 8.2 per cent from rural area) did not face problem (Table 33).
Table 33: Experienced any Difficulty in Getting Loan?
Response Urban Rural No. Yes 19
(95.0) 1
(5.0) 20
(100) (19.0) No 78
(91.8) 7
(8.2) 85
(100) (81.0) Total 97
(92.4) 8
(7.6) 105 (100)
Total 12 respondents have reported collateral along with the loan for purchase of property, across all three districts. Remaining 92 of the respondents did not take loan on collateral (Table 34).

69 70
Table 34: Any Collateral for Loan?
Response Urban Rural No. Yes 11
(91.7) 1
(8.3) 12
(100) (11.5) No 85
(91.4) 7
(7.6) 92
(100) (88.5) Total 96
(92.4) 8
(7.6) 104
(100)
One-fourth of the respondents (25.7 per cent) told that the monthly instalment for loan was upto Rs. 5000/-. Around one-fifth of them (19 per cent) told that it was in the range of Rs. 5001-10,000/-; and little more than one –tenth of them (12.4 per cent) have said it was more than 10,000/-. 42.9 per cent respondents did not answer the question. Thus, in majority of the cases, monthly instalment for loan repayment was Rs. 5000/- (Table 35)
Table 35: Monthly Instalment of Loan Payment
Response Urban Rural No. Up to Rs 5,000 26
(96.3) 1
(3.7) 27
(100) (25.7) Rs 5,001 - 10,000 19
(95.0) 1
(5.0) 20
(100) (19.0) >Rs 10,001 13
(100) - 13
(100) (12.4) Not answered 39
(86.7) 6
(13.3) 45
(100) (42.9) Total 97
(92.4) 08
(7.6) 105
(100)
The repayment of loan includes number of years within which loan has to repay and monthly instalment. Thus, 62
respondents informed that the loan was taken for term of one year to twenty years. Of total 62 respondents, most of them (54.8 per cent) informed that the loan was taken for one to five years; little more than one- tenth of them (12.9 per cent) have taken it for up to 10 years; and around one- third of them (32.3 per cent) have taken loan for up to 20 years. Little more than two- fifth of them (41 per cent) have not answered the question. Thus, in most of the cases, period for loan repayment was in the range of 1-5 years (Table 36).
Table 36: Period for Loan Repayment (in Years)
Years of Loan Urban Rural No. One to five years 31
(91.2) 3
(8.8) 34
(100) (32.4) Five to ten years 08
(100) - 8
(100) (7.6) Ten to twenty years
20 (100)
- 20 (100) (19.0)
Not answered 38 (88.4)
5 (11.6)
43 (41.0) (100)
Total 97 (92.4)
08 (7.6)
105 (100)
Classification based on social category and problems faced in taking loan reveals that 6.7 per cent of each belonged to general category and Other Backward Category and the rest belonged to ‘others’ category across all the three districts. Majority of them were Hindu and one was Jain.
In response to the question, ‘how have you plan to repay loan?’, different sources and ways of repaying loan were shared by the respondents, such as, from income of self or of the spouse or parents’,
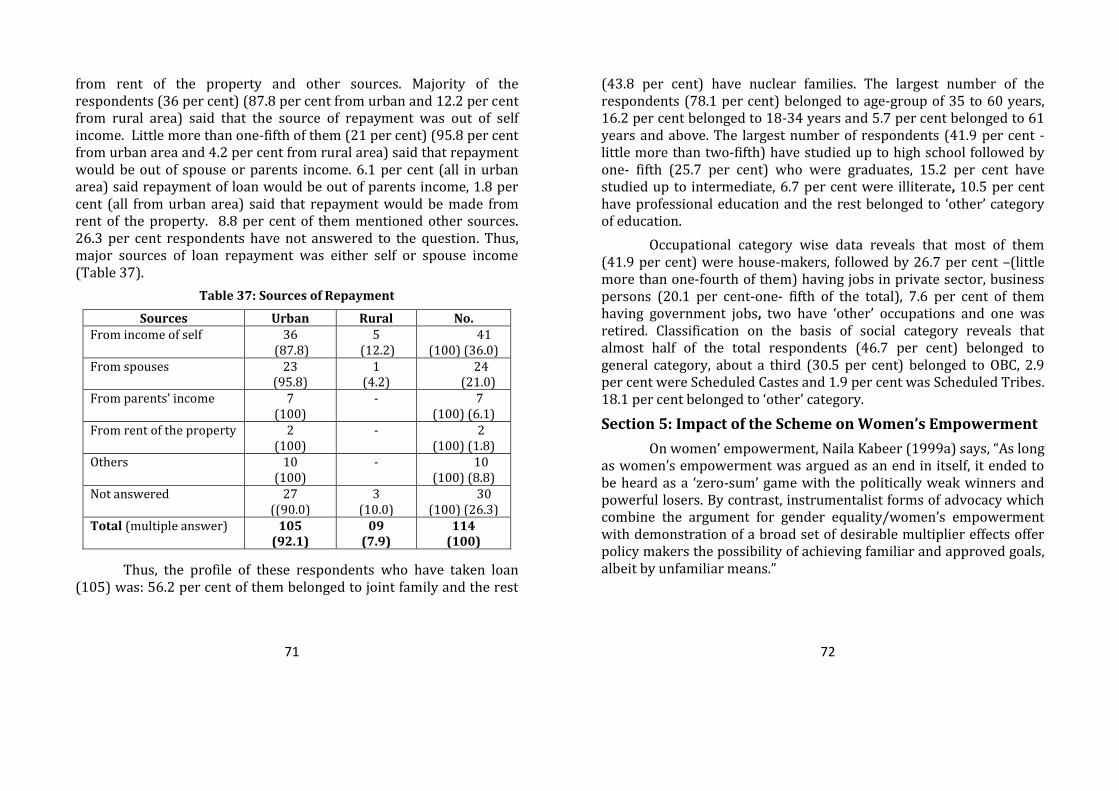
71 72
from rent of the property and other sources. Majority of the respondents (36 per cent) (87.8 per cent from urban and 12.2 per cent from rural area) said that the source of repayment was out of self income. Little more than one-fifth of them (21 per cent) (95.8 per cent from urban area and 4.2 per cent from rural area) said that repayment would be out of spouse or parents income. 6.1 per cent (all in urban area) said repayment of loan would be out of parents income, 1.8 per cent (all from urban area) said that repayment would be made from rent of the property. 8.8 per cent of them mentioned other sources. 26.3 per cent respondents have not answered to the question. Thus, major sources of loan repayment was either self or spouse income (Table 37).
Table 37: Sources of Repayment
Sources Urban Rural No. From income of self 36
(87.8) 5
(12.2) 41
(100) (36.0) From spouses 23
(95.8) 1
(4.2) 24
(21.0) From parents’ income 7
(100) - 7
(100) (6.1) From rent of the property 2
(100) - 2
(100) (1.8) Others 10
(100) - 10
(100) (8.8) Not answered 27
((90.0) 3
(10.0) 30
(100) (26.3) Total (multiple answer) 105
(92.1) 09
(7.9) 114
(100)
Thus, the profile of these respondents who have taken loan (105) was: 56.2 per cent of them belonged to joint family and the rest
(43.8 per cent) have nuclear families. The largest number of the respondents (78.1 per cent) belonged to age-group of 35 to 60 years, 16.2 per cent belonged to 18-34 years and 5.7 per cent belonged to 61 years and above. The largest number of respondents (41.9 per cent -little more than two-fifth) have studied up to high school followed by one- fifth (25.7 per cent) who were graduates, 15.2 per cent have studied up to intermediate, 6.7 per cent were illiterate, 10.5 per cent have professional education and the rest belonged to ‘other’ category of education.
Occupational category wise data reveals that most of them (41.9 per cent) were house-makers, followed by 26.7 per cent –(little more than one-fourth of them) having jobs in private sector, business persons (20.1 per cent-one- fifth of the total), 7.6 per cent of them having government jobs, two have ‘other’ occupations and one was retired. Classification on the basis of social category reveals that almost half of the total respondents (46.7 per cent) belonged to general category, about a third (30.5 per cent) belonged to OBC, 2.9 per cent were Scheduled Castes and 1.9 per cent was Scheduled Tribes. 18.1 per cent belonged to ‘other’ category.
Section 5: Impact of the Scheme on Women’s Empowerment
On women’ empowerment, Naila Kabeer (1999a) says, “As long as women’s empowerment was argued as an end in itself, it ended to be heard as a ‘zero-sum’ game with the politically weak winners and powerful losers. By contrast, instrumentalist forms of advocacy which combine the argument for gender equality/women’s empowerment with demonstration of a broad set of desirable multiplier effects offer policy makers the possibility of achieving familiar and approved goals, albeit by unfamiliar means.”

73 74
One of the important objectives of the present study was to find-out whether property ownership by women enables to empower them. A question to record changes in the women property owners’ lives was to be recorded. The impact of property ownership in women’s empowerment was assessed on various parameters. This set of questions delve into decision-making for purchase of property, whether women have other properties in their names, how she earned the property, whether the property was managed through ‘power of attorney’, whether the property was in joint name –if yes, with whom and whether this property was sold – women’s consent in selling of property, reasons for selling it off, if sold, etc. and changes observed in women’s lives with purchase of property. Data analysis reveals following results:
1. Social changes
Of total 1,000 respondents, majority of them (82.3 per cent) (90.6 per cent from urban and 9.4 per cent from rural area) have told that the changes have taken place on social aspect. 10.3 per cent said that no changes have taken place. Remaining 7.4 per cent (93.2 per cent from urban areas and 6.8 per cent from rural) have not responded.
2. Economic changes
Of total 1,000 respondents, almost three-fourth of them, 72.2 per cent responded (93.1 per cent from urban and 6.9 per cent from rural area) saying ‘yes’, 3 per cent (83.3 from urban and 16.7 per cent from rural area across all the districts) responded saying ‘no’, 13.4 per cent of them (97.1 per cent from urban and 2.9 per cent from rural area) said ‘status quo’ and 11.4 per cent (75.4 per cent from urban and 24.6 per cent from rural area) have not responded.
3. Changes in personal life
Of total 1,000 respondents, almost two-thirds of them, 71 per
cent responded (94.2 per cent from urban and 5.8 per cent from rural
area across all the districts) saying ‘yes’, 1.9 per cent (84.2 per cent
from urban and 15.8 per cent from rural area) responded saying ‘no’,
14.5 per cent (93.8 per cent from urban and 6.2 per cent from rural
area) said ‘status quo’ and 12.6 per cent (73 per cent from urban and
27 per cent from rural area) have not responded.
Thus, it could be said that regarding changes in different
spheres of life of the women respondents after buying the property,
overall more than 70 per cent of them have told that socially (82.3 per
cent), economically (72.2 per cent) and personal (71 per cent) there
were positive changes in their lives. Almost 7 per cent to 13 per cent of
the respondents said that there was no change.
Do you think that you can sell the property without asking anyone?
In response to question, ‘do you think that you can sell the
property without asking anyone?’, of total 1,000 respondents, 592
respondents, majority of them (69.1 per cent) (92.6 per cent from
urban and 7.4 per cent from rural area) informed that they could not
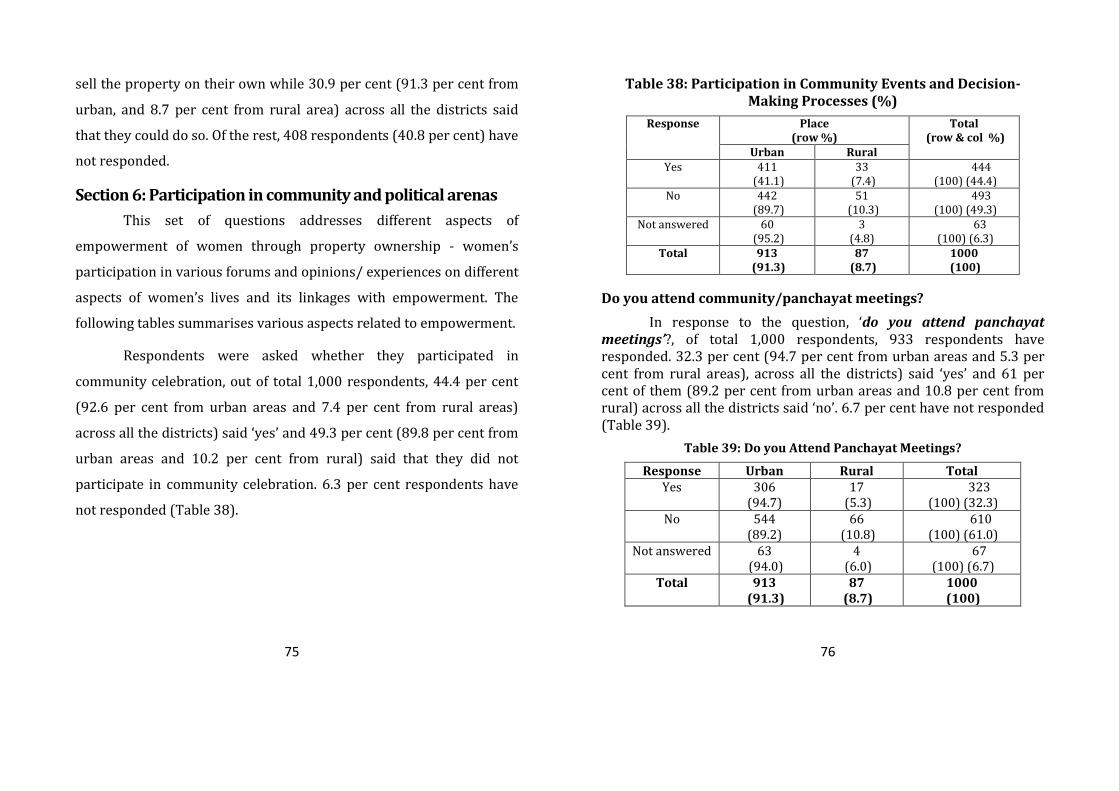
75 76
sell the property on their own while 30.9 per cent (91.3 per cent from
urban, and 8.7 per cent from rural area) across all the districts said
that they could do so. Of the rest, 408 respondents (40.8 per cent) have
not responded.
Section 6: Participation in community and political arenas
This set of questions addresses different aspects of
empowerment of women through property ownership - women’s
participation in various forums and opinions/ experiences on different
aspects of women’s lives and its linkages with empowerment. The
following tables summarises various aspects related to empowerment.
Respondents were asked whether they participated in
community celebration, out of total 1,000 respondents, 44.4 per cent
(92.6 per cent from urban areas and 7.4 per cent from rural areas)
across all the districts) said ‘yes’ and 49.3 per cent (89.8 per cent from
urban areas and 10.2 per cent from rural) said that they did not
participate in community celebration. 6.3 per cent respondents have
not responded (Table 38).
Table 38: Participation in Community Events and Decision-Making Processes (%)
Response Place (row %)
Total (row & col %)
Urban Rural Yes 411
(41.1) 33
(7.4) 444
(100) (44.4) No 442
(89.7) 51
(10.3) 493
(100) (49.3) Not answered 60
(95.2) 3
(4.8) 63
(100) (6.3) Total 913
(91.3) 87
(8.7) 1000
(100)
Do you attend community/panchayat meetings?
In response to the question, ‘do you attend panchayat meetings’?, of total 1,000 respondents, 933 respondents have responded. 32.3 per cent (94.7 per cent from urban areas and 5.3 per cent from rural areas), across all the districts) said ‘yes’ and 61 per cent of them (89.2 per cent from urban areas and 10.8 per cent from rural) across all the districts said ‘no’. 6.7 per cent have not responded (Table 39).
Table 39: Do you Attend Panchayat Meetings?
Response Urban Rural Total Yes 306
(94.7) 17
(5.3) 323
(100) (32.3) No 544
(89.2) 66
(10.8) 610
(100) (61.0) Not answered 63
(94.0) 4
(6.0) 67
(100) (6.7) Total 913
(91.3) 87
(8.7) 1000
(100)
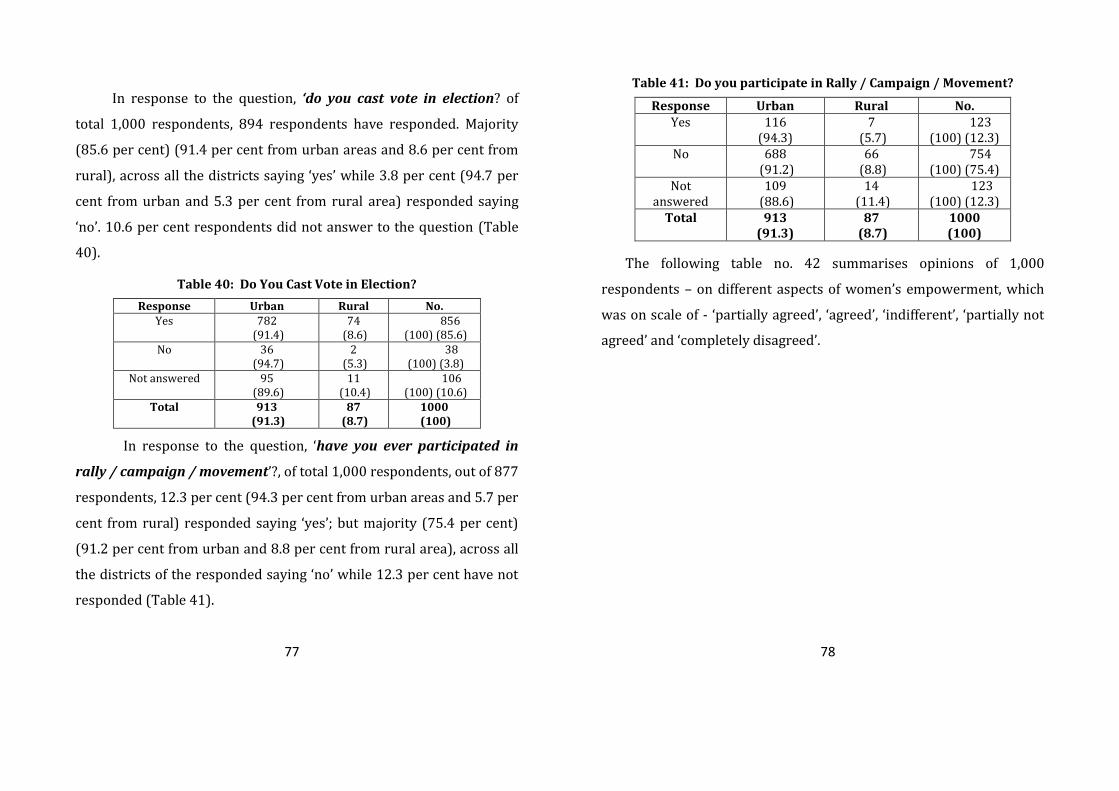
77 78
In response to the question, ‘do you cast vote in election? of
total 1,000 respondents, 894 respondents have responded. Majority
(85.6 per cent) (91.4 per cent from urban areas and 8.6 per cent from
rural), across all the districts saying ‘yes’ while 3.8 per cent (94.7 per
cent from urban and 5.3 per cent from rural area) responded saying
‘no’. 10.6 per cent respondents did not answer to the question (Table
40).
Table 40: Do You Cast Vote in Election?
Response Urban Rural No. Yes 782
(91.4) 74
(8.6) 856
(100) (85.6) No 36
(94.7) 2
(5.3) 38
(100) (3.8) Not answered 95
(89.6) 11
(10.4) 106
(100) (10.6) Total 913
(91.3) 87
(8.7) 1000 (100)
In response to the question, ‘have you ever participated in
rally / campaign / movement’?, of total 1,000 respondents, out of 877
respondents, 12.3 per cent (94.3 per cent from urban areas and 5.7 per
cent from rural) responded saying ‘yes’; but majority (75.4 per cent)
(91.2 per cent from urban and 8.8 per cent from rural area), across all
the districts of the responded saying ‘no’ while 12.3 per cent have not
responded (Table 41).
Table 41: Do you participate in Rally / Campaign / Movement?
Response Urban Rural No. Yes 116
(94.3) 7
(5.7) 123
(100) (12.3) No 688
(91.2) 66
(8.8) 754
(100) (75.4) Not
answered 109
(88.6) 14
(11.4) 123
(100) (12.3) Total 913
(91.3) 87
(8.7) 1000 (100)
The following table no. 42 summarises opinions of 1,000
respondents – on different aspects of women’s empowerment, which
was on scale of - ‘partially agreed’, ‘agreed’, ‘indifferent’, ‘partially not
agreed’ and ‘completely disagreed’.
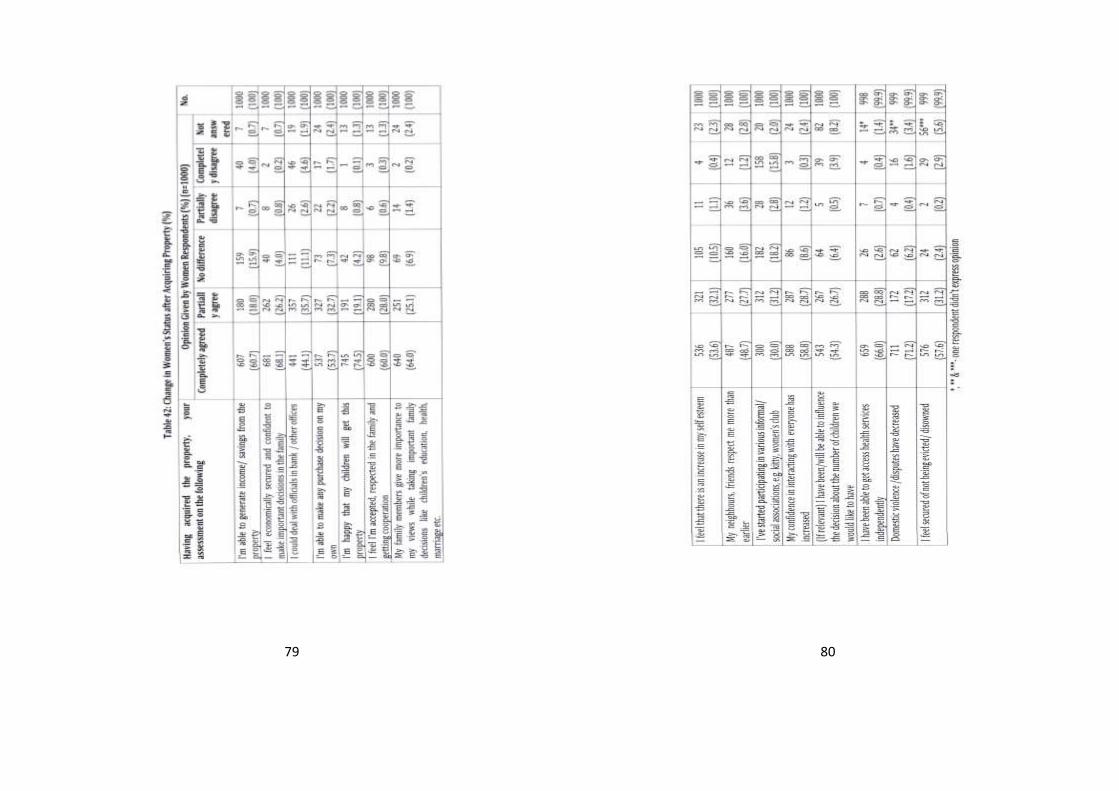
79 80
81 82
i. Able to generate income/savings
Regarding ability to generate income/ savings from the property, 60.7 per cent respondents have ‘strongly agreed’ and 18 per cent have ‘partially agreed’ (total 78.7 per cent). 15.9 per cent respondents said there was ‘no difference’, 4.7 per cent disagreed and 0.7 per cent didn’t answer the question. This indicates that asset ownership enabled women to establish economically. Following narration by Suman residing at Nabraj Darwaja, Sindhi Society in Rajkot district shows how waiving -off in stamp duty enabled her to generate income and become self employed.
My husband did not have any sustainable source of livelihood and we were living in a rented house. Children were growing up and so were the requirements. It was difficult for us to do any economic activity in a rented house. But when we came to know about Gujarat government scheme which has special considerations for women in the form of waiving off stamp duty for women, my husband showed the desire to purchase a flat on my name. I got agreed with that. We bought the flat with whatever small savings we had. After getting possession, we shifted in the new house. Gradually we started preparing snacks and namkeen and sell in the market. We all family members are engaged in this household activity. We have two sons and they go to supply that to the small shopkeepers. Now we have a house and we are able to generate some income also to sustain us. This makes me feel not only confident but economically secured also.
Economically secured and confident to make important decisions
Regarding economic security and confidence to make important decisions in the family, 68.1 per cent respondents have ‘strongly agreed’ and 26.2 per cent have ‘partially agreed’ (total 94.3 per cent). This reveals economic security and its linkages with confidence and stable decision-making by women. 4 per cent respondents said that there was ‘no difference’, 1 per cent of them disagreed and 0.7 per cent didn’t answer the question.
ii. Able to deal with the government/bank officials
With regard to dealing with government or bank officials, 44.1 per cent respondents have ‘strongly agreed’ and 35.7 per cent have ‘partially agreed’ (total 79.8 per cent), which shows that asset ownership enabled about 80 per cent of the women respondents. 11.1 per cent respondents said ‘no difference’, 7.2 per cent ‘disagreed’ and remaining 1.9 per cent didn’t answer the question.
iii. Able to make decision for any purchase
With regard to decision-making for any purchase, 53.7 per cent respondents have ‘strongly agreed’ and 32.7 per cent have ‘partially agreed’ (total 86.4 per cent). This shows that asset ownership enabled to make decisions independently among the respondents. 7.3 per cent respondents said that there was ‘no difference’, 3.9 per cent disagreed and 2.4 per cent didn’t answer the question.
iv. Property will pass on to the children
With regard to securing and passing on property to the children, 74.5 per cent respondents have ‘strongly agreed’, 19.1 per cent have ‘agreed’ (total 93 per cent respondents agreed), which is over-
83 84
whelming response that asset building has not only been for security for the present but also for the better future of the next generation. 4.2 per cent respondents said ‘no difference’, 0.8 per cent respondents ‘disagreed’ and 0.1 per cent were ‘completely disagreed’. 1.3 per cent didn’t answer the question.
v. Get respect and cooperation in the family
With regard to getting cooperation, acceptance and respect in the family, 60 per cent respondents have ‘strongly agreed’, 28.0 per cent have ‘agreed’ (total 88 per cent respondents agreed), which indicates elevated status and having space within the family. 9.8 per cent respondents said that there was ‘no difference’, 0.6 per cent of them partially disagreed and 0.3 per cent of them were ‘completely disagreed’. 1.3 per cent of them didn’t answer the question. In this regard, Kamlaben-a widow from Rajkot district narrates her experience as follow:
I am a poor woman. By dint of hard work I could purchase and register a small house for myself. My children know that after me they would inherit the house therefore, they respect me cooperate me in day to day activities.
vi. Get importance while taking important family decisions
Regarding getting importance for decision-making on various family issues, 64 per cent respondents have ‘strongly agreed’, 25.1 per cent have ‘agreed’ (total 89.1 per cent ‘agreed) that they were recognized by the family members in important decision making. 6.9 per cent said that there was ‘no difference’, 1.4 per cent was ‘partially disagreed’ and 0.2 per cent of them were ‘completely disagreed’. 2.4 per cent did not answer the question.
vii. Increase in self-esteem
With regard to increase in self-esteem, 53.6 per cent respondents have strongly agreed, 32.1 per cent have agreed (total 85.7 per cent responded agreed), which was an indicator of empowerment. 10.5 per cent said that they found ‘no difference’, 1.5 per cent disagreed and 2.3 per cent didn’t answer the question.
Savitaben a young Gujarati woman from a low income group family admits very strongly that her self esteem has increased after acquiring property on her name. She mentions that
My husband is working in a private firm and earns a meager amount. Since I am educated hence, I started conducting tutorial classes for small children. Gradually we started saving some money. We did not have our own house. When we came to know about the scheme of waiving off stamp duty to women property buyers in the state both my husband and myself decided to avail the benefit. We book a small LIG flat and purchased that. She further says that after acquiring property I very much feel that my self esteem has increased in the social circle.
Receiving more respect from neighbours, friends than Earlier
Regarding receiving more respect from neighbours, friends, little less than half of them 48.7 per cent respondents have strongly agreed, 27.7 per cent have agreed (total 76.4 per cent agreed), which confirms a pattern that not only family members but also the extended social circuit and neighbourhood started accepting and respecting them. 16 per cent found ‘no difference’, 4.8 per cent disagreed and 2.8 per cent didn’t answer the question.

85 86
viii. Increased Participation in various Informal social activities
With regard to participation in various social activities, 30 per cent respondents have strongly agreed with this, 31.2 per cent have agreed (total 61.2 per cent respondents agreed); however, 18.2 per cent respondents found ‘no difference’ 2.8 per cent respondents were ‘partially disagreed’ and 15.8 per cent were ‘completely disagreed’. 2 per cent didn’t answer the question.
ix. Increased self confidence in Interacting with People
Regarding increase in self confidence in interacting, 58.8 per cent respondents have ‘strongly agreed’, 28.7 per cent have ‘agreed’ (total 87.5 per cent respondents agreed), which was almost similar to increase in self-esteem, confidence for decision making and confirms process of empowerment. 8.6 per cent respondents found ‘no difference’, 1.5 per cent ‘disagreed’ and 2.4 per cent didn’t answer the question.
x. In Influencing the decisions towards reproductively
Regarding decision-making towards reproductively, 54.3 per cent respondents have ‘strongly agreed’, 26.7 per cent have ‘agreed’ (total about 80 per cent agreed and showed confidence); 6.4 per cent mentioned ‘no difference’, 4.4 per cent said did not agree and 8.2 per cent have not answered. Of total 1,000 respondents, 93.1 per cent were married and the rest (57 widowed, seven single, three separated and two divorced) are not in marriage. In this context, of total 931 married women, 64 (6.9 per cent) have not answered the question, thus out of the rest – 867, 767 (88.6 per cent) have agreed; 59 (6.8 per cent) said ‘no difference’ and 41 (4.5 per cent) have disagreed.
xi. Accessing health services independently
With regard to accessing health services independently, 65.9 per cent respondents have said that they ‘strongly agreed’, 28.8 per cent have said that they ‘agreed’ (total almost 94.8 per cent responded agreed), which was in consonance with increased self-esteem, freedom for decision-making and mobility. 2.8 per cent respondents said that they found ‘no difference’, 1.1 per cent ‘disagreed’ and 1.4 per cent didn’t answer the question.
xii. Domestic violence/disputes decreased
With regard to decrease in domestic violence / disputes, 71.2 per cent respondents have ‘strongly agreed’, 17.2 per cent have ‘agreed’ (total 88.4 per cent agreed). 6.2 per cent respondents said they found ‘no difference’, which was in consonance with opinions expressed above on different matters; 2 per cent ‘disagreed’ and 3.4 per cent didn’t answer the question.
xiii. No threat of being evicted/ disowned
Regarding security that the respondents would to be evicted, 58.8 per cent respondents have ‘strongly agreed’, 28.7 per cent have ‘agreed’ (total 88.8 per cent agreed) and 8.6 per cent respondents said they found ‘no difference’, which shows thin status quo regarding the issue, 1.5 per cent ‘disagreed’ and 2.4 per cent didn’t answer the question.
Thus, based on the above analysis on various aspects related to empowerment, between 61 per cent and 95 per cent, the respondents have agreed, which means almost more than two-thirds have felt positive changes in their lives after owning asset on their name. The portion of ‘no difference’ varies from 2 per cent to 15 per cent and disagreement ranges between one to five per cent, except in one

87 88
matter where disagreement was as high as 15 per cent. This has been corroborated by one of the respondents in Ahmedabad district during household survey.
Payal is a 42 years old woman from Ahmedabad district. She says that
After having house on my name, I feel secured and do not feel threat of being evicted/ disowned.
Section -7: Retention Rate of the Property Registered on Women’s Name
To find out the retention rate of property registered on women’s name following questions were asked and data analysed:
Who Decided the Property should be Registered in Your Name?
In response to the question, ‘who decided the property should be purchased in your name?’, of total 1,000 respondents, the largest number of the respondents 44.1 per cent (94.3 per cent from urban and 5.6 per cent from rural area) said that ‘husband decided’ followed by 37.9 per cent (91 per cent from urban and 9 per cent from rural area) informed that ‘it was their decision’, 13.9 per cent (88.1 per cent from urban and 11.9 per cent from rural area) shared that ‘family members decided’ while 2.2 per cent (81.8 per cent from urban and 18.2 per cent from rural area) informed that it was a joint decision – by husband and wife. The other decision makers were – son (from rural area), father and father-in-law, building developer and a neighbours living in the same society (all from urban area) (0.5 per cent). 1.4 per cent respondents have not responded (Table 43).
Table 43: Who Decided the Property should be purchased in Your Name? (%)
Relationship with the Respondent
Place (row %) No. (row & col %) Urban Rural
Husband 416 (94.3)
25 (5.7)
441 (100) (44.1)
Self 345 (91.0)
34 (9.0)
379 (100) (37.9)
Family members 123 (88.5)
16 (11.5)
139 (100) (13.9)
Both – husband & wife 18 (81.8)
4 (18.2)
22 (100) (2.2)
Others 4 (80.0)
1 (20.0)
05 (100) (0.5)
Not answered 10 (71.4)
4 (28.6)
14 (100) (1.4)
Total 916 (91.6)
84 (8.4)
1000 (100)
Were you involved in negotiations for purchase of property?
In response to the question, ‘were you involved in negotiations for purchase of property’, more than half (58.3 per cent) (90 per cent from urban and 10 per cent from rural area) responded saying ‘yes’, 39.4 per cent of them (95 per cent from urban and 5 per cent from rural area) responded saying ‘no’ and 2.3 per cent of them (60.9 per cent from urban and 39.1 per cent from rural area) haven’t responded (Table 44).

89 90
Table 44: Were You Involved in Negotiating the Deal?
Response Urban Rural No. Yes 525
(90.1) 58
(9.9) 583
(100) (58.3) No 374
(94.9) 20
(5.1) 394
(100) (39.4) Not answered 14
(60.9) 9
(39.1) 23
(100) (2.3) Total 913
(91.3) 87
(8.7) 1000 (100)
In response to the question, ‘had this concession not been there, would this property been purchased in your name?’, the responses of total 1,000 respondents were varied –28.7 per cent (83.3 per cent from urban and 16.7 per cent from rural area) said ‘yes’ and around one- third of them (31.6 per cent) (91.5 per cent from urban and 8.5 per cent from rural area) said ‘no’. About one-third (31.7 per cent) (98.1 per cent from urban and 1.9 per cent from rural area) said ‘can’t say’. 8.0 per cent (92.5 per cent from urban and 7.5 per cent from rural area) haven’t responded (Table 45).
Table 45: Had this Concession not been there, would this property purchased in your name?
Response Urban Rural No. Yes 239
(83.3) 48
(16.7) 287
(100) (28.7) No 289
(91.5) 27
(8.5) 316
(100) (31.6) Can’t say 311
(98.1) 6
(1.9) 317
(100) (31.7) Not answered 74
(92.5) 6
(7.5) 80
(100) (8.0) Total 913
(91.3) 87
(8.7) 1000
(100)
In response to the question, ‘have you ever given power of attorney to any family member?’, of total 1,000 respondents, 30.8 per cent (93.2 per cent from urban and 6.8 per cent from rural area) responded saying ‘yes’ while 69.2 per cent (90.5 per cent from urban area and 9.5 per cent from rural area) said ‘no’. The following table no 46 summarises the responses related to this questions.
Table 46: Have You Been Given Power of Attorney for the Property Purchased to Any Member of Your Family?
Response Urban Rural No. Yes 287
(93.2) 21
(6.8) 308
(100) (30.8) No 626
(90.5) 66
(9.5) 692
(100) (69.2) Total 913
(91.3) 87
(8.7) 1000
(100)
A question was asked in continuation, ‘whether that person was male or female’, of total 308, 72.1 per cent respondents informed that power of attorney was given to female members of the family and 27.9 per cent told that it was given to male members (Table 47).
Table 47: If Yes, to Whom the Power of Attorney Given?
Urban Rural No. Female 212
(95.5) 10
(4.5) 222
(100) (72.1) Male 75
(87.2) 11
(12.8) 86
(100) (27.9) Total 287
(91.6) 21
(2.1) 308
(100)
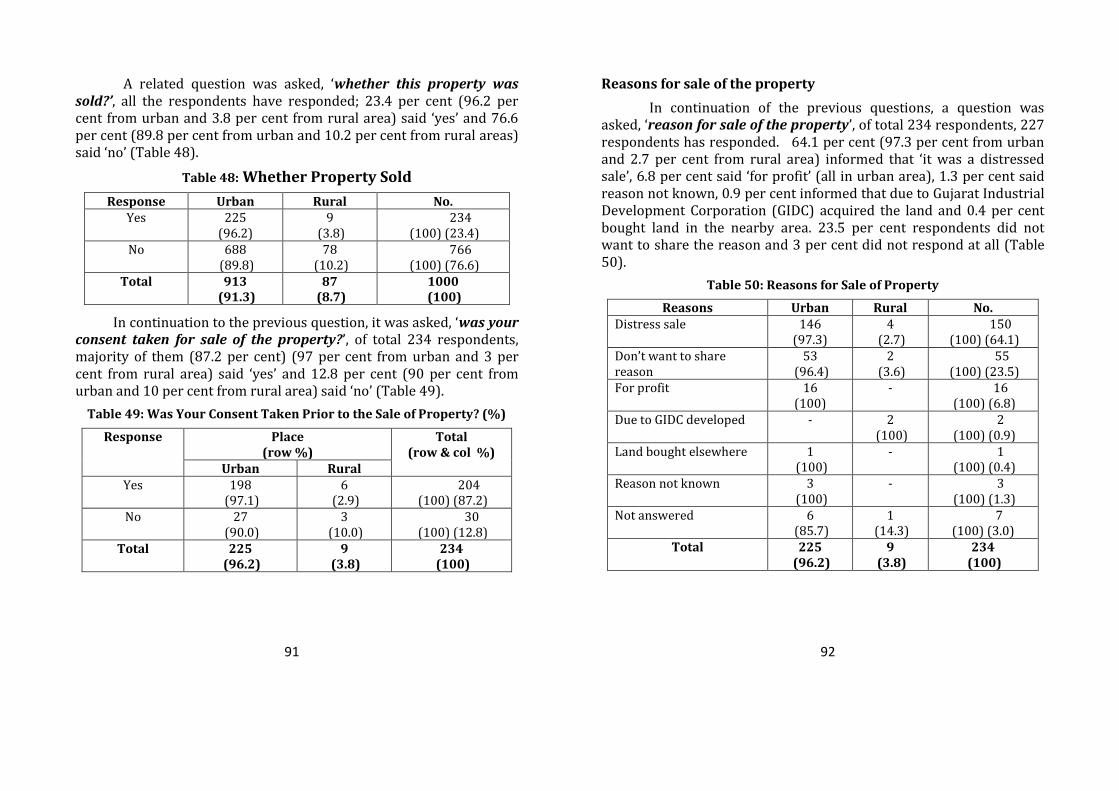
91 92
A related question was asked, ‘whether this property was sold?’, all the respondents have responded; 23.4 per cent (96.2 per cent from urban and 3.8 per cent from rural area) said ‘yes’ and 76.6 per cent (89.8 per cent from urban and 10.2 per cent from rural areas) said ‘no’ (Table 48).
Table 48: Whether Property Sold
Response Urban Rural No. Yes 225
(96.2) 9
(3.8) 234
(100) (23.4) No 688
(89.8) 78
(10.2) 766
(100) (76.6) Total 913
(91.3) 87
(8.7) 1000
(100)
In continuation to the previous question, it was asked, ‘was your consent taken for sale of the property?’, of total 234 respondents, majority of them (87.2 per cent) (97 per cent from urban and 3 per cent from rural area) said ‘yes’ and 12.8 per cent (90 per cent from urban and 10 per cent from rural area) said ‘no’ (Table 49).
Table 49: Was Your Consent Taken Prior to the Sale of Property? (%)
Response Place (row %)
Total (row & col %)
Urban Rural Yes 198
(97.1) 6
(2.9) 204
(100) (87.2) No 27
(90.0) 3
(10.0) 30
(100) (12.8) Total 225
(96.2) 9
(3.8) 234
(100)
Reasons for sale of the property
In continuation of the previous questions, a question was asked, ‘reason for sale of the property’, of total 234 respondents, 227 respondents has responded. 64.1 per cent (97.3 per cent from urban and 2.7 per cent from rural area) informed that ‘it was a distressed sale’, 6.8 per cent said ‘for profit’ (all in urban area), 1.3 per cent said reason not known, 0.9 per cent informed that due to Gujarat Industrial Development Corporation (GIDC) acquired the land and 0.4 per cent bought land in the nearby area. 23.5 per cent respondents did not want to share the reason and 3 per cent did not respond at all (Table 50).
Table 50: Reasons for Sale of Property
Reasons Urban Rural No. Distress sale 146
(97.3) 4
(2.7) 150
(100) (64.1) Don’t want to share reason
53 (96.4)
2 (3.6)
55 (100) (23.5)
For profit 16 (100)
- 16 (100) (6.8)
Due to GIDC developed - 2 (100)
2 (100) (0.9)
Land bought elsewhere 1 (100)
- 1 (100) (0.4)
Reason not known 3 (100)
- 3 (100) (1.3)
Not answered 6 (85.7)
1 (14.3)
7 (100) (3.0)
Total 225 (96.2)
9 (3.8)
234 (100)
93 94
Thus, based on the above data analysis it can be summarise that decision related to purchase of property on women’s name was taken mainly by male members of the family who happened to be husband followed by women themselves. Around three- fourth women respondents have admitted that they were involved in the negotiation for purchase of property. Around one- third of them (31.6 per cent) women respondents said that they would not have purchased property in their name, if concession in stamp duty would not been there. Almost similar number of the respondents (31.7 per cent) could not say anything. Power of attorney was given usually to women. Little less than one-fourth of women respondents told that the property was sold and most of them (87.2 per cent) reported that their consent was taken. One of the main reasons for selling of property was distress situation. Around one-fourth of the respondents (23.5 per cent) did not share the reason. Other factors for sale were for getting profit, acquisition of land for development of GIDS, or land was bought somewhere else.
Section 8: Revenue Loss due to the Implementation of the Scheme
During 2004, the Govt. of Gujarat took a landmark decision and reduced the stamp duty to 4 per cent and has waived off the registration fee for the entire registry document with the women ownership. With the implementation of the Scheme, during 2004 till 2010, about 9,77,883 women have benefitted from this scheme since the registration fee exemption came into force in the state. An amount of Rs. 264.54 crores have been remitted towards it by the State Government10. According to Mr. AV Gamit, Deputy Inspector General
10 Ms. Sunaina Tomar, Secretary, Ministry of Women and Child Development, Government of Gujarat, Gujarat.
of Registration, Govt. of Gujarat, the state government lost Rs. 64.88 crores by way of exemption of registration charges on women property buyers between June, 2004 and December, 2006.11
The statistics on total number of documents registered documents registered in favour of women and the remittances and growth per cent age presented by the Inspector General of Registration, Gandhi Nagar shows that during 2002 and December 2010, of total 53,15,498 documents, 10,17,258 (19 per cent of the total documents) were in favour of women and total 10,70,748 women were the beneficiaries, and about Rs. 275 crores were remits of registration fees (See Annexure , I, II, & III for details). It also shows that except 2007-08, there was an incremental growth in registration documents till 2007-08. Afterwards, there was a trend of decline. Apparently, it may look as revenue loss for the state however; it can be seen as an investment on social capital.
Section 9: Main findings of the household survey of women beneficiaries of the Scheme
Comparison between women beneficiaries (experimental group) and control group have been analysed. Following issues have been covered during household survey – women respondents’ awareness about the scheme on concession in stamp duty/ registration fee to women property buyers, perceptions of women respondents about property in name of women; and its impact on the empowerment of women, retention rate of the property registered on women’s name, 1000 women beneficiaries of the scheme were
11 ‘Women Property Buyers on the up in Ahmedabad’, June, 15, 2007 website:www.indianrealtynews.com/real-estate-India/women-property accessed on 18 February, 2013.
95 96
interviewed in experimental group and 25 women who did not own property on their names were interviewed. The report contains two parts. Part–I deals with the findings of experimental group and part–II deals with the findings of control group. Part -I of the report has 9 sections viz. i.) profile of women beneficiaries of the scheme; ii.) awareness about the scheme iii.) status of asset ownership by the household; iv.) impact of asset ownership in the empowerment of women and v.) retention rate of the property registered in favour of women; and vi.) revenue loss due to the implementation of the scheme. Major findings of the study are highlighted in the following paras.
The first section of the report presents profile of the respondents, that is, details about their place of residence, type and size of the family, social category they belonged to, religion, education, marital status, occupation and asset holding. In this regard, the picture emerges about women respondents in experimental group is that – the respondents largely belonged to Hindus, OBCs, general and ‘other’ category; educated between high school to graduate level and belonged to productive age group of 35 to 60 years.
There was a variety of family members owned the house, including higher number of self-owned respondents, husband, son, father, father-in-law, grandmother, sister-in-law and different combinations of joint ownership like mother and son, mother and daughter, sister-in-laws, and so on. The house was owned by a large proportion of women respondents, that was more than 80 per cent. Buying land compared to house was expensive, which showed that 21 per cent owned land as an asset.
Result on profile of respondents and asset ownership shows that the land was largely hold by the male members and for specific
purposes like commercial venture, agriculture and investment. The Other Backward Castes have largest share of land ownership followed by general category, Scheduled Tribes and Scheduled Castes and other; as explained earlier, Other Backward Castes composed almost half of the total population in Gujarat and they were largely rural agriculture based communities. Data analysis has also shown that very small number of Scheduled Castes and Scheduled Tribes respondents holding assets like house and land. Occupation-wise, the largest land ownership was among the respondents engaged as house-makers as well as business, followed by respondents in other occupations and lesser among service class and farming sector. The women respondents have purchased house / flat across all three districts. But less number of women respondents reported purchasing the commercial plot and agriculture land.
Different purposes were shared for buying property across all the social categories. Overall, Hindus have bought property for all the purposes followed by Muslims, except in respect of women and business purpose. The Jains, Sikhs, Buddhists, and Parsi have purchased property mainly for ‘security measure’; and this reason was also shared across all the occupations and age groups.
The second section of the report focuses on the awareness about the scheme of the government regarding waiving off stamp duty – level of awareness, source of information and details of the scheme related responses. In this regard, three important points emerged: one, level of awareness; two, sources of information; and three, potential for spreading awareness and identifying awareness generation channels. Further details are given in the recommendations.
Similarly, relationship between awareness about the Scheme and among different social categories shows that of 3.9 per cent
97 98
respondents, most aware was among general category (61.1 per cent), 19.4 per cent each from OBCs and others; there was hardly any awareness among Scheduled Castes and Scheduled Tribes about the scheme. And relationship between awareness about the Scheme among different religions shows that, of 3.9 per cent respondents, mainly Hindus and two Muslims answered the question; there was complete silence from other religions – Christianity, Sikh, Buddhism and others.
Regarding awareness generation channels, three types of sources were revealed - informal (friends / neighbours / relatives), formal (advertisement by the government, housing finance and government officials) and combination of formal-informal (deed writers, estate developers, and media reporting). Thus, different sources of information have indicated their potentialities to reach out to people – through spread of awareness. The awareness prevailed among as such a small number of the respondents who have awareness on different aspects, largely from Ahmadabad district, were Hindus, and belonged to general category and across different age-group, educational level and occupation.
In absolute number and per cent, awareness among experimental group was 13.6 per cent respondents out of 1,000 while in control group it was 12 per cent respondents out of 25. This means that the awareness about the scheme was little higher among experimental group than the control group.
The third section explores details about type of asset holding, decision-making regarding purchase of property, share in asset holding, seeking financial support and terms of repayment in case loan was taken for purchase of the property. The picture emerged about purchase of property – house / flat was bought by the respondents
across all the districts, social categories, religions and occupations. Noticeably, much of the women of OBC and general caste category have benefitted by the scheme. Women beneficiaries from Scheduled Castes and Scheduled Tribes were quite lower. The commercial place and plot were not at all bought by the marginal communities such as Scheduled Castes and Scheduled Tribes. Similarly, relationship between type of property bought and religion shows that the respondents following different religions, all of them have bought different properties, except Sikhs, Buddhist and Christians have not bought any commercial place or plot.
Majority of the respondents informed that they could not sale property on their own, without consulting concerned family members; however, a small number of the respondents said that they could sale property as they wished, might those be single women or the elderly persons. The proportion of financial contribution for buying property varies; up to 20 per cent of property cost and between 80 to 100 per cent contribution were the largest in number compared to others and these contributions have come from saving, loan or down payment. Regarding loan and repayment of loan, not more than 11 per cent have taken loan from 13 different banks with different interest rates, varying from 5 per cent to 12 per cent per annum. There were three types of banks - nationalised, cooperative and private; among them share nationalised and private banks have been able to support the buyer through providing loan while cooperative banks have a very small contribution.
Regarding participation in community celebration, almost half of the respondents told that they participated while in panchayat meetings, about one-third participated. Since respondents from rural area were lesser in number hence, that could be the reason for less number of respondents participating in panchayat meeting. Regarding
99 100
casting vote in the election, more than two-thirds participated while about 12.3 per cent participated in rally or campaign. Thus, the participation varies for each activity or event.
The fourth section of the report examines whether asset holding on women’s name lead to women’s empowerment. Regarding social, economic and personal change, 70 to 80 per cent of the respondents have shared positive instances, across all the districts and social categories.
The fifth section covers social, economic and political empowerment through participation in various activities. These responses were on five point scales of ‘strongly agreed’ to ‘strongly disagreed’. Regarding ability to generate income from the property purchased by women respondents; feeling secured; securing property for the children (next generation); getting support, respect and cooperation from the family members as well as the neighbours, relatives; increase in confidence; and ability to access health services on their own. On an average 60 per cent of the respondents gave positive response. These were the empowerment indicators, which clearly confirmed that more than 60 per cent of women property buyers felt ‘empowered’, that is, they have gained ‘power’ on these matters. Regarding ability to deal with banking institution or government officials related work; participating in social-political (public domain); and personal domain like decision-making on bearing children has shown moderate positivity, that is between 30 per cent and 50 per cent; these were also indicators of ‘being empowered’ than in past.
This may indicate that asset ownership by women might enable them to improve their position not only at individual level but also at intra household and public domain too. For instance, a large
number of women respondents ‘strongly agreed’ that asset ownership has reduced domestic violence after acquiring property in their name.
Though there were no similar question regarding perception about women holding assets, in experimental group, the response to the question, ‘had this concession been not there, would this property been purchased in your name’, the responses were varied – 28.7 per cent women respondents said ‘yes’ and around one –third of them (31.6 per cent) said ‘no’ and almost similar number of them (31.7 per cent) said ‘can’t say’. 8.0 per cent respondents haven’t responded. Thus experimental group’s findings show that concession in registration fee incentivizes women to purchase property in their name and women’s asset holding and empowerment as well as positive changes in women’s lives were well established.
Part -II
Control Group Survey Report
To see the impact of property ownership in women’s empowerment, 25 women respondents who did not own property were also interviewed as ‘control group’. Purpose of taking control group was to compare the status of women owning property with women who did not own property.
Mainly three sets of questions were asked to understand the status of women in two different situations, one, related to social profile such as social category, religion, education, age, occupation and type of family. Two, awareness level about the existing scheme, and third, asset ownership among women and its impact, and respondents’ perception about property ownership by women and their ability to enjoy freedom in decision-making.

101 102
Of total 25 respondents of control group, 40 per cent belonged to urban while 60 per cent of them belonged to rural area. They were from three districts – Ahmadabad (60 per cent), Surat (20 per cent) and Rajkot (20 per cent). In Ahmedabad 33.33 per cent respondents were from urban and remaining 66.67 per cent of them were from the rural area. In Surat and Rajkot districts, all the respondents were from the urban area (Table 51).
Table 51: District and Location-wise Distribution of the Respondents of Control Group (%)
District Place No.
Urban Rural
Ahmadabad 5 (33.33)
10 (66.67)
15 (100.00)
Surat 5 (100.00)
- 5 (100.00)
Rajkot 5 (100.00)
- (100.00)
Total 15 (60.0)
10 (40)
25 (100.00)
Section 1: Profile of the Control Group Respondents
Brief profile of control group population includes social category, religion, and type of family, marital status, education, age, occupation and agricultural land ownership. Data analysis of social category of control group population shows that of total 25, 64 per cent of them were Other Backward Castes (OBC), 24 per cent belonged to general category, 8 per cent belonged to religious minority, and four per cent belonged to Scheduled Tribe. Of 16 OBC, (43.8 per cent were
from urban while 56.2 per cent were from rural area). Of 6 general category respondents, 50 per cent each were from urban and from rural area respectively. The religious minority and Scheduled Tribes belonged to rural area. Religion wise data analysis of control group shows that of total 25, 72 per cent followed Hindu faith, 20 per cent followed Christianity and 8 per cent followed Islam. Data on the type of family reveals that of total 25, 72 per cent respondents belonged to nuclear family (44.4 per cent urban area and 55.6 per cent from rural area). Of 28 per cent respondents belonging to joint family, (28.6 per cent from urban area and 71.4 per cent were from rural area. Marital status of the respondents of control group shows that of total 25, 84 per cent were married, 12 per cent were unmarried and 4 per cent were widow. One each unmarried was from Ahmadabad and Surat district. The widow was from Rajkot district. Analysis of educational status of control group members reveals that out of 25 respondents, 22 of them (88 per cent) 18.2 per cent were graduates, 13.6 per cent were intermediate while the rest (68.2 per cent) have studied up to high school. 12 per cent respondents have not answered to the question. Age group analysis shows that of total 25 respondents, majority of them (80 per cent) belonged to age group of 35 to 60 years and of the rest, 8 per cent aged between 18 and 35 years and 12 per cent were more than 61 years old.
Section 2: Awareness about waiving off stamp duty for women property owners
Regarding awareness about waiving off stamp duty for women property owners – only few (4 per cent) were found aware of the scheme, around one-tenth of them (8 per cent) were partially informed while majority of the respondents (88 per cent) informed that they were not aware of the scheme. All the 12 per cent

103 104
respondents who had information about the scheme followed Hindu faith, have nuclear family, and belonged to age group of 36-60 years.
Regarding upper limit of price of property women could buy as per the rule of the scheme, one- third of them (33.3 per cent) said ‘there was no upper limit’, another one – third of them (33.3 per cent) respondents said ‘there was an upper limit’ while equal number of them (33.3 per cent) have no information about this provision. Respondents were asked about the source of information about the scheme – Of the 12 per cent respondents having information about the scheme, one –third of them (33.3 per cent) came to know from a family member (all from urban area), 33.3 per cent came to know from neighbor/friend (urban area), and 33.3 per cent from word of mouth (all from the rural area). All the 8 per cent respondents having partial awareness about the scheme agreed that they would advise other women to buy property in their name.
Section 3: Asset ownership
Ownership of flat/ house respondents lived in at present –
This being a control group, total respondents were 25. All of them owned a flat/house. Of them, 20 per cent owned agriculture land. Of total 15 respondents belonged to rural area, 40 per cent informed that the flat/ house was ancestral, one- third of them (33.3 per cent) said it was in their husbands’ names, 13.3 per cent of them said in the name of others while 13.3 per cent lived in rented house. Of 10 respondents of urban area, 30 per cent informed that the house was ancestral, 20 per cent said that it was in name of their fathers in law and 50 per cent in their husbands’ name. Total 12 respondents (58.3 per cent from urban and 41.7 per cent from rural area) expressed their desire to purchase property on their name while 13 of them (23.1
per cent urban and 76.9 per cent rural area) did not desire to buy property on their name. Of the 12 respondent, desiring to buy property, 66.7 per cent of them informed that they did not have enough money to buy property.
Section 4: Perception about property ownership by women
Various questions were asked to the respondents who did not own property on their name, their perception on various issues related to property ownership by women. In response to the question, ‘do you think property in name of women would make their position better?’, of total 25, (48 per cent respondents) (33.3 per cent from urban and 66.7 per cent from rural area) said that having property in women’s name definitely improve status in the society while 52 per cent respondents (46.2 per cent from urban and 53.8 per cent from rural area) denied saying that having property did not make women’s position better. Of the respondents believing that property in women’s name did make their position better, two- third of them (66.7 per cent) belonged to OBCs and one- third of them (33.3 per cent) belonged to general category. Of these 66.7 per cent OBCs, 62.5 per cent followed Hindu and 37.5 per cent of them followed Christianity. 75 per cent belonged to nuclear family and 25 per cent belonged to joint family. Of the 13 respondents who were of the view that property in women’s name did not make any difference in their status, 61.5 per cent belonged to OBCs, 15.4 per cent belonged to general category, 7.7 per cent were Scheduled Tribe and 15.4 per cent belonged to religious minority. 50 per cent were Hindus, 25 per cent were Muslims and 25 per cent were Christians.
105 106
Of total 25 respondents, 96 per cent (41.7 per cent from urban and 58.3 per cent from rural area) were of the view that women should have property in their name while 4 per cent respondent who disagreed with the idea belonged to Scheduled Tribe. Respondents were asked whether only working women can afford to buy property on their name, 40 per cent (30 per cent from urban and 70 per cent from rural area) were of the view that only working women could buy property while 60 per cent of them (46.7 per cent from urban and 53.3 per cent from rural area) shared that house maker women could not afford to buy property. It seems that women’s ability to buy property was not exclusively an economic question but social too.
In response to question ‘whether women have subservient status if no property owned’ but 12 per cent (33.3 per cent from urban and 66.7 per cent from rural area) said that not having property definitely affect women’s status in the society while large number of them (88 per cent) (40.9 per cent from urban and 59.1 per cent from rural area) also disagreed with this view
In response to the question - ‘whether having property on women’s name help them to become economically independent’, majority of the respondents (56 per cent) (64.3 per cent urban and 35.7 per cent from rural area) said ‘yes’; 28 per cent (14.3 per cent from urban and 85.7 per cent from rural area) said ‘no’; and 16 per cent from rural area said ‘can’t say’. Thus, majority of the respondents were of the view that women having property become economically independent. In response to the question, ‘whether having property make women more self-confident’, 44 per cent respondents (36.4 per cent urban and 63.6 per cent from rural area) said ‘yes’; 32 per cent respondents (50 per cent each from urban and rural area) said ‘no’; and remaining 24 per cent respondents (33.3 per cent from urban and
66.7 per cent from rural area) said ‘could not say’. On response to the question ‘whether property ownership empowers women’ 32 per cent respondents (37.5 per cent from urban and 62.5 per cent from rural area) said ‘yes’ and 28 per cent (57.1 per cent from urban and 42.9 per cent from rural area) said ‘no’. 40 per cent respondents (30 per cent from urban and 70 per cent from rural area) were indecisive and said ‘could not say’. Thus, although indecisive cases were greater in number yet large number of them agreed that property ownership empower women. This means that the respondents relate property that could make women economically independent, as almost two- third believed that it can make women self-confident. In response to the question ‘whether property ownership increase women’s self-esteem’ – almost half of the respondents of control group (48 per cent) (33.3 per cent from urban and 66.7 per cent from rural area) opined for ‘yes’ and 28 per cent respondents (42.9 per cent from urban and 57.1 per cent from rural area) opined for ‘no’ while 24 per cent (66.7 per cent from urban 33.3 per cent from rural area) said ‘can’t say’. In response to the question ‘whether having property ownership help a woman taking decisions related to her life’– 28 per cent (28.6 per cent from urban and 71.4 per cent from rural area) were positive, the larger number of the respondents (40 per cent) – (30 per cent from urban area and 70 per cent from rural) said ‘no’; and remaining 32 per cent respondents (62.5 per cent from urban area and 37.5 per cent from rural area) were indecisive. In response to the question ‘whether having property women feel economically secured’ majority of the respondents (76 per cent) – (47.4 per cent from urban and 52.6 per cent from rural area) said ‘yes’, 4 per cent from rural area were negative and 20 per cent respondents (20 per cent from urban and 80 per cent from rural area) were indecisive. In response to the question, ‘do you manage bank / government related work?’, of total 25 respondents, 68 per cent of them (35.3 per cent from urban and 64.7
107 108
per cent from rural area) said ‘yes’ while 32 per cent respondents (50 per cent each from urban and rural area) said ‘no’. In response to the question, ‘do you feel free to buy things without asking anyone?’, of total 25 respondents (44 per cent) (11.2 per cent from urban and 81.8 per cent from rural area) said ‘yes’ while 56 per cent respondents (57.1 per cent from urban and 42.9 per cent from rural area) said ‘no’. Of 11 respondents (44 per cent), 54.5 per cent were Hindus, 27.3 per cent were Christians and 18.2 per cent were Muslims. 54.5 per cent were in nuclear family and 45.5 per cent were in joint family. Of 14 respondents who have told that they were not able to make decision for any purchase, 86.7 per cent were Hindus and 12.3 per cent were Christians. In response to the question, ‘do your views given importance in decision making regarding family matters’, 18 (72 per cent) respondents (38.9 per cent from urban and 61.1 per cent from rural area) responded ‘yes’ while 7 respondents (28 per cent) (42.9 per cent from urban and 57.1 per cent from rural area) responded ‘no’. Of 18 respondents, 72.0 per cent belonged to OBC and 22.0 per cent of them belonged to general category, 6.0 per cent to religious minority; Of 18 respondents who said that they were given importance in decision making, the examples given were – 44.4 per cent said ‘about marriage related matter’, 27.8 per cent said ‘about management of home’, 5.6 per cent said about ‘routine work related’ and 5.6 per cent said about career related decision.
Section 5: Participation in socio-political activities
Of total 25, 84 per cent respondents (28.6 per cent from urban and 71.4 per cent from rural area) said they participated in social functions while 16 per cent respondents all from urban areas did not participate in any social functions. Of total 25 respondents, 76 per cent of them (42.1 per cent from urban and 57.9 per cent from rural area) said they voted in election while 24 per cent respondents all from
urban area did not vote. In response to the question, ‘are you a member of kitty group or self help group’, 16 per cent respondents said ‘yes’ to this question while 84 per cent respondents said ‘no’.
Section 6: Findings of the Control Group
Based on the above analysis, it may be concluded that regarding awareness related questions, perceptions about property ownership of women and motivating women to buy property, the responses were varied across social categories, occupation and type of family, which were directly linked with women’s lives.
Recommendations
In light of major findings of the study and emerging trends, there were mainly six areas of potential for women’s empowerment through the scheme of exemption or reduced rate of stamp duty and registration fee for sale and transfer of the property. These are:
I. Awareness spreading of the scheme;
II. Providing financial assistance in form of loan and facilitation expected from these financial institutions
III. Upscaling changes in lives of women;
IV. Inter-linking indicators of women’s empowerment.
V. Retention rate of property purchased on women’s name under the scheme; and
VI. Revenue loss due to implementation of the scheme
I. Awareness spreading of the Scheme
The awareness about the scheme has shown greater potential in terms of higher awareness leading to greater use of the scheme. There were formal source, informal sources and combination of
109 110
formal-informal sources of awareness were revealed and strategic use of all these sources could be meaningful. Among them, ‘media’, ‘estate developers’ and ‘deed writers’ need to be promoted over and above existing channels like advertisement, government officials and banks, etc have to reach out to people in such a way that the sources of information like relatives, friends and neighbours would be able to create rolling effect.
II. Providing financial assistance in form of soft loan and facilitation expected from the financial institutions
The loans were provided by three different types of banks - nationalised, cooperative and private; and among them reach out of cooperative banks was limited compared to the two other types of banks. The interest rates of the banks were varied. There were two recommendations in this context, based on findings: one, the women shared that they found it difficult to deal or manage with the government /bank officials. If we consider as an area of opportunity, the banks either should provide special schemes/incentives to the exclusive women buyers or facilitate the process of loaning in women-friendly manner. Two, the asset holding among the women in marginal communities such as Scheduled Castes and Scheduled Tribes was comparatively smaller in number. Loan was taken largely by the general category and OBC . Therefore, two possibilities - either the government should provide further subsidy or the banks could offer special affordable rates to the Scheduled Castes and Scheduled Tribes and other such marginal communities under the scheme.
III. Up scaling changes in lives of women
As majority of women have shared changes in social, political and personal spheres after buying the property, the state, financial institutions and other democratic institutions were expected to
upscale these changes so that the women’s empowerment as a process as well as an outcome could be fulfilled. The women property buyers could be invited to the public functions and they share their experiences and motivate other women and men could be one of the ways. Though it was a mandate for the state to ensure joint ownership of wife and husband for the asset like house made and the name of women, if she was widow, deserted or unmarried under Indira Awas Yojana and so on, this should be fulfilled so that extent of property in the name of the women would increase and the rolling effect of these changes could be wide spread in coming times.
IV. Inter-linking indicators of women’s empowerment
Many respondents shared different purposes for buying the property like for security, investment, and commercial venture. The number of house makers owning the property, linking with these purposes suggests that this trend was very encouraging. This also means that along with formal finance in form of loan comes from the banks; other financial sources should ideally be facilitating process of property buying and its cascading effects. The banks can revise loaning system to the SHGs and other micro-finance groups / institutions. Similarly, the government can plan a policy measures that can be inter-linked with the existing scheme of stamp duty and registration fee for sale or transfer of the property. In this way, five petals (welfare, access, conscientistion, mobilization and control) of women’s empowerment could be inter-linked.
V. Retention Rate of the Property purchased by women
Retention rate of property owned by women can be linked with changes in their lives. Household data analysis shows that around one- fourth of women beneficiaries of the scheme
111 112
(23.4 per cent) have sold property and of them two-third had to sell in distress situation, it is directly linked with social security of women, which is adversely affected. It was also observed that instances of selling property were higher in posh areas. It would be desirable to create a data base that keeps records of women property buyers for a decade so that distress sale could be prevented and social security is ensured to women property buyers.
VI. Revenue loss due to implementation of the scheme
The number of women beneficiaries of the scheme during year 2009 and 2011, varied from almost 1.3 lakh to 1.5 lakh per year and by December 2011, total 10.3 lakh women have been benefitted. Total remits of registration fee in this case December 2011 was Rs 247.7 crores. As against the women’s empowerment observed based on this study, the remittance by the GoG seems not only justifiable, it actually solicits appreciation for the GoG. The performance of this scheme compared to any other welfare scheme is at par and therefore in its admiration, it is recommended that the scheme should be continued and if possible, some additional features could be added to it. For instance, awareness raising, expanding its reach out through various financial institutions, in order to prevent distress sale of the property by women, it can be linked up with other social welfare scheme as an incentive. Besides providing concession in registration charges including stamp duty to women property buyers may apparently seem as a loss to the state exchequer
but it needs to be seen as an investment on social capital for half of the population. Also the temporary loss in revenue from stamp duty can be compensated by various other ways such as better valuation, checking of non registration of property transfer, and increase in the volume of registered documents.
VII. Power of Attorney
Instances were seen where the transfer of property in favour of women took place through Power of Attorney (PoA). In case of PoA, an owner can neither sell the property nor get access to loan from the bank. Except exception transaction through PoA should be restricted. Need to conduct follow up studies of women beneficiaries in states where this programme is being implemented.
VIII. Mutation
Although with the implementation of the Scheme of concession in stamp duty/registration fee to women property buyers, large number of women got the benefit of the scheme and property has been transferred in their favour. However, not much attention seems to be given in the mutation of the registered property. Many of them were not even aware of mutation procedure. Those who were aware of they found the process of mutation complicated and time consuming.
There is a need to create awareness among women beneficiaries for mutation of the registered property. Also there is a dire need to simplify mutation procedure and process.
113 114
References
1. Government of Gujarat. 2006. Checklist of reforms: Rationalization of stamp duty.
2. Kabeer, Naila. 1999a. ‘The Conditions and Consequences, of Choice: Reflections on the Measurement of Women’s Empowerment’, UNRISD Discussion Paper No. 108, August 1999.
3. Kabeer, Naila. 1999b. ‘Resources, Agency, Achievements: Reflections on the Measurements of Women’s Empowerment’, Development and Change, Vol. 30, pp. 435-464.
4. Laberge, Marie. 2008. ‘Claiming the MDGs: An empowerment framework (draft)’, UNDP Oslo Governance Centre.
5. Shailendra, S. 2013. ‘What are the property rights given to women in India - Legal Rights to the Women regarding the share of the property’, website www.linkedin.com/answeres/law-legal/property-law accessed on 18 February, 2013
6. XIIth Five Year Plan, 2011. ‘Report of The Working Group on Women’s Agency and Empowerment’, Government of India: Ministry of Women and Child Development.
7. ---. 2005. ‘Rationalization of Stamp Duty: State Level Reform’, JNNURM primer. website: http://www.indiaurbanportal.in/reforms/optional/Primer10.PPP.pdf accessed on 7th may 2013
8. ---. 2007. ‘Women Property Buyers on the up in Ahmedabad’, June 15. website:www.indianrealtynews.com/real-estate-India/women-property accessed on 18 February, 2013.
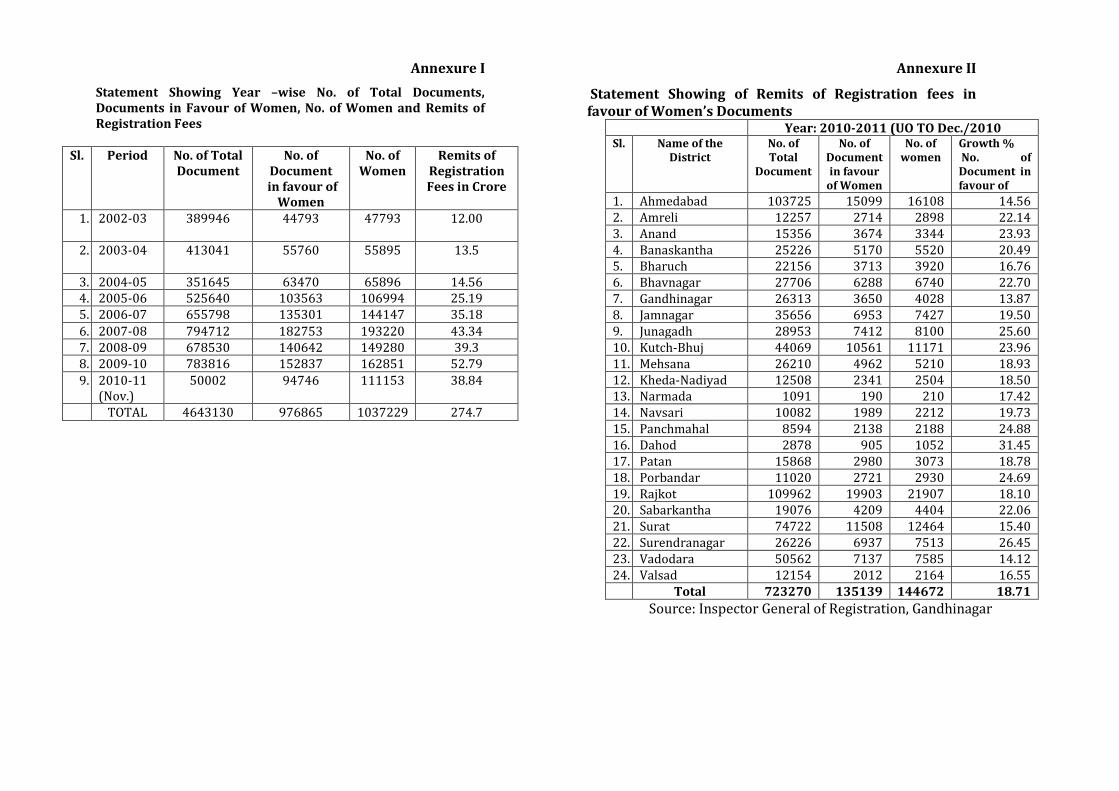
Annexure I
Statement Showing Year –wise No. of Total Documents, Documents in Favour of Women, No. of Women and Remits of Registration Fees
Sl. Period No. of Total Document
No. of Document
in favour of Women
No. of Women
Remits of Registration Fees in Crore
1. 2002-03 389946 44793 47793 12.00
2. 2003-04 413041 55760 55895 13.5
3. 2004-05 351645 63470 65896 14.56 4. 2005-06 525640 103563 106994 25.19 5. 2006-07 655798 135301 144147 35.18
6. 2007-08 794712 182753 193220 43.34 7. 2008-09 678530 140642 149280 39.3 8. 2009-10 783816 152837 162851 52.79
9. 2010-11 (Nov.)
50002 94746 111153 38.84
TOTAL 4643130 976865 1037229 274.7
Annexure II
Statement Showing of Remits of Registration fees in favour of Women’s Documents
Year: 2010-2011 (UO TO Dec./2010 Sl. Name of the
District No. of Total
Document
No. of Document in favour
of Women
No. of women
Growth % No. of Document in favour of
1. Ahmedabad 103725 15099 16108 14.56 2. Amreli 12257 2714 2898 22.14 3. Anand 15356 3674 3344 23.93 4. Banaskantha 25226 5170 5520 20.49 5. Bharuch 22156 3713 3920 16.76 6. Bhavnagar 27706 6288 6740 22.70 7. Gandhinagar 26313 3650 4028 13.87 8. Jamnagar 35656 6953 7427 19.50 9. Junagadh 28953 7412 8100 25.60 10. Kutch-Bhuj 44069 10561 11171 23.96 11. Mehsana 26210 4962 5210 18.93 12. Kheda-Nadiyad 12508 2341 2504 18.50 13. Narmada 1091 190 210 17.42 14. Navsari 10082 1989 2212 19.73 15. Panchmahal 8594 2138 2188 24.88 16. Dahod 2878 905 1052 31.45 17. Patan 15868 2980 3073 18.78 18. Porbandar 11020 2721 2930 24.69 19. Rajkot 109962 19903 21907 18.10 20. Sabarkantha 19076 4209 4404 22.06 21. Surat 74722 11508 12464 15.40 22. Surendranagar 26226 6937 7513 26.45 23. Vadodara 50562 7137 7585 14.12 24. Valsad 12154 2012 2164 16.55
Total 723270 135139 144672 18.71
Source: Inspector General of Registration, Gandhinagar
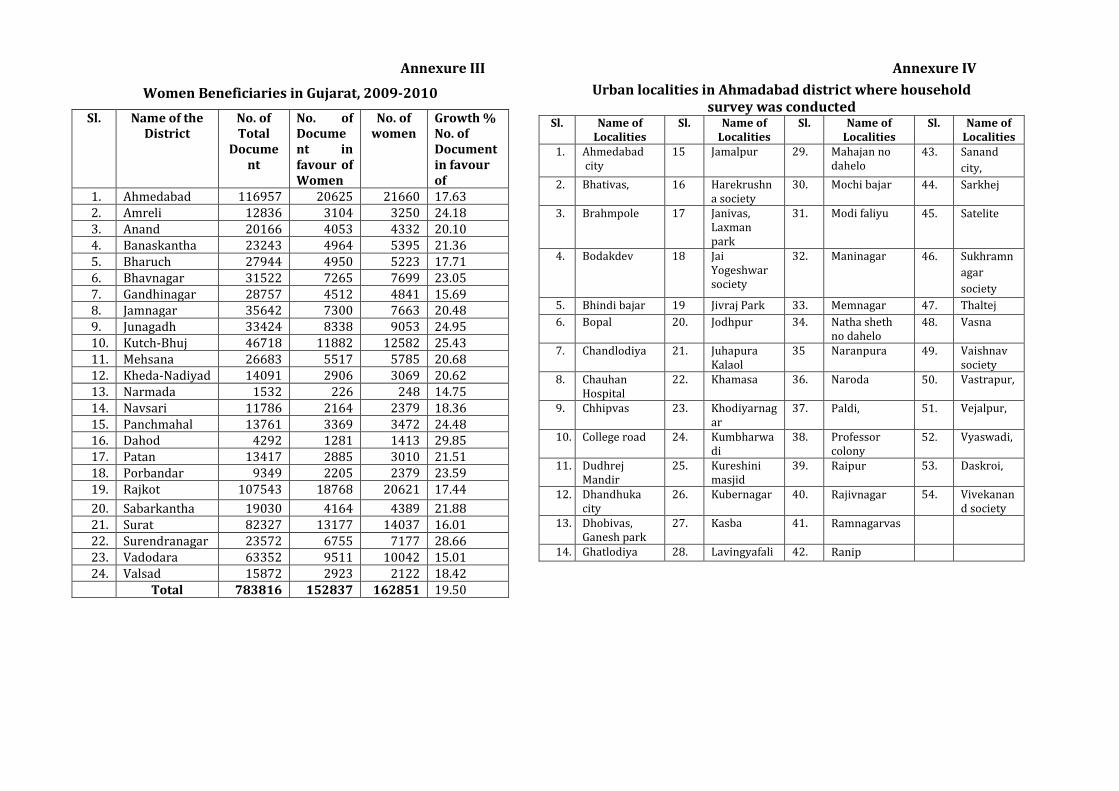
Annexure III
Women Beneficiaries in Gujarat, 2009-2010
Sl. Name of the District
No. of Total
Document
No. of Document in favour of Women
No. of women
Growth % No. of Document in favour of
1. Ahmedabad 116957 20625 21660 17.63 2. Amreli 12836 3104 3250 24.18 3. Anand 20166 4053 4332 20.10 4. Banaskantha 23243 4964 5395 21.36 5. Bharuch 27944 4950 5223 17.71 6. Bhavnagar 31522 7265 7699 23.05 7. Gandhinagar 28757 4512 4841 15.69 8. Jamnagar 35642 7300 7663 20.48 9. Junagadh 33424 8338 9053 24.95 10. Kutch-Bhuj 46718 11882 12582 25.43 11. Mehsana 26683 5517 5785 20.68 12. Kheda-Nadiyad 14091 2906 3069 20.62 13. Narmada 1532 226 248 14.75 14. Navsari 11786 2164 2379 18.36 15. Panchmahal 13761 3369 3472 24.48 16. Dahod 4292 1281 1413 29.85 17. Patan 13417 2885 3010 21.51 18. Porbandar 9349 2205 2379 23.59 19. Rajkot 107543 18768 20621 17.44
20. Sabarkantha 19030 4164 4389 21.88 21. Surat 82327 13177 14037 16.01 22. Surendranagar 23572 6755 7177 28.66 23. Vadodara 63352 9511 10042 15.01 24. Valsad 15872 2923 2122 18.42
Total 783816 152837 162851 19.50
Annexure IV
Urban localities in Ahmadabad district where household survey was conducted
Sl. Name of Localities
Sl. Name of Localities
Sl. Name of Localities
Sl. Name of Localities
1. Ahmedabad city
15 Jamalpur 29. Mahajan no dahelo
43. Sanand
city,
2. Bhativas, 16 Harekrushna society
30. Mochi bajar 44. Sarkhej
3. Brahmpole 17 Janivas, Laxman park
31. Modi faliyu 45. Satelite
4. Bodakdev 18 Jai Yogeshwar society
32. Maninagar 46. Sukhramn
agar
society
5. Bhindi bajar 19 Jivraj Park 33. Memnagar 47. Thaltej
6. Bopal 20. Jodhpur 34. Natha sheth no dahelo
48. Vasna
7. Chandlodiya 21. Juhapura Kalaol
35 Naranpura 49. Vaishnav society
8. Chauhan Hospital
22. Khamasa 36. Naroda 50. Vastrapur,
9. Chhipvas 23. Khodiyarnagar
37. Paldi, 51. Vejalpur,
10. College road 24. Kumbharwadi
38. Professor colony
52. Vyaswadi,
11. Dudhrej Mandir
25. Kureshini masjid
39. Raipur 53. Daskroi,
12. Dhandhuka city
26. Kubernagar 40. Rajivnagar 54. Vivekanand society
13. Dhobivas, Ganesh park
27. Kasba 41. Ramnagarvas
14. Ghatlodiya 28. Lavingyafali 42. Ranip
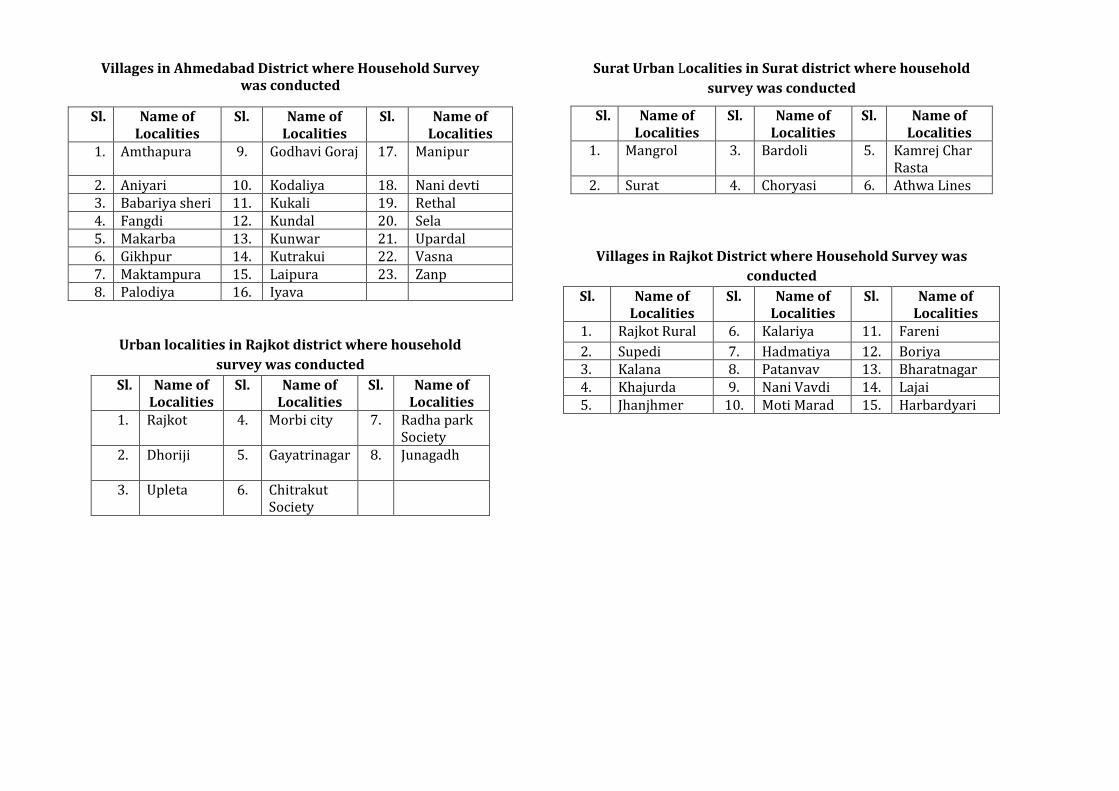
Villages in Ahmedabad District where Household Survey was conducted
Sl. Name of Localities
Sl. Name of Localities
Sl. Name of Localities
1. Amthapura 9. Godhavi Goraj 17. Manipur
2. Aniyari 10. Kodaliya 18. Nani devti 3. Babariya sheri 11. Kukali 19. Rethal 4. Fangdi 12. Kundal 20. Sela 5. Makarba 13. Kunwar 21. Upardal 6. Gikhpur 14. Kutrakui 22. Vasna 7. Maktampura 15. Laipura 23. Zanp 8. Palodiya 16. Iyava
Urban localities in Rajkot district where household
survey was conducted
Sl. Name of Localities
Sl. Name of Localities
Sl. Name of Localities
1. Rajkot 4. Morbi city 7. Radha park Society
2. Dhoriji 5. Gayatrinagar 8. Junagadh
3. Upleta 6. Chitrakut Society
Surat Urban Localities in Surat district where household
survey was conducted
Sl. Name of Localities
Sl. Name of Localities
Sl. Name of Localities
1. Mangrol 3. Bardoli 5. Kamrej Char Rasta
2. Surat 4. Choryasi 6. Athwa Lines
Villages in Rajkot District where Household Survey was
conducted
Sl. Name of Localities
Sl. Name of Localities
Sl. Name of Localities
1. Rajkot Rural 6. Kalariya 11. Fareni
2. Supedi 7. Hadmatiya 12. Boriya 3. Kalana 8. Patanvav 13. Bharatnagar 4. Khajurda 9. Nani Vavdi 14. Lajai 5. Jhanjhmer 10. Moti Marad 15. Harbardyari