Conceptual framework for indicator assignment and ... · PDF fileSEBI 2010 (Streamlining...
54
ENVEurope A2: Indicator Framework (v3.1) 1 VERSION v3.1 (Jan 2011) ENVEurope Environmental quality and pressures assessment across Europe: The LTER network as an integrated and shared system for ecosystem monitoring Conceptual framework for indicator assignment and selection for LTER-sites Author: Benjamin Burkhard, Kiel Contributions by: Mark Frenzel, Halle; Felix Müller, Kiel; Hendrik Schubert, Rostock; Alessandra Pugnetti, Venice; + several others from the ENVEurope consortium
Transcript of Conceptual framework for indicator assignment and ... · PDF fileSEBI 2010 (Streamlining...

ENVEurope A2: Indicator Framework (v3.1)
1
VERSION v3.1 (Jan 2011)
ENVEurope
Environmental quality and pressures assessment across Europe:
The LTER network as an integrated and shared system for ecosystem monitoring
Conceptual framework for indicator assignment and selection
for LTER-sites
Author: Benjamin Burkhard, Kiel
Contributions by: Mark Frenzel, Halle; Felix Müller, Kiel; Hendrik Schubert, Rostock; Alessandra Pugnetti, Venice;
+ several others from the ENVEurope consortium
ENVEurope A2: Indicator Framework (v3.1)
2
ENVEurope
Environmental quality and pressures assessment across Europe:
The LTER network as an integrated and shared system for ecosystem monitoring
Action 2 Parameters and methods elaboration Subaction 2.2 List of parameters and harmonized methods Activity code A2.2.2a: From processes to parameters: development of the conceptual background and a set of guiding questions making decisions how to come from processes and functions to parameters traceable Activity period: 03-12/2010 Activity code A2.2.2b: From processes to parameters: proposal about focal qualities of monitored systems Activity period: 10/2010-02/2011 Activity code A2.2.3a: Review and selection of abiotic/biotic indicators: review of indicator-focused action at EU and national level Activity period: 10/2010-06/2011
ENVEurope A2: Indicator Framework (v3.1)
3
Content
1 INTRODUCTION 5
1.1 The project ENVEurope 5
1.2 LTER Europe and ENVEUROPE 6
1.3 Indicator framework for LTER, respective ENVEUROPE 7
2 INDICATOR CONCEPTS: BACKGROUND 8
2.1 Basic requirements for indicators 8
2.2 Review and selection of abiotic/biotic indicators 9
2.2.1 Biodiversity indicator initiatives 10
SEBI 2010 (Streamlining European 2010 Biodiversity Indicators) 11
GEO BON (Group on Earth Observations Biodiversity Observation Network) 11
Living Planet Index (LPI) 11
Species Trend Index (STI) 11
National Biodiversity Index (NBI) 12
Red Lists 12
Biomare 12
2.2.2 Integrative environmental indicator initiatives 12
Sustainability indicators (EU) 13
EEA core set of environmental indicators 13
OECD 13
TEEB (The Economics of Ecosystem and Biodiversity) 14
Natural Capital Index (NCI) 14
HANPP 14
Critical Load Exceedence Index (CLE) 14
Connectivity Indices 14
Corine Land Cover (CLC) 14
2.2.3 Indicator initiatives with special focus on marine environments 15
OSPAR 15
HELCOM 15
BARCOM 16
BUCHAREST CONVENTION 16
Marine Strategy Framework Directive of the European Union 16
Integrated Coastal Zone Management (ICZM) 17
International Council for the Exploration of the Sea (ICES) 17
Regional initiatives 17
Census of Marine Life 17

ENVEurope A2: Indicator Framework (v3.1)
4
European network of marine research institutes stations (MARS network) 18
Marine Biodiversity and Ecosystem Functioning (MarBEF) 18
2.2.4 Indicator initiatives with special focus on freshwater environments 18
European Water Framework Directive (EU-WFD) 19
Global Lake Ecological Observatory Network (GLEON) 20
Further European regulations 20
3 THE DPSIR MODEL AS A FRAMEWORK LINKING ENVIRONMENTAL AND HUMAN SYSTEMS
21
4 ECOLOGICAL INTEGRITY AS A CONCEPT FOR INDICATOR DERIVATION 22
4.1 Compilation of useful indicators suitable for LTER-Europe sites 25
4.2 Synthesis of identified indicators and parameters already measured at LTER sites: Evaluation and
importance 27
4.3 Identification of over-arching indicators and indicators specific for LTER ecosystems 34
4.4 Example application 37
5 THE CONCEPT OF ECOSYSTEM GOODS AND SERVICES AS A BASE FOR SOCIETAL
INDICATORS 39
5.1 Ecosystem service indicators 40
5.2 Assessments of ecosystem services supply 43
6. GAP ANALYSIS 45
7. IMPLEMENTATION 46
8. REFERENCES 48
ANNEX 52

ENVEurope A2: Indicator Framework (v3.1)
5
1 Introduction
The use of long-term environmental data and related long-term integrated monitoring for the
identification, investigation and prediction of trends and developments in ecosystems has been
recognized since several decades (e.g. Magurran et al. 2010, Niemi & McDonald 2004, Likens 1992).
Nowadays, terrestrial, marine and freshwater ecosystems are monitored by a number of global,
continental, national or regional networks, managed by different organizations. Unfortunately, there
is a clear lack of integration of the monitoring at a European level, many monitoring programs have a
narrow focus (e.g. looking at individual system's components only) and most programs use different
measurement protocols and sampling designs (Lindenmayer & Likens 2009, Parr et al. 2002). Hence,
there is some redundancy of data, overlapping of efforts and a lack of harmonized data and
concepts.
1.1 The project ENVEurope1
The project ENVEurope was born and will develop inside the European Long-Term Ecosystem
Research Network community. The project aims at the integration and coordination at the European
level of long-term ecological research and monitoring initiatives, focused on understanding trends
and changes of environmental quality, and on the elaboration of relevant detection systems and
methods.
The main target of the project ENVEurope is the analysis of the ecosystem status and the definition
of appropriate environmental quality indicators with an integrated long-term, broad scale, cross-
domain (terrestrial, freshwater, coastal and marine ecosystems) approach, joining the efforts of 11
countries belonging to the LTER Europe network.
ENVEurope proposes the design of environmental quality monitoring and research sites and the
establishing of common parameter sets to be collected across the largest network of long-term
ecological research sites in Europe. Focusing on three types of ecosystems (terrestrial, freshwater
and coastal/marine) it aims at defining measures relevant to different scales of investigation, with
specific monitoring intensities and with methods adjusted to the respective assessment intensity,
implementing a multi-level and multi-functional approach.
A further target of the project is the selection of a core list of ecological parameters, indicators and
indexes, useful to analyze, compare and report environmental quality at an international level.
Thereby, the LTER network's comprehensive data sets will be brought into a larger context and can
be harnessed by a broader community which will add substantial value to the precious data. To link
the data from the LTER network to the high diversity of concepts and related indicators is the major
challenge for ENVEurope. Based on Cocciufa et al. (2007, in Parr et al. 2010), a set of minimum
recommended parameters to be measured at LTER-Europe sites as been agreed upon (Table 1).
However, according to Parr et al. (2010), there is no guarantee at present that these parameters
actually will be measured by most sites or national networks.
1 http://www.ENVEurope.eu/

ENVEurope A2: Indicator Framework (v3.1)
6
Table 1: Minimum recommended parameters to be collected at LTER-Europe Sites (* = highly
recommended) (from Parr et al. 2010)
1.2 LTER Europe and ENVEUROPE
The European LTER network covers actually 406 LTER-Europe sites and 23 LTSER (Long-Term Socio-
economic and Ecosystem Research) platforms. They all are set up to collect long term data from
different ecosystems.
Figure 1: Map of the European LTER and LTSER sites and platforms (map from www.lter-
europe.net).

ENVEurope A2: Indicator Framework (v3.1)
7
Long-Term Ecosystem Research (LTER) is an essential component of worldwide efforts to better
understand ecosystems (Müller et al. 2010, Mirtl et al. 2009; see also: http://www.lter-europe.net).
This comprises their structure, functions, and response to environmental, societal and economic
drivers as well as the development of management options. Thus data collected within the LTER
network are quite heterogeneous, as the sites do not only cover different eco-domains with wide
ranges of different habitats, but the motivation for setting up LTER sites and thus, the measurements
taken, are heterogeneous too. Together with missing standards about (1) data storage and
availability as well as for (2) indicators, parameters and methods, this demands for urgent
improvement in order to make the most use of long-term data and time series. At present, the
metadata about LTER-Europe sites are available in InfoBase at
https://secure.umweltbundesamt.at/eMORIS and updated by the InfoBase Entry Tool available at
http://www.lter-europe.net/info_manage/lter-infobase. However, the information about the
parameters measured (details about treatment, analysis, method, start and end of measurement,
etc) is actually coarse and needs to be refined.
Due to this high diversity of sites and collected data, ENVEurope aims at designing a common
indicator/parameter set based on a common conceptual ground broad enough to cover multiple
aspects of ecosystems. Data from all sites will be integrated into this concept. To follow up, data
from socio-ecological research (LTSER sites) should be integrated, for example by using the concept
of ecosystem services (chapter 5 of this report). In this context it has to be mentioned, that the
comprehensive and long-term data from the LTER sites provides a vast and highly valuable amount of
information. Normally, the lack of data is probable the biggest constraint for indicator applications
(Parr et al. 2010) but, applying the LTER data in a common indicator set, would add enormous value
to national and international monitoring programs.
1.3 Indicator framework for LTER, respective ENVEUROPE
The aim of this documentation is to give an overview of current actions with regard to environmental
indicators, compare them with the monitoring activities at the Long Term Ecological Research (LTER)
sites and to deliver a concept on how to integrate available LTER data and fill the gaps within a
general indicator framework. Finally, a sound scientific base and practical recommendations for
harmonized monitoring systems will be provided. The main concepts which will be described in the
following and on which the indicator frameworks shall be based on are Ecological Integrity, the DPSIR
scheme and Ecosystem Services.
The following five main questions will be used to assess the particular indicators' suitability:
- At which sites has the indicator been measured of what quality?
- Does the indicator represent a relevant component of at least one of the two target concepts
Ecological Integrity or Ecosystem Services?
- Does the indicator address national or EU level policy issues (e.g. biodiversity targets)?
- Are there any alternative / surrogate indicators measured or available?
- Which spatial and temporal scale does the indicator refer to?

ENVEurope A2: Indicator Framework (v3.1)
8
2 Indicator concepts: background
The development and application of indicators have been very popular issues among scientists and
especially at the science-policy interface. Scientists, on the one hand, tend to deliver information,
data and related indicators as detailed as possible. Policy and decision makers, on the other hand,
are dependent on highly aggregated information and corresponding indicators, which are political
relevant, more or less easy to understand and suitable for communication, but often quite
simplifying.
2.1 Basic requirements for indicators
Basic requirements for indicators have been well-defined and can be found for example in Müller &
Burkhard (2010). Thus, indicators should be
easily measurable,
able to be aggregated,
depict the investigated indicandum (object of indication) - indicator relation in an
understandable manner. The indicandum should be clearly and unambiguously represented
by the indicators.
The corresponding parameters should
comprise an optimal sensitivity,
include normative loadings in a defined extent only,
provide a high utility for early warning purposes.
Müller and Wiggering (2004) provide a list of further requirements for indicators (Table 2).
Table 2: Requirements for good (ecological) indicators (according to Müller and Wiggering
2004) ___________________________________________________________________________
- political relevance - high level of aggregation - political independence - target-based orientation
- spatial comparability - usable measuring requirements - temporal comparability - usable requirements for quantification - sensitivity concerning the indicandum - unequivocal assignment of effects - capability of being verified - capability of being reproduced - validity - spatio-temporal representativeness - capability of being aggregated - methodological transparency - transparency for users - comprehensibility ___________________________________________________________________________
As further conceptual guidelines for indicator derivation can be named (i) the linkage of the
indicators to ecosystem theory, (ii) application of methodologies from ecosystem analysis, and (iii)
the relation to political concepts and targets.
Referring to guideline (i), the linkage of indicators to ecosystem theory, ecosystems can be regarded
as self-organizing entities, and the degree of self-organizing processes and their effects can be

ENVEurope A2: Indicator Framework (v3.1)
9
chosen as an aggregated measure to represent the systems’ actual states (Müller & Burkhard 2010).
The basic theoretical principles of this approach stem from the thermodynamic fundamentals of self-
organization and from the orientor principle (see chapter 4 of this report). The application of
methodologies of ecosystem analysis (ii) guarantees the depiction of ecological entities in a holistic
manner: structures as well as processes are taken into account; whereas the structures represent the
performance of the ecosystems (and, in a next step, their capacity to provide ecosystem services).
For the indicator sets' utilization in environmental management, a useful indicator set has to be
based on political concepts and targets (iii). The awareness of these topics has for example been
evidenced by the fact that the Convention on Biological Diversity (CBD) has adapted ecosystem
integrity and ecosystem goods and services (ecosystem functioning in terms of their ability to provide
goods and services) as focal areas in their Conference of the Parties 2004.
2.2 Review and selection of abiotic/biotic indicators
With reference to the requirements listed above, existing ecological indicator sets comprise different
potentials, advances and limitations. With respect to indicator complexity, there are very complex
indicator sets with a very high number of proposed parameters (e.g. Schönthaler et al. 2001,
Statistisches Bundesamt et al. 2002). On the other hand, there are approaches that include a
reduction up to one parameter only (e.g. Jørgensen 2000, Ulanowicz 2000, Odum et al. 2000).
Between indicator systems there is a broad span regarding the necessary data base, the demanded
measuring efforts, the complexity of the aggregation methodology, and the comprehensibility of the
results as well as the cognitive transparency for the users. These indicator systems can be classified
into different categories that include varying levels of integration, ranging from rather reductionistic
to holistic indicators, integrating a broad range of environmental information (Burkhard et al. 2008):
1. indicators based on the abundance of selected species;
2. indicators based on the concentration of selected elements;
3. indicators based on ratios between different classes of organisms or elements;
4. indicators based on ecological strategies or processes;
5. indicators based on ecosystem composition and structure; and
6. system-theoretical holistic indicators.
(1) Indicators based on the abundance of selected species include for example direct measurement
and observation of selected species abundance, the saprobic classification, Bellan’s pollution index,
the AZTI Marine Biotic Index, bentix, macrofauna monitoring indices or the benthic response index
(Jørgensen et al. 2010). (2) Indicators based on the concentration of selected elements are for
example levels of eutrophication calculated e.g. based on phosphorus concentrations or, very
commonly used, pH values. (3) Ratios between different classes of organisms or elements are used as
indicators for example by Nygard’s algal index or the diatoms/non-diatoms ratio. (4) Ecological
strategies or processes are the background for process and rate indicators, for example the index of

ENVEurope A2: Indicator Framework (v3.1)
10
r/K strategists or the infaunal index. (5) The very commonly calculated Shannon–Wiener index is an
example for indicators based on ecosystem composition and structure. Further indicators referring to
ecosystem composition and structures are analyses of food webs or ascendency. (6) Systems
theoretical holistic indicators can be related to the concepts of vigor, organization, and resilience
(VOR model), to exergy /thermodynamic indices, ecosystem health or ecosystem integrity.
2.2.1 Biodiversity indicator initiatives
Biodiversity and especially biodiversity loss have been mentioned as major issues in environmental
management and related monitoring (MA 2005). There are numerous biodiversity-related global and
European policy instruments, for which biodiversity indicators need to be derived, for example:
Ramsar Convention 1971; Bern Convention 1979; Bonn Convention 1979; EC Birds Directive 1979; EC
Habitats Directive 1992; Convention on Biological Diversity CBD 1992; Pan-European Biological and
Landscape Diversity Strategy 1995; Ministerial Conference on the Protection of Forests in Europe
1990, 1993, 1998; EC Water Framework Directive 2000; EC Biodiversity Strategy 1998 and its four
sectorial Biodiversity Action Plans 2001; EU Sustainable Development Strategy 2001 and the Sixth
Environment Action Programme 2001, the Millennium Development Goals to be achieved 2015 and
the proceedings of the G8+5 and the G20 groups of nations.
Consequently, there are many initiatives to describe and to assess biodiversity (Scholes et al. 2008).
But even though there is a high number of biodiversity data, there is no general concept on spatial,
temporal and topical data organization. According to the EEA (2002), biodiversity indicators should
meet the following criteria:
• be easy to understand and policy-relevant; • provide factual, quantitative information; • be normative (possibility to compare to a baseline situation) • be scientifically sound and statistically valid; • be responsive to change in time/space; • be technically feasible and cost-efficient to use within acceptable limits (in terms of data collection); • be useable for scenarios for future projections; • allow comparison between member states; • allow aggregation at national and multinational level; • take into account region-specific biodiversity; and • be user-driven.
Table 2A (Annex) provides a list of ongoing and planned international indicator initiatives most
relevant to biodiversity in Europe which were checked for above mentioned criteria (from EEA 2002).
Unfortunately, not many of the indicator sets fulfilled all criteria (EEA 2002).
In the following, a short overview of some selected biodiversity indicator systems is provided:
ENVEurope A2: Indicator Framework (v3.1)
11
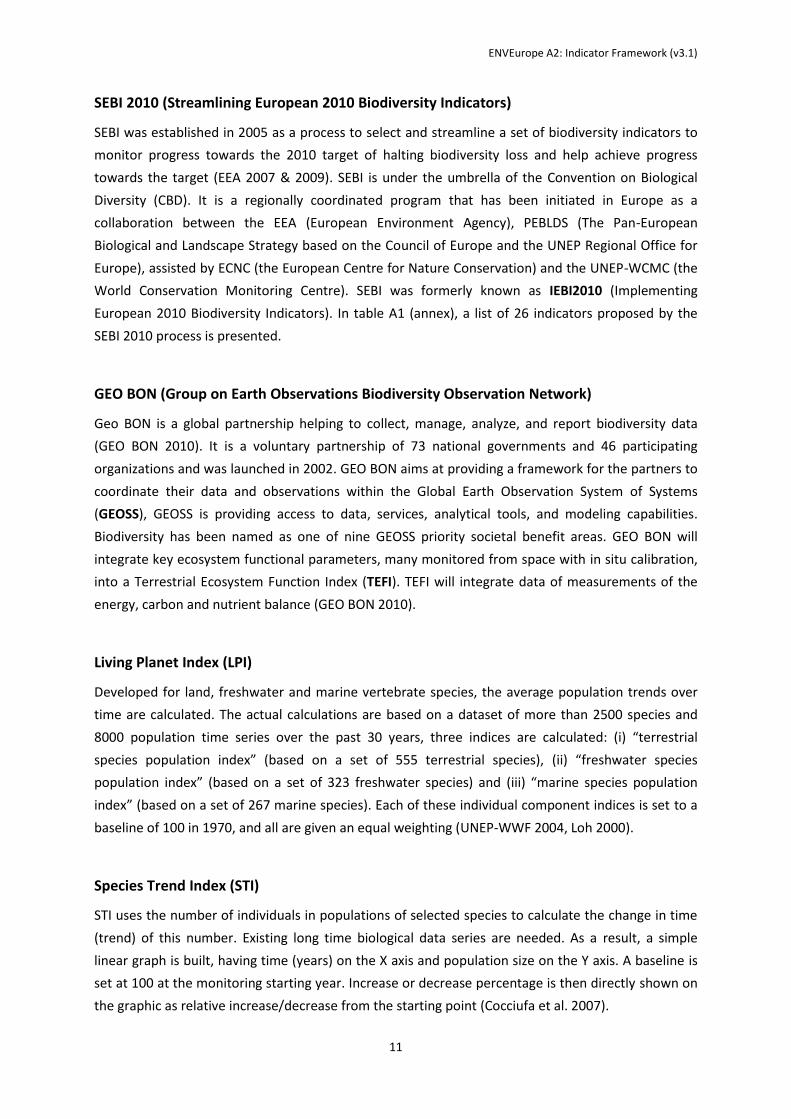
SEBI 2010 (Streamlining European 2010 Biodiversity Indicators)
SEBI was established in 2005 as a process to select and streamline a set of biodiversity indicators to
monitor progress towards the 2010 target of halting biodiversity loss and help achieve progress
towards the target (EEA 2007 & 2009). SEBI is under the umbrella of the Convention on Biological
Diversity (CBD). It is a regionally coordinated program that has been initiated in Europe as a
collaboration between the EEA (European Environment Agency), PEBLDS (The Pan-European
Biological and Landscape Strategy based on the Council of Europe and the UNEP Regional Office for
Europe), assisted by ECNC (the European Centre for Nature Conservation) and the UNEP-WCMC (the
World Conservation Monitoring Centre). SEBI was formerly known as IEBI2010 (Implementing
European 2010 Biodiversity Indicators). In table A1 (annex), a list of 26 indicators proposed by the
SEBI 2010 process is presented.
GEO BON (Group on Earth Observations Biodiversity Observation Network)
Geo BON is a global partnership helping to collect, manage, analyze, and report biodiversity data
(GEO BON 2010). It is a voluntary partnership of 73 national governments and 46 participating
organizations and was launched in 2002. GEO BON aims at providing a framework for the partners to
coordinate their data and observations within the Global Earth Observation System of Systems
(GEOSS), GEOSS is providing access to data, services, analytical tools, and modeling capabilities.
Biodiversity has been named as one of nine GEOSS priority societal benefit areas. GEO BON will
integrate key ecosystem functional parameters, many monitored from space with in situ calibration,
into a Terrestrial Ecosystem Function Index (TEFI). TEFI will integrate data of measurements of the
energy, carbon and nutrient balance (GEO BON 2010).
Living Planet Index (LPI)
Developed for land, freshwater and marine vertebrate species, the average population trends over
time are calculated. The actual calculations are based on a dataset of more than 2500 species and
8000 population time series over the past 30 years, three indices are calculated: (i) “terrestrial
species population index” (based on a set of 555 terrestrial species), (ii) “freshwater species
population index” (based on a set of 323 freshwater species) and (iii) “marine species population
index” (based on a set of 267 marine species). Each of these individual component indices is set to a
baseline of 100 in 1970, and all are given an equal weighting (UNEP-WWF 2004, Loh 2000).
Species Trend Index (STI)
STI uses the number of individuals in populations of selected species to calculate the change in time
(trend) of this number. Existing long time biological data series are needed. As a result, a simple
linear graph is built, having time (years) on the X axis and population size on the Y axis. A baseline is
set at 100 at the monitoring starting year. Increase or decrease percentage is then directly shown on
the graphic as relative increase/decrease from the starting point (Cocciufa et al. 2007).

ENVEurope A2: Indicator Framework (v3.1)
12
National Biodiversity Index (NBI)
NBI is derived from data on richness and endemism in the four terrestrial vertebrate classes and
vascular plants and adjusted to the country area (SCBD 2001).
Red Lists1
Last but not least, red lists and red list indices are of high relevance. Red lists provide a fundamental
first step for conservation planning and prioritization (Brito et al. 2010). The lists present categories
which are assigned to species based on taxonomy, conservation status and distribution and the
species status is evaluated according to their extinction risk.
Biomare
The project Biomare (2000-2002) aimed at the implementation of long-term and large-scale marine
biodiversity research and at planning the adequate use of the European research infrastructure.
Among the outputs of the project was the production of internationally agreed standardized and
normalized measures and indicators for biodiversity. Bioindicators have been considered according
to the model developed by the OECD: State, Pressure, Use and Response indicators. Therefore, the
project carried out a survey and critical evaluation of different types of bioindicators available in
Europe (so-called indicator and sentinel species, biological indices, biomarkers, lethal and sublethal
tests, bioaccumulators). Additionally, a tentative inventory of existing national monitoring networks
(e.g. sea water quality: temperature, salinity, nutrients and contaminants, phytoplankton disturbance
(especially by toxic unicellulars) or the bacteriological quality of shellfish by faecal bacteria) was
made. The main products of the project concerning bioindicators are reported in Warwick et al.
(2003) and Féral et al. (2003).
Conclusion:
Regarding biodiversity-related indicators and their use in Europe and globally, the EEA (2002)
concludes that there is an enormous variety of indicators that have been developed to assess some
aspect of biodiversity on the national, international or global scale, However, many indicators have
been proposed or developed, but only a limited number of them is actually in use on a long term
basis.
2.2.2 Integrative environmental indicator initiatives
There are numerous integrative environmental indicator sets and concepts. Relating to different
issues, these sets are compositions of aggregations ("indices") of different structure and process
indicators as well as socio-economic drivers and pressures (EEA 2002).
11
http://www.iucnredlist.org/

ENVEurope A2: Indicator Framework (v3.1)
13
Sustainability indicators (EU)
One example is the hierarchical system of sustainability indicators derived by the European Union (EC
2005). A high number of indicators are grouped in different levels covering the following 10 themes:
1. Economic development 2. Poverty and social exclusion 3. Ageing society 4. Public health 5. Climate change and energy 6. Production and consumption patterns 7. Management of natural resources 8. Transport 9. Good governance 10. Global partnership
Environmental issues are addressed in theme 5 (e.g. sub-theme climate change), theme 6 (e.g. sub-
theme agriculture), theme 7 (e.g. sub-themes biodiversity, marine ecosystems, fresh water
resources, land use) and theme 8 (e.g. sub-theme environmental impact of transport).
EEA core set of environmental indicators
This set developed by the European Environmental Agency (EEA) aims at the development and
publication of policy-relevant indicator-based reports. They include environmental signals reports
and sector-specific reports on transport (TERM) and energy (EERM). Main requirements on a core set
of environmental indicators are to meet the increasing political demands for indicator-based
reporting, to streamline indicator needs across these demands, to provide countries with clear
priorities for environmental data collection initiatives and to allow the many international
organizations to work together on a common approach (Kristensen 2003). In the 2003 report there
was a differentiation between (a) the core set of more developed indicators: climate change, air
pollution, ozone depletion, water (excluding ecological quality), waste and material flows, energy,
transport and agriculture and (b) the less developed indicator sets for biodiversity, terrestrial
environmental, water ecological quality, tourism and fisheries.
OECD
Also the OECD (Organisation for Economic Co-operation and Development) derived a set of key
environmental indicators (OECD 2004) in order to measure environmental progress, complemented
with several sets of sectoral environmental indicators to help integrate environmental concerns in
sectoral policies. These indicators are grouped into (a) pollution issues (climate change, ozone layer,
air quality, waste regulation, freshwater quality) and (b) natural resources and assets (freshwater
resources, forest resources, fish resources, energy resources and biodiversity). Additionally, the
indicators' availabilities in the OECD countries are mentioned.
ENVEurope A2: Indicator Framework (v3.1)
14
TEEB (The Economics of Ecosystem and Biodiversity)
TEEB (www.teebweb.org) aimed at applying an economic approach to environmental issues in order
to help decision makers to determine the best use of scarce ecological resources (TEEB 2010). The
major tasks were to provide information about benefits and costs, to create a common language
about natural capital and ecosystem services, to reveal opportunities to work with nature by
demonstrating where it offers cost-effective means of providing valuable services, to emphasize the
urgency of action and to generate information about values for designing policy incentives.
Natural Capital Index (NCI)
NCI is calculated as the product of the size of the residual area of an ecosystem or habitat in a given
country or region (ecosystem quantity) and its quality:
NCI = ecosystem quantity * ecosystem quality. A more detailed description can be found in ten Brink
(2000).
HANPP
Human appropriation of net primary productivity HANPP (Haberl et al. 2009 & 2007) is calculated as
the aggregated impact of land use on biomass available each year in different ecosystems. In many
regions, human land use activities have lead to a reduction of net primary production NPP. Land use
and end consumption by humans often causes HANPP exceeding NPP of the potential natural
vegetation.
Critical Load Exceedence Index (CLE)
CLE is calculated from deposition data (or input flux in general) and critical loads (CL) by computing a
simple difference: CLE = INPUT – CL.
Connectivity Indices
These are computed based on different approaches: e.g. on structural measures of connectivity
(nearest neighbor measures, buffer measures, incidence function model measures) or functional
measures of connectivity (e.g. immigration rates respective dispersal success, search time,
population spatial distribution or functional distances).
Corine Land Cover (CLC)
This program of the European Union aims at compiling information on the state of the environment
with regard to certain topics which have priority for all member states of the community (EEA 1994).
The satellite image interpretation-based CORINE land cover data sets are available as 100 meter
grids, 250 meter grids and 1 km grids with minimum mapping units of 25 ha (Burkhard et al 2009).
Most of the data can be downloaded for free from the EEA website or can be purchased at marginal

ENVEurope A2: Indicator Framework (v3.1)
15
costs. The data include 44 land cover classes which are grouped in a three-level hierarchical
nomenclature: (1) artificial surfaces, (2) agricultural areas, (3) forests and semi-natural areas, (4)
wetlands and (5) water bodies. These classes represent more or less all land cover types occurring in
Europe. The classes are clearly defined in the CLC nomenclature (EEA 1994). Besides CLC, there are
further easily available sources of satellite-based environmental information (e.g. MODIS1 or
ASTER2).
2.2.3 Indicator initiatives with special focus on marine environments
The policy of the EU Directorate-General (DG) for the Environment concerning marine environments
and costs includes four regional sea conventions: the OSPAR, HELCOM, BARCOM and BUCHAREST
conventions. More recently, the EU started to develop a marine strategy, aiming at attaining a
comprehensive assessment of the state of the marine environment, identifying the main pressures
on their respective marine regions, and defining targets and monitoring indicators:
OSPAR3
OSPAR (Oslo and Paris Conventions for the protection of the marine environment of the North-East
Atlantic) is the Convention for the Protection of the Marine Environment of the North-East Atlantic.
Within their strategy for a Joint Assessment and Monitoring Programme JAMP (OSPAR 2006), the
following six themes to structure the monitoring and assessments are mentioned: (i) general quality
status of the OSPAR maritime area, (ii) biodiversity, (iii) eutrophication, (iv) hazardous substances, (v)
offshore activities and (vi) radioactive substances. The results and data are published regularly in the
OSPAR Quality Status Reports (QSR). Over the period 1998 to 2008, these reports reflect the
contracting parties' efforts to manage, monitor and assess the pressures on the diverse ecosystems
of the North-East Atlantic.
HELCOM4
HELCOM (Helsinki Convention on the Protection of the Marine Environment of the Baltic Sea) strives
to achieve a harmonious balance of all biological components in a healthy Baltic Sea environment,
thus supporting a wide range of sustainable economic and social activities. The European Community
and all the states bordering the Baltic Sea are parties to this 1992 Convention. The convention covers
the whole of the Baltic Sea area, including inland waters as well as the water of the sea itself and the
sea-bed. Measures are also taken in the whole catchment area of the Baltic Sea in order to reduce
land-based pollution. The present contracting parties to HELCOM are Denmark, Estonia, European
Community, Finland, Germany, Latvia, Lithuania, Poland, Russia and Sweden.
1 http://modis.gsfc.nasa.gov/
2 http://asterweb.jpl.nasa.gov/
3 http://www.ospar.org
4 http://www.helcom.fi
ENVEurope A2: Indicator Framework (v3.1)
16
BARCOM1
BARCOM (Barcelona Convention for the Protection of the Marine Environment and the coastal region
of the Mediterranean) has been adopted by 22 Mediterranean countries. The contracting parties are
determined to protect the Mediterranean marine and coastal environment while boosting regional
and national plans to achieve sustainable development. The convention's main objectives are to
assess and control marine pollution, to ensure sustainable management of natural marine and
coastal resources; to integrate the environment in social and economic development; to protect the
marine environment and coastal zones through prevention and reduction of pollution, and as far as
possible, elimination of pollution (no matter whether land or sea-based), to protect the natural and
cultural heritage, to strengthen solidarity among Mediterranean coastal states and to contribute to
the improvement of the quality of life.
BUCHAREST CONVENTION2
The Bucharest Convention on the Protection of the Black Sea against Pollution(1992) initiated the
environmental cooperation in the Black Sea. Its strategic action plan for environmental protection
and sustainable management of the Black Sea is one pillar of the regional cooperation. The European
Community is not yet a party of this convention, but an amendment allowing it to participate was
proposed in April 2009. The basic objective of the Bucharest Convention is to prevent and reduce the
pollution in the Black Sea in order to protect and preserve the marine environment, and to provide a
legal framework for cooperation and concerted actions to fulfil this obligation.
Marine Strategy Framework Directive of the European Union3
Beside these four conventions, the Marine Strategy Framework Directive of the European Union
(MSFD) was recently released by the EU DG Environment. The directive targets on the management
of the marine environment. It is the first EU binding law designed to make a significant contribution
to the preservation, protection and restoration of marine ecosystems, including pollution reduction
and minimization. The marine strategy directive extends the EU water legislation WFD (Water
Framework Directive; see below) to the marine environment and constitutes the environmental
component of Europe’s new cross-sector Integrated Marine Policy. The new directive follows an
approach similar to that of the Water Framework Directive. It calls on EU Member States to ensure
the “good environmental status” of all of European marine regions and sub-regions in a similar
fashion as the Water Framework Directive sets the “good status” of freshwater and coastal waters as
its core objective. In more detail, a “good ecological status” (GES) of the European marine
ecosystems, securing the function of unpolluted, ecological diverse and dynamic oceans and seas,
has to be achieved until 2020. For this, harmonized indicator systems and classification schemes have
to be developed as an assessment instrument. Actions must be taken in cases where this GES is not
1 http://www.unepmap.org/
2 http://www.blacksea-commission.org/main.asp
3 http://ec.europa.eu/environment/water/marine/index_en.htm

ENVEurope A2: Indicator Framework (v3.1)
17
reached yet. The final goal of this directive, however, is securing the sustainable use of marine
resources for the human society, which can be interpreted as a broad diversity of ecosystem services.
The MSFD is based on an ecosystem-based approach whose scope is to manage human activities in
order to minimize their impacts on the marine ecosystems. It defines 11 qualitative descriptors for
determining GES: 1) biological diversity, 2) non-indigenous species, 3) population of commercial
fish/shellfish, 4) elements of marine food webs, 5) eutrophication, 6) sea floor integrity, 7) alteration
of hydrographical conditions, 8) contaminants, 9) contaminants in fish and seafood for human
consumption, 10) marine litter, and 11) introduction of energy, including underwater noise.
Integrated Coastal Zone Management1 (ICZM)
Since 1996, the European Commission has been working to identify and promote measures to
remedy the deterioration of its coastal zones. Special improvement of the overall situation in the
marine coastal zones that are particularly exposed to the risks of climate change is needed. To
preserve these areas appropriately, the European Commission adopted a recommendation on
Integrated Coastal Zone Management (ICZM) in 2002. ICZM integrates all policies, sectors and
interests into the planning and management of human activities to achieve sustainable coastal
development. The recommendation outlines steps, which the member states should take to develop
national strategies for ICZM. Two sets of indicators were established, one aimed to measure progress
in ICZM, the other one measuring sustainability on the coasts.
International Council for the Exploration of the Sea (ICES)
Probably the first truly international initiative for a wide-range marine monitoring originated from
the establishment of the International Council for the Exploration of the Sea (ICES) in 1902. ICES has
been gradually installing a monitoring program mainly focusing on the assessment of fish stocks, but
also assessing their food resources.
Regional initiatives
Later several regional initiatives developed with a more detailed monitoring focus on the assessment
of the ecological status of marine regions, as e.g. the Trilateral Monitoring and Assessment
Program2 (TMAP) in the Danish, Netherland's and German Wadden Sea of the North Sea.
Census of Marine Life
With its many subprograms, the Census of Marine Life program created the probably largest
research network and datasets with respect to both, regional coverage as well as organism groups
covered yet. History of marine animal populations (HMAP); Census of Marine Zooplankton (CMarZ);
1 http://ec.europea.eu/environment/iczm/home.htm
2 http://www.waddensea-secretariat.org/TMAP/Monitoring.html

ENVEurope A2: Indicator Framework (v3.1)
18
Natural Geography in Shore Areas (NaGISA); Arctic Ocean Diversity (ArcOD) are just a few examples
illustrating the broad diversity of topics covered within this program.
Among the research oriented initiatives, the MARS network and the EU network of excellence
MarBEF should be mentioned:
European network of marine research institutes stations1 (MARS network)
The MARS network is a foundation created in the early 1990s as an organization to unite marine
institutes and stations, particularly, but not exclusively, those with coastal laboratories immediately
adjacent to the sea. MARS member institutes are world leaders in fundamental marine research and
have important research facilities available that allow direct access to the oceans. MARS serves
furthermore as a forum and as an interest group and communicates with international organizations
and the managers of European research, including the Commission of the European Community in
Brussels and the Marine Board of the European Science Foundation in Strasbourg. MARS members
are located all over Europe, along the shores of the Atlantic Ocean, the North, Irish, Baltic and
Adriatic Seas, and the Black and Mediterranean Seas.
Marine Biodiversity and Ecosystem Functioning2 (MarBEF)
MarBEF is a network of excellence funded by the European Union and consisting of 94 European
marine institutes. It is a platform to integrate and disseminate knowledge and expertise on marine
biodiversity, with links to researchers, industry, stakeholders and the general public. The specific
integration effort of MarBEF is focused into the major activities: creating a virtual centre for durable
integration, creating and improving access to resources, providing specialist training, developing an
integrated data and information management system and the transformation of MarBEF's long-term,
strategic approach into policy.
2.2.4 Indicator initiatives with special focus on freshwater environments
The management of freshwater resources has started quite early because of the major importance of
clean drinking water for the development of human settlements and the many conflicts of interest
resulting from the huge diversity of water use for other reasons ranging from e.g. waste disposal to
recreation purposes. To list the broad variety of large regional, national and binational monitoring
programs developed to ensure the availability of clean freshwater for human consumption and to
allow early warning in cases of pollution would need more space than available here. Further
information on respective indicators can for example be found in Nixon et al. (2003). In fact, in the
past, EU framework programs financed different projects for the assessment of water quality in
freshwater and inland environments and for the development of stress indicators for water status,
also in relation to global climate change. However, the majority of the projects focused on single
1 http://www.marsnetwork.org/
2 https://www.marbef.org

ENVEurope A2: Indicator Framework (v3.1)
19
indicators or specific aspects of water quality and they were generally limited to short-term data
sets.
Remark to river ecosystems: In contrast to terrestrial, but also lake ecosystems, rivers have a very
high water/matter/energy throughput, and very low retention times and rates in the system. Hence,
the application of a common indicator set and the comparability to other ecosystems is an additional
challenge.
European Water Framework Directive1 (EU-WFD)
The directive 2000/60/ec of the European Parliament and of the Council of October 23rd, 2000 (EU
Water Framework Directive, WFD) establishes a legal framework to protect and restore water across
Europe and ensure its long-term, sustainable use. The directive establishes an innovative approach
for water management based on river basins, the natural geographical and hydrological units, and
sets specific deadlines for member states to protect aquatic ecosystems. The directive addresses
inland surface waters, transitional waters, coastal waters and groundwater and targets at the
achievement of a Ecological Quality Status (EQS) of all freshwater and coastal systems as well as a
good ecological potential of heavily modified or artificial water bodies in the European Union until
2015. For this, all member countries had to develop harmonized classification systems for different
types of aquatic ecosystems allowing the indication of ecosystem status by a set of defined biotic and
abiotic components. The assessments are based on biological and supporting physico-chemical and
hydromorphological elements. The status itself is assessed by comparing the observed status with a
“reference status”; i.e. the status of the respective indicator in absence of significant anthropogenic
pressures (done by comparison with reference sites). Long-term data sets are prerequisites to build
up clear definitions of the reference status and to develop comprehensive ecological indicators. The
EU-WFD aims to i) prevent degradation of aquatic ecosystems, ii) to preserve and improve their
ecological status, iii) to promote sustainable use of water resources, iv) to prevent pollution of
groundwaters, v) to enhance water protection by decreasing discharges of pollutants to water bodies
and vi) to reduce drought and flood effects. Other objectives of the WFD are vii) to ensure sufficient
supplies of good quality surface and ground waters and viii) to preserve coastal waters. Several
biological ecosystem elements, including composition and abundance of the freshwater communities
of phytoplankton, phytobenthos, macrophytes and benthic invertebrates as well as fish communities,
are taken into account in the ecological status classification in addition to water quality and hydro-
morphological conditions, which are used as supporting elements. Scientific monitoring programs in
freshwaters are diverse and typically different between running and standing waters. While
monitoring in rivers and streams is traditionally focused on benthic communities, the monitoring in
lakes and reservoirs is focused on communities in the open water zone (i.e. plankton communities).
There is an ongoing debate about the fact that zooplankton is an important component in many
scientific programs but not included in the EU-WFD.
1 http://ec.europa.eu/environment/water/water-framework/index_en.html

ENVEurope A2: Indicator Framework (v3.1)
20
Global Lake Ecological Observatory Network1 (GLEON)
Basic monitoring of lakes focuses on variables defining the trophic state, i.e. nutrient loading and
phytoplankton standing stocks. Several lake monitoring programs have recently been brought
together in the Global Lake Ecological Observatory Network (GLEON), a voluntary network of
researcher institutions. The aim of GLEON is not to define homogeneous standards for lake
monitoring, but rather to achieve effective sharing and exchange of data, particularly data having
high spatial and temporal resolution.
Further European regulations
Bathing Water Directive (76/160/ EEC): protection of the environment and public health by reducing
the pollution of bathing waters.
Nitrates Directive (91/676/EEC): reduction of water pollution caused by nitrates by reducing the
nitrogen input to agricultural land.
Urban Waste Water Treatment Directive (91/271/EEC): establishment of levels of treatment
according to the size of population served by the treatment works and the sensitivity of the waters
receiving the treated effluent. This directive will lead to a reduction in nutrient and organic matter
discharges from point sources.
Integrated Pollution Prevention and Control Directive (96/61/EC): control and prevention of water
pollution by reducing or eliminating emissions from industry.
Drinking Water Directive (98/83/EC): ensuring that water intended for human consumption is safe.
Water intended for human consumption must be free of any micro-organism, parasite or substance
that could potentially endanger human health.
The main policy objectives, all taken from EU legislation and documents, are:
to prevent further deterioration and to protect and enhance the status of aquatic ecosystems
and to ensure the progressive reduction of pollution of groundwater and prevent its further
pollution;
to achieve levels of water quality that do not give rise to unacceptable risks to human health
(and the environment). Drinking water must be free of any microorganism, parasite or substance
that could potentially endanger human health and nitrate levels must be less than the standards
(guide level 25 mg NO3/l, maximum allowable concentration 50 mg NO3/l). In addition bathing
water must achieve levels of microbiological contamination that do not give rise to significant
impacts on or risks to human health;
a progressive reduction of anthropogenic inputs of organic matter and nutrients into the water
environment where these inputs are likely to cause eutrophication and depleted oxygen
problems.
1 http://www.gleon.org/

ENVEurope A2: Indicator Framework (v3.1)
21
3 The DPSIR model as a framework linking environmental and
human systems
The Driver–Pressure–State–Impact–Response (DPSIR) model is a tool that helps to identify and
describe processes and interactions in human–environmental systems (EEA 2006, Burkhard & Müller
2008). It facilitates the analysis of specific cause–effect relationships within these systems. The first
component includes the Drivers of human action (e.g. need for food, shelter or energy). These needs
and related actions cause a Pressure on the environment (e.g. by land use, land cover change,
pollution), which might change the State respectively the integrity of ecosystems. A change of the
ecological state normally has an Impact on the provision of ecosystem goods and services and
thereby, on social and economic welfare of societies. An alteration of the social and economic
welfare leads to Responses, which at best will try to improve the situation and to mitigate negative
impacts. In a next iteration of this simplifying cause-effect model, the drivers constellation might
change, leading to new decisions, new pressures etc.
Referring to the concepts of ecosystem integrity and ecosystem services it can be postulated that
ecological integrity (respective relevant ecosystem structures and processes) forms the base for the
provision of ecosystem services. These services are the base for human well-being. Human decisions
and actions (e.g. land use) again have an impact on the state of the environment (Figure 2).
Figure 2: Ecosystem integrity as the base for the provision of ecosystem services and finally,
human welfare, based on the DPSIR model.
Land use is one of the most important pressures affecting the structures and processes in
ecosystems. This is due to the fact that 50-90% of the land surface is under permanent land
management (land use). Land use is affecting natural and semi natural ecosystems or habitats as well
as agricultural systems, as the latter often build the matrix for (semi-)natural systems. Land
cover/land use and respective changes can be analyzed with the help of remote sensing data (e.g.
CORINE land cover data, MODIS). These data provide logical and reproducible information about the
earth's surface. From some remote sensing systems, additional information which is relevant for
environmental assessments (e.g. for the indication of ecological integrity, of primary productivity)
can be derived. Moreover, data from different time periods, which often are available, enable the
ENVEurope A2: Indicator Framework (v3.1)
22
assessment of temporal dynamics. One of the ideas in ENVEurope is to collect satellite-based land
cover information in GIS format from all sites and thereby further integrate land cover/land use
assessments into the framework. However, relevant questions of representativeness of these data
for the particular sites (and their surrounding), appropriate scales and ground truth needs have to be
solved.
4 Ecological integrity as a concept for indicator derivation
Ecological integrity indicator sets can be seen as theoretical holistic system indicators, taking into
account the requirements for good indicators mentioned above. Ecological integrity has been
defined by Barkmann et al. (2001) as a political target for the preservation against non-specific
ecological risks, which are general disturbances of the self-organizing capacity of ecological systems.
Therefore, those processes and structures, which are essential prerequisites of the ecological ability
for self-organization, have to be supported and preserved. Ecosystem service indicators can be seen
as a next step, bringing socio-economic components into the human-environmental system (chapter
5). The differentiation between the concepts of ecosystem health and ecological integrity is usually
done by arguing that integrity is focusing on more pristine, self-organized systems, whereas health is
referring rather to systems under human use (Burkhard et al. 2008). However, ecosystem health and
ecological integrity are very closely linked concepts.
Following the concept of self-organization (Jørgensen 1996, Müller 1997, Jørgensen and Müller 2000,
Ulanowicz 2000), the order of ecological systems emerges from spontaneous processes which
operate without consciously regulating influences from the system's environment. The consequences
have been condensed within the “orientor” approach (Bossel 1998, 2000, Müller and Leupelt 1998),
a systems-based theory about ecosystem development, which is founded on the general ideas of
non-equilibrium thermodynamics (Jørgensen 1996, 2000, Schneider and Kay 1994, Kay 2000) and
network development (Fath and Patten 1998) on the one hand and succession theory on the other
(e.g. Odum 1969, Dierssen 2000).
These theories state that self-organized systems are capable of creating structures and gradients if
they receive a flow-through of exergy (usable energy, or the energy fraction of a system which can be
transferred into mechanical work, see Jørgensen 2000). This “high quality” energy fraction is
transformed within metabolic reactions, producing non-convertible energy fractions (entropy), which
have to be exported into the environment of the system. As a result of these energy conversion
processes, gradients (structures) are built up and maintained, leading to ordered structures and
storages of the imported exergy within biomass, detritus and information (e.g. genetic information)
as well as a growing degradation of the applied gradients, which is necessary for the maintenance of
the system (Schneider and Kay 1994).
Hence, throughout an undisturbed development of an ecosystem (i.e. a succession), there are certain
characteristics which are increasing steadily and slowly, developing towards a state which is

ENVEurope A2: Indicator Framework (v3.1)
23
restricted by the specific site conditions and the prevailing ecological processes. These basic
thermodynamic principles have many consequences on other ecosystem features. For instance,
heterogeneity, species richness and connectedness will rise, the food web will become more complex
and many other attributes will follow a similar long-term trajectory (Müller & Burkhard 2007).
Unfortunately, many of these orientors cannot be easily measured or even modeled under usual
circumstances. Some orientors can only be calculated on the base of very comprehensive data sets
which are measured on a very small number of sites only. Other orientors can only be quantified by
model applications. Therefore, the selected indicators have to be represented by parameters which
are accessible by traditional methods of ecosystem quantification. Consequently, the next step of
indicator derivation is a “translation” of the theoretical items into ecosystem analytical variables.
Within this step, it has to be reflected that the number of indicators should be reduced as far as
possible. Thus, many ecosystem variables cannot be taken into account for practical reasons. Instead,
a small set consisting of the most important items which can be calculated or measured in many local
instances is what we have to look for. This set should be based on the focal parameters of ecosystem
research which can be made accessible in comprehensive monitoring networks (Müller et al. 2000)
such as LTER.
When working with ecological indicators and complex ecosystems, it is important to be aware of the
focal target of the indication. Indicators are used for the indirect comprehension of complex, not
direct approachable phenomena (indicanda). By correlations with parameters (in the sense of
measurable variables)1it is possible to describe the state and development of the indicandum
quantitatively (Baumann 2001). Indicators help to assess environmental conditions, referring to the
biotic, abiotic or process components of the investigated system. A hierarchical understanding of the
indicator system, including the following components, is useful:
(ecological) Orientor: Goal function of ecosystem development/succession considering
specific environmental conditions.
Indicandum: the (complex) phenomenon for which comprehension is desired.
Indicator: a variable which provides aggregated information on a certain phenomenon.
Parameter: data/numbers used to quantify the respective indicator. Parameters can
originate directly from measurements, from modeling or they can be calculated based on
further parameters (e.g. efficiency measures).
Depending on the topics to address, indicandum-indicator hierarchies might change. Therefore, one
indicandum can become an indicator itself when the indicandum's hierarchical level is changed (for
example, "flora diversity" is an indicator for the indicandum "biotic diversity" which again is an
1 The terms variable and parameter are used differently (respectively synonymously) in different scientific
disciplines. In order to avoid confusion, we used parameter throughout the whole text as defined above and as
mentioned in the subproject's objectives. We are not referring to parameters as description of driving forces or
constant values in ecological modeling.
ENVEurope A2: Indicator Framework (v3.1)
24
indicator for the indicandum "ecosystem structures" which again is an indicator for our overall
indicandum "ecological integrity").
The focal components which should be taken into account to represent ecosystem integrity are
ecosystem structures (biotic diversity, abiotic heterogeneity, habitat diversity) and ecosystem
processes (ecosystem energy balance, water balance, matter balance). For a detailed justification see
Müller & Burkhard (2010). On the base of the features mentioned above, a general indicator set to
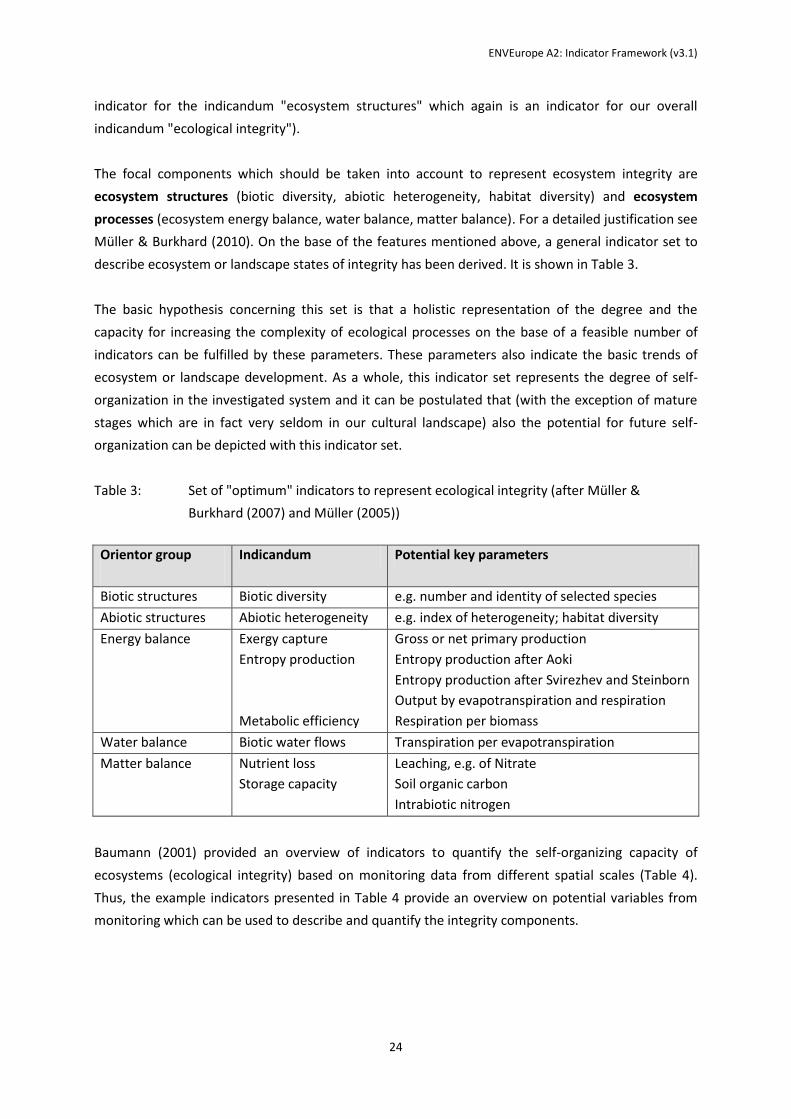
describe ecosystem or landscape states of integrity has been derived. It is shown in Table 3.
The basic hypothesis concerning this set is that a holistic representation of the degree and the
capacity for increasing the complexity of ecological processes on the base of a feasible number of
indicators can be fulfilled by these parameters. These parameters also indicate the basic trends of
ecosystem or landscape development. As a whole, this indicator set represents the degree of self-
organization in the investigated system and it can be postulated that (with the exception of mature
stages which are in fact very seldom in our cultural landscape) also the potential for future self-
organization can be depicted with this indicator set.
Table 3: Set of "optimum" indicators to represent ecological integrity (after Müller &
Burkhard (2007) and Müller (2005))
Orientor group
Indicandum Potential key parameters
Biotic structures Biotic diversity e.g. number and identity of selected species
Abiotic structures Abiotic heterogeneity e.g. index of heterogeneity; habitat diversity
Energy balance Exergy capture
Entropy production
Metabolic efficiency
Gross or net primary production
Entropy production after Aoki
Entropy production after Svirezhev and Steinborn
Output by evapotranspiration and respiration
Respiration per biomass
Water balance Biotic water flows Transpiration per evapotranspiration
Matter balance Nutrient loss
Storage capacity
Leaching, e.g. of Nitrate
Soil organic carbon
Intrabiotic nitrogen
Baumann (2001) provided an overview of indicators to quantify the self-organizing capacity of
ecosystems (ecological integrity) based on monitoring data from different spatial scales (Table 4).
Thus, the example indicators presented in Table 4 provide an overview on potential variables from
monitoring which can be used to describe and quantify the integrity components.

ENVEurope A2: Indicator Framework (v3.1)
25
Table 4: Indicators to quantify the self-organizing capacity of ecosystems (ecological integrity)
(after Baumann 2001)
Indicandum Example indicators - monitoring at
local scales
Example indicators - monitoring at
landscape scales
Exergy capture gross primary production leaf area index
Entropy production entropy balance after Aoki (1987) simplified entropy balance
Biotic diversity numbers of selected species (guilds) numbers of selected species (less species
groups)
Abiotic heterogeneity heterogeneity index (local scale) heterogeneity index (landscape scale)
Storage capacity biomass; stored intrabiotic N and P biomass; stored intrabiotic N and P
Nutrient loss Nitrogen loss (atmospheric and
infiltration)
Nitrogen loss (infiltration)
Biotic water flows transpiration / total evaporation surface phytomass
Metabolic efficiency respiration loss / biomass (energy
usage)
soil respiration per soil biomass (qCO2
destruents)
4.1 Compilation of useful indicators suitable for LTER-Europe sites
According to the ecosystem integrity based indicator concept, the main components to describe the
state of ecosystems (according to the "State" component within the DPSIR model; chapter 3) are
their structures and processes.
Structures have so far been described by biotic diversity (flora and fauna) and abiotic heterogeneity
(soils, water, air - forming the habitats). Biotic diversity includes several components. Basically it
starts with the number and identity of species, followed by numbers of individuals per species and it
may end up with the genetic diversity at the population level. Additionally, biotic diversity has
something to do with species traits, which is reflected in functional groups resulting in process-
diversity. In order to be able also to address biotic habitat components (such as e.g. forest canopy
layers), a further category "habitat structure" covering the physical structure of the biotic component
is included in the "biotic diversity" indicator group (corresponding to "habitat heterogeneity" in the
abiotic heterogeneity indicator group). Moreover, an ancillary "additional variables" section is
included for all indicator topics. There, relevant data such as on invasive species within the biotic
diversity indicator group or genetic diversity can be integrated if available. These data can provide
important information on the state of the ecosystem but also about pressures on the ecosystem (e.g.
by invasive species, pollutants etc.). More comprehensive information about invasive species and
how to indicate their role for ecosystem functioning can be found from the SEBI initiative (EEA 2007
& 2009).
Processes in ecosystems (cycling of energy, matter and water), are characterized by indicators of
inputs, storages and outputs. In order to avoid-double counting of energy components, for practical
reasons a distinction has been defined between:

ENVEurope A2: Indicator Framework (v3.1)
26
a) free physical energy (e.g. light, heat, hydrodynamics) as a component of the energy budget and
b) chemically bound energy (e.g. stored in biomass, nutrients in the soil) which is seen to be part of
the matter budget.
Even though this distinction might be too static and perhaps too pragmatic in some cases, it seems to
facilitate the work with the data from the different LTER sites (pers. comm. ENVEurope workshop
Halle, Dec 2010). Based on the values for indicators of processes mentioned before and additional
ecosystem state variables (if available), efficiency measures can be calculated (e.g. metabolic
efficiency=respiration/biomass).
Trans-domain indication, meaning to make terrestrial, freshwater and marine sites comparable and
to find suitable indicator-parameter sets from all sites, will be one major challenge for ENVEurope
and for the LTER network. Some processes are perhaps very different in the particular systems, e.g.
input-output balances, biomass production in fast flowing river ecosystems, biotic water flows might
be difficult to be indicated in freshwater and marine ecosystems. However, structural indicators like
habitat diversity which can be historically linked to land use changes have a higher potential to be
suitable for trans-domain indication.
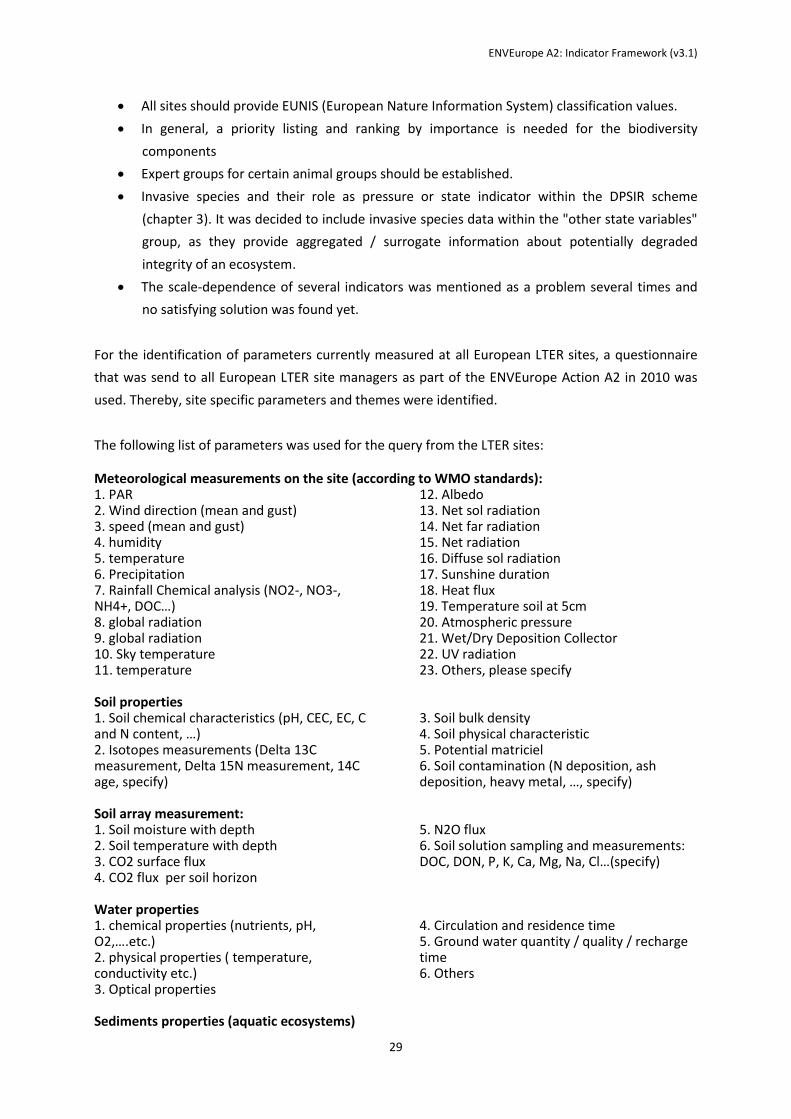
Table 5 provides an overview of the hierarchical framework for the ecological integrity indicators for
the different ENVEurope/LTER ecosystem types.
Table 5: Hierarchical overview of ecological integrity indicator system for different LTER
ecosystem types. Indicators/parameters have to be selected and agreed upon by the
ENVEurope / LTER community.
Indicandum
LTER ecosystem type
terrestrial
ecosystems
freshwater
ecosystems
marine
ecosystems
eco
syst
em
str
uct
ure
s biotic diversity
flora diversity Indicator indicator indicator
fauna diversity Indicator indicator indicator
habitat structure Indicator indicator indicator
additional variables Indicator indicator indicator
abiotic heterogeneity
soil heterogeneity Indicator indicator indicator
water heterogeneity Indicator indicator indicator
air heterogeneity Indicator indicator indicator
habitat heterogeneity Indicator indicator indicator
additional variables Indicator indicator indicator
eco
syst
em
pro
cess
energy budget
input exergy capture Indicator indicator indicator
storage exergy storage Indicator indicator indicator
output entropy production Indicator indicator indicator
additional state variables
meteorology Indicator indicator indicator

ENVEurope A2: Indicator Framework (v3.1)
27
efficiency measures
metabolic efficiency Indicator indicator indicator
matter budget
input matter input Indicator indicator indicator
storage matter storage Indicator indicator indicator
output matter loss Indicator indicator indicator
additional state variables
element concentrations Indicator indicator indicator
efficiency measures
nutrient cycling Indicator indicator indicator
water budget
input water input Indicator indicator indicator
storage water storage Indicator indicator indicator
output water output Indicator indicator indicator
additional state variables
element concentrations Indicator indicator indicator
efficiency measures
biotic water flow Indicator indicator indicator
4.2 Synthesis of identified indicators and parameters already measured at
LTER sites: Evaluation and importance
A huge amount of data related to a high variety of themes is collected at the LTER sites. One of the
main challenges in ENVEurope is to identify appropriate indicator-parameter (observation data)
relationships. They have to (i) be commonly measured at many sites, (ii) regarded as important for
the monitored ecosystem, (iii) enable a trans-domain indication and comparison of the sites and (iv)
reflect the peculiarity of each individual site and its monitoring program.
In order to test the indicator framework's applicability as well as the data availability, a quick survey
was carried out with the participants of the ENVEurope action A2 workshop in Halle 2010, December
02nd-03rd. The 27 participants of the workshop were representing different LTER sites from all over
Europe (Italy, Spain, Finland, Bulgaria, Lithuania, Romania, Poland, Portugal, Hungary, Austria,
Germany). All three ENVEurope ecosystem domains (terrestrial, freshwater, marine) were
represented but a clear dominance of terrestrial site managers compared to marine and freshwater
sites was obvious.
In this quick survey, the site managers were asked to identify, which data are available from "their"
sites as parameters for the quantification of the particular ecological integrity indicators. As the
structure indicators within the ecological integrity concept are indispensable and have to be
measured anyway at each site, the survey focused on prioritization of process indicators. The
minimum target was to define at least one parameter for each of the five ecological integrity
indicanda (biotic diversity, abiotic heterogeneity, energy budget, matter budget, water budget). The
second question in this quick survey was concerning parameters which were assessed to be most
important to be addressed.

ENVEurope A2: Indicator Framework (v3.1)
28
Each site manager was asked to chart the data availability at her/his site and to state at the same
time, whether this parameter is/would be important to be measured at the site. As a result, counts
of (a) data available at the sites for the individual ecological integrity indicators, and (b) their
importance to be measured were derived. By adding up the individual statements and by calculating
the differences between the sums of the data availabilities and their importance, data coverage and
gaps can be identified. If the difference between a parameter's importance and its availability is
positive, a gap within the measured parameters is likely. Table 6 shows the results of the workshop
survey.
Table 6: Results from the survey at the ENVEurope workshop 2010 in Halle regarding the
availability and importance of parameters monitored at LTER sites for the
quantification of the ecological integrity indicators. (Note: the ranking was done on
flipcharts by workshop participants, separately for "solid" and "liquid" work groups:
each person was allowed to distribute 5 votes for a ranking across ecosystem
processes; values in green and red have highest numbers).
A lot of parameters are available for estimating “other state variables” (energy, matter, and water
budget), although they were not rated particularly essential for indicating ecological integrity. On the
other side, energy, matter, and water efficiency were ranked as very important indicators, but there
are not enough reliable parameters available to estimate them. In general, indicators of water
budget were considered less important than those of energy and matter budget, perhaps because
forest sites with no water deficiency was well represented in ENVEurope.
Regarding ecosystem structures (which were not surveyed here), some relevant remarks were
provided during the workshop:
β-diversity was regarded to be more important than α-diversity.
Birds and butterflies are a good starting point for the indication of fauna diversity.
rive
rs &
stre
ams
lake
eco
syst
ems
mar
ine
eco
syst
ems
Sum
aquatic
ecosystems
Sum
terrestrial
ecosystems rive
rs &
stre
ams
lake
eco
syst
ems
mar
ine
eco
syst
ems
Sum aquatic
ecosystems
Sum
terrestrial
ecosystems
Δ
aquatic
ecosystems
Δ
terrestrial
ecosystems
input 2 4 2 8 9 2 3 2 7 6 -1 -3
storage 1 3 2 6 6 1 1 6 -5 0
output 1 1 8 1 1 2 1 1 -7
other state variables 4 2 6 9 0 3 -6 -6
efficiency measures 1 3 2 6 4 2 1 1 4 5 -2 1
input 1 2 1 4 11 2 3 1 6 5 2 -6
storage 2 4 2 8 9 1 3 1 5 7 -3 -2
output 4 1 5 7 1 2 3 5 -2 -2
other state variables 1 3 4 9 0 2 -4 -7
efficiency measures 1 1 7 2 1 3 7 2 0
input 2 4 2 8 9 3 1 4 6 -4 -3
storage 1 2 1 4 4 1 1 2 2 -2 -2
output 1 3 1 5 4 2 2 2 -3 -2
other state variables 1 2 1 4 11 1 1 4 -3 -7
efficiency measures 0 2 0 4 0 2
Difference (importance-
availability)Parameters most important to addressData availability
Ecological integrity indicators
eco
syst
em
pro
cess
es
energy
budget
matter
budget
water budget
ENVEurope A2: Indicator Framework (v3.1)
29
All sites should provide EUNIS (European Nature Information System) classification values.
In general, a priority listing and ranking by importance is needed for the biodiversity
components
Expert groups for certain animal groups should be established.
Invasive species and their role as pressure or state indicator within the DPSIR scheme
(chapter 3). It was decided to include invasive species data within the "other state variables"
group, as they provide aggregated / surrogate information about potentially degraded
integrity of an ecosystem.
The scale-dependence of several indicators was mentioned as a problem several times and
no satisfying solution was found yet.
For the identification of parameters currently measured at all European LTER sites, a questionnaire
that was send to all European LTER site managers as part of the ENVEurope Action A2 in 2010 was
used. Thereby, site specific parameters and themes were identified.
The following list of parameters was used for the query from the LTER sites: Meteorological measurements on the site (according to WMO standards): 1. PAR 2. Wind direction (mean and gust) 3. speed (mean and gust) 4. humidity 5. temperature 6. Precipitation 7. Rainfall Chemical analysis (NO2-, NO3-, NH4+, DOC…) 8. global radiation 9. global radiation 10. Sky temperature 11. temperature
12. Albedo 13. Net sol radiation 14. Net far radiation 15. Net radiation 16. Diffuse sol radiation 17. Sunshine duration 18. Heat flux 19. Temperature soil at 5cm 20. Atmospheric pressure 21. Wet/Dry Deposition Collector 22. UV radiation 23. Others, please specify
Soil properties 1. Soil chemical characteristics (pH, CEC, EC, C and N content, …) 2. Isotopes measurements (Delta 13C measurement, Delta 15N measurement, 14C age, specify)
3. Soil bulk density 4. Soil physical characteristic 5. Potential matriciel 6. Soil contamination (N deposition, ash deposition, heavy metal, …, specify)
Soil array measurement: 1. Soil moisture with depth 2. Soil temperature with depth 3. CO2 surface flux 4. CO2 flux per soil horizon
5. N2O flux 6. Soil solution sampling and measurements: DOC, DON, P, K, Ca, Mg, Na, Cl…(specify)
Water properties 1. chemical properties (nutrients, pH, O2,….etc.) 2. physical properties ( temperature, conductivity etc.) 3. Optical properties
4. Circulation and residence time 5. Ground water quantity / quality / recharge time 6. Others
Sediments properties (aquatic ecosystems)

ENVEurope A2: Indicator Framework (v3.1)
30
1. Physical characteristics (water content porosity, granulometry….) 2. Chemical characteristics (pH, CEC, EC, C, N and P content, …) 3. Isotopes measurements (Delta 13C measurement, Delta 15N measurement, 14C age, specify)
4. Potential matriciel 5. Contamination (N deposition, ash deposition, heavy metal, …, specify)
Autotrophic compartment. Please indicate organism group! 1.Abundance 2.Biomass 3.Phenology 4. Biodiversity 5. Production
6. LAI 7. C and N content 8. C, N, Mg, K, P, Na, content... 9. Other
Heterotrophic compartment (procaryotic and eucaryotic) Please indicate organism group! 1.Abundance 2.Biomass 3.Phenology 4. Biodiversity (incl. species richness, dominance structure, composition)
5. C and N content 4. DNA storage 6. Other
Biodiversity: For each taxonomic group, how many plots/stations and which area do they cover/represent? Inventory of entire site? Population biology parameters (mortality, germination, individual based tree data, etc.)? Frequency of observations? Length of time series? Do habitat maps exist (relevant for catchments)? Please add any other measurements being done and which are important for your group 1. Procariots 2. Microalgae 3. Macroalgae 4. Vascular plants / Aquatic macrophytes 5. Lichens 6. Mosses 7. Fungi 8. Annelida 9. Molluscs 10. Crustaceans 11. Insects
12. Spiders 13. Other Arthropods 14. Amphibians 15. Reptiles 16. Mammals: small mammals 17. mammals: ungulates 18. Birds 19. Fish 20. Others 21. Other categories: Zooplankton, Meiofauna, Benthic macroinvertebrates
22. Paleolimnological samples (diatoms, ostracods, chironomid headcapsules, chaoborus mandibles,
fish scales etc.) Lake sediment are integrating information on the environmental change (e.g. climate
change
Many of the data monitored fit well with the concept of ecological integrity and respective indicators
presented above. Tables 7/1-7/3 link the ecological integrity components and indicators (from Table
5) to the parameters from the LTER questionnaire. Note that this is just a qualitative assignment,
neither considering the availability and frequency of parameters nor the quality measured at the
sites.
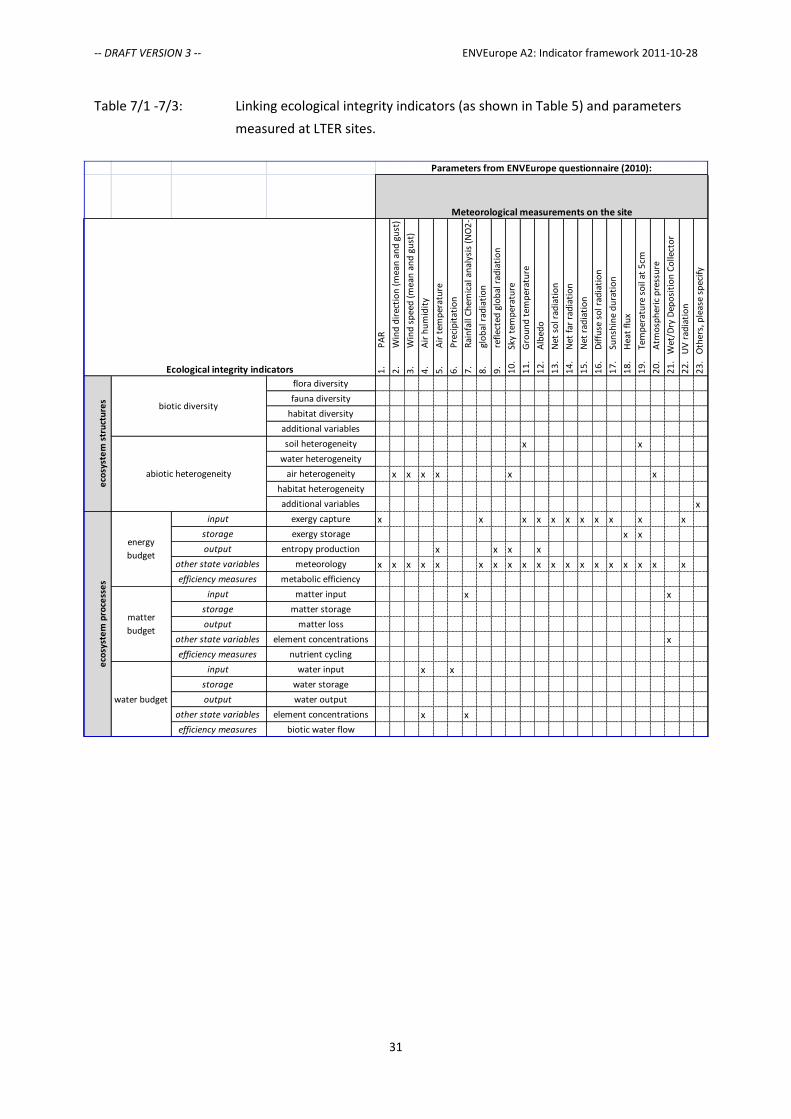
-- DRAFT VERSION 3 -- ENVEurope A2: Indicator framework 2011-10-28
31
Table 7/1 -7/3: Linking ecological integrity indicators (as shown in Table 5) and parameters
measured at LTER sites.
1.
PA
R
2.
Win
d d
irec
tio
n (
mea
n a
nd
gu
st)
3.
Win
d s
pee
d (
mea
n a
nd
gu
st)
4.
Air
hu
mid
ity
5.
Air
tem
per
atu
re
6.
Pre
cip
itat
ion
7.
Rai
nfa
ll C
hem
ical
an
alys
is (
NO
2-,
NO
3-,
NH
4+,
DO
C…
)
8.
glo
bal
rad
iati
on
9.
refl
ecte
d g
lob
al r
adia
tio
n
10
.
Sky
tem
per
atu
re
11
.
Gro
un
d t
emp
erat
ure
12
.
Alb
edo
13
.
Net
so
l rad
iati
on
14
.
Net
far
rad
iati
on
15
.
Net
rad
iati
on
16
.
Dif
fuse
so
l rad
iati
on
17
.
Sun
shin
e d
ura
tio
n
18
.
Hea
t fl
ux
19
.
Tem
per
atu
re s
oil
at 5
cm
20
.
Atm
osp
her
ic p
ress
ure
21
. W
et/D
ry D
epo
siti
on
Co
llect
or
22
. U
V r
adia
tio
n
23
. O
ther
s, p
leas
e sp
ecif
y
flora diversity
fauna diversity
habitat diversity
additional variables
soil heterogeneity x x
water heterogeneity
air heterogeneity x x x x x x
habitat heterogeneity
additional variables x
input exergy capture x x x x x x x x x x x
storage exergy storage x x
output entropy production x x x x
other state variables meteorology x x x x x x x x x x x x x x x x x x x
efficiency measures metabolic efficiency
input matter input x x
storage matter storage
output matter loss
other state variables element concentrations x
efficiency measures nutrient cycling
input water input x x
storage water storage
output water output
other state variables element concentrations x x
efficiency measures biotic water flow
Parameters from ENVEurope questionnaire (2010):
eco
syst
em
str
uct
ure
s
Ecological integrity indicators
eco
syst
em
pro
cess
es
energy
budget
matter
budget
water budget
biotic diversity
Meteorological measurements on the site
abiotic heterogeneity

-- DRAFT VERSION 3 -- ENVEurope A2: Indicator framework 2011-10-28
32
1. S
oil
chem
ical
ch
arac
teri
stic
s (p
H, C
EC, E
C, C
an
d N
co
nte
nt,
…)
2. I
soto
pes
mea
sure
men
ts
3. S
oil
bu
lk d
ensi
ty
4. S
oil
ph
ysic
al c
har
acte
rist
ic
5. P
ote
nti
al m
atri
ciel
6. S
oil
con
tam
inat
ion
(N
dep
osi
tio
n, a
sh d
epo
siti
on
, hea
vy m
etal
, …, s
pec
ify)
1. S
oil
mo
istu
re w
ith
dep
th
2. S
oil
tem
per
atu
re w
ith
dep
th
3. C
O2
su
rfac
e fl
ux
4. C
O2
flu
x p
er s
oil
ho
rizo
n
5. N
2O
flu
x
6. S
oil
solu
tio
n s
amp
ling
and
mea
sure
men
ts:
DO
C, D
ON
, P, K
, Ca,
Mg,
Na,
Cl…
1. c
hem
ical
pro
per
ties
(n
utr
ien
ts, p
H, O
2,…
.ecc
.)
2. p
hys
ical
pro
per
ties
( t
emp
erat
ure
, co
nd
uct
ivit
y et
c.)
3. O
pti
cal p
rop
erti
es
4. C
ircu
lati
on
an
d r
esid
ence
tim
e
5. G
rou
nd
wat
er q
uan
tity
/ q
ual
ity
/ re
char
ge t
ime
6. O
ther
s
1. P
hys
ical
ch
arac
teri
stic
s (w
ater
co
nte
nt
po
rosi
ty, g
ran
ulo
met
ry…
.)
2. C
hem
ical
ch
arac
teri
stic
s (p
H, C
EC, E
C, C
, N
an
d P
co
nte
nt,
…)
3. I
soto
pes
mea
sure
men
ts
4. P
ote
nti
al m
atri
ciel
5. C
on
tam
inat
ion
(N
dep
osi
tio
n, a
sh d
epo
siti
on
, hea
vy m
etal
, …, s
pec
ify)
1.A
bu
nd
ance
2.B
iom
ass
3.P
hen
olo
gy
4. B
iod
iver
sity
5. P
rod
uct
ion
6. L
AI
7. C
an
d N
co
nte
nt
8. C
, N, M
g, K
, P, N
a, c
on
ten
t...
9. O
ther
flora diversity x x
fauna diversity
habitat diversity x x x x x
additional variables x
soil heterogeneity x x x x x x x x x x
water heterogeneity x x x
air heterogeneity
habitat heterogeneity
additional variables x
input exergy capture x x x
storage exergy storage x x x x
output entropy production x x
other state variables meteorology x
efficiency measures metabolic efficiency x
input matter input
storage matter storage x x x x x x x x x
output matter loss x x x x x x
other state variables element concentrations x x x x x x x
efficiency measures nutrient cycling x
input water input x x
storage water storage x x x
output water output x x
other state variables element concentrations x x x x
efficiency measures biotic water flow
eco
syst
em
pro
cess
es
energy
budget
matter
budget
water budget
Soil properties
Ecological integrity indicators
Soil array
measurement
Autotrophic compartment.
incl.organism groupWater properties
Sediment
properties
(aquatic)
Parameters from questionnaire for ENVEurope LTER-sites (2010):
eco
syst
em
str
uct
ure
s
biotic diversity
abiotic heterogeneity
1.A
bu
nd
ance
2.B
iom
ass
3.P
hen
olo
gy
4. B
iod
iver
sity
(in
cl. s
pec
ies
rich
nes
s, d
om
inan
ce s
tru
ctu
re, c
om
po
siti
on
)
5. C
an
d N
co
nte
nt
4. D
NA
sto
rage
6. O
ther
1. P
roca
rio
ts
2. M
icro
alga
e
3. M
acro
alga
e
4. V
ascu
lar
pla
nts
/ A
qu
atic
mac
rop
hyt
es
5. L
ich
ens
6. M
oss
es
7. F
un
gi
8. A
nn
elid
a
9. M
ollu
scs
10
. Cru
stac
ean
s
11
. In
sect
s
12
. Sp
ider
s
13
. Oth
er A
rth
rop
od
s
14
. Am
ph
ibia
ns
15
. Rep
tile
s
16
. Mam
mal
s: s
mal
l mam
mal
s
17
. mam
mal
s: u
ngu
late
s
18
. Bir
ds
19
. Fis
h
20
. Oth
ers
21
.Oth
er c
ateg
ori
es:
Zoo
pla
nct
on
, Mei
ofa
un
a, B
enth
ic m
acro
inve
rteb
rate
s
flora diversity x x x x x x
fauna diversity x x x x x x x x x x x x x x x x x
habitat diversity x x x x x x x x x x x x x x
additional variables x x x
soil heterogeneity
water heterogeneity
air heterogeneity
habitat heterogeneity
additional variables
input exergy capture x
storage exergy storage x x
output entropy production
other state variables meteorology x
efficiency measures metabolic efficiency
input matter input
storage matter storage x
output matter loss
other state variables element concentrations
efficiency measures nutrient cycling
input water input
storage water storage
output water output
other state variables element concentrations
efficiency measures biotic water flow
Parameters from questionnaire for ENVEurope LTER-sites (2010):
Heterotrophic
compartment Biodiversity
eco
syst
em
str
uct
ure
se
cosy
ste
m p
roce
sse
s
energy
budget
matter
budget
water budget
Ecological integrity indicators
biotic diversity
abiotic heterogeneity
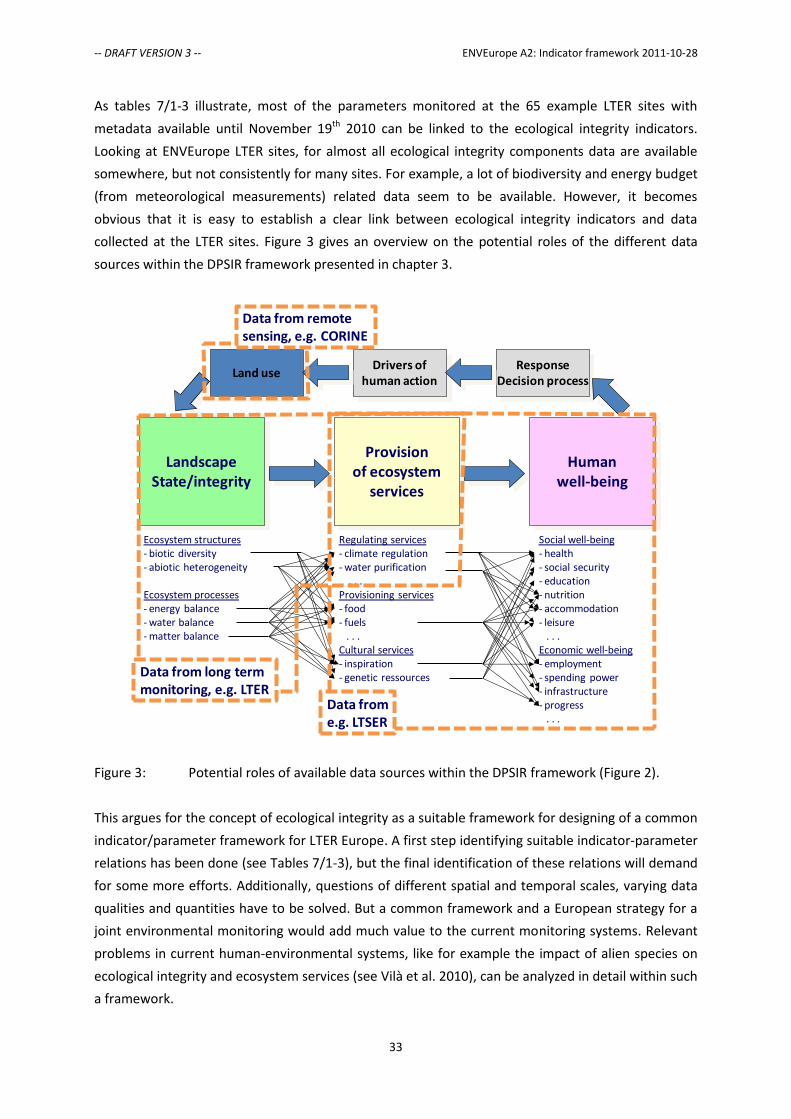
-- DRAFT VERSION 3 -- ENVEurope A2: Indicator framework 2011-10-28
33
As tables 7/1-3 illustrate, most of the parameters monitored at the 65 example LTER sites with
metadata available until November 19th 2010 can be linked to the ecological integrity indicators.
Looking at ENVEurope LTER sites, for almost all ecological integrity components data are available
somewhere, but not consistently for many sites. For example, a lot of biodiversity and energy budget
(from meteorological measurements) related data seem to be available. However, it becomes
obvious that it is easy to establish a clear link between ecological integrity indicators and data
collected at the LTER sites. Figure 3 gives an overview on the potential roles of the different data
sources within the DPSIR framework presented in chapter 3.
Figure 3: Potential roles of available data sources within the DPSIR framework (Figure 2).
This argues for the concept of ecological integrity as a suitable framework for designing of a common
indicator/parameter framework for LTER Europe. A first step identifying suitable indicator-parameter
relations has been done (see Tables 7/1-3), but the final identification of these relations will demand
for some more efforts. Additionally, questions of different spatial and temporal scales, varying data
qualities and quantities have to be solved. But a common framework and a European strategy for a
joint environmental monitoring would add much value to the current monitoring systems. Relevant
problems in current human-environmental systems, like for example the impact of alien species on
ecological integrity and ecosystem services (see Vilà et al. 2010), can be analyzed in detail within such
a framework.
LandscapeState/integrity
Provisionof ecosystem
services
Humanwell-being
Ecosystem structures- biotic diversity- abiotic heterogeneity
Ecosystem processes- energy balance- water balance- matter balance
Regulating services- climate regulation- water purification
. . .Provisioning services- food- fuels
. . .Cultural services- inspiration- genetic ressources
. . .
Social well-being- health- social security- education- nutrition- accommodation- leisure
. . . Economic well-being- employment- spending power- infrastructure- progress
. . .
Land useDrivers of
human actionResponse
Decision process
Data from long termmonitoring, e.g. LTER
Data frome.g. LTSER
Data from remotesensing, e.g. CORINE
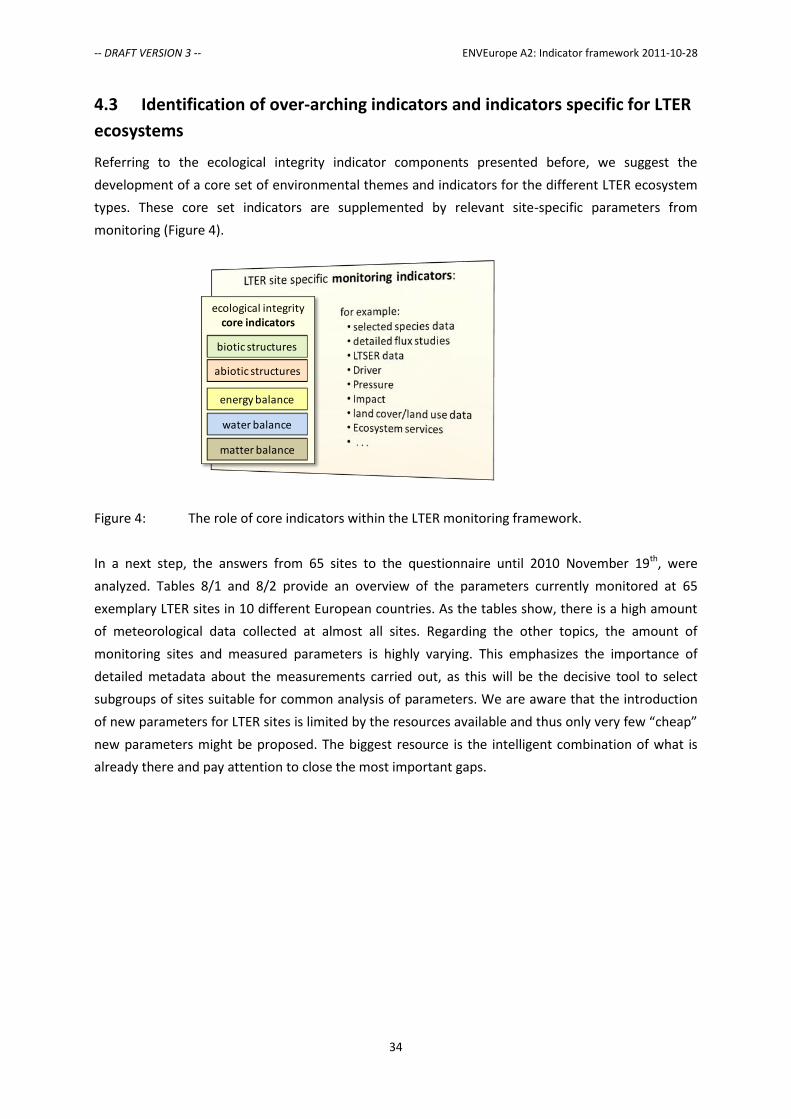
-- DRAFT VERSION 3 -- ENVEurope A2: Indicator framework 2011-10-28
34
4.3 Identification of over-arching indicators and indicators specific for LTER
ecosystems
Referring to the ecological integrity indicator components presented before, we suggest the
development of a core set of environmental themes and indicators for the different LTER ecosystem
types. These core set indicators are supplemented by relevant site-specific parameters from
monitoring (Figure 4).
Figure 4: The role of core indicators within the LTER monitoring framework.
In a next step, the answers from 65 sites to the questionnaire until 2010 November 19th, were
analyzed. Tables 8/1 and 8/2 provide an overview of the parameters currently monitored at 65
exemplary LTER sites in 10 different European countries. As the tables show, there is a high amount
of meteorological data collected at almost all sites. Regarding the other topics, the amount of
monitoring sites and measured parameters is highly varying. This emphasizes the importance of
detailed metadata about the measurements carried out, as this will be the decisive tool to select
subgroups of sites suitable for common analysis of parameters. We are aware that the introduction
of new parameters for LTER sites is limited by the resources available and thus only very few “cheap”
new parameters might be proposed. The biggest resource is the intelligent combination of what is
already there and pay attention to close the most important gaps.
ecological integritycore indicators
biotic structures
energy balance
water balance
matter balance
abiotic structures
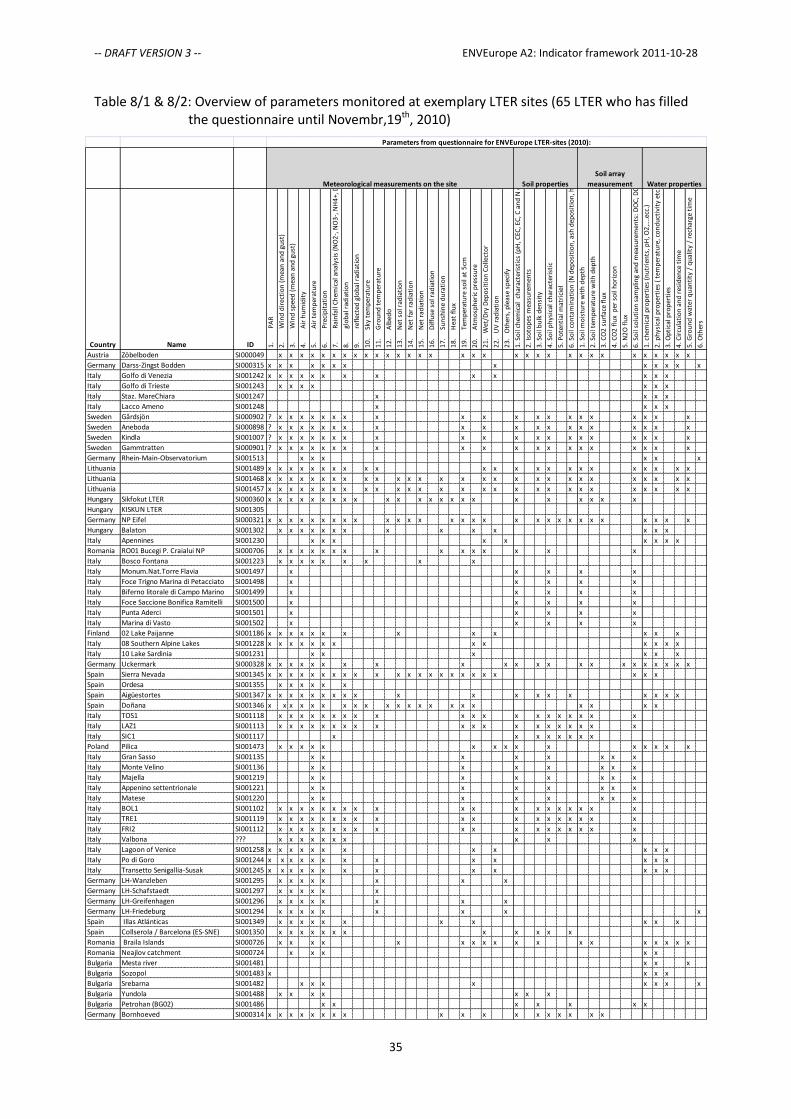
-- DRAFT VERSION 3 -- ENVEurope A2: Indicator framework 2011-10-28
35
Table 8/1 & 8/2: Overview of parameters monitored at exemplary LTER sites (65 LTER who has filled the questionnaire until Novembr,19th, 2010)
Country Name ID 1.
PA
R
2.
Win
d d
irec
tio
n (
mea
n a
nd
gu
st)
3.
Win
d s
pee
d (
mea
n a
nd
gu
st)
4.
Air
hu
mid
ity
5.
Air
tem
per
atu
re
6.
Pre
cip
itat
ion
7.
Rai
nfa
ll C
hem
ical
an
alys
is (
NO
2-,
NO
3-,
NH
4+,
DO
C…
)
8.
glo
bal
rad
iati
on
9.
refl
ecte
d g
lob
al r
adia
tio
n
10
.
Sky
tem
per
atu
re
11
.
Gro
un
d t
emp
erat
ure
12
.
Alb
edo
13
.
Net
so
l rad
iati
on
14
.
Net
far
rad
iati
on
15
.
Net
rad
iati
on
16
.
Dif
fuse
so
l rad
iati
on
17
.
Sun
shin
e d
ura
tio
n
18
.
Hea
t fl
ux
19
.
Tem
per
atu
re s
oil
at 5
cm
20
.
Atm
osp
her
ic p
ress
ure
21
. W
et/D
ry D
epo
siti
on
Co
llect
or
22
. U
V r
adia
tio
n
23
. O
ther
s, p
leas
e sp
ecif
y
1. S
oil
chem
ical
ch
arac
teri
stic
s (p
H, C
EC, E
C, C
an
d N
co
nte
nt,
…)
2. I
soto
pes
mea
sure
men
ts
3. S
oil
bu
lk d
ensi
ty
4. S
oil
ph
ysic
al c
har
acte
rist
ic
5. P
ote
nti
al m
atri
ciel
6. S
oil
con
tam
inat
ion
(N
dep
osi
tio
n, a
sh d
epo
siti
on
, hea
vy m
etal
, …, s
pec
ify)
1. S
oil
mo
istu
re w
ith
dep
th
2. S
oil
tem
per
atu
re w
ith
dep
th
3. C
O2
su
rfac
e fl
ux
4. C
O2
flu
x p
er s
oil
ho
rizo
n
5. N
2O
flu
x
6. S
oil
solu
tio
n s
amp
ling
and
mea
sure
men
ts:
DO
C, D
ON
, P, K
, Ca,
Mg,
Na,
Cl…
1. c
hem
ical
pro
per
ties
(n
utr
ien
ts, p
H, O
2,…
.ecc
.)
2. p
hys
ical
pro
per
ties
( t
emp
erat
ure
, co
nd
uct
ivit
y et
c.)
3. O
pti
cal p
rop
erti
es
4. C
ircu
lati
on
an
d r
esid
ence
tim
e
5. G
rou
nd
wat
er q
uan
tity
/ q
ual
ity
/ re
char
ge t
ime
6. O
ther
s
Austria Zöbelboden SI000049 x x x x x x x x x x x x x x x x x x x x x x x x x x x x x x x x
Germany Darss-Zingst Bodden SI000315 x x x x x x x x x x x x x
Italy Golfo di Venezia SI001242 x x x x x x x x x x x x x
Italy Golfo di Trieste SI001243 x x x x x x x
Italy Staz. MareChiara SI001247 x x x x
Italy Lacco Ameno SI001248 x x x x
Sweden Gårdsjön SI000902 ? x x x x x x x x x x x x x x x x x x x x
Sweden Aneboda SI000898 ? x x x x x x x x x x x x x x x x x x x x
Sweden Kindla SI001007 ? x x x x x x x x x x x x x x x x x x x x
Sweden Gammtratten SI000901 ? x x x x x x x x x x x x x x x x x x x x
Germany Rhein-Main-Observatorium SI001513 x x x x x x
Lithuania SI001489 x x x x x x x x x x x x x x x x x x x x x x x
Lithuania SI001468 x x x x x x x x x x x x x x x x x x x x x x x x x x x x
Lithuania SI001457 x x x x x x x x x x x x x x x x x x x x x x x x x x x x
Hungary Sikfokut LTER SI000360 x x x x x x x x x x x x x x x x x x x x x x x
Hungary KISKUN LTER SI001305
Germany NP Eifel SI000321 x x x x x x x x x x x x x x x x x x x x x x x x x x x x x
Hungary Balaton SI001302 x x x x x x x x x x x x x x
Italy Apennines SI001230 x x x x x x x x x
Romania RO01 Bucegi P. Craialui NP SI000706 x x x x x x x x x x x x x x x
Italy Bosco Fontana SI001223 x x x x x x x x x
Italy Monum.Nat.Torre Flavia SI001497 x x x x x
Italy Foce Trigno Marina di Petacciato SI001498 x x x x x
Italy Biferno litorale di Campo Marino SI001499 x x x x x
Italy Foce Saccione Bonifica Ramitelli SI001500 x x x x x
Italy Punta Aderci SI001501 x x x x x
Italy Marina di Vasto SI001502 x x x x x
Finland 02 Lake Paijanne SI001186 x x x x x x x x x x x x x
Italy 08 Southern Alpine Lakes SI001228 x x x x x x x x x x x x x
Italy 10 Lake Sardinia SI001231 x x x x x x
Germany Uckermark SI000328 x x x x x x x x x x x x x x x x x x x x x x
Spain Sierra Nevada SI001345 x x x x x x x x x x x x x x x x x x x x x x x
Spain Ordesa SI001355 x x x x x x
Spain Aigüestortes SI001347 x x x x x x x x x x x x x x x x x x x
Spain Doñana SI001346 x x x x x x x x x x x x x x x x x x x x x
Italy TOS1 SI001118 x x x x x x x x x x x x x x x x x x x x
Italy LAZ1 SI001113 x x x x x x x x x x x x x x x x x x x x
Italy SIC1 SI001117 x x x x x x x x
Poland Pilica SI001473 x x x x x x x x x x x x x x x
Italy Gran Sasso SI001135 x x x x x x x x
Italy Monte Velino SI001136 x x x x x x x x
Italy Majella SI001219 x x x x x x x x
Italy Appenino settentrionale SI001221 x x x x x x x x
Italy Matese SI001220 x x x x x x x x
Italy BOL1 SI001102 x x x x x x x x x x x x x x x x x x x
Italy TRE1 SI001119 x x x x x x x x x x x x x x x x x x x
Italy FRI2 SI001112 x x x x x x x x x x x x x x x x x x x
Italy Valbona ??? x x x x x x x x x x
Italy Lagoon of Venice SI001258 x x x x x x x x x x x x
Italy Po di Goro SI001244 x x x x x x x x x x x x x
Italy Transetto Senigallia-Susak SI001245 x x x x x x x x x x x x x
Germany LH-Wanzleben SI001295 x x x x x x x x
Germany LH-Schafstaedt SI001297 x x x x x x
Germany LH-Greifenhagen SI001296 x x x x x x x x
Germany LH-Friedeburg SI001294 x x x x x x x x x
Spain Illas Atlánticas SI001349 x x x x x x x x x x x
Spain Collserola / Barcelona (ES-SNE) SI001350 x x x x x x x x x x x x
Romania Braila Islands SI000726 x x x x x x x x x x x x x x x x x x
Romania Neajlov catchment SI000724 x x x x x
Bulgaria Mesta river SI001481 x x x
Bulgaria Sozopol SI001483 x x x x
Bulgaria Srebarna SI001482 x x x x x x x x
Bulgaria Yundola SI001488 x x x x x x x
Bulgaria Petrohan (BG02) SI001486 x x x x x x x
Germany Bornhoeved SI000314 x x x x x x x x x x x x x x x x x x
Meteorological measurements on the site Soil properties
Parameters from questionnaire for ENVEurope LTER-sites (2010):
Soil array
measurement Water properties

-- DRAFT VERSION 3 -- ENVEurope A2: Indicator framework 2011-10-28
36
Country Name ID 1. P
hys
ical
ch
arac
teri
stic
s (w
ater
co
nte
nt
po
rosi
ty, g
ran
ulo
met
ry…
.)
2. C
hem
ical
ch
arac
teri
stic
s (p
H, C
EC, E
C, C
, N
an
d P
co
nte
nt,
…)
3. I
soto
pes
mea
sure
men
ts
4. P
ote
nti
al m
atri
ciel
5. C
on
tam
inat
ion
(N
dep
osi
tio
n, a
sh d
epo
siti
on
, hea
vy m
etal
, …, s
pec
ify)
1.A
bu
nd
ance
2.B
iom
ass
3.P
hen
olo
gy
4. B
iod
iver
sity
5. P
rod
uct
ion
6. L
AI
7. C
an
d N
co
nte
nt
8. C
, N, M
g, K
, P, N
a, c
on
ten
t...
9. O
ther
1.A
bu
nd
ance
2.B
iom
ass
3.P
hen
olo
gy
4. B
iod
iver
sity
(in
cl. s
pec
ies
rich
nes
s, d
om
inan
ce s
tru
ctu
re, c
om
po
siti
on
)
5. C
an
d N
co
nte
nt
4. D
NA
sto
rage
6. O
ther
Pro
cari
ots
Mic
roal
gae
Mac
roal
gae
Vas
cula
r p
lan
ts /
Aq
uat
ic m
acro
ph
ytes
Lich
ens
Mo
sses
Fun
gi
An
nel
ida
Mo
llusc
s
Cru
stac
ean
s
Inse
cts
Spid
ers
Oth
er A
rth
rop
od
s
Am
ph
ibia
ns
Rep
tile
s
Mam
mal
s: s
mal
l mam
mal
s
mam
mal
s: u
ngu
late
s
Bir
ds
Fish
Oth
ers
Oth
er c
ateg
ori
es:
Zoo
pla
nct
on
, Mei
ofa
un
a, B
enth
ic m
acro
inve
rteb
rate
s
Austria Zöbelboden SI000049 x x x x x x x x x x x
Germany Darss-Zingst Bodden SI000315 x x x x x x x x x x x
Italy Golfo di Venezia SI001242 x x x x x x x x x x
Italy Golfo di Trieste SI001243 x x x x x x x x x
Italy Staz. MareChiara SI001247 x x x x x x x x x x x x x
Italy Lacco Ameno SI001248 x x x x x x x x x x x x x
Sweden Gårdsjön SI000902
Sweden Aneboda SI000898
Sweden Kindla SI001007
Sweden Gammtratten SI000901
Germany Rhein-Main-Observatorium SI001513 x x x x x x x x x x
Lithuania SI001489
Lithuania SI001468
Lithuania SI001457
Hungary Sikfokut LTER SI000360 x x x x x x x x x x x x x x
Hungary KISKUN LTER SI001305 x x x x
Germany NP Eifel SI000321 x x x x x
Hungary Balaton SI001302 x x x x x x x x x x x x x x x x x x x x x x x
Italy Apennines SI001230 x x x x x x x x x x x x x x
Romania RO01 Bucegi P. Craialui NP SI000706 x x x
Italy Bosco Fontana SI001223 x x x x x x x x x x x x x x x x x x
Italy Monum.Nat.Torre Flavia SI001497 x x x x x x x x
Italy Foce Trigno Marina di Petacciato SI001498 x x x x x x x x
Italy Biferno litorale di Campo Marino SI001499 x x x x x x x x
Italy Foce Saccione Bonifica Ramitelli SI001500 x x x x x x x x
Italy Punta Aderci SI001501 x x x x x x x x
Italy Marina di Vasto SI001502 x x x x x x x x
Finland 02 Lake Paijanne SI001186 x x x x x x x
Italy 08 Southern Alpine Lakes SI001228 x x x x x x x x x x x x x x x x
Italy 10 Lake Sardinia SI001231 x x x x x
Germany Uckermark SI000328 x x x x x x x x x x x x x
Spain Sierra Nevada SI001345 x x x x x x x x
Spain Ordesa SI001355 x x x x x x
Spain Aigüestortes SI001347 x x x x x x x x x x x x x x x x x x x x x
Spain Doñana SI001346 x x x x x x x x x x x x x x x
Italy TOS1 SI001118 x x x x x x x x x x
Italy LAZ1 SI001113 x x x x x x x x x x
Italy SIC1 SI001117 x x x x x x x x x x
Poland Pilica SI001473 x x x x x x x x x x x x x
Italy Gran Sasso SI001135 x x x x
Italy Monte Velino SI001136 x x x x
Italy Majella SI001219 x x x x
Italy Appenino settentrionale SI001221 x x x x
Italy Matese SI001220 x x x x
Italy BOL1 SI001102 x x x x x x
Italy TRE1 SI001119 x x x x x x
Italy FRI2 SI001112 x x x x x x
Italy Valbona ??? x x x x x x
Italy Lagoon of Venice SI001258 x x x x x x x x x x
Italy Po di Goro SI001244 x x x x x x x x x x
Italy Transetto Senigallia-Susak SI001245 x x x x x x x x x
Germany LH-Wanzleben SI001295 x x x x x x x x
Germany LH-Schafstaedt SI001297 x x x x x x x
Germany LH-Greifenhagen SI001296 x x x x x x x x
Germany LH-Friedeburg SI001294 x x x x x x x x x
Spain Illas Atlánticas SI001349 x x x x x x x x x x x
Spain Collserola / Barcelona (ES-SNE) SI001350 x x x x x x x x x
Romania Braila Islands SI000726 x x x x x x x x x x x x x
Romania Neajlov catchment SI000724
Bulgaria Mesta river SI001481 x x x x x x x x x x x x x x
Bulgaria Sozopol SI001483 x x x x x x x x x x x
Bulgaria Srebarna SI001482 x x x x x x x x x x x x x x x x x x
Bulgaria Yundola SI001488 x x x x
Bulgaria Petrohan (BG02) SI001486
Germany Bornhoeved SI000314 x x x x x x
Biodiversity
Parameters from questionnaire for ENVEurope LTER-sites (2010):
Sediments
properties
(aquatic
ecosystems)
Autotrophic compartment.
incl.organism group
Heterotrophic
compartment
(procaryotic and
eucaryotic)

-- DRAFT VERSION 3 -- ENVEurope A2: Indicator framework 2011-10-28
37
4.4 Example application
In Table 9 an example is given of how measured values from the exemplary LTER and IPC Forest
LEVEL II site "Bornhöveder Lake District" in northern Germany (SI000314) can be applied to
practically quantify the ecological integrity indicators. The site and the area were part of the
interdisciplinary research and development project "Long term research in the Bornhöved Lake
District", which started in 1988 and covered a primary observation period of 12 years (Fränzle et al.
2009). The main aims of the project were the analysis and modeling of ecosystem structures,
dynamics and stability conditions and the assessment of environmental strains and related resilience
mechanisms (Tavares et al. 2010). Today the site is part of the European forest monitoring program
LEVEL II and of LTER Europe. As Table 9 illustrates, the current monitoring focuses on matter budget
(especially deposition inputs) and forest conditions (for the LEVEL II network).
Table 9: Example from the LTER site Bornhöved lakes district on how to link monitoring data to the
ecological integrity indicator concept.
Indicator unit / classification resolution of records comment
flora diversity* ground vegetation survey e.g.shannon-wiener-index annual
fauna diversity* *
circumference and height of trees m 6 weeks
discoloration 0,1,2,3,4 annual see ICP manual (http://www.futmon.org/submission.htm); 2009 & 2010 version
foliage loss 0,5,10……95,100 annual see ICP manual (http://www.futmon.org/submission.htm); 2009 & 2010 version
visibility 1,2,3,4 annual see ICP manual (http://www.futmon.org/submission.htm); 2009 & 2010 version
crown shading 1,2,3,4,5,6 annual see ICP manual (http://www.futmon.org/submission.htm); 2009 & 2010 version
social status (Kraftsche Klasse) 1,2,3,4,5 annual see ICP manual (http://www.futmon.org/submission.htm); 2009 & 2010 version
fruiting
sparse, moderate,
abundant, mast annual
Water availability
(insufficient = 1, sufficient
= 2, excessive = 3) 5 years interval see ICP manual (http://www.futmon.org/submission.htm); 2009 & 2010 version
(Mull = 1, Moder = 2, etc.) 5 years interval see ICP manual (http://www.futmon.org/submission.htm); 2009 & 2010 version
Code of the WRB Reference Soil Group (2006) 5 years interval see ICP manual (http://www.futmon.org/submission.htm); 2009 & 2010 version
Code of the WRB Qualifier, e.g. Gleyic 5 years interval see ICP manual (http://www.futmon.org/submission.htm); 2009 & 2010 version
Code for Parent Material 5 years interval see ICP manual (http://www.futmon.org/submission.htm); 2009 & 2010 version
water heterogeneity* *
air heterogeneity wind speed in different heights (2m,6m,16m)
input exergy capture solar radiation W∙m-2
subhour mean values
storage exergy storage biomass (NPP) J∙m-3
annual
output entropy production terrestrial radiation W∙m-2
subhour
wind direction °; 0° = North, 270°= West
air temperature °C day mean, min and max value
relative humidity % day mean, min and max value
wind speed m∙s-1
day mean and max value
UV b radiation W/m² mean values
efficiency
measuresmetabolic efficiency*
*
Deposition of DOC mg∙l-1
~weekly
Deposition of c(Ca2+
), c(Mg2+
), c(K+), c(Na
+),
c(Ca2+), c(Mg2+), c(K+), c(Na+), c(Mn2+),
c(SO42-), c(PO43-), c(Cl-), c(N-NH4), c(N-NO3),
c(TDN) mg∙l-1
~weekly
storage matter storage* *
output matter loss Soil solution (5cm, 12cm, 50cm, 150cm, 400cm) same parameters as for deposition
pH; alkalinity mg∙l-1
soil solution (5cm, 12cm, 50cm, 150cm, 400cm):
DOC, Ca,Mg, K, Na, Mn, SO, PO, Cl, N (NH4), N
(NO3) mg∙l-1
same parameters as for deposition
efficiency
measuresnutrient cycling*
* modelling
input water input precipitation, stemflow, throughfall mm-d-1 day modelling
storage water storage water content (5cm, 12cm, 50cm, 150cm) m³∙m-³ minute/hour mean, min and max value
interception weekly
seepage (400cm) weekly
additional
state
variables
model results* *
modelling
efficiency
measuresbiotic water flow Transpiration/evapotranspiration
modelling
additional
state
variables
biotic diversity
additional variables
abiotic heterogeneity
water outputoutput
matter
budget
water
budget
additional
state
variables
element
concentrations
energy
budget
Example: Bornhöved forest ecosystem (Level II and LTER site)
matter inputinput
Indicandum
soil heterogeneity*
meteorology

-- DRAFT VERSION 3 -- ENVEurope A2: Indicator framework 2011-10-28
38
In Figure 5, a graphical presentation of selected ecological integrity parameters from the LTER site
Bornhöved (beech forest) for the four different seasons is shown (Tavares et al. 2010). The following
indicators from Table 8 are included:
matter input: Nitrogen deposition (kg/ha season): DEP_N_NO3, DEP_N_NH4, DEP_N_total,
Carbon deposition (kg/ha season): DEP_DOC
matter loss: soil solution in 150 cm depth in kg/ha season: N_NO3, DOC
element concentrations: pH in soil solution in 150 cm depth
energy budget: air Temperature (°C average)
biotic water flow: transpiration/evapotranspiration (T/Et_average)
exergy capture: global radiation (J cm-²)
water input: precipitation (mm/season)
Figure 5: Seasonal variations of selected ecological integrity parameters at the Bornhöved
beech forest. All values are normalized to 100 %, representing the long-term average
of the respective parameter in the reference period 1989-2005 (after Tavares et al.
2010).
0
40
80
120
160
200
DEP_N_NO3 (kg/ha season)
DEP_N_NH4 (kg/ha season)
DEP_N_inorg_total (kg/ha season)
DEP_DOC (kg/ha season)
BodenL_150cm_N_NO3 (Kg/ha season)
BodenL_150cm_DOC (Kg/ha season)
Air Temperature (ºC average)
T/Et_average
Global radiation
Precipitation (mm/season)
Spring
0,00
40,00
80,00
120,00
160,00
200,00
DEP_N_NO3 (kg/ha season)
DEP_N_NH4 (kg/ha season)
DEP_N_inorg_total (kg/ha season)
DEP_DOC (kg/ha season)
BodenL_150cm_N_NO3 (Kg/ha season)
BodenL_150cm_DOC (Kg/ha season)
Air Temperature (ºC average)
T/Et_average
Global radiation
Precipitation (mm/season)
Summer
0
40
80
120
160
200
DEP_N_NO3 (kg/ha season)
DEP_N_NH4 (kg/ha season)
DEP_N_inorg_total (kg/ha season)
DEP_DOC (kg/ha season)
BodenL_150cm_N_NO3 (Kg/ha season)
BodenL_150cm_DOC (Kg/ha season)
Air Temperature (ºC average)
T/Et_average
Global radiation
Precipitation (mm/season)
Autumn
0
40
80
120
160
200
DEP_N_NO3 (kg/ha season)
DEP_N_NH4 (kg/ha season)
DEP_N_inorg_total (kg/ha season)
DEP_DOC (kg/ha season)
BodenL_150cm_N_NO3 (Kg/ha season)
BodenL_150cm_DOC (Kg/ha season)
Air Temperature (ºC average)
T/Et_average
Global radiation
Precipitation (mm/season)
Winter
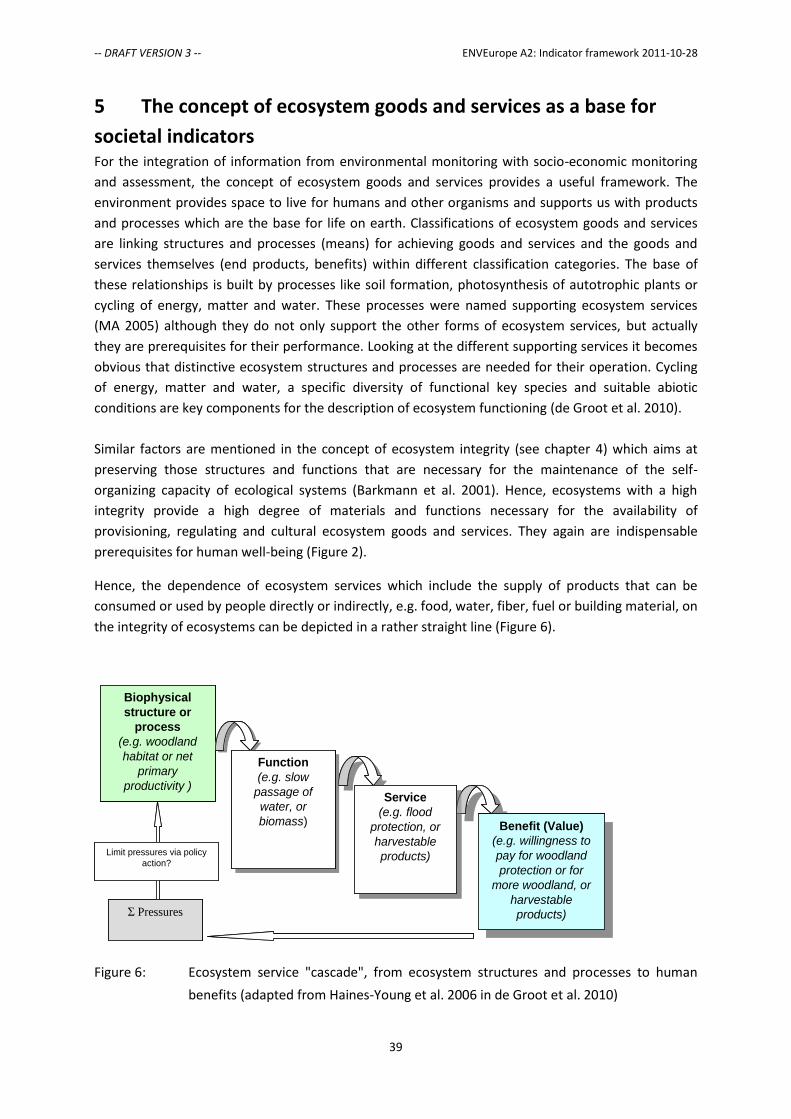
-- DRAFT VERSION 3 -- ENVEurope A2: Indicator framework 2011-10-28
39
5 The concept of ecosystem goods and services as a base for
societal indicators For the integration of information from environmental monitoring with socio-economic monitoring
and assessment, the concept of ecosystem goods and services provides a useful framework. The
environment provides space to live for humans and other organisms and supports us with products
and processes which are the base for life on earth. Classifications of ecosystem goods and services
are linking structures and processes (means) for achieving goods and services and the goods and
services themselves (end products, benefits) within different classification categories. The base of
these relationships is built by processes like soil formation, photosynthesis of autotrophic plants or
cycling of energy, matter and water. These processes were named supporting ecosystem services
(MA 2005) although they do not only support the other forms of ecosystem services, but actually
they are prerequisites for their performance. Looking at the different supporting services it becomes
obvious that distinctive ecosystem structures and processes are needed for their operation. Cycling
of energy, matter and water, a specific diversity of functional key species and suitable abiotic
conditions are key components for the description of ecosystem functioning (de Groot et al. 2010).
Similar factors are mentioned in the concept of ecosystem integrity (see chapter 4) which aims at
preserving those structures and functions that are necessary for the maintenance of the self-
organizing capacity of ecological systems (Barkmann et al. 2001). Hence, ecosystems with a high
integrity provide a high degree of materials and functions necessary for the availability of
provisioning, regulating and cultural ecosystem goods and services. They again are indispensable
prerequisites for human well-being (Figure 2).
Hence, the dependence of ecosystem services which include the supply of products that can be
consumed or used by people directly or indirectly, e.g. food, water, fiber, fuel or building material, on
the integrity of ecosystems can be depicted in a rather straight line (Figure 6).
Biophysical
structure or
process
(e.g. woodland
habitat or net
primary
productivity )
Service
(e.g. flood
protection, or
harvestable
products)
Service
(e.g. flood
protection, or
harvestable
products)
Function
(e.g. slow
passage of
water, or
biomass)
Function
(e.g. slow
passage of
water, or
biomass)Benefit (Value)
(e.g. willingness to
pay for woodland
protection or for
more woodland, or
harvestable
products)
Benefit (Value)
(e.g. willingness to
pay for woodland
protection or for
more woodland, or
harvestable
products)Σ Pressures
Limit pressures via policy
action?
Biophysical
structure or
process
(e.g. woodland
habitat or net
primary
productivity )
Service
(e.g. flood
protection, or
harvestable
products)
Service
(e.g. flood
protection, or
harvestable
products)
Function
(e.g. slow
passage of
water, or
biomass)
Function
(e.g. slow
passage of
water, or
biomass)Benefit (Value)
(e.g. willingness to
pay for woodland
protection or for
more woodland, or
harvestable
products)
Benefit (Value)
(e.g. willingness to
pay for woodland
protection or for
more woodland, or
harvestable
products)
Biophysical
structure or
process
(e.g. woodland
habitat or net
primary
productivity )
Service
(e.g. flood
protection, or
harvestable
products)
Service
(e.g. flood
protection, or
harvestable
products)
Function
(e.g. slow
passage of
water, or
biomass)
Function
(e.g. slow
passage of
water, or
biomass)Benefit (Value)
(e.g. willingness to
pay for woodland
protection or for
more woodland, or
harvestable
products)
Benefit (Value)
(e.g. willingness to
pay for woodland
protection or for
more woodland, or
harvestable
products)Σ Pressures
Limit pressures via policy
action?
Figure 6: Ecosystem service "cascade", from ecosystem structures and processes to human
benefits (adapted from Haines-Young et al. 2006 in de Groot et al. 2010)
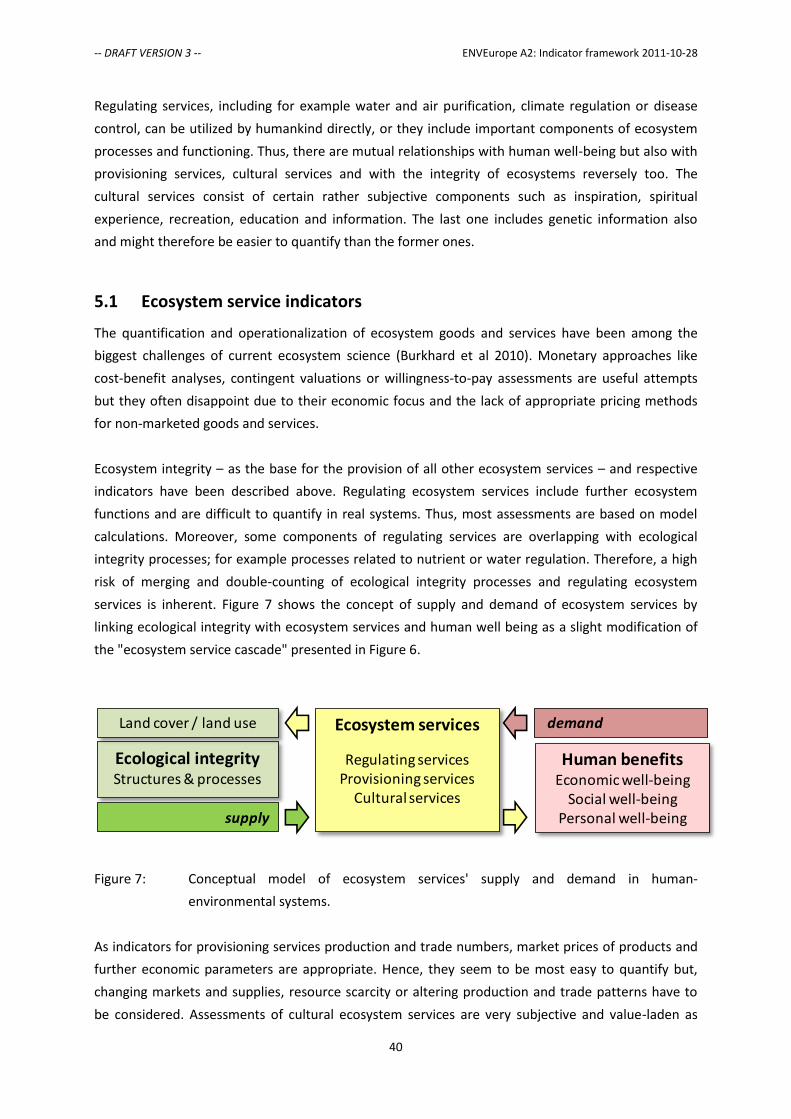
-- DRAFT VERSION 3 -- ENVEurope A2: Indicator framework 2011-10-28
40
Regulating services, including for example water and air purification, climate regulation or disease
control, can be utilized by humankind directly, or they include important components of ecosystem
processes and functioning. Thus, there are mutual relationships with human well-being but also with
provisioning services, cultural services and with the integrity of ecosystems reversely too. The
cultural services consist of certain rather subjective components such as inspiration, spiritual
experience, recreation, education and information. The last one includes genetic information also
and might therefore be easier to quantify than the former ones.
5.1 Ecosystem service indicators
The quantification and operationalization of ecosystem goods and services have been among the
biggest challenges of current ecosystem science (Burkhard et al 2010). Monetary approaches like
cost-benefit analyses, contingent valuations or willingness-to-pay assessments are useful attempts
but they often disappoint due to their economic focus and the lack of appropriate pricing methods
for non-marketed goods and services.
Ecosystem integrity – as the base for the provision of all other ecosystem services – and respective
indicators have been described above. Regulating ecosystem services include further ecosystem
functions and are difficult to quantify in real systems. Thus, most assessments are based on model
calculations. Moreover, some components of regulating services are overlapping with ecological
integrity processes; for example processes related to nutrient or water regulation. Therefore, a high
risk of merging and double-counting of ecological integrity processes and regulating ecosystem
services is inherent. Figure 7 shows the concept of supply and demand of ecosystem services by
linking ecological integrity with ecosystem services and human well being as a slight modification of
the "ecosystem service cascade" presented in Figure 6.
Figure 7: Conceptual model of ecosystem services' supply and demand in human-
environmental systems.
As indicators for provisioning services production and trade numbers, market prices of products and
further economic parameters are appropriate. Hence, they seem to be most easy to quantify but,
changing markets and supplies, resource scarcity or altering production and trade patterns have to
be considered. Assessments of cultural ecosystem services are very subjective and value-laden as
Ecological integrityStructures & processes
Ecosystem services
Regulating servicesProvisioning services
Cultural services
Human benefitsEconomic well-being
Social well-beingPersonal well-beingsupply
demandLand cover / land use
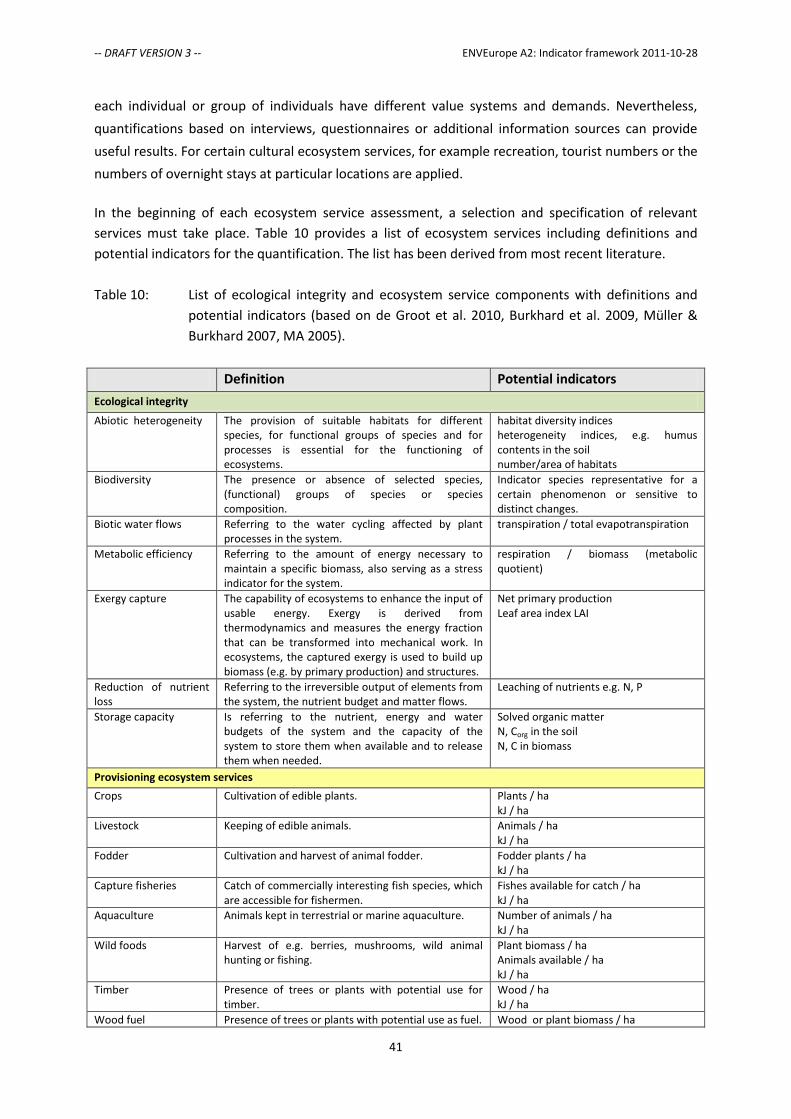
-- DRAFT VERSION 3 -- ENVEurope A2: Indicator framework 2011-10-28
41
each individual or group of individuals have different value systems and demands. Nevertheless,
quantifications based on interviews, questionnaires or additional information sources can provide
useful results. For certain cultural ecosystem services, for example recreation, tourist numbers or the
numbers of overnight stays at particular locations are applied.
In the beginning of each ecosystem service assessment, a selection and specification of relevant
services must take place. Table 10 provides a list of ecosystem services including definitions and
potential indicators for the quantification. The list has been derived from most recent literature.
Table 10: List of ecological integrity and ecosystem service components with definitions and
potential indicators (based on de Groot et al. 2010, Burkhard et al. 2009, Müller &
Burkhard 2007, MA 2005).
Definition Potential indicators
Ecological integrity
Abiotic heterogeneity The provision of suitable habitats for different species, for functional groups of species and for processes is essential for the functioning of ecosystems.
habitat diversity indices heterogeneity indices, e.g. humus contents in the soil number/area of habitats
Biodiversity The presence or absence of selected species, (functional) groups of species or species composition.
Indicator species representative for a certain phenomenon or sensitive to distinct changes.
Biotic water flows Referring to the water cycling affected by plant processes in the system.
transpiration / total evapotranspiration
Metabolic efficiency Referring to the amount of energy necessary to maintain a specific biomass, also serving as a stress indicator for the system.
respiration / biomass (metabolic quotient)
Exergy capture The capability of ecosystems to enhance the input of usable energy. Exergy is derived from thermodynamics and measures the energy fraction that can be transformed into mechanical work. In ecosystems, the captured exergy is used to build up biomass (e.g. by primary production) and structures.
Net primary production Leaf area index LAI
Reduction of nutrient loss
Referring to the irreversible output of elements from the system, the nutrient budget and matter flows.
Leaching of nutrients e.g. N, P
Storage capacity Is referring to the nutrient, energy and water budgets of the system and the capacity of the system to store them when available and to release them when needed.
Solved organic matter N, Corg in the soil N, C in biomass
Provisioning ecosystem services
Crops Cultivation of edible plants. Plants / ha kJ / ha
Livestock Keeping of edible animals. Animals / ha kJ / ha
Fodder Cultivation and harvest of animal fodder. Fodder plants / ha kJ / ha
Capture fisheries Catch of commercially interesting fish species, which are accessible for fishermen.
Fishes available for catch / ha kJ / ha
Aquaculture Animals kept in terrestrial or marine aquaculture. Number of animals / ha kJ / ha
Wild foods Harvest of e.g. berries, mushrooms, wild animal hunting or fishing.
Plant biomass / ha Animals available / ha kJ / ha
Timber Presence of trees or plants with potential use for timber.
Wood / ha kJ / ha
Wood fuel Presence of trees or plants with potential use as fuel. Wood or plant biomass / ha

-- DRAFT VERSION 3 -- ENVEurope A2: Indicator framework 2011-10-28
42
kJ / ha
Energy (biomass) Presence of trees or plants with potential use as energy source.
Wood or plant biomass / ha kJ / ha
Biochemicals / medicine
Production of biochemicals, medicines. Amount or number of products kg / ha
Freshwater Presence of freshwater. l or m³ / ha
Regulating ecosystem services
Local climate regulation
Changes in land cover can locally affect temperature, wind, radiation and precipitation.
Temperature, albedo, precipitation, wind Temperature amplitudes Evapotranspiration
Global climate regulation
Ecosystems play an important role in climate by either sequestering or emitting greenhouse gases.
Source-sink of water vapour, methane, CO2
Flood protection Natural elements dampening extreme flood events Number of floods causing damages
Groundwater recharge The timing and magnitude of runoff, flooding, and aquifer recharge can be strongly influenced by changes in land cover, including, in particular, alterations that change the water storage potential of the system, such as the conversion of wetlands or the replacement of forests with croplands or croplands with urban areas.
Groundwater recharge rates
Air quality regulation The capacity of ecosystems to remove toxic and other elements from the atmosphere.
Leaf area index Air quality amplitudes
Erosion regulation Vegetative cover plays an important role in soil retention and the prevention of landslides.
loss of soil particles by wind or water vegetation cover
Nutrient regulation The capacity of ecosystems to carry out (re)cycling of e.g. N, P or others.
N, P or other nutrient turnover rates
Water purification Ecosystems have the capacity to purify water but can also be a source of impurities in fresh water.
Water quality and quantity
Pollination Ecosystem changes affect the distribution, abundance, and effectiveness of pollinators. Wind and bees are in charge of the reproduction of a lot of culture plants.
amount of plant products distribution of plants availability of pollinators
Cultural ecosystem services (selection)
Recreation & aesthetic values
Refers specifically to landscape and visual qualities of the resp. case study area (scenery, scenic beauty). The benefit is the sense of beauty people get from looking at the landscape and related recreational benefits.
Number of visitors or facilities Questionnaires on personal preferences
Intrinsic value of biodiversity
The value of nature and species themselves, beyond economic or human benefits.
number of endangered, protected or rare species or habitats
+ further case study specific indictors
-- DRAFT VERSION 3 -- ENVEurope A2: Indicator framework 2011-10-28
43
5.2 Assessments of ecosystem services supply
Different ecosystems have different functions based on their structures and processes. Therefore,
the capacity to supply particular services varies between different ecosystems. The individual
capacities are strongly linked to:
a) natural conditions, e. g. land cover (vegetation foremost), hydrology, soil conditions,
fauna, elevation, slope and climate as well as
b) human impacts (mainly land use but also emissions, pollution etc.).
One main problem in almost all ecosystem service studies is the generation of appropriate data to
quantify the broad range of ecosystem services (Wallace 2007). One solution can be to make use of
expert evaluations in order to gain an overview and see trends for ecosystem service assessments
(Burkhard et al. 2009). Based on these expert evaluations, hypotheses about capacities of different
ecosystem to supply ecosystem services can be derived. In the following steps, expert evaluations
can successively be replaced by data from monitoring, measurements, modeling, targeted interviews
or statistics.
The integration of data from LTER monitoring in the different European biomes would provide a very
useful data base for more quantitative ecosystem service assessments. As the ecosystem service
concept is very holistic and comprehensive, as much relevant information as possible has to be taken
into account. Information should be as detailed as possible and needed, in a relevant resolution and
at an appropriate scale. Land cover information from e. g. remote sensing, simulation models, GIS
and statistical data is an appropriate starting point. By integrating these features with further data,
the state of ecosystems and their capacities to supply ecosystem services can be assessed and
transferred to maps of different spatial and temporal scales. The results reveal patterns of natural
conditions and human activities over time and the capacities of different ecosystems to provide
ecosystem services considering changes in land use.
One approach to give an overview on ecosystem service capacities is based on an expert assessment
matrix linking ecological integrity and ecosystem services (on the x-axis) to different land cover types
(on the y-axis) (Burkhard et al. 2009). At intersections of land cover types and ecological
integrity/ecosystem services, different capacities of land cover types to support ecological integrity
and to provide particular services were assessed. The initial assessments can take place qualitatively
on a scale consisting of for example: 0 = no relevant capacity, 1 = low relevant capacity, 2 = relevant
capacity, 3 = medium relevant capacity, 4 = high relevant capacity and 5 = very high relevant capacity
(see Figure 8).

-- DRAFT VERSION 3 -- ENVEurope A2: Indicator framework 2011-10-28
44
Figure 8: Matrix for the assessment of the different CORINE land cover types' capacities to
support ecological integrity and to provide ecosystem services (from Burkhard et al.
2009). The assessment scale reaches from 0 = rosy color = no relevant capacity of the
land cover type to provide this particular ecosystem service, 1 = grey green = low
relevant capacity, 2 = light green = relevant capacity, 3 = yellow green = medium
relevant capacity, 4 = blue green = high relevant capacity and 5 = dark green = very
high relevant capacity. In the rows between the assessments (yellow color), sums for
the individual ecosystem services groups were calculated (without weighting them).
Eco
log
ical
Inte
gri
ty
∑
Abi
otic
het
erog
enei
ty
Bio
dive
rsity
Bio
tic w
ater
flow
s
Met
abol
ic e
ffici
ency
Exe
rgy
Cap
ture
(R
adia
tion)
Red
uctio
n of
Nut
rient
loss
Sto
rage
cap
acity
(S
OM
)
Reg
ula
tin
g s
ervi
ces
∑
Loca
l clim
ate
regu
latio
n
Glo
bal c
limat
e re
gula
tion
Flo
od p
rote
ctio
n
Gro
undw
ater
rec
harg
e
Air
Qua
lity
Reg
ulat
ion
Ero
sion
Reg
ulat
ion
Nut
rient
reg
ulat
ion
Wat
er p
urifi
catio
n
Pol
linat
ion
Pro
visi
on
ing
ser
vice
s ∑
Cro
ps
Live
stoc
k
Fod
der
Cap
ture
Fis
herie
s
Acq
uacu
lture
Wild
Foo
ds
Tim
ber
Woo
d F
uel
Ene
rgy
Bio
chem
ical
s / M
edic
ine
Fre
shw
ater
Cu
ltu
ral s
ervi
ces
∑
Rec
reat
ion&
Aes
thet
ic V
alue
s
Intr
insi
c V
alue
of B
iodi
vers
ity
Continuous urban fabric 0 0 0 0 0 0 0 0 0 0 0 0 0 0 0 0 0 0 0 0 0 0 0 0 0 0 0 1 0 0 0 0 0
Discontinuous urban fabric 7 1 1 1 1 1 1 1 0 0 0 0 0 0 0 0 0 0 3 1 0 1 0 0 1 0 0 1 0 0 0 0 0
Industrial or commercial units 2 1 1 0 0 0 0 0 0 0 0 0 0 0 0 0 0 0 0 0 0 0 0 0 0 0 0 1 0 0 0 0 0
Road and rail networks 4 2 2 0 0 0 0 0 0 0 0 0 0 0 0 0 0 0 0 0 0 0 0 0 0 0 0 0 0 0 0 0 0
Port areas 2 1 1 0 0 0 0 0 3 0 0 3 0 0 0 0 0 0 0 0 0 0 0 0 0 0 0 0 0 0 1 1 0
Airports 7 1 1 1 1 1 2 0 0 0 0 0 0 0 0 0 0 0 1 0 0 1 0 0 0 0 0 0 0 0 0 0 0
Mineral extraction sites 4 2 2 0 0 0 0 0 0 0 0 0 0 0 0 0 0 0 0 0 0 0 0 0 0 0 0 5 0 0 0 0 0
Dump sites 8 2 1 0 0 0 0 5 0 0 0 0 0 0 0 0 0 0 0 0 0 0 0 0 0 0 0 1 0 0 0 0 0
Construction sites 3 2 1 0 0 0 0 0 0 0 0 0 0 0 0 0 0 0 0 0 0 0 0 0 0 0 0 0 0 0 0 0 0
Green urban areas 18 3 3 2 1 4 3 2 11 2 1 0 2 1 2 1 1 1 2 0 0 0 0 0 1 0 1 0 0 0 3 3 0
Sport and leasure facilities 16 2 2 2 1 4 3 2 9 1 1 0 2 1 1 1 1 1 0 0 0 0 0 0 0 0 0 0 0 0 5 5 0
Non-irrigated arable land 22 3 2 3 4 5 1 4 5 2 1 1 1 0 0 0 0 0 21 5 5 5 0 0 0 0 0 2 1 0 1 1 0
Permanently irrigated land 21 3 2 5 2 5 1 3 5 3 1 1 0 0 0 0 0 0 18 5 5 2 0 0 0 0 0 1 1 0 1 1 0
Ricefields 20 3 2 5 1 5 1 3 4 2 0 0 2 0 0 0 0 0 7 5 0 2 0 0 0 0 0 0 0 0 1 1 0
Vineyards 14 3 2 3 1 3 0 2 3 1 1 0 1 0 0 0 0 0 5 4 0 0 0 0 0 0 1 1 0 0 5 5 0
Fruit trees and berries 21 4 3 4 2 3 2 3 19 2 2 2 2 2 2 1 1 5 13 5 0 0 0 0 0 4 4 1 0 0 5 5 0
Olive groves 17 3 2 3 2 3 1 3 7 1 1 0 1 1 1 1 1 0 12 4 0 0 0 0 0 4 4 1 0 0 5 5 0
Pastures 24 2 2 4 5 5 2 4 8 1 1 1 1 0 4 0 0 0 10 0 5 5 0 0 0 0 0 1 0 0 3 3 0
Annual and permanent crops 18 2 2 3 2 4 2 3 7 2 1 1 1 1 1 0 0 0 20 5 5 5 0 0 0 0 0 1 1 0 1 1 0
Complex cultivation patterns 20 4 3 3 2 4 1 3 5 2 1 1 1 0 0 0 0 0 9 4 0 3 0 0 0 0 0 1 2 0 2 2 0
Agriculture& natural vegetation 19 3 3 3 2 3 2 3 13 3 2 1 2 1 3 0 1 0 21 3 3 2 0 0 3 3 3 2 1 0 5 2 3
Agro-forestry areas 27 4 4 4 3 4 4 4 13 2 1 1 1 1 2 1 1 3 14 3 3 2 0 0 0 3 3 2 0 0 3 3 0
Broad-leaved forest 31 3 4 5 4 5 5 5 39 5 4 3 2 5 5 5 5 5 21 0 0 1 0 0 5 5 5 1 5 0 10 5 5
Coniferous forest 30 3 4 4 4 5 5 5 39 5 4 3 2 5 5 5 5 5 21 0 0 1 0 0 5 5 5 1 5 0 10 5 5
Mixed forest 32 3 5 5 4 5 5 5 39 5 4 3 2 5 5 5 5 5 21 0 0 1 0 0 5 5 5 1 5 0 10 5 5
Natural grassland 30 3 5 4 4 4 5 5 22 2 3 1 1 0 5 5 5 0 5 0 3 0 0 0 2 0 0 0 0 0 6 3 3
Moors and heathland 30 3 4 4 5 4 5 5 20 4 3 2 2 0 0 3 4 2 10 0 2 0 0 0 1 0 2 2 0 0 10 5 5
Sclerophyllous vegetation 21 3 4 2 3 3 4 2 7 2 1 1 1 0 0 0 0 2 8 0 2 0 0 0 1 0 2 0 3 0 6 2 4
Transitional woodland shrub 21 3 4 2 3 3 4 2 3 1 0 0 0 0 0 0 0 2 5 0 2 0 0 0 1 0 2 1 0 0 4 2 2
Beaches, dunes and sand plains 10 3 3 1 1 1 0 1 6 0 0 5 1 0 0 0 0 0 2 0 0 0 0 0 0 0 0 1 0 0 7 5 2
Bare rock 6 3 3 0 0 0 0 0 3 0 0 1 1 0 0 0 1 0 0 0 0 0 0 0 0 0 0 0 0 0 4 4 0
Sparsely vegetated areas 9 2 3 1 0 1 1 1 3 1 0 1 1 0 0 0 0 0 0 0 0 0 0 0 0 0 0 0 0 0 0 0 0
Burnt areas 6 2 1 0 0 0 0 3 1 1 0 0 0 0 0 0 0 0 0 0 0 0 0 0 0 0 0 0 0 0 0 0 0
Glaciers and perpetual snow 3 2 1 0 0 0 0 0 10 3 3 0 4 0 0 0 0 0 5 0 0 0 0 0 0 0 0 0 0 5 5 5 0
Inland marshes 25 3 2 4 4 4 3 5 14 2 2 4 2 0 0 4 0 0 7 0 2 5 0 0 0 0 0 0 0 0 0 0 0
Peatbogs 29 3 4 4 4 4 5 5 24 4 5 3 3 0 0 3 4 2 5 0 0 0 0 0 0 0 0 2 0 0 8 4 4
Salt marshes 23 2 3 4 3 3 3 5 8 1 0 5 0 0 0 2 0 0 2 0 2 0 0 0 0 0 0 0 0 0 3 3 0
Salines 2 1 1 0 0 0 0 0 2 2 0 0 0 0 0 0 0 0 0 0 0 0 0 0 0 0 0 0 0 0 2 2 0
Intertidal flats 13 2 3 0 2 1 4 1 7 1 0 5 0 0 0 1 0 0 0 0 0 0 0 0 0 0 0 1 0 0 4 4 0
Water courses 18 4 4 0 3 3 3 1 10 1 0 2 1 0 0 3 3 0 12 0 0 0 3 0 4 0 0 3 0 5 10 5 5
Water bodies 23 4 4 0 4 4 3 4 7 2 1 1 2 0 0 1 0 0 12 0 0 0 3 0 4 0 0 0 0 5 9 5 4
Coastal lagoons 25 4 4 0 5 5 3 4 5 1 0 4 0 0 0 0 0 0 16 0 0 0 4 5 4 0 0 1 0 0 9 5 4
Estuaries 21 3 3 0 5 5 3 2 9 0 0 3 0 0 0 3 3 0 17 0 0 0 5 5 4 0 0 2 0 0 7 4 3
Sea and ocean 15 2 2 0 3 3 4 1 13 3 5 0 0 0 0 5 0 0 11 0 0 1 5 5 0 0 0 3 0 0 6 4 2
-- DRAFT VERSION 3 -- ENVEurope A2: Indicator framework 2011-10-28
45
6. Gap analysis
The evaluations of the available indicator-parameter base from the quick workshop survey (Table 6)
and the metadata questionnaire in Tables 7/1-3 give an overview about what is already there
(without the frequency of measurements) and where are major gaps in data. The following step will
be the closer look at the parameters behind (later with a focus on the methods), the potential for
harmonization of parameters and at the gaps that need to be filled by additional parameters.
In this respect we will consider the initiatives mentioned in chapter 2.2 and look for data which can
be gained without much effort or data which are already available, e.g. by Remote Sensing (RS). RS
offers various options for the LTER-sites which have to be assessed more in detail in practice.
However, the GMES Directive needs to be considered by ENVEurope anyway as it is one focal point
for remote sensing tools in ENVEurope. One main problem in the practical application at the LTER
sites is perhaps that experts are needed which can process and interpret RS data and images
appropriately. Nevertheless, some spatially explicit derived products (e.g. CORINE), which are
partially validated, are ready to be used. Thus, the ability to handle RS products has to be checked at
the LTER sites. Additional ground truth validation might be needed to be carried out at each site. The
subsequent analyses should be done centralized or by a respective core group.
A proposal of structural (aggregative) indicators that might reveal details on ecological food and
interaction webs and report on the role of engineering species inside the ecosystem may be
important, but is missing. Same for functional groups and energy compartments which were
originally proposed as indicanda in ENVEurope.
However, there is a high degree of uncertainty when working with heterogeneous data sets and
different degrees of documentation of these data and methods. Nevertheless, there are methods to
deal with this kind of uncertainties and to use long-term environmental data successfully (Magurran
et al. 2010). We are aware of the issue that procedures need to be available to ensure the
comparability of data when methods of measuring the same parameters change (e.g. by
harmonization of parameters and methods).
Two major issues remaining with regard to data harmonization and comparability are (i) the question
of defining appropriate scales (in space and time) and (ii) suitable baselines or reference conditions
to which the individual sites' ecological integrity parameters can be compared to. So far, no solution
that suits all sites could be found. The future work to be carried out in ENVEurope, especially the
practical implementation of the conceptual framework, will show whether a harmonization in the
two points mentioned above is possible and to which degree it is definitely needed. LTER sites are
often rather small portions of the landscape and their size range should be considered as a factor to
take into account for indicator and indicandum selection. Moreover, spatial scale identification will
provide a minimum sampling size for measurements and might eventually help to extrapolate

-- DRAFT VERSION 3 -- ENVEurope A2: Indicator framework 2011-10-28
46
captured information to equivalent spatial units across the landscape and upscale processes and
functions.
Another important point not addressed sufficiently up to now is the data storage and management
in LTER. A central data management using standardized methods, software tools and user interfaces
is mandatory in order to improve the coordination and management of the data and for a better
communication regarding data requests. One idea could be to offer aggregated raw data for
ecological integrity core indicators (Figure 4) with a coarse temporal resolution (e.g. average annual
values) as a kind of "quick view" for public use. More detailed information would then be available
on request in co-operation with the particular site manager.
7. Implementation
The implementation of this conceptual framework will be done in Action 5 of ENVEurope (Field
Testing). It is proposed to do this with the following steps taking most advantage of the constellation
of LTER sites:
1. Clustering of sites that can provide certain EI indicators due to their specific focus. This will
be done based on Table 7/1-3, but with more detailed information
2. Priorty list of indicators: (a) High priority / core indicators, (b) medium priority indicators and
(c) optional indicators (to exclude nothing). The selection of indicators should be driven by
their sensitivity concerning the indicandum.
3. Parameter-based identification of suitable spatial scales. Perhaps measurements are scale-
related in this way: EI processes < EI structures < ESS
4. Parameter-based identification of suitable temporal scales and frequencies. Again, the
ranking will reveal the same sequence in terms of frequency measurements: EI processes > EI
structures > ESS
5. Potential for harmonization of methods (ensuring comparability of data a priori)
6. Potential for temporal and spatial aggregation of parameters for common analysis
(comparability of data ex post)
7. Remote sensing products to generate unified data sets at different points in time for all LTER
sites (e.g. CORINE)
The application of the theoretical concepts in practice is one major challenge and chance of
ENVEurope. Therefore, harmonization of methods and the development of common manuals are
mandatory. To test the indicator sets and systems ecological theories with data from long-term
monitoring at different sites will reveal how a harmonization of international monitoring activities
should take place in order to get optimum results regarding staff and financial effort invested.
Moreover, to take the step from long term ecological monitoring ("LTEM") to a real long term
ecological research (LTER), the link to scientifically relevant questions should be improved. There are
numerous relevant questions and hypotheses which could be addressed by using long-term
ecological data:
-- DRAFT VERSION 3 -- ENVEurope A2: Indicator framework 2011-10-28
47
Potential research questions:
Which are the impacts of global changes (climate change, invasive species, land use change,
pollutants) on ecological integrity and the provision of ecosystem services?
Can we find resilience and adaptability in ecosystems' dynamics related to these global
changes?
Which spatial scales are needed to appropriately address structures and processes at
heterogeneous sites?
Which information can be obtained from remote sensing at which spatio-temporal
resolution?
How can we achieve trans-domain indication and comparability?
Which measurement frequencies are needed in order to cope with long-, medium- and short-
term dynamics in the different ecosystems?
. . .
-- DRAFT VERSION 3 -- ENVEurope A2: Indicator framework 2011-10-28
48
8. References Aoki, I. (1987): Entropy balance of white-tailed deer during a winter night. Bulletin of
Mathematical Biology 49: 321-327. Barkmann, J., R. Baumann, U. Meyer, F. Müller & W. Windhorst (2001) Ökologische Integrität:
Risikovorsorge im Nachhaltigen Landschaftsmanagement. Gaia 10/2 97-108 Baumann, R. (2001): Indikation der Selbstorganisationsfähigkeit terrestrischer Ökosysteme. Online
publication at the University of Kiel. http://e-diss.uni-kiel.de/diss_467/d467.pdf Bossel, H. (2000): Sustainability: Application of Systems Theoretical Aspects to Societal Development.
In: Jørgensen, S.E. & F. Müller (eds.): Handbook of eco-system theories and management, Boca Raton – London – New York – Washington DC: 519-536
Bossel, H. (1998): Ecological orientors: Emergence of basic orientors in evolutionary self-organization. In: Müller, F. & M. Leupelt (eds.): Eco targets, goal functions and orientors. Berlin, Heidelberg, New York: 19-33
Brink, B. ten (2000). Biodiversity indicators for the OECD Environmental Outlook and Strategy – A feasibility study. RIVM Report 402001014. Bilthoven.
Brito, D., Ambal, R.G., Brooks, T., De Silva, N., Foster, M., Hao, W., Hilton-Taylor, C., Paglia, A., Rodríguez, J.P., Rodríguez, J.V. (2010). How similar are national red lists and the IUCN Red List? Biological Conservation 143, 1154–1158.
Burkhard, B., F. Müller & A. Lill (2008): Ecosystem health indicators: overview. In: Jørgensen, S.E. & B.D. Fath (Eds.): Ecological Indicators. Vol. [2] of Encyclopedia of Ecology, 5 vols. Oxford: Elsevier: 1132-1138.
Burkhard, B. & F. Müller (2008): Drivers-Pressure-State-Impact-Response. In: Jørgensen, S.E. & B.D. Fath (Eds.): Ecological Indicators. Vol. [2] of Encyclopedia of Ecology, 5 vols. Oxford: Elsevier: 967-970.
Burkhard, B., F. Kroll, F. Müller & W.Windhorst (2009): Landscapes‘ Capacities to Provide Ecosystem Services – a Concept for Land-Cover Based Assessments. – Landscape Online 15: 1-22.
Burkhard, B., I. Petrosillo & R. Costanza (eds.) (2010): Ecosystem Services – Bridging Ecology, Economy and Social Sciences. Ecological Complexity 7/3. Special Issue: 257-420.
Cocciufa, C., Petriccione, B., Framstad, E. & Bredemeier, M. (2007): Biodiversity Assessment in LTER sites. An EC Report (Deliverable 3.R2.D1) from ALTER Net (A Long Term Biodiversity, Ecosystem and Awareness Research Network)
de Groot, R.S., Alkemade, R., Braat, L., Hein, L., Willemen, L. (2010): Challenges in integrating the concept of ecosystem services and values in landscape planning, management and decision making. Ecological Complexity 7:260–272.
Dierssen, K. (2000): Ecosystems as states of ecological successions. In: Jørgensen, S.E. & F. Müller (eds.): Handbook of ecosystem theories and management. Boca Raton: 427-438.
EC (2005). Sustainable Development Indicators to monitor the implementation of the EU Sustainable Development Strategy. European Commission Brussels.
EEA (2009). Progress towards the European 2010 biodiversity target. EEA Technical report No 5/2009.
EEA (2007). Halting the loss of biodiversity by 2010: proposal for a first set of indicators to monitor progress in Europe. EEA Technical report No 11/2007.
EEA (2006) How we reason. http://org.eea.eu.int/documents/brochure/brochure_reason.html. EEA (2002). An Inventory of Biodiversity Indicators in Europe. European Environment Agency –
European Centre for Nature Conservation. Copenhagen. EEA (1994). Corine Land Cover report – Part 2: Nomenclature.
http://www.eea.europa.eu/publications/COR0-part2 EU (2000). Directive 2000/60/EC of the European Parliament and of the Council of 23 October 2000
establishing a framework for community action in the field of water policy. Official Journal of European Communities 43: 1-72.

-- DRAFT VERSION 3 -- ENVEurope A2: Indicator framework 2011-10-28
49
Fath, B. & B.C. Patten (1998): Network orientors: A utility goal function based on net-work synergism. In: Müller, F. & M. Leupelt (eds.): Eco targets, goal functions and orientors. Berlin, Heidelberg, New York: 161-176.
Féral, J.-P. et al. (2003). European marine biodiversity indicators: report of the European Concerted Action: BIOMARE implementation and networking of large scale, long term Marine Biodiversity Research in Europe. NIOO/CEME: Yerseke, The Netherlands. 130 pp.
Fränzle, O., Kappen, L., Blume, H.-P. & Dierssen, K. (eds.) (2009). Ecosystem organization of a complex landscape. Long-term research in the Bornhöved Lake District, Germany. Springer, Berlin,
GEO BON (Group on Earth Observations Biodiversity Observation Network) (2010). Detailed Implementation Plan. GEO BON. Version 1.0 – 22 May 2010.
Haberl, H., Gaube, V., Díaz-Delgado, R., Krauze, K., Neuner, A., Peterseil, J., Plutzar, C., Singh, S.J., Vadineanu, A. (2009). Towards an integrated model of socioeconomic biodiversity drivers, pressures and impacts. A feasibility study based on three European long-term socio-ecological research platforms. Ecological Economics 68, 1797 -1812 .
Haberl, H., Erb, K.H., Krausmann, F. Gaube, V., Bondeau, A., Plutzar, C., Gingrich, S., Lucht, W., Fischer-Kowalski, M. (2007). Quantifying and mapping the human appropriation of net primary production in earth’s terrestrial ecosystems. PNAS vol. 104 no. 31, 12942–12947.
Haines-Young, R., Watkins, C., Wale, C., Murdock, A., (2006). Modelling natural capital: The case of landscape restoration on the South Downs, England. Landsc Urban Plann 75, 244-264.
Jørgensen, S.E., F.-L. Xu, J.C. Marques & F. Salas (2010): Application of Indicators for the Assessment of Ecosystem Health. In: Jørgensen, S.E., F.-L. Xu & R. Costanza (eds.): Ecological Indicators for Assessment of Ecosystem Health. 2nd Ed. CRC Press: 9-76.
Jørgensen, S.E. (2000): The tentative fourths law of thermodynamics. In: Jörgensen, S.E. & F. Müller (eds.): Handbook of ecosystem theories and management. CRC Press, Boca Raton,161-176
Jørgensen, S.E. (1996): Integration of ecosystem theories – a pattern, Dortrecht. Jørgensen, S.E. & F. Müller (2000): Ecological orientors – a path to environmental applications of
ecosystem theories. In: Jørgensen, S.E. & F. Müller (eds.): Handbook of ecosystem theories and management. Boca Raton: 561-576
Kay, J.J. (2000): Ecosystems as self-organised holarchic open systems: Narratives and the second law of thermodynamics. In: Jørgensen, S.E. & F. Müller (eds.): Handbook of ecosystem theories and management. Boca Raton: 135-160:
Kristensen, P. (2003). EEA core set of indicators. EEA technical report. Likens G. E. (1992): The Ecosystem Approach: Its Use and Abuse. Oldendorf/Luhe. Lindenmayer, D.B., Likens, G.E. (2009). Adaptive monitoring: a new paradigm for long-term research
and monitoring. Trends in Ecology and Evolution Vol.24 No.9. 482-486. Loh, J. (2000). Living Planet Report 2000. Gland, World Wide Fund For Nature. MA (Millennium Ecosystem Assessment), 2005. Ecosystems and Human Wellbeing: Synthesis. Island
Press, Washington, DC. World Resources Institute. Magurran, A.E., Baillie, S.R., Buckland, S.T., Dick, J.M., Elston, D.A., Scott, E.M., Smith, R.I., Somerfield,
P.J., Watt, A.D. (2010). Long-term datasets in biodiversity research and monitoring: assessing change in ecological communities through time. Trens in Ecology and Evolution Vol. 25 No. 10: 574-582.
Mirtl, M., Boamrane, M., Braat, L., Furman, E., Krauze, K., Frenzel, M., Gaube, V., Groner, E., Hester, A., Klotz, S., Los, W., Mautz, I., Peterseil, J., Richter, A., Schentz, H., Schleidt, K., Schmid, M., Sier, A., Stadler, J., Uhel, R., Wildenberg, M., Zacharias, S., (2009). LTER-Europe Design and Implementation Report – Enabling “Next Generation Ecological Science”: Report on the design and implementation phase of LTER-Europe under ALTER-Net & management plan 2009/2010. Umweltbundesamt Österreich. Vienna. 220 pages
Müller, F., Baesler C., Schubert, H., Klotz, S. (eds.) (2010): Long-Term Ecological Research - Between Theory and Application. Springer.
Müller, F. & B. Burkhard (2010): Ecosystem Indicators for the Integrated Management of Landscape
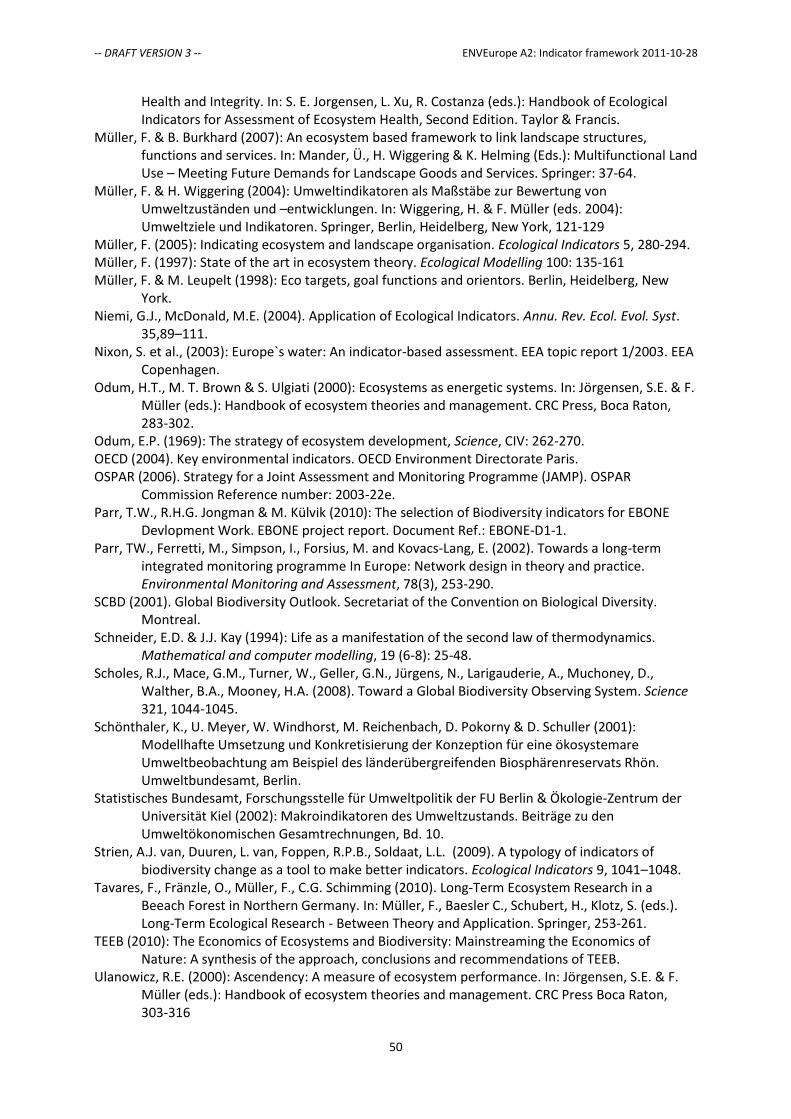
-- DRAFT VERSION 3 -- ENVEurope A2: Indicator framework 2011-10-28
50
Health and Integrity. In: S. E. Jorgensen, L. Xu, R. Costanza (eds.): Handbook of Ecological Indicators for Assessment of Ecosystem Health, Second Edition. Taylor & Francis.
Müller, F. & B. Burkhard (2007): An ecosystem based framework to link landscape structures, functions and services. In: Mander, Ü., H. Wiggering & K. Helming (Eds.): Multifunctional Land Use – Meeting Future Demands for Landscape Goods and Services. Springer: 37-64.
Müller, F. & H. Wiggering (2004): Umweltindikatoren als Maßstäbe zur Bewertung von Umweltzuständen und –entwicklungen. In: Wiggering, H. & F. Müller (eds. 2004): Umweltziele und Indikatoren. Springer, Berlin, Heidelberg, New York, 121-129
Müller, F. (2005): Indicating ecosystem and landscape organisation. Ecological Indicators 5, 280-294. Müller, F. (1997): State of the art in ecosystem theory. Ecological Modelling 100: 135-161 Müller, F. & M. Leupelt (1998): Eco targets, goal functions and orientors. Berlin, Heidelberg, New
York. Niemi, G.J., McDonald, M.E. (2004). Application of Ecological Indicators. Annu. Rev. Ecol. Evol. Syst.
35,89–111. Nixon, S. et al., (2003): Europe`s water: An indicator-based assessment. EEA topic report 1/2003. EEA
Copenhagen. Odum, H.T., M. T. Brown & S. Ulgiati (2000): Ecosystems as energetic systems. In: Jörgensen, S.E. & F.
Müller (eds.): Handbook of ecosystem theories and management. CRC Press, Boca Raton, 283-302.
Odum, E.P. (1969): The strategy of ecosystem development, Science, CIV: 262-270. OECD (2004). Key environmental indicators. OECD Environment Directorate Paris. OSPAR (2006). Strategy for a Joint Assessment and Monitoring Programme (JAMP). OSPAR
Commission Reference number: 2003-22e. Parr, T.W., R.H.G. Jongman & M. Külvik (2010): The selection of Biodiversity indicators for EBONE
Devlopment Work. EBONE project report. Document Ref.: EBONE-D1-1. Parr, TW., Ferretti, M., Simpson, I., Forsius, M. and Kovacs-Lang, E. (2002). Towards a long-term
integrated monitoring programme In Europe: Network design in theory and practice. Environmental Monitoring and Assessment, 78(3), 253-290.
SCBD (2001). Global Biodiversity Outlook. Secretariat of the Convention on Biological Diversity. Montreal.
Schneider, E.D. & J.J. Kay (1994): Life as a manifestation of the second law of thermodynamics. Mathematical and computer modelling, 19 (6-8): 25-48.
Scholes, R.J., Mace, G.M., Turner, W., Geller, G.N., Jürgens, N., Larigauderie, A., Muchoney, D., Walther, B.A., Mooney, H.A. (2008). Toward a Global Biodiversity Observing System. Science 321, 1044-1045.
Schönthaler, K., U. Meyer, W. Windhorst, M. Reichenbach, D. Pokorny & D. Schuller (2001): Modellhafte Umsetzung und Konkretisierung der Konzeption für eine ökosystemare Umweltbeobachtung am Beispiel des länderübergreifenden Biosphärenreservats Rhön. Umweltbundesamt, Berlin.
Statistisches Bundesamt, Forschungsstelle für Umweltpolitik der FU Berlin & Ökologie-Zentrum der Universität Kiel (2002): Makroindikatoren des Umweltzustands. Beiträge zu den Umweltökonomischen Gesamtrechnungen, Bd. 10.
Strien, A.J. van, Duuren, L. van, Foppen, R.P.B., Soldaat, L.L. (2009). A typology of indicators of biodiversity change as a tool to make better indicators. Ecological Indicators 9, 1041–1048.
Tavares, F., Fränzle, O., Müller, F., C.G. Schimming (2010). Long-Term Ecosystem Research in a Beeach Forest in Northern Germany. In: Müller, F., Baesler C., Schubert, H., Klotz, S. (eds.). Long-Term Ecological Research - Between Theory and Application. Springer, 253-261.
TEEB (2010): The Economics of Ecosystems and Biodiversity: Mainstreaming the Economics of Nature: A synthesis of the approach, conclusions and recommendations of TEEB.
Ulanowicz, R.E. (2000): Ascendency: A measure of ecosystem performance. In: Jörgensen, S.E. & F. Müller (eds.): Handbook of ecosystem theories and management. CRC Press Boca Raton, 303-316
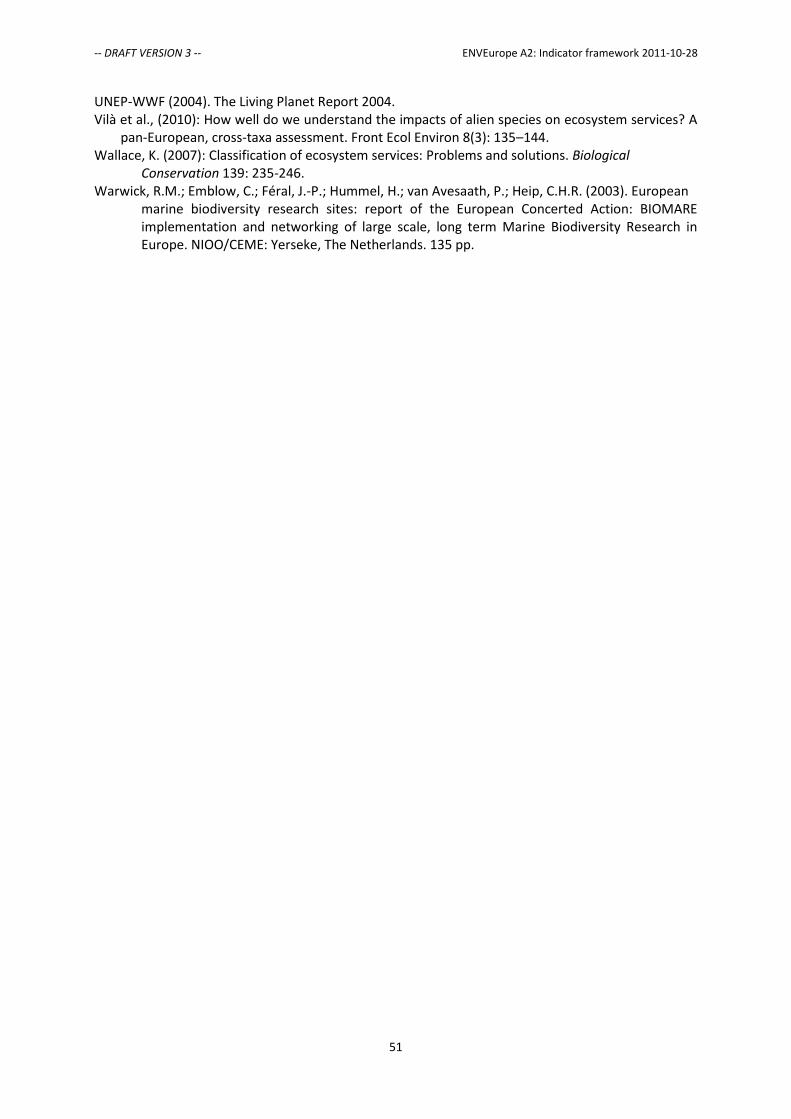
-- DRAFT VERSION 3 -- ENVEurope A2: Indicator framework 2011-10-28
51
UNEP-WWF (2004). The Living Planet Report 2004. Vilà et al., (2010): How well do we understand the impacts of alien species on ecosystem services? A
pan-European, cross-taxa assessment. Front Ecol Environ 8(3): 135–144. Wallace, K. (2007): Classification of ecosystem services: Problems and solutions. Biological
Conservation 139: 235-246. Warwick, R.M.; Emblow, C.; Féral, J.-P.; Hummel, H.; van Avesaath, P.; Heip, C.H.R. (2003). European
marine biodiversity research sites: report of the European Concerted Action: BIOMARE implementation and networking of large scale, long term Marine Biodiversity Research in Europe. NIOO/CEME: Yerseke, The Netherlands. 135 pp.

-- DRAFT VERSION 3 -- ENVEurope A2: Indicator framework 2011-10-28
52
Annex
Table 1A: SEBI 2010 indicators within CBD focal areas and headline indicators (EEA 2007 &
2009).
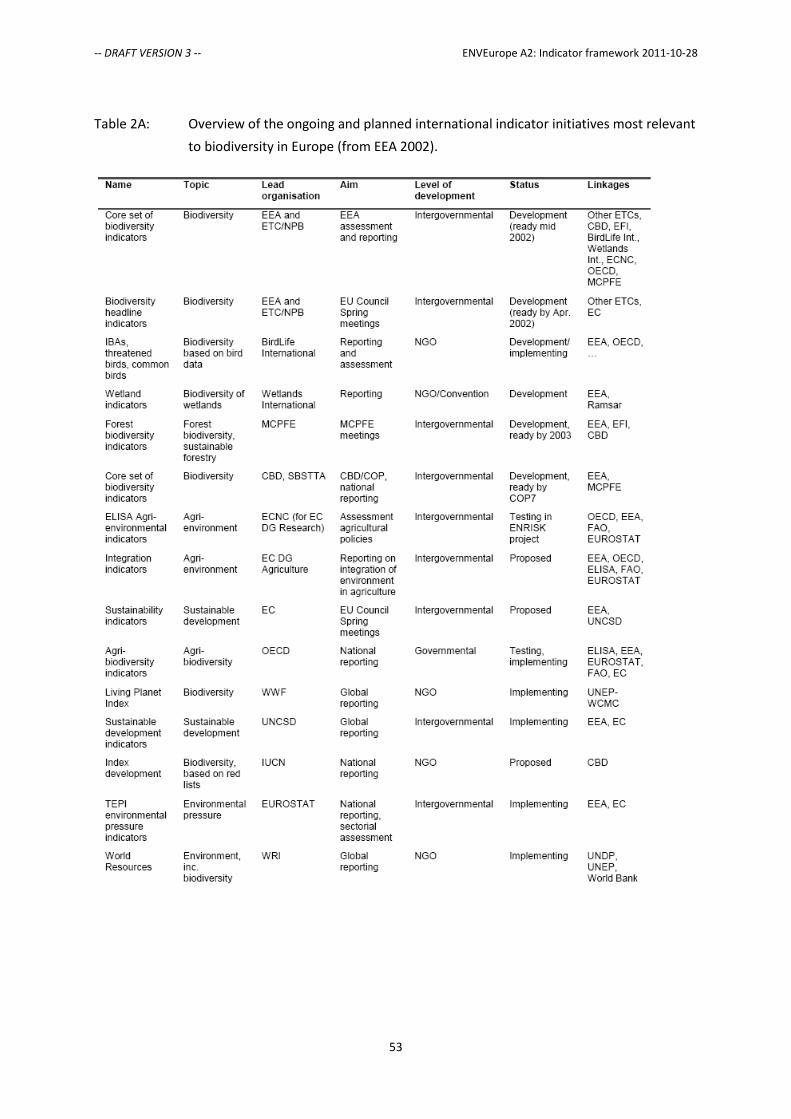
-- DRAFT VERSION 3 -- ENVEurope A2: Indicator framework 2011-10-28
53
Table 2A: Overview of the ongoing and planned international indicator initiatives most relevant
to biodiversity in Europe (from EEA 2002).
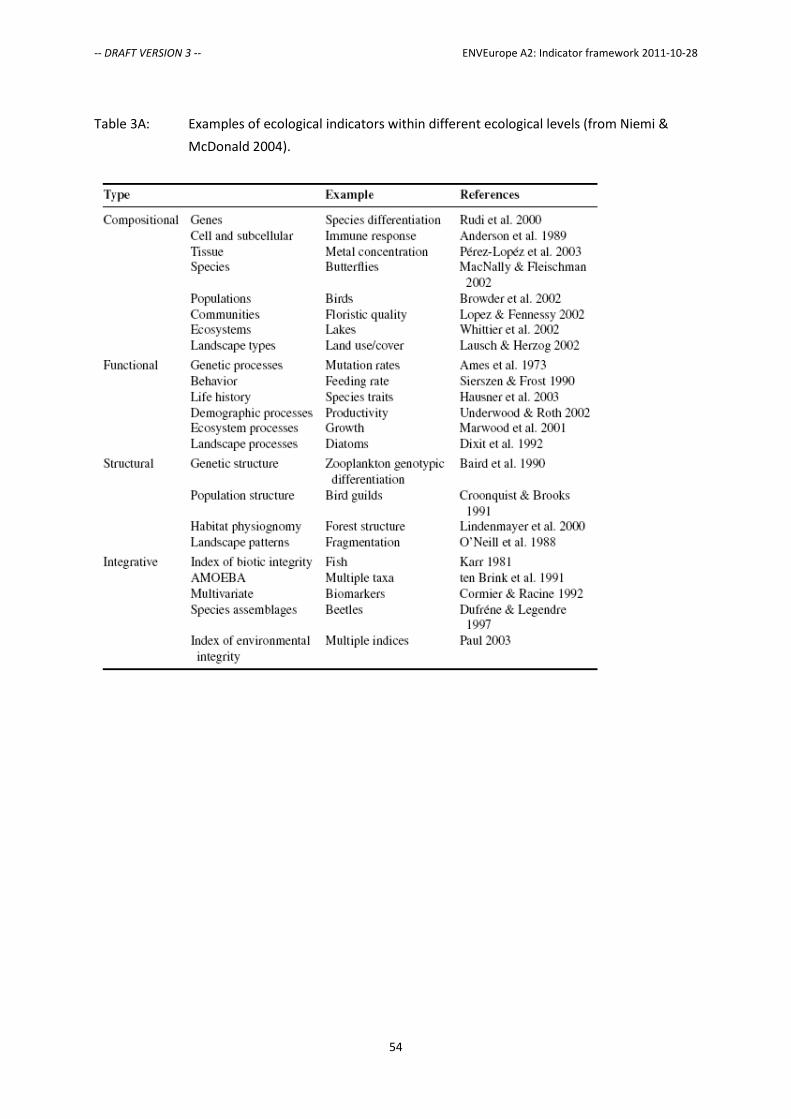
-- DRAFT VERSION 3 -- ENVEurope A2: Indicator framework 2011-10-28
54
Table 3A: Examples of ecological indicators within different ecological levels (from Niemi &
McDonald 2004).