Conceptual design of financial ontology - annals-csis.org aim of this article is to present the...
7
Abstract—The article presents the approach to the conceptualization of the financial knowledge used for an Intelligent Dashboard for Managers. The content of the knowledge is focused on essential financial concepts and relationships related to the management of small and medium enterprises (SME). That includes the illustration of the conceptualization of the ontology. The designed ontology was split into six ontologies describing areas of Cash Flow at Risk, Comprehensive Risk Measurement, Early Warning Models, Credit Scoring, Financial Market, and General Financial Knowledge. The examples of the topic map of key financial indicators and their interpretation are given. The results of this research have been implemented in the Business Intelligence system. I. INTRODUCTION O make optimal decisions, managers need very useful, adequate and easy to interpret information. They must analyse various economic indicators assessing the financial situation of an enterprise. Data for analyses are usually extracted from different information systems. To interpret a financial indicator, a manager should analyze relations between indicators and economic data which have influence on its value. However, available information systems concentrate mainly on providing information reflecting hierarchic relationships between examined indicators. Decision-makers evaluate semantic associations existing between them. Such an analysis of indicators can potentially ease and shorten the time needed, inter alia, to identify chances of advancement and threats of breakdown related to carrying out an activity. In order to facilitate the process of data analysis, the usage of the ontology is proposed as a model of financial knowledge about the analysis of indicators. T The decision-makers of small and medium enterprises (SMEs), in comparison to managers of big companies, may not have access to all essential strategic information. Usually financial expertise is either not available or too expensive. Big companies have at their disposal strategic consultation and possess standard procedures to solve problems in the case of essential changes in business environment. For financial and personnel reasons most SMEs cannot afford these types of facilities. It should be noted that SMEs operate in a definitely more uncertain and risky environment than big enterprises, because of a complex and dynamic market that has much more important impact on SMEs’ financial situation than on big companies [1]. In general, most existing Business Intelligence (BI) and Executive Information Systems (EIS) provide the functionality of data aggregation and visualization. Many reports and papers in this domain underline that decision makers expect new ICT solutions to interactively provide not only relevant and up-to-date information on the financial situation of their companies, but also explanations taking into account the contextual relationships. Our research concentrates on two essential issues: supporting decision makers in the area of analysis of economic and financial information using solutions for representing the ontology of economic and financial data (for example: topic map) 1 , and using tools for visualization of the semantic network, which is based on an ontology model of the economic knowledge and data from all relevant information systems 2 . The aim of this article is to present the conceptual design of financial ontology. The structure of the paper is as follows. In the next section, the functional schema of the system is discussed. The main domain areas of financial knowledge are presented and detailed by the topic map of the main financial indicators. Section 3 describes the process of ontology development, in particular the actual design of the ontology. A case study in section 4 illustrates an example of financial ontology conceptualisation. To show the reasoning a case for explanation of financial data is specified. In the conclusion, the future research directions are indicated. 1 This research was supported by the National Research and Development Centre within the Innotech program (track In-Tech), grant agreement no. INNOTECH-K1/IN1/34/153437/NCBR/12. The name of this project was the Intelligent Dashboard for Managers, which was conducted by a consortium led by the Wrocław University of Economics, Poland (the leader: Jerzy Korczak), and the other principal member is the company UNIT4 TETA BI Center. Credit Agricole Polska also participated in the project. The project was realized during the period 2012-2014. 2 This research was supported by the Polish Ministry of Science and Higher Education (grant N N111 284038 ). This grant was realised by Helena Dudycz during the period 2010-2012. Conceptual design of financial ontology Helena Dudycz Wrocław University of Economics Komandorska Str. 118/120, PL 53-345 Wroclaw, Poland Email: [email protected] Jerzy Korczak Wrocław University of Economics Komandorska Str. 118/120, PL 53-345 Wroclaw, Poland Email:[email protected] Proceedings of the Federated Conference on Computer Science and Information Systems pp. 1505–1511 DOI: 10.15439/2015F162 ACSIS, Vol. 5 978-83-60810-66-8/$25.00 c 2015, IEEE 1505
Transcript of Conceptual design of financial ontology - annals-csis.org aim of this article is to present the...
Abstract—The article presents the approach to theconceptualization of the financial knowledge used for anIntelligent Dashboard for Managers. The content of theknowledge is focused on essential financial concepts andrelationships related to the management of small and mediumenterprises (SME). That includes the illustration of theconceptualization of the ontology. The designed ontology wassplit into six ontologies describing areas of Cash Flow at Risk,Comprehensive Risk Measurement, Early Warning Models,Credit Scoring, Financial Market, and General FinancialKnowledge. The examples of the topic map of key financialindicators and their interpretation are given. The results of thisresearch have been implemented in the Business Intelligencesystem.
I. INTRODUCTION
O make optimal decisions, managers need very useful,
adequate and easy to interpret information. They must
analyse various economic indicators assessing the financial
situation of an enterprise. Data for analyses are usually
extracted from different information systems. To interpret
a financial indicator, a manager should analyze relations
between indicators and economic data which have influence
on its value. However, available information systems
concentrate mainly on providing information reflecting
hierarchic relationships between examined indicators.
Decision-makers evaluate semantic associations existing
between them. Such an analysis of indicators can potentially
ease and shorten the time needed, inter alia, to identify
chances of advancement and threats of breakdown related to
carrying out an activity. In order to facilitate the process of
data analysis, the usage of the ontology is proposed as
a model of financial knowledge about the analysis of
indicators.
T
The decision-makers of small and medium enterprises
(SMEs), in comparison to managers of big companies, may
not have access to all essential strategic information.
Usually financial expertise is either not available or too
expensive. Big companies have at their disposal strategic
consultation and possess standard procedures to solve
problems in the case of essential changes in business
environment. For financial and personnel reasons most
SMEs cannot afford these types of facilities. It should be
noted that SMEs operate in a definitely more uncertain and
risky environment than big enterprises, because of
a complex and dynamic market that has much more
important impact on SMEs’ financial situation than on big
companies [1].
In general, most existing Business Intelligence (BI) and
Executive Information Systems (EIS) provide the
functionality of data aggregation and visualization. Many
reports and papers in this domain underline that decision
makers expect new ICT solutions to interactively provide
not only relevant and up-to-date information on the financial
situation of their companies, but also explanations taking
into account the contextual relationships.
Our research concentrates on two essential issues:
supporting decision makers in the area of analysis of
economic and financial information using solutions for
representing the ontology of economic and financial data
(for example: topic map)1, and using tools for visualization
of the semantic network, which is based on an ontology
model of the economic knowledge and data from all relevant
information systems2.
The aim of this article is to present the conceptual design
of financial ontology. The structure of the paper is as
follows. In the next section, the functional schema of the
system is discussed. The main domain areas of financial
knowledge are presented and detailed by the topic map of
the main financial indicators. Section 3 describes the process
of ontology development, in particular the actual design of
the ontology. A case study in section 4 illustrates an example
of financial ontology conceptualisation. To show the
reasoning a case for explanation of financial data is
specified. In the conclusion, the future research directions
are indicated.
1 This research was supported by the National Research andDevelopment Centre within the Innotech program (track In-Tech), grantagreement no. INNOTECH-K1/IN1/34/153437/NCBR/12. The name of thisproject was the Intelligent Dashboard for Managers, which was conductedby a consortium led by the Wrocław University of Economics, Poland (theleader: Jerzy Korczak), and the other principal member is the companyUNIT4 TETA BI Center. Credit Agricole Polska also participated in theproject. The project was realized during the period 2012-2014.
2 This research was supported by the Polish Ministry of Science andHigher Education (grant N N111 284038 ). This grant was realised byHelena Dudycz during the period 2010-2012.
Conceptual design of financial ontology
Helena DudyczWrocław University of Economics
Komandorska Str. 118/120, PL 53-345 Wroclaw, Poland
Email: [email protected]
Jerzy KorczakWrocław University of Economics
Komandorska Str. 118/120, PL 53-345 Wroclaw, Poland
Email:[email protected]
Proceedings of the Federated Conference on
Computer Science and Information Systems pp. 1505–1511
DOI: 10.15439/2015F162
ACSIS, Vol. 5
978-83-60810-66-8/$25.00 c©2015, IEEE 1505
II.PROPOSAL WIDEN BUSINESS INTELLIGENCE SYSTEM
FUNCTIONALITIES
The Business Intelligence (BI) system is used for the
analysis of all basic areas of an enterprise’s activities, such
as, e.g., finance and accounting, manufacturing, logistics,
marketing, sales, and customer relationships. These
applications provide many reports containing valuable
information in each statement. Retrieval information from
these reports is eased by the use of appropriate forms of its
presentation, and of a friendly and easy user interface.
Nowadays decision-makers want not only to look at static
reports or even ad hoc reports, but also easy-to-use tools to
assess goals and key performance indicators to identify any
chances of advancement and threats of breakdown. The
usefulness of the BI system is not related to the amount of
generated information, but to the information which is
required at the right moment. These were basic motives for
developing and applying a new technology and knowledge
representation in the BI system. In the literature, the
development of BI systems towards BI 2.0 (using semantic
search) is described (see [2]-[4]). This system is focused
on the semantic analysis of data, using data and information
from multiple sources (including external sources). One of
the main artifacts to create a semantic network is the
ontology, because the architecture of BI 2.0 has new
components, such as ontologies and service ontologies (see
[2]). The ontologies are used to create the necessary
knowledge models for defining and explaining
functionalities in analytical tools. Using ontologies and
semantic networks for a visual interface supporting an
information search in the BI system may help to reduce the
following weaknesses of management information systems
(see [4], [5]):
• lack of support in defining business rules for getting
proactive information and support in consulting in the
process of decision making;
• lack of a semantic layer describing relations between dif-
ferent economic topics;
• lack of support in presenting the information of different
users (employees) and their individual needs;
• difficulty in rapidly modifying existing databases and
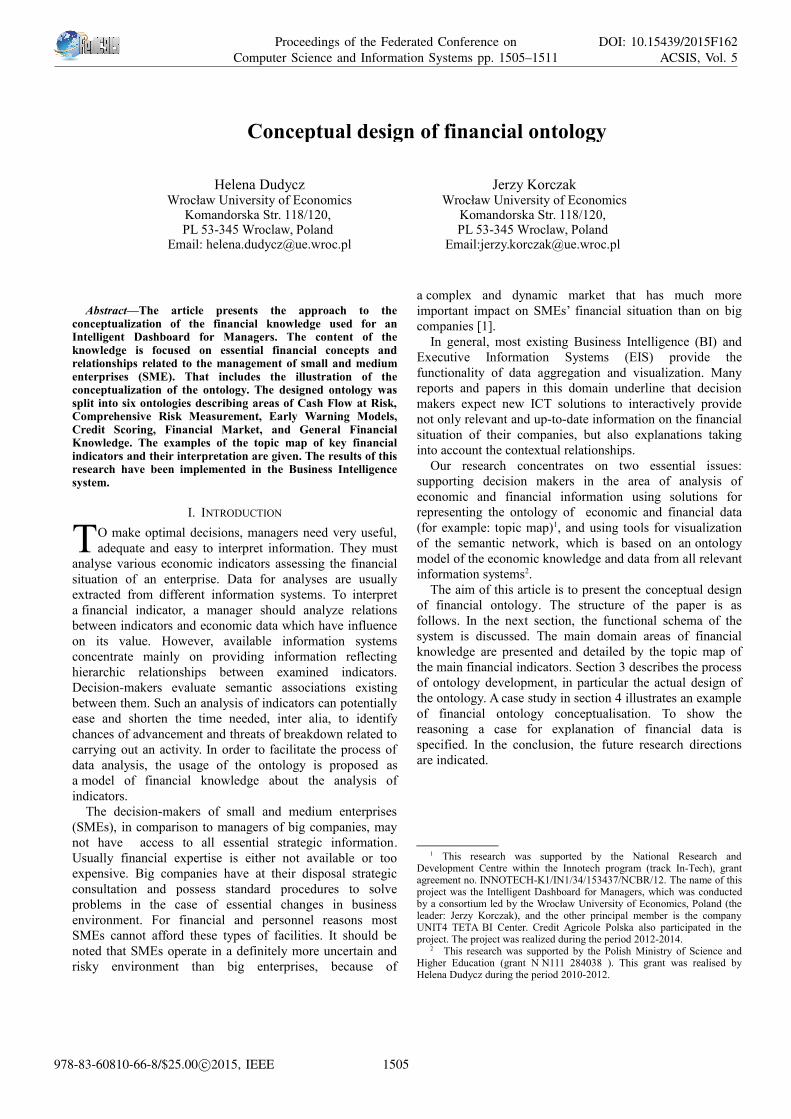
data warehouses in the case of new analytic requirements.In Figure 1 a functional architecture of the information
system is presented, with ontology applications. Various
mechanisms can be seen for extracting source data from
transactional systems (ETL), its data warehouse, and exter-
nal sources. However, the available solutions – in particular
the standard analyses, reports and analytical statements gen-
erated by the system – are complemented by economic and
financial knowledge (most importantly ontologies). This en-
ables a dynamic, interactive analysis of key economic and
financial indicators. Such architecture concept was used in
the project InKoM (a wide review of the issue is presented
in: [6], [7]). This solution will significantly extend existing
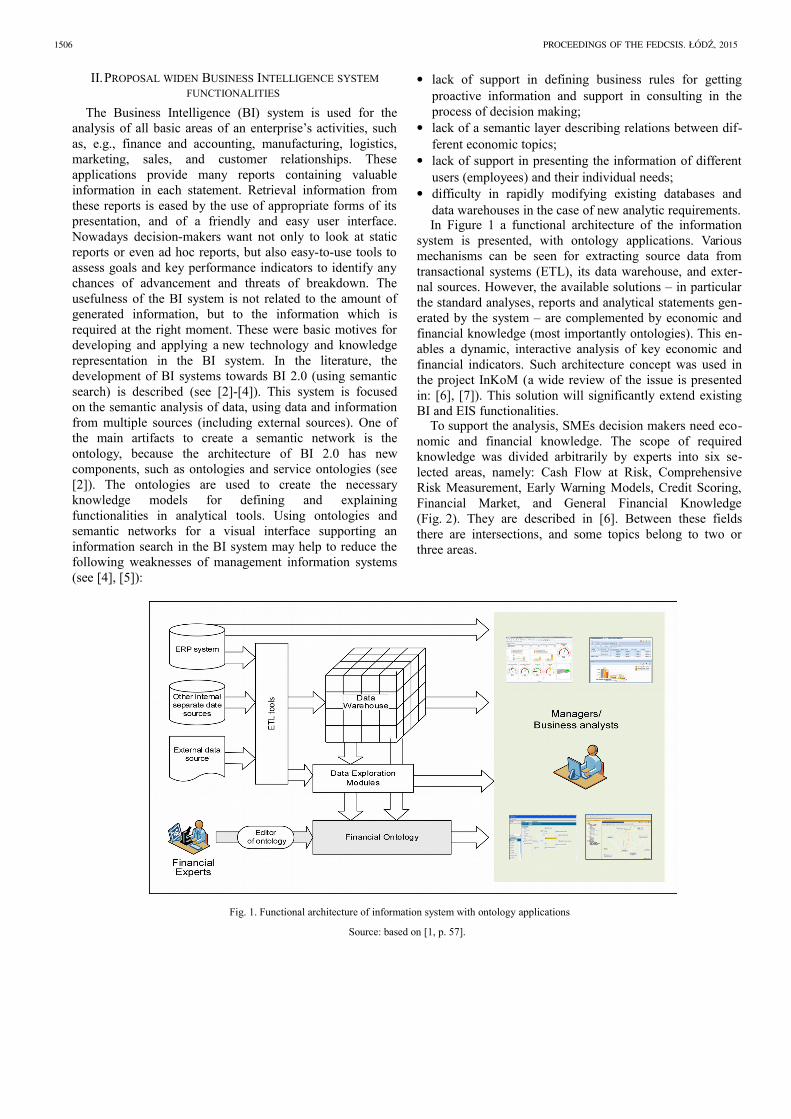
BI and EIS functionalities.To support the analysis, SMEs decision makers need eco-
nomic and financial knowledge. The scope of required
knowledge was divided arbitrarily by experts into six se-
lected areas, namely: Cash Flow at Risk, Comprehensive
Risk Measurement, Early Warning Models, Credit Scoring,
Financial Market, and General Financial Knowledge
(Fig. 2). They are described in [6]. Between these fields
there are intersections, and some topics belong to two or
three areas.
Fig. 1. Functional architecture of information system with ontology applications
Source: based on [1, p. 57].
1506 PROCEEDINGS OF THE FEDCSIS. ŁODZ, 2015
The system that enables semantic information retrieval
should be intuitive to use or easy to understand. For
managers, the presentation layer is the most critical aspect of
a BI system, since it broadly shapes their core understanding
of the data displayed [8]. The basic assumption of
navigation is that managers should be able to view focus and
context areas at the same time to present an overview of the
whole knowledge structure [9].
Ontology of financial knowledge is the foundation ofcreating a semantic network. In our project, specialattention was paid to the role of the visualization of asemantic network, which is not only a tool for presentingdata, but also provides an interface allowing interactivevisual information retrieval (see inter alia [10], [11]).Working from the displayed semantic structure of a built-inontology of financial and economic knowledge, it is possibleto interactively choose analyzed topics or relations, tochange the area of presented details, and to obtain relevantsource data.
Fig 2. Six selected areas of ontology in the Intelligent Dashboard forManagers
Source: [1, p. 61].
In the years 2011-2013 we carried out four experiments
with a created prototype and users participation. The results
of these experiments are optimistic (discussed inter alia
[12]). However, the usefulness of these solutions depends
mainly on substantive content, that is, correctly building the
ontology of financial or economic knowledge.
III. DESIGN PROCESS OF FINANCIAL ONTOLOGY
In the literature many different approaches to design of an
ontology can be found (a wide review of the issue is
presented in: [13]). There are many methods describing the
methods of creating ontology for information systems.
These are inter alia: Cyc, KBSI, TOVE, EMA,
HOLSAPPLE, HCONE, System KACTUS, SENSUS,
UPON, METHAONTOLOGIA, On-To-Knowledge method
(a wide review of the issue is presented in: [14], [15]). But
so far there is no single approach accepted by all.
Based on the analysis of existing methodologies and our
research, a method of creating an ontology of financial
indicators has been proposed. In this method, the following
stages are distinguished (see also: [1], [6], [16], [17]):
1. Definition of the goals, scope, and constraints of the
created ontology. While creating an ontology, assump-
tions about the created model of knowledge that will ap-
ply during its building have to be provided. That re-
quires an answer to the question: what will the created
ontology be used for?2. Conceptualization of the ontology. Independently of the
field that is to be modeled by using an ontological ap-
proach, it is the most important stage in creating
a model based on ontology (see inter alia [18, p. 2036]).
It includes the identification of all concepts, definition
of classes and their hierarchic structures, modeling rela-
tions, identification of instances, specification of ax-
ioms, and rules of reasoning.3. Verification of the ontology’s correctness by experts. In
this stage, the constructed ontology is verified by ex-
perts who did not participate in the process of conceptu-
alization. Verification is carried out in two steps. The
first concerns a formal verification of the specified on-
tology (e.g. incorrect relations are indicated) with the
use of a given editor. The second step is carried out by
experts from the given field and concerns content veri-
fication which includes verification of the correctness
of topics’ definitions, correctness of taxonomic topics,
and correctness of relational dependences between top-
ics. In the proposed method of building an ontology of
financial knowledge verification and validation were
isolated in accordance with approach used in software
engineering (see [19]).4. Encoding the ontology is described in the formal lan-
guage or editor of ontology. The result of this stage is
the encoded ontology. Two basic stages of encoding of
ontology are: (1) entering all topics and creating a tax-
onomy of these topics, and (2) entering all other types
of relations between topics. 5. Validation and evaluation of the built ontology. In this
stage, the encoded ontology is checked to ensure it
meets the needs of the managers. Validation is carried
out in three areas. Firstly, validation of usefulness and
correctness of the created ontology by experts (man-
agers) who will potentially use it. Secondly, evaluation
of the application with a created ontology is carried out
by managers. Finally, the validation of predefined use
cases is carried out. That requires an answer to the ques-
tions: will the created ontology be useful for the man-
agers who will use it?
Figure 3 shows the design process of an ontology of
financial knowledge.
HELENA DUDYCZ, JERZY KORCZAK: CONCEPTUAL DESIGN OF FINANCIAL ONTOLOGY 1507
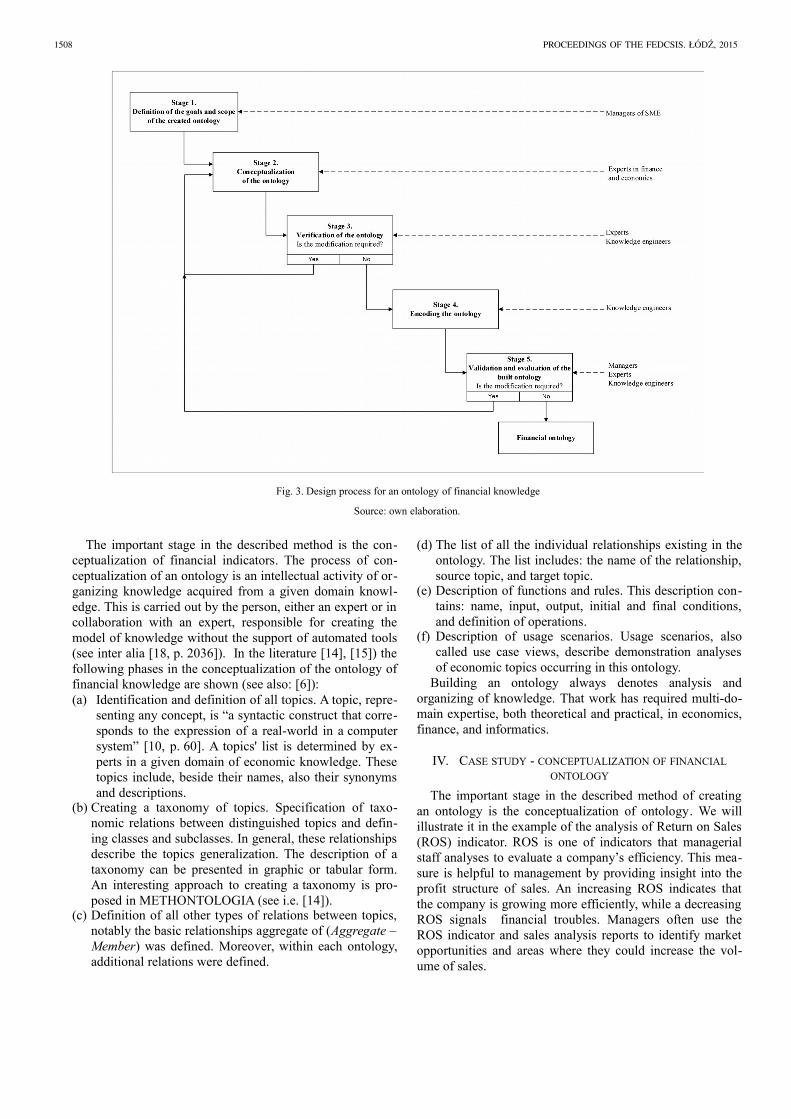
Fig. 3. Design process for an ontology of financial knowledge
Source: own elaboration.
The important stage in the described method is the con-
ceptualization of financial indicators. The process of con-
ceptualization of an ontology is an intellectual activity of or-
ganizing knowledge acquired from a given domain knowl-
edge. This is carried out by the person, either an expert or in
collaboration with an expert, responsible for creating the
model of knowledge without the support of automated tools
(see inter alia [18, p. 2036]). In the literature [14], [15]) the
following phases in the conceptualization of the ontology of
financial knowledge are shown (see also: [6]):
(a) Identification and definition of all topics. A topic, repre-
senting any concept, is “a syntactic construct that corre-
sponds to the expression of a real-world in a computer
system” [10, p. 60]. A topics' list is determined by ex-
perts in a given domain of economic knowledge. These
topics include, beside their names, also their synonyms
and descriptions.(b) Creating a taxonomy of topics. Specification of taxo-
nomic relations between distinguished topics and defin-
ing classes and subclasses. In general, these relationships
describe the topics generalization. The description of a
taxonomy can be presented in graphic or tabular form.
An interesting approach to creating a taxonomy is pro-
posed in METHONTOLOGIA (see i.e. [14]).(c) Definition of all other types of relations between topics,
notably the basic relationships aggregate of (Aggregate –
Member) was defined. Moreover, within each ontology,
additional relations were defined.
(d) The list of all the individual relationships existing in the
ontology. The list includes: the name of the relationship,
source topic, and target topic.(e) Description of functions and rules. This description con-
tains: name, input, output, initial and final conditions,
and definition of operations.(f) Description of usage scenarios. Usage scenarios, also
called use case views, describe demonstration analyses
of economic topics occurring in this ontology.
Building an ontology always denotes analysis and
organizing of knowledge. That work has required multi-do-
main expertise, both theoretical and practical, in economics,
finance, and informatics.
IV. CASE STUDY - CONCEPTUALIZATION OF FINANCIAL
ONTOLOGY
The important stage in the described method of creating
an ontology is the conceptualization of ontology. We will
illustrate it in the example of the analysis of Return on Sales
(ROS) indicator. ROS is one of indicators that managerial
staff analyses to evaluate a company’s efficiency. This mea-
sure is helpful to management by providing insight into the
profit structure of sales. An increasing ROS indicates that
the company is growing more efficiently, while a decreasing
ROS signals financial troubles. Managers often use the
ROS indicator and sales analysis reports to identify market
opportunities and areas where they could increase the vol-
ume of sales.
1508 PROCEEDINGS OF THE FEDCSIS. ŁODZ, 2015
The conceptualization of the ontology of the ROS indica-
tor was as follows:
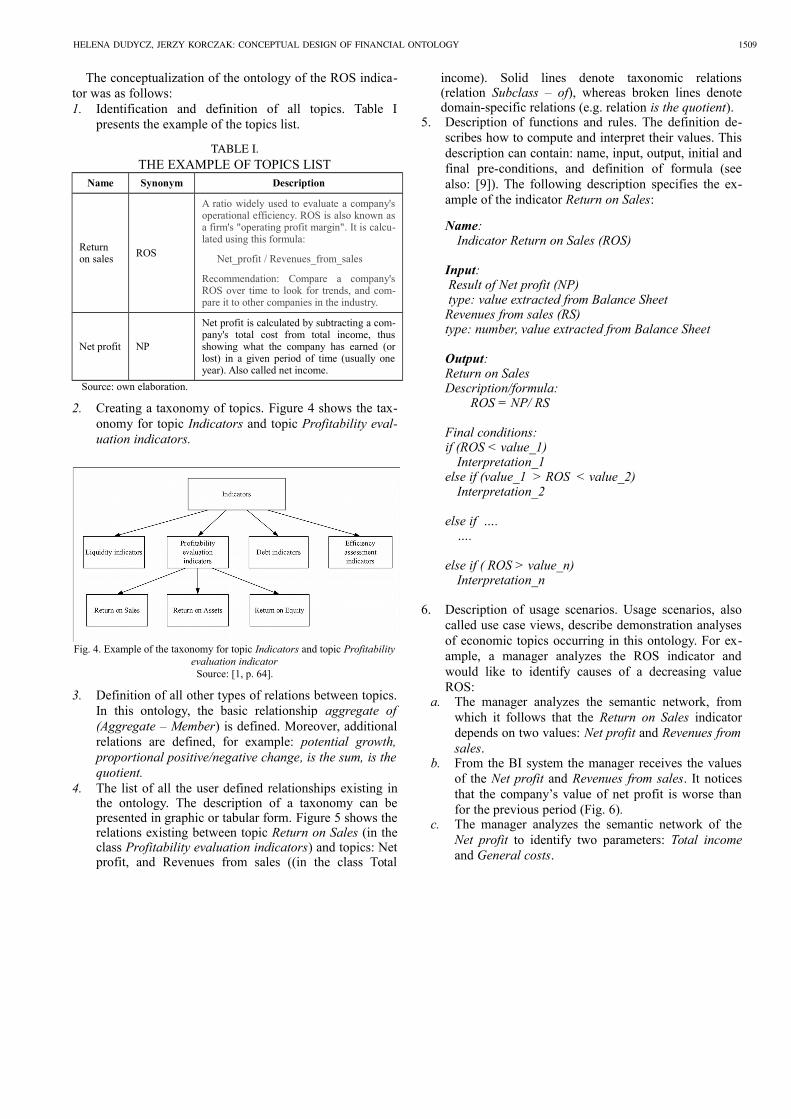
1. Identification and definition of all topics. Table I
presents the example of the topics list.
TABLE I.
THE EXAMPLE OF TOPICS LIST
Name Synonym Description
Returnon sales
ROS
A ratio widely used to evaluate a company'soperational efficiency. ROS is also known asa firm's "operating profit margin". It is calcu-lated using this formula:
Net_profit / Revenues_from_sales
Recommendation: Compare a company'sROS over time to look for trends, and com-pare it to other companies in the industry.
Net profit NP
Net profit is calculated by subtracting a com-pany's total cost from total income, thusshowing what the company has earned (orlost) in a given period of time (usually oneyear). Also called net income.
Source: own elaboration.
2. Creating a taxonomy of topics. Figure 4 shows the tax-
onomy for topic Indicators and topic Profitability eval-
uation indicators.
Fig. 4. Example of the taxonomy for topic Indicators and topic Profitability
evaluation indicator
Source: [1, p. 64].
3. Definition of all other types of relations between topics.
In this ontology, the basic relationship aggregate of
(Aggregate – Member) is defined. Moreover, additional
relations are defined, for example: potential growth,
proportional positive/negative change, is the sum, is the
quotient.
4. The list of all the user defined relationships existing inthe ontology. The description of a taxonomy can bepresented in graphic or tabular form. Figure 5 shows therelations existing between topic Return on Sales (in theclass Profitability evaluation indicators) and topics: Netprofit, and Revenues from sales ((in the class Total
income). Solid lines denote taxonomic relations(relation Subclass – of), whereas broken lines denotedomain-specific relations (e.g. relation is the quotient).
5. Description of functions and rules. The definition de-
scribes how to compute and interpret their values. This
description can contain: name, input, output, initial and
final pre-conditions, and definition of formula (see
also: [9]). The following description specifies the ex-
ample of the indicator Return on Sales:
Name: Indicator Return on Sales (ROS)
Input: Result of Net profit (NP) type: value extracted from Balance SheetRevenues from sales (RS)type: number, value extracted from Balance Sheet
Output:Return on SalesDescription/formula:
ROS = NP/ RS
Final conditions:if (ROS < value_1)
Interpretation_1else if (value_1 > ROS < value_2)
Interpretation_2
else if ….….
else if ( ROS > value_n)Interpretation_n
6. Description of usage scenarios. Usage scenarios, also
called use case views, describe demonstration analyses
of economic topics occurring in this ontology. For ex-
ample, a manager analyzes the ROS indicator and
would like to identify causes of a decreasing value
ROS:a. The manager analyzes the semantic network, from
which it follows that the Return on Sales indicator
depends on two values: Net profit and Revenues from
sales. b. From the BI system the manager receives the values
of the Net profit and Revenues from sales. It notices
that the company’s value of net profit is worse than
for the previous period (Fig. 6). c. The manager analyzes the semantic network of the
Net profit to identify two parameters: Total income
and General costs.
HELENA DUDYCZ, JERZY KORCZAK: CONCEPTUAL DESIGN OF FINANCIAL ONTOLOGY 1509
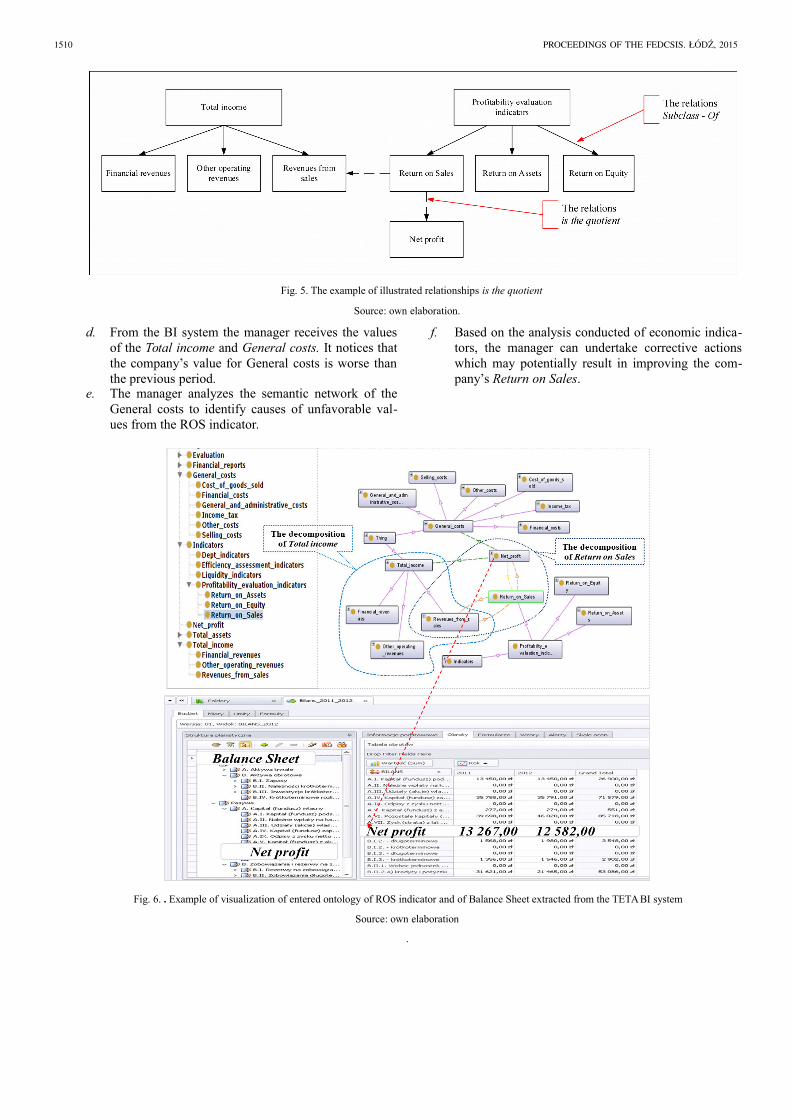
Fig. 5. The example of illustrated relationships is the quotient
Source: own elaboration.
d. From the BI system the manager receives the values
of the Total income and General costs. It notices that
the company’s value for General costs is worse than
the previous period.e. The manager analyzes the semantic network of the
General costs to identify causes of unfavorable val-
ues from the ROS indicator.
f. Based on the analysis conducted of economic indica-
tors, the manager can undertake corrective actions
which may potentially result in improving the com-
pany’s Return on Sales.
Fig. 6. . Example of visualization of entered ontology of ROS indicator and of Balance Sheet extracted from the TETA BI system
Source: own elaboration
.
1510 PROCEEDINGS OF THE FEDCSIS. ŁODZ, 2015
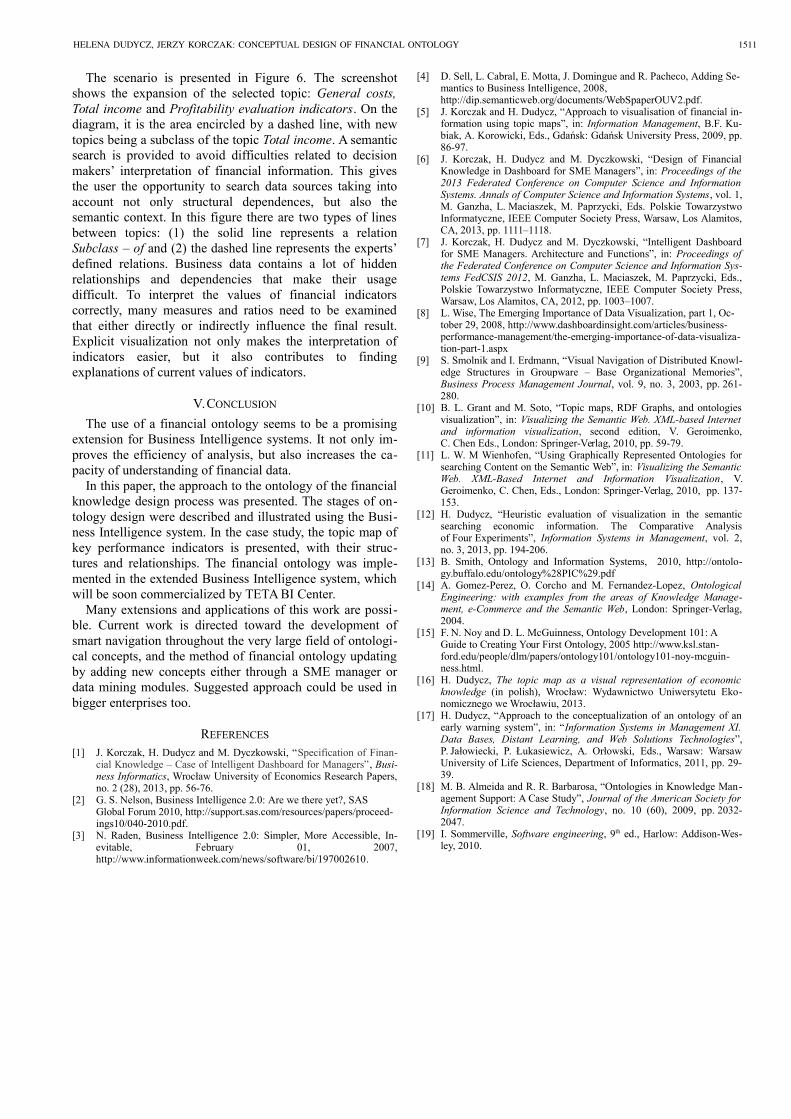
The scenario is presented in Figure 6. The screenshot
shows the expansion of the selected topic: General costs,
Total income and Profitability evaluation indicators. On the
diagram, it is the area encircled by a dashed line, with new
topics being a subclass of the topic Total income. A semantic
search is provided to avoid difficulties related to decision
makers’ interpretation of financial information. This gives
the user the opportunity to search data sources taking into
account not only structural dependences, but also the
semantic context. In this figure there are two types of lines
between topics: (1) the solid line represents a relation
Subclass – of and (2) the dashed line represents the experts’
defined relations. Business data contains a lot of hidden
relationships and dependencies that make their usage
difficult. To interpret the values of financial indicators
correctly, many measures and ratios need to be examined
that either directly or indirectly influence the final result.
Explicit visualization not only makes the interpretation of
indicators easier, but it also contributes to finding
explanations of current values of indicators.
V.CONCLUSION
The use of a financial ontology seems to be a promising
extension for Business Intelligence systems. It not only im-
proves the efficiency of analysis, but also increases the ca-
pacity of understanding of financial data.
In this paper, the approach to the ontology of the financial
knowledge design process was presented. The stages of on-
tology design were described and illustrated using the Busi-
ness Intelligence system. In the case study, the topic map of
key performance indicators is presented, with their struc-
tures and relationships. The financial ontology was imple-
mented in the extended Business Intelligence system, which
will be soon commercialized by TETA BI Center.
Many extensions and applications of this work are possi-
ble. Current work is directed toward the development of
smart navigation throughout the very large field of ontologi-
cal concepts, and the method of financial ontology updating
by adding new concepts either through a SME manager or
data mining modules. Suggested approach could be used in
bigger enterprises too.
REFERENCES
[1] J. Korczak, H. Dudycz and M. Dyczkowski, “Specification of Finan-cial Knowledge – Case of Intelligent Dashboard for Managers”, Busi-ness Informatics, Wrocław University of Economics Research Papers,no. 2 (28), 2013, pp. 56-76.
[2] G. S. Nelson, Business Intelligence 2.0: Are we there yet?, SAS Global Forum 2010, http://support.sas.com/resources/papers/proceed-ings10/040-2010.pdf.
[3] N. Raden, Business Intelligence 2.0: Simpler, More Accessible, In-evitable, February 01, 2007,http://www.informationweek.com/news/software/bi/197002610.
[4] D. Sell, L. Cabral, E. Motta, J. Domingue and R. Pacheco, Adding Se-mantics to Business Intelligence, 2008, http://dip.semanticweb.org/documents/WebSpaperOUV2.pdf.
[5] J. Korczak and H. Dudycz, “Approach to visualisation of financial in-formation using topic maps”, in: Information Management, B.F. Ku-biak, A. Korowicki, Eds., Gdańsk: Gdańsk University Press, 2009, pp.86-97.
[6] J. Korczak, H. Dudycz and M. Dyczkowski, “Design of FinancialKnowledge in Dashboard for SME Managers”, in: Proceedings of the2013 Federated Conference on Computer Science and InformationSystems. Annals of Computer Science and Information Systems, vol. 1,M. Ganzha, L. Maciaszek, M. Paprzycki, Eds. Polskie TowarzystwoInformatyczne, IEEE Computer Society Press, Warsaw, Los Alamitos,CA, 2013, pp. 1111–1118.
[7] J. Korczak, H. Dudycz and M. Dyczkowski, “Intelligent Dashboardfor SME Managers. Architecture and Functions”, in: Proceedings ofthe Federated Conference on Computer Science and Information Sys-tems FedCSIS 2012, M. Ganzha, L. Maciaszek, M. Paprzycki, Eds.,Polskie Towarzystwo Informatyczne, IEEE Computer Society Press,Warsaw, Los Alamitos, CA, 2012, pp. 1003–1007.
[8] L. Wise, The Emerging Importance of Data Visualization, part 1, Oc-tober 29, 2008, http://www.dashboardinsight.com/articles/business-performance-management/the-emerging-importance-of-data-visualiza-tion-part-1.aspx
[9] S. Smolnik and I. Erdmann, “Visual Navigation of Distributed Knowl-edge Structures in Groupware – Base Organizational Memories”,Business Process Management Journal, vol. 9, no. 3, 2003, pp. 261-280.
[10] B. L. Grant and M. Soto, “Topic maps, RDF Graphs, and ontologiesvisualization”, in: Visualizing the Semantic Web. XML-based Internetand information visualization, second edition, V. Geroimenko,C. Chen Eds., London: Springer-Verlag, 2010, pp. 59-79.
[11] L. W. M Wienhofen, “Using Graphically Represented Ontologies forsearching Content on the Semantic Web”, in: Visualizing the SemanticWeb. XML-Based Internet and Information Visualization, V.Geroimenko, C. Chen, Eds., London: Springer-Verlag, 2010, pp. 137-153.
[12] H. Dudycz, “Heuristic evaluation of visualization in the semanticsearching economic information. The Comparative Analysisof Four Experiments”, Information Systems in Management, vol. 2,no. 3, 2013, pp. 194-206.
[13] B. Smith, Ontology and Information Systems, 2010, http://ontolo-gy.buffalo.edu/ontology%28PIC%29.pdf
[14] A. Gomez-Perez, O. Corcho and M. Fernandez-Lopez, OntologicalEngineering: with examples from the areas of Knowledge Manage-ment, e-Commerce and the Semantic Web, London: Springer-Verlag,2004.
[15] F. N. Noy and D. L. McGuinness, Ontology Development 101: A Guide to Creating Your First Ontology, 2005 http://www.ksl.stan-ford.edu/people/dlm/papers/ontology101/ontology101-noy-mcguin-ness.html.
[16] H. Dudycz, The topic map as a visual representation of economicknowledge (in polish), Wrocław: Wydawnictwo Uniwersytetu Eko-nomicznego we Wrocławiu, 2013.
[17] H. Dudycz, “Approach to the conceptualization of an ontology of anearly warning system”, in: “Information Systems in Management XI.Data Bases, Distant Learning, and Web Solutions Technologies”,P. Jałowiecki, P. Łukasiewicz, A. Orłowski, Eds., Warsaw: WarsawUniversity of Life Sciences, Department of Informatics, 2011, pp. 29-39.
[18] M. B. Almeida and R. R. Barbarosa, “Ontologies in Knowledge Man-agement Support: A Case Study”, Journal of the American Society forInformation Science and Technology, no. 10 (60), 2009, pp. 2032-2047.
[19] I. Sommerville, Software engineering, 9th ed., Harlow: Addison-Wes-ley, 2010.
HELENA DUDYCZ, JERZY KORCZAK: CONCEPTUAL DESIGN OF FINANCIAL ONTOLOGY 1511
![Confidential 111 Financial Industry Business Ontology (FIBO) [FIBO– Business Entities] Understanding the Business Conceptual Ontology For FIBO-Business.](https://static.fdocuments.us/doc/165x107/56649edc5503460f94bec1c1/confidential-111-financial-industry-business-ontology-fibo-fibo-business.jpg)


![Conceptual IT Service Provider Model Ontologypstanche/Arnaoudova-Stanchev.pdf · Business model ontology [1] develops further his previous work of e-Business ontology and proposes](https://static.fdocuments.us/doc/165x107/5f5e867127330400be369267/conceptual-it-service-provider-model-ontology-pstanchearnaoudova-stanchevpdf.jpg)