Conceptual Design of a Manned Reconnaissance Airplane for ...
87
Conceptual Design of a Manned Reconnaissance Airplane for Martian Atmospheric Flight A project present to The Faculty of the Department of Aerospace Engineering San Jose State University in partial fulfillment of the requirements for the degree Master of Science in Aerospace Engineering By Jose L. Ferreira May 23, 2018 approved by Dr. Sean Montgomery Faculty Advisor 1
Transcript of Conceptual Design of a Manned Reconnaissance Airplane for ...

Conceptual Design of a MannedReconnaissance Airplane for Martian
Atmospheric Flight
A project present to The Faculty of the Department of Aerospace Engineering
San Jose State University
in partial fulfillment of the requirements for the degree
Master of Science in Aerospace Engineering
By
Jose L. Ferreira
May 23, 2018
approved by
Dr. Sean MontgomeryFaculty Advisor
1

Table of Contents
1. Introduction……………………………………………………………………………………………………
……….……….……..32. Mission Profile
…………………………………………………………………………………………………………………………3
3. PreliminaryConfiguration……………………………………………………………………………………
……………………43.1Overall
Configuration……………………………………………………………………………………………………………….4
3.1.1.1 Selection of PropulsionSystem………………………………………………………………………………………
….93.1.1.2 Electric
Propulsion……………………………………………………………………………………………………………..9
3.1.1.3 Fuel CellPropulsion……………………………………………………………………………………
…………………….133.1.1.4 Battery
Propulsion……………………………………………………………………………………………………………14
3.1.1.5 CombustionPropulsion……………………………………………………………………………………
………………143.1.1.6 Internal Combustion
Engines…………………………………………………………………………………………..15
3.1.1.7 PistonExpander……………………………………………………………………………………
…………………………163.2Selection of the Propulsion
System……………………………………………………………………………………….173.2.1 Selection of the
Propeller………………………………………………………………………………………………..19
3.2.2 Selection of the LandingGear………………………………………………………………………………………….2
3
2

4. Mission WeightEstimates…………………………………………………………………………………………
……………245. Performance Constraint
Analysis……………………………………………………………………………………………29
5.1StallSpeed………………………………………………………………………………………………
…………………………….295.2Take-of
Distance……………………………………………………………………………………………………………………30
5.3LandingDistance…………………………………………………………………………………………
………………………….315.4Speed
Constraints…………………………………………………………………………………………………………………..32
5.5Drag PolarEstimation………………………………………………………………………………………
……………………..335.6Climb
Constraints……………………………………………………………………………………………………………………35
5.7MatchingPlot…………………………………………………………………………………………………
……………………….366. Configuration of the Propulsion
System………………………………………………………………………………….376.1Engine……………………………………………………………………………………………
………………………………………..376.2Propellers…………………………………………………………………………………………
……………………………………..387. Fuselage
Design……………………………………………………………………………………………………………………….39
8. WingSizing………………………………………………………………………………………………
………………………………429. Design of the High-Life
Devices……………………………………………………………………………………………….54
10.Design of the Empennage and the Longitudinal and Directionalcontrols………………………………..59
11.Design of the Landing Gear and Weight andBalance……………………………………………………………….61
3

11.1 Landing GearDesign…………………………………………………………………………………………………
…………….6111.2 Weight and
Balance………………………………………………………………………………………………………………..6512.Stability and
Control…………………………………………………………………………………………………………………67
12.1 Static LongitudinalStability………………………………………………………………………………………………
……..6712.2 Directional
Stability…………………………………………………………………………………………………………………70
14.Conclusions……………………………………………………………………………………………………………………………….73
References………………………………………………………………………………………………………………………………………75
Appendix…………………………………………………………………………………………………………………………………………76
1. IntroductionAs humankind prepares to send the first ever manned missions to Mars, it has become
essential to develop the tools that will make exploration of the Red Planet possible. For
years, research on the feasibility of using aerial vehicles capable of flying in the Martian
atmosphere have uniquely concentrated on the development of unmanned aircraft.
There are several reasons why no serious proposals for the development of manned
aircraft have been made. Flying in the Martian atmosphere is a challenging endeavor
due to the physical characteristics of the atmosphere itself. In fact, the low Reynolds
number, high Mach number conditions characteristic of the airless, CO2-rich Martian
atmosphere impose serious constrains to aircraft designers. Due to challenges
associated with aerodynamic flight in the Red Planet, this report involves the conceptual
design of a prospective airplane capable of flying in the Martian atmosphere under a set
of given operational requirements..
2. Mission ProfileBecause the purpose of this report concentrates on the determination of important
design parameters and conditions required in the development of a two-seater aircraft
capable of operating in the Martian atmosphere under a pre-determined flight envelope,
4

logistical requirements such as storage of the airplane and/or its components during a
trip from the Earth to Mars, and other deliverance methods of such once in Mars, will be
omitted.The proposed vehicle must be capable of carrying up to two crewmen with a
predetermined payload of 120 Lbs. (equivalent to a weight of 45 Lbs. on Mars),
consisting of a low-altitude reconnaissance camera and survival equipment. The mission
involves low-altitude flights at cruising altitudes of no more than 1,000 feet above the
zero-elevation datum (6.105 mbar constant pressure reference ¿1
, and a range of
1,500 miles; while performing basic maneuvers like takeoff, climb, cruise, descend and
the landing stages of the mission profile depicted below.
12
34
56
0
250
500
750
1000
mission profile
altitude (ft)
Graph 1. Mission profile of the Mars airplane
3. Preliminary Configuration
The preliminary configuration of the airplane is based primarily on the atmosphericcharacteristics of Mars. In summary, the thin atmosphere of the planet, including a
density that is 6% that of Earth’s at the zero-elevation datum, imposes great constraintsor limitations to the performance and aerodynamic capabilities of any atmospheric flying
5

vessel. Lift generation, for instance, is greatly reduced even at the very low altitudesdescribed in the mission profile. This limitation requires careful sizing and design of
lifting surfaces capable of generating the lift necessary for flight. Furthermore, due to thelow Reynolds number, low Mach number characteristics of the Martian atmosphere,
selection of a proper propulsion system becomes critical.
3.1 Overall Configuration
Due to the previous challenges, various unmanned Mars airplane conceptsproposed have explored different configurations especially selected to maximize lift
generation while minimizing weight and drag.Although no originally envisioned to fly in Mars, NASA’s mini-sniffer became an
obvious candidate for eventual missions to Mars due to its performance at very lowatmospheric density conditions. Different variants of this concept relied on both
conventional and canard configurations, as shown in picture 1.
Picture 1. Mini-Sniffer configurations. [2]
Other visionary concepts that followed the Mini-Sniffer used similarconfigurations, including the Aerial Regional-scale Environmental Survey ARESaircraft (picture 2), which like the second version of the Mini-Sniffer (picture 1,
left) relied on a conventional configuration with an inverted V-tail.
Picture 2. ARES configuration [3]
6
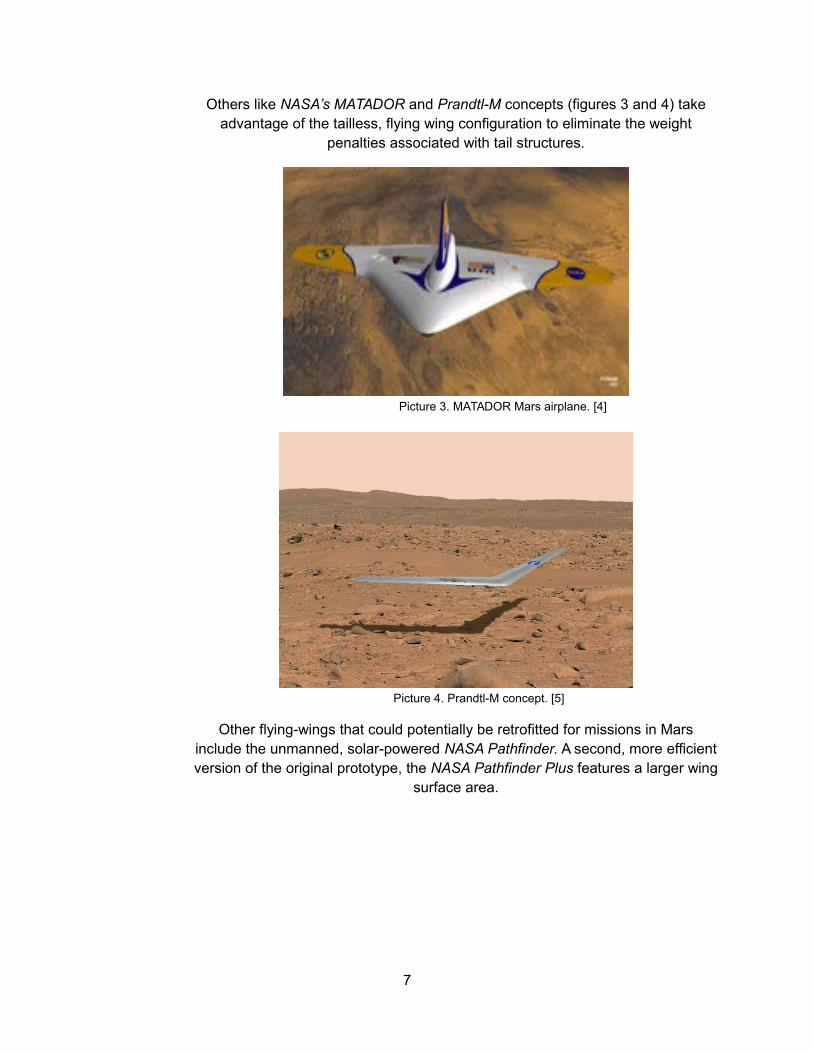
Others like NASA’s MATADOR and Prandtl-M concepts (figures 3 and 4) takeadvantage of the tailless, flying wing configuration to eliminate the weight
penalties associated with tail structures.
Picture 3. MATADOR Mars airplane. [4]
Picture 4. Prandtl-M concept. [5]
Other flying-wings that could potentially be retrofitted for missions in Marsinclude the unmanned, solar-powered NASA Pathfinder. A second, more efficientversion of the original prototype, the NASA Pathfinder Plus features a larger wing
surface area.
7

Picture 5. NASA Pathfinder (L) and NASA Pathfinder Plus (R). [6] [7]
Trade-Off Studies of Possible Configurations
The different pros and cons associated with the previous airplane configurations arenow examined. The selected configuration for the proposed Mars airplane will
depend on the especial performance and aerodynamic conditions that must be metin order to efficiently operate in Mars.
Conventional Configuration:
If it is desirable to naturally provide the airplane with an optimal level of stability andcontrol in pitch and yaw without the need of complex mechanisms, the conventional,or aft-tail configuration is the most beneficial. In fact, tailless airplanes are inherentlyunstable, making them hard to control. In flying wings, for example, vital restoration
of nose-down pitching moments can only be accomplished artificially with theaddition of highly complex and costly automatic control methods. Favorable
contributions of the empennage to the yaw and directional stability of an airplanethrough innate characteristics like the weathervane effect are reduced or absent in
other configurations.There are two major disadvantages associated with aft-tail designs. In contrast to
tailless layouts like canards and flying wings, conventional layouts introduce weightand drag penalties associated with the empennage; this diminishes aerodynamic
efficiency and performance.
Flying Wings:
Based on the previous assessment regarding conventional configurations, flyingwings would be ideal for critical missions where weight and drag minimization aremandatory. In fact, tailless aircraft like the Matador and Prandtl-M have higher L/D
ratios than other configurations.There exist, however, significant drawbacks associated with flying wings. Inherently
low CLmax generation, which requires high angles of attack during take-off andlanding, and reduced wing loading (W/S), are important considerations to be kept in
8

mind in the design of a prospective Martian aerial vehicle. Indeed, due to limitedCLmax, flying wings are generally inefficient during cruise flight and maneuvering.
Deflection of trailing edge flaps on tailless aircraft induces nose-down pitchingmoments and associated instability during the takeoff and landing stages of flight,
where optimal control to achieve maximum lift, is required.Furthermore, flying wings lack inherently good stability and control characteristics. Inthe absence of a tail, and therefore a moment arm, yaw control in flying wings must
be obtained by alternate means due to the lack of weathercock stability. Andalthough sweep, washout, tip-mounted fins or reflex airfoils can supplement the
generation of pitch stability, which tailless flying wings must generate themselves,these tend to reduce lift, thus eliminating the high L/D advantage that flying wings
possess.
Canards:
If a choice for a pusher arrangement of the Mars airplane is considered, adoption ofa canard layout may be convenient. This canard-pusher arrangement can be seen in
one of the two versions used by the Mini-Sniffer.One possible advantage of a canard layout for flight in Mars is that if the foreplane is
used as a lifting surface, it could enhance lift generation.Drawbacks associated with the canard configurations include the possible
degeneration of the wing lift distribution caused by the foreplane downwash.Undesirable stall behavior generally seen in canard layouts can prove critical in thinatmospheric conditions as those found on the Red Planet. It must be ensured, forinstance that a canard is sufficiently loaded while approaching stall speeds so thatthe canard stalls before the wing; this condition makes canard sizing highly critical.The location of the fuel tanks is another important characteristic to keep in mind inthe design process of canards. In this configuration, the center of gravity of the fuel
tank is generally located farther aft of the airplane c.g.; it then should be desirable tofind a suitable location for the fuel tanks so that a minimal c.g. travel occurs and
longitudinal stability is avoided.Another engineering concern related to the use of canards involves flap extensionduring critical phases of flight. For instance, the operation of large, powerful flaps
during missions in the red planet would create large pitching moments that may behard to balance by the foreplane.
Selection of the Overall Configuration
Based on the pros and cons that each of the previously analyzed configurationsoffer, and keeping in mind the maximum lift, minimum weight and drag constraints
imposed by the existing conditions, it is appropriate to adopt the conventionalconfiguration.
There are several reasons for this selection; first, airplanes with aft-tails areinherently stable, offering good controllability and stability during flight withoutresorting to feedback systems or other special design arrangements that may
compromise required aerodynamic and performance capabilities of the airplane. This
9

benefit may be especially important in the near vacuum of the planet, where controlsurface response may not be optimal.
Although the addition of weight related to an empennage is contrary to therequirement of weight minimalization, it could be lessened by adopting a simple twin-
boom tail, like that of the ARES or the second version of the Mini-Sniffer. Similarly,drag minimalization in the presence of a tail could be accomplished by minimizing
surface area, and thus, skin friction.Certainly, other important reasons for the adoption of a conventional configuration formissions in Mars are the result of the risks, costs and concerns associated with the
tailless and canard configurations previously covered.
3.1.1 Selection of the Propulsion System
Due to the challenges associated with thrust generation in Mars, where typical,air-breathing engines could not operate, the selection of the propulsion system
is, without a doubt, a highly critical aspect.In addition to the importance of choosing an engine with low operational risks,
and with the capacity to deliver the required power output, range and endurancedictated by the mission at hand, the weight of such powerplant is equally
important.For this purpose, electric, combustion and rocket propulsion systems now
considered are categorized based on individual weight, range, endurance andrisk of operation.
In order to quantify the behavior and performance of these three types ofpropulsion systems under similar flight conditions, a study on the development of
possible powerplant(s) for the ARES concept ,89 is now referenced. A trade-off
study involving weight, range, endurance and risk of operation for thesepropulsion systems is conducted at 1-hour, 2-hour and 4-hour flight durations
using powerplants with an individual mass of 63 Kg. installed in commonairframe.
At the conclusion of this section, a tabulated summary of the empirical data willbe used to highlight the benefits and disadvantages associated with each
individual propulsion system that could theoretically be adapted for Martianatmospheric flight.
3.1.1.1 Electric Propulsion
Because these systems require no propellant, some obvious advantages ofusing electric powerplants include the weight savings and lower risk of
operation associated with chemical propulsion. In addition, electrical systemsare highly efficient, with motor mass signifyingly lower than that of their jet,piston and rocket counterparts. However, power consumption, arcing and
10
cooling requirements are some of the challenges that must be carefullyaddressed if this type of propulsion is to be chosen to power a Mars airplane.
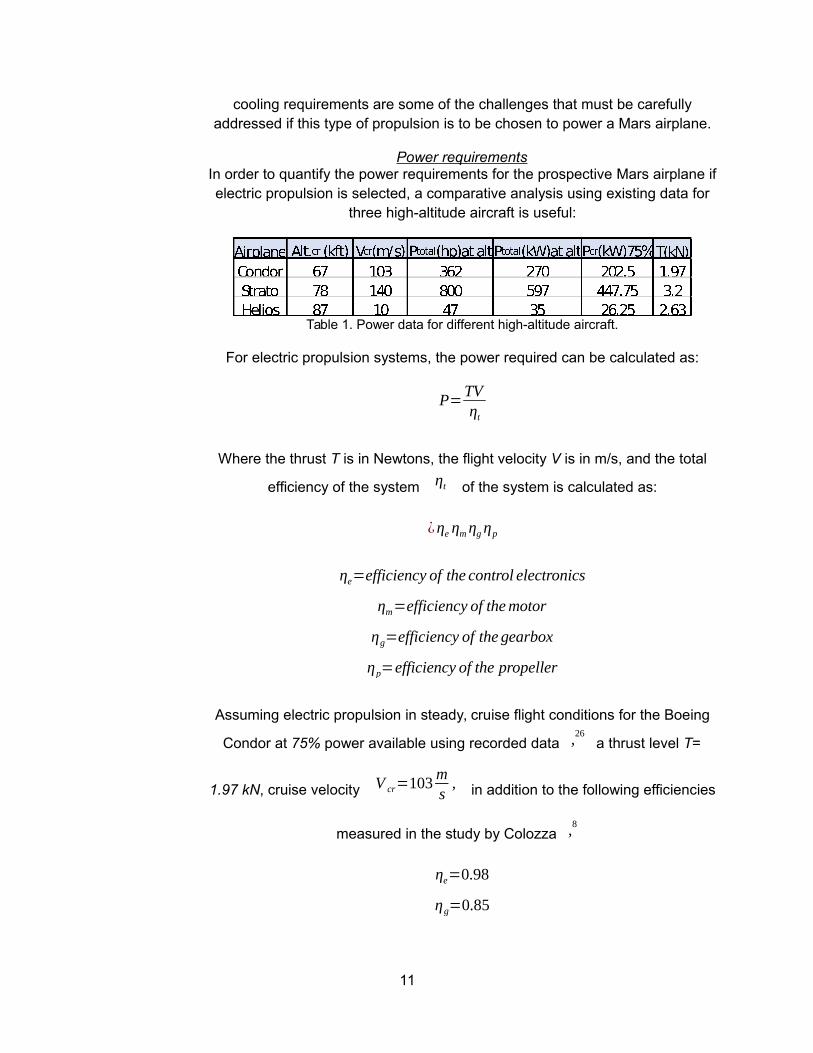
Power requirementsIn order to quantify the power requirements for the prospective Mars airplane ifelectric propulsion is selected, a comparative analysis using existing data for
three high-altitude aircraft is useful:
Table 1. Power data for different high-altitude aircraft.
For electric propulsion systems, the power required can be calculated as:
P=TVηt
Where the thrust T is in Newtons, the flight velocity V is in m/s, and the total
efficiency of the system ηt of the system is calculated as:
¿ηe ηmηgηp
ηe=efficiency of the control electronics
ηm=efficiency of themotor
ηg=efficiency of the gearbox
ηp=efficiency of the propeller
Assuming electric propulsion in steady, cruise flight conditions for the Boeing
Condor at 75% power available using recorded data ,26 a thrust level T=
1.97 kN, cruise velocity V cr=103ms, in addition to the following efficiencies
measured in the study by Colozza ,8
ηe=0.98
ηg=0.85
11

ηp=0.85
In addition, a measured motor efficiency for the EMRAX 268 ,25 a small but
powerful electric motor for powering electric airplanes
ηm=0.98
ηp=0.98∗0.98∗0.85∗0.85=0.694
Preq=TV cr
ηt
=
1.97kNx103ms
0.694=292 kW
This indicates that under the assume efficiencies and similar flight conditions,electric powerplants require 30.5% more power than internal combustion
engines.
Preq=TV cr=1.97kNx103ms=202.9 kW (Condor, cruise, piston engine)
Overall Powerplant MassModern electric motors like the EMRAX 268 especially designed for electric
aircraft offer excellent power-to-weight ratio P/W which makes them attractivefor light airplanes.
By once again referencing high-altitude airplanes like the Boeing Condor andthe Grob Strato (both piston, turbocharged powered airplanes), a comparativeanalysis between electric and internal combustion engines from a mass/weight
standpoint can be conducted:
Airplane Powerplant
Pout(kW)each
Wdry(kg)
P/W(kW/kg)
Condor
2xContinental TSOL-300-2turbocharged piston 136 121.5* 0.89
Strato
2xTeledyne ContinentalTSIO-550 turbocharged
piston 298 195.4 1.15Table 2. Powerplants for the Condor and Strato.
12

Published data for the EMRAX 268 motor shows a power-to-weight ratio,
PW
=11.6kWkg
superior than those for the Condor and Strato engines. However, thisadvantage would be reduced significantly once the EMRAX 268 is scale up toan appropriate size, in order to guarantee that there are not excessive bendingloads associated with the operation of large propellers with small motors (The
EMRAX 268 is 3.6 inches long and 10.6 inches in diameter, picture 6).
Picture 6. EMRAX 268 electric motor .25
Assuming a possible P/W = 2 kW/kg for a required larger version of this motor,and assuming the previously calculated power required for cruise flight for the
Condor, Preq=202. 9 kW, obtain
Wmotor=51kg( per engine)
which is approximately 58% less weight than that of the Condor’s ContinentalTSOL-300-2 piston engine (121.5 kg).
Electric arcingDue to the rarified, thin atmosphere of Mars composed mostly of CO2, arcing
from electrical motors can be a major concern. If an electric propulsion systemis necessary, it may be appropriate to select a brushless DC motor, which
although less efficient at higher power settings than brushed DC motors, areless prone to arcing.
13
Cooling RequirementsDepending on their particular thermal mass, an electric powerplant may require
a significant amount of convective cooling to prevent motor overheating. Thelack of sufficient natural cooling in the thin Martian atmosphere is therefore a
major disadvantage, and possible artificial solutions may impose otherchallenges.
For instance, structural or mechanical devices connected to the motor thatcould facilitate heat transfer to the airflow impose drag and weight penalties.Similarly, the possible addition of a liquid cooling system could add significant
weight to the system.
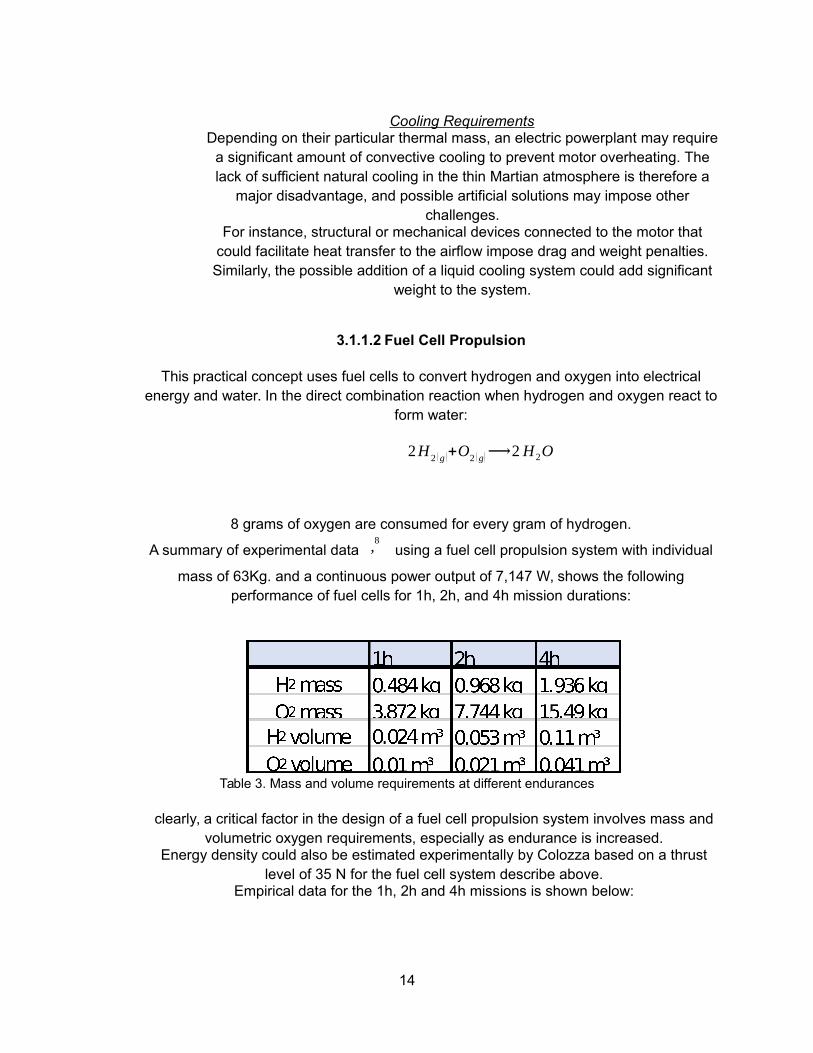
3.1.1.2 Fuel Cell Propulsion
This practical concept uses fuel cells to convert hydrogen and oxygen into electricalenergy and water. In the direct combination reaction when hydrogen and oxygen react to
form water:
2H 2 (g )+O2 (g)⟶2H2O
8 grams of oxygen are consumed for every gram of hydrogen.
A summary of experimental data ,8 using a fuel cell propulsion system with individual
mass of 63Kg. and a continuous power output of 7,147 W, shows the followingperformance of fuel cells for 1h, 2h, and 4h mission durations:
Table 3. Mass and volume requirements at different endurances
clearly, a critical factor in the design of a fuel cell propulsion system involves mass andvolumetric oxygen requirements, especially as endurance is increased.
Energy density could also be estimated experimentally by Colozza based on a thrustlevel of 35 N for the fuel cell system describe above.
Empirical data for the 1h, 2h and 4h missions is shown below:
14

Table 4. Total mass and specific energy for fuel cell.
this table shows that as the time of operation is doubled, the specific energy of thesystem is steadily increased. This is due to the fact that as the time duration is
increased, only the reactant masses and their respective storage tanks must increasein volume and mass, while those of other system components remain unchanged. This
makes fuel cell propulsion systems attractive for missions in Mars.
3.1.1.3 Battery Propulsion
Although weight savings associated with the use of electric motors can besignificant, as previously demonstrated, electric propulsion systems still don’t
adapt well to missions with extended range and endurance.Today, no battery with the capacity to fulfill the special requirements for
manned missions in Mars is available.Available Lithium-ion batteries (Li-ion) suitable for automotive and aviation
purposes offer an average specific energy of 0.36 – 0.875 MJ/kg compared to46.4MJ/kg and 42.8MJ/kg for gasoline and kerosene, respectively.
Furthermore, the energy density of Lithium polymer batteries is substantiallylower than those of gasoline and kerosene. These properties are summarized
below:
Table 5. Specific energy and energy density for different systems
These properties clearly demonstrate the mass and volumetric constrains thatare associated with readily available batteries.
One such example, the Solar Impulse, uses four 21 kWh lithium-ion batteries,each connected to an electric motor with an individual power output of 7.5 kW
(10 hp).Each one of this batteries weights 633 kg with reported energy densities of 243
Wh/kg (Solar Impulse I) and 260 Wh/kg (solar impulse II).Because the batteries of this airplane weight roughly a quarter of the airplane’s
overall weight, airplane weight and payload reduction are critical.However, the most critical design constrain of the Solar Impulse is the capacityof the Li-ion batteries to store the required charge for the motors to produce 6
kW of continuous power.
15

Unlike chemical powerplants which burn their propellant as operation timeprogresses, the mass of battery-based propulsion systems remains virtually
unchanged. This disadvantage would be especially detrimental for missions inMars, where the thin atmosphere could create challenges for heavier airplanes
while on the final approach and landing stages of flight.
3.1.1.4 Combustion Propulsion
Because the planet’s atmosphere is composed mainly on CO2 (95.97%) andjust 0.146% oxygen, special considerations must be given to the adaptation of
existing airbreathing propulsion systems. However, if the capabilities thatcombustion engines can offer are essential to achieve the required
performance as specified in the mission profile, then proper modifications toexisting airbreathing powerplants must be made.
3.1.1.5 Internal Combustion Engines
Probable fuels
The selection of an optimal fuel that can deliver the energy required by theengine is a critical aspect in the modification/design of a prospective
powerplant.There are, in addition, significant logistical concerns associated with the
selection of propellant. Because of the long transit times to Mars which makeconstant supply of fuel difficult, fuel storage with minimal degradation must be
addressed.Similarly, due to the extreme cold temperatures during both ground and flight
operation (in-situ temperature values recorded by the Viking I and II spacecraftrange between 1F° (-17.2 C°) and -161F° (-107 C°)) it must be ensured, in theabsence of a heating system, that the fuel has a freezing point low enough so
that it remains liquid. A tabulated summary of possible fuels is summarizednext:
Table 6. Properties of different fuels*at mission temperatures**at high concentrations
16

Probable oxidizersThe adaptation or conversion of available internal combustion engines for missionsin the Martian atmosphere includes the requirement of an oxidizing agent; this, in
turn, imposes additional weight penalties to the system.The following table addresses the adaptation of several oxidizers based on the
previously described temperature conditions on the surface of the planet.
Table 6. Properties of different oxidizers*at mission temperatures**NO 25% mixed
3.1.1.6 Piston Expander
This external combustion propulsion application involves the decompositionof fuel through catalytic reaction.
Although these engines have long been proven reliable in torpedo propulsion,their application to aircraft propulsion is still in experimental stages.
Nevertheless, studies show that their application to high-altitude propulsion ispromising, since it doesn’t require air to operate and can burn virtually any
mono/bi-propellant.A piston expander version used in torpedoes is propelled by hydroxyl
ammonium nitrate and diesel oil delivers high power density at low weight,including 0.9 to 1.2 kg/kW.
Because its SFC is quite high (2.7-4 kg/kW-h), it is more suitable, at thepresent state of technology, for short excursions at high altitudes.
In the 1970s, NASA’s mini-sniffer used a piston-expander Akkerman engineespecially designed to power the airplane at altitudes of up to 100,000 ft.
This engine was designed to produce 22 kW (30 hp) using hydrazinemonopropellant, with an SFC of 2.7 kg/kW-h. A modified version of this
airplane for special use in the Martian atmosphere was proposed, including asmaller Akkerman engine with the following reported characteristics:
Table 7. Data for the Akkerman engine*data taken from original version
Experimental results obtained by Colozza et al show the mass and volumerequirements for a piston expander engine based on a power requirement of
17
7142 W for 1h, 2h and 4h time durations. In this analysis, three differentmono/bipropellant combinations known to remain liquid during mission
temperatures are chosen:
Table 8. mass and volumetric requirements at different endurances.
Propellant mass and volume requirements for the hydrazine monopropellantand the hydrazine, nitrogen tetra-oxide bipropellant combinations are
proportional to mission time duration.
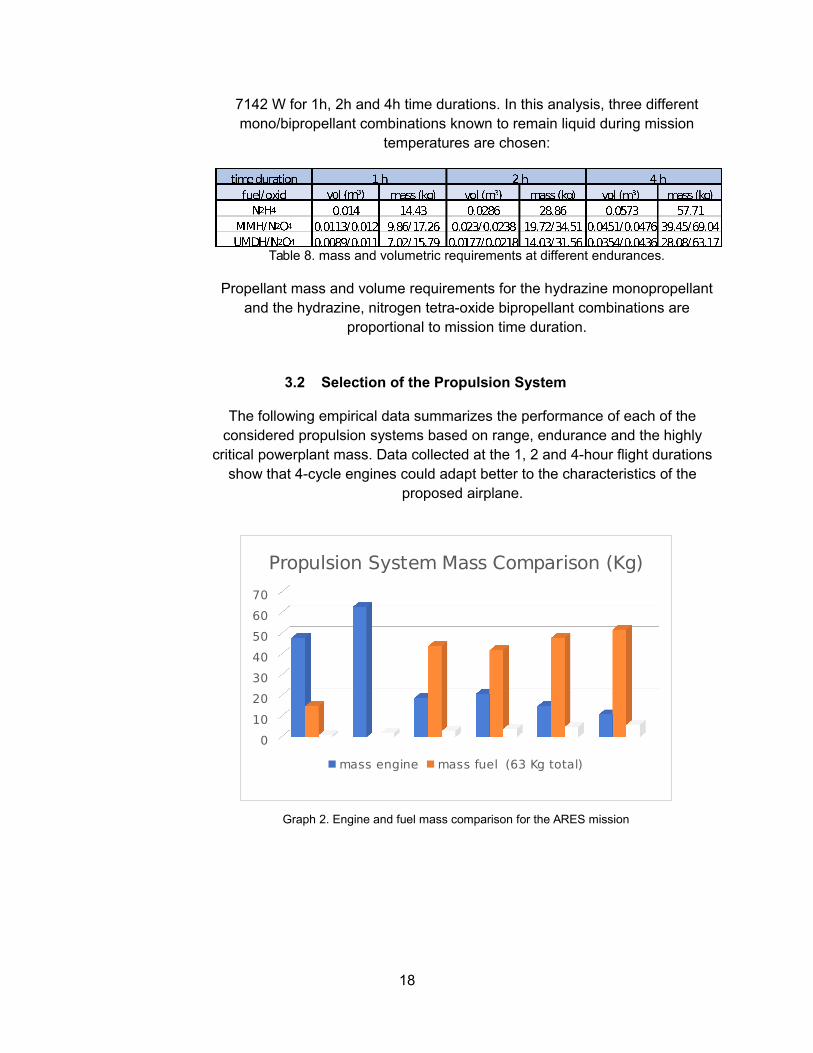
3.2 Selection of the Propulsion System
The following empirical data summarizes the performance of each of theconsidered propulsion systems based on range, endurance and the highly
critical powerplant mass. Data collected at the 1, 2 and 4-hour flight durationsshow that 4-cycle engines could adapt better to the characteristics of the
proposed airplane.
0
10
20
30
40
50
60
70
Propulsion System Mass Comparison (Kg)
mass engine mass fuel (63 Kg total)
Graph 2. Engine and fuel mass comparison for the ARES mission
18

0
200
400
600
800
1000
1200
1400
Range (mi)
Graph 3. Propulsion system vs. range for the ARES.
0
0.5
1
1.5
2
2.5
3
3.5
4
4.5
Endurance (hrs)
Graph 4. Propulsion system vs. endurance of the ARES
According to projections of these charts and based on weight constrains andrange and endurance requirements, the most advantageous propulsion systemsfor reconnaissance missions on Mars include the fuel cell, electric engine, and
the modified 4-cycle internal combustion engine.Based on performance, battery-based engines are the least desirable. Their
range capability, for instance, is the lowest of all, with an approximate maximumrange of just 126 miles under tested conditions. An important advantage of
battery-based propulsion system involves the lower operational risks due to itssimplicity in operation and design, including fewer mechanical parts than the
other systems.Rocket systems, on the other hand, are perhaps the obvious choice if superior
operational performance during short range and endurance missions is desired.Another advantage of rocket systems over the fuel cell and internal combustion
19

engines involves the considerable less design challenges and operational risksassociated with rocket engines.
These challenges and risks can become crucial if special propeller design andoperational constraints required in Mars-bound fuel cell and internal combustionpowerplants are considered. For example, the requirement to use larger, heavier
propeller(s), capable of producing the superior efficiency required in lowReynolds number, high subsonic Mach number conditions would be a concern if
fuel cell or 4-cycle internal combustion systems were preferred.As the collected data suggests, if range and endurance are critical, then a 4-
cycle internal combustion engine is the clear choice. Based on the experimentalresults and under the given conditions, 4-cycle internal combustion engines offer
as much as four times the range and endurance than mono and bi-propellantrocket engines and roughly twice the range and endurance than piston
expanders. It must be stressed, however, that this engine must be a modificationof typical air-breathing 4-cycle internal combustion engines, and that special
propellers must be designed in order to obtain the required efficiency at the givenatmospheric conditions. It has been estimated, for instance, that the power
transferred from a propeller to the airstream at altitudes of about 80,000 ft. on
Earth is about 30 times less than that at sea level .10
3.2.1 Selection of the Propeller
Propeller design is a complex field in which multiple physical and geometricalvariables must be carefully synchronized in order to efficiently transfer the power
produced by the engine to the airflow; that is, thrust production.Design of propellers that can be specifically adapted to low Reynolds number,high Mach number regimes, however, is a more arduous task involving more
complex engineering challenges.Although no particular studies for a unique “Martian propeller” has been
proposed, few projects involving high altitude propeller-driven flight have beenconducted.
On Earth, only a handful of propeller-driven airplanes, manned and unmanned,have been test flown in conditions that approximate those expected at Mars.
Boeing Condor:In 1989, the Boeing Condor set the world altitude record for a propeller-drivenaircraft, reaching an altitude of 67,028 ft. A remotely piloted reconnaissance
airplane, the Condor used two 16 ft., 3-bladed variable pitch propellers especiallydesigned by the Hartzell Propeller Company to efficiently operate through a very
wide range of atmospheric densities.
20
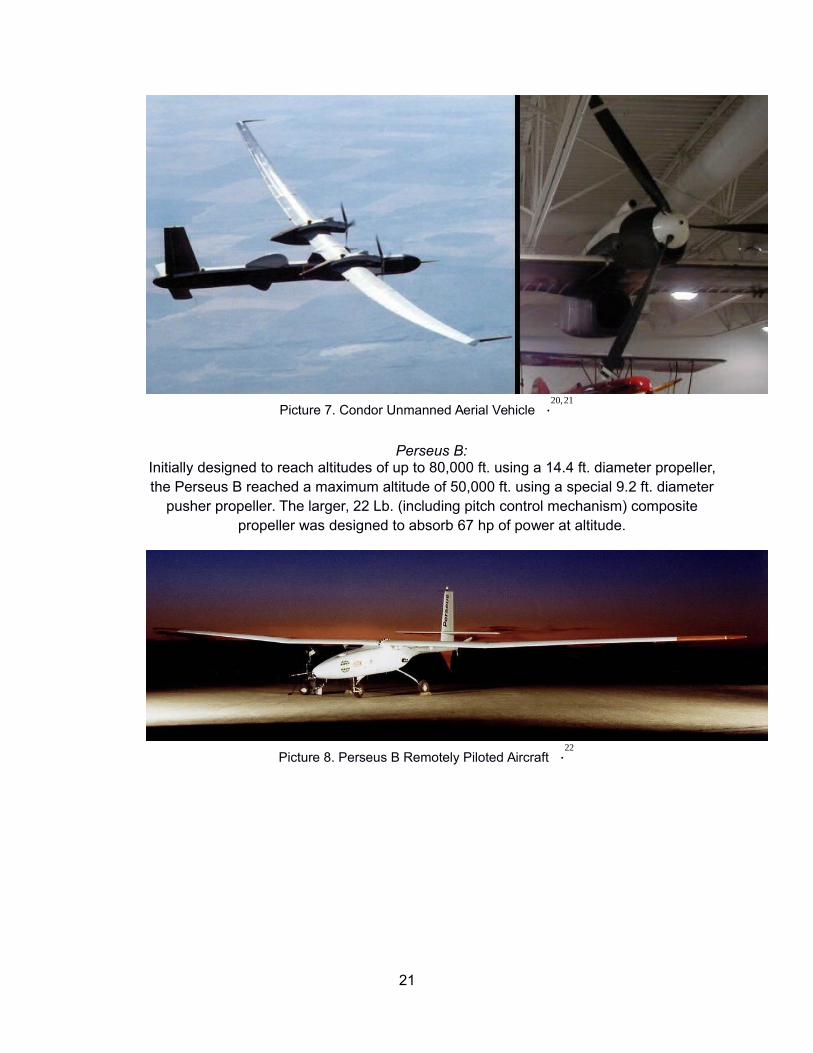
Picture 7. Condor Unmanned Aerial Vehicle .20,21
Perseus B:Initially designed to reach altitudes of up to 80,000 ft. using a 14.4 ft. diameter propeller,the Perseus B reached a maximum altitude of 50,000 ft. using a special 9.2 ft. diameter
pusher propeller. The larger, 22 Lb. (including pitch control mechanism) compositepropeller was designed to absorb 67 hp of power at altitude.
Picture 8. Perseus B Remotely Piloted Aircraft .22
21

Picture 9. Perseus B Medium Altitude Propeller .23
In 1995, the Grob Strato 2C, using two 5-bladed propellers set the high-altitude worldrecord (60,897 ft.) for a manned, piston-driven airplane. These variable pitch propellers,
with a diameter of 19.7 ft. were designed to absorb 400 hp from the engine.
22

Picture 10. Grob Strato 2C MT 6m Propellers .24
Design Approach:
Because a propeller’s capacity to transfer the engine shaft power to the airstream isdirectly proportional to air density, the effective thrust generated by the propeller
diminishes with altitude. The effects of this thrust deterioration are especially detrimentalat very high altitudes; at 80,000 ft., for instance, the power absorbed by the propeller
and transferred to the airstream is 1/30th that at sea level.The important relationship between the thrust generated and air density is evident in the
following equation:
T=c t ρn2d4
Where,c t=coefficient of thrust
ρ=air density
n=propeller revolutions
d=propeller diameter
23

Aside from geometrical parameters of a propeller such as airfoil and twist, two importantaspects that influence the performance of a propeller are RPM and diameter.
The operational RPM limit of a propeller at any altitude, for example, is restricted byMach number at the propeller’s tip. Ordinarily, manufacturers place this limit at 0.75; this
is to ensure that no effects associated with the onset of supersonic flow at the tipadversely affect the performance of the propeller, or even destroy it.
Graph 5. Variation in Maximum RPM with Diameter for various flight Mach numbers. Data for an
altitude of 80,000 ft .8
As the graph indicates, increasing the diameter of the propeller decreases the requiredpropeller RPM, which in turn decreases airstream velocity along the span of the
propeller blade.
3.2.2 Selection of the Landing Gear
The requirement to operate large propellers imposes clearance restrictionsbetween the propeller and the ground, imposing constrains for the design and
disposition of the landing gear.Based on available landing gear arrangements, the bicycle and tricycle
configurations are arguably the most convenient for potential operations in theRed Planet due to their improved propeller ground clearance. The dusty, rocky soilconstitution of the Martian soil may create structural and/or catastrophic damageto propeller blades if no proper precaution is taken in the design of the landing
gear.Due to the drag and weight constrains previously mentioned, it becomes
necessary to produce a landing gear that is retractable yet light.
24

4. Mission Weight Estimates
Estimation of the take-off gross weight W ¿ , the empty weight W E and the mission
fuel weight W F included in this section is conducted using the methodology
recommended by Roskam .11
In addition, the calculation of these weights is obtained using documented statistical andempirical data corresponding to propeller-driven aircraft under Earth conditions.
Educated guess of take-off weight:
Estimation of the take-off weight, based on extrapolation of existing data correspondingto aircraft with similar mission profiles or operational characteristics is a challenge, since
no manned concepts have been proposed, and very limited data for unmanned Marsairplanes exists or is available.
For the sake of estimation, take-off weight will be approximated by referencing existingpropeller-driven airplanes which designs depended primarily on weight and drag
minimalization.With an estimated L/D = 25, the Rutan Voyager set the flight endurance record in 1986
using a 939 Lb. airframe made of fiberglass, Kevlar and carbon fiber .12 Despite
having an empty weight of 2,250 Lb. (1,020.6 Kg.), it weighted 9,694.5 Lbs. at take-offdue to the large amount of fuel needed to complete its long-endurance mission.
Although the Voyager had a different mission profile than that described in this report, itcan nonetheless serve as a basis for the present weight estimation.Pertinent data for other high-altitude airplanes is summarized below.
Table 9. Operational characteristics of different high-altitude airplanes
Assuming an airframe 15% heavier than the Voyager’s in order to compensate for aprospective larger wing surface area,
W struct = 939 Lbs. + (939 x 0.1) = 1,032 Lbs. *weight as measured on Earth
Preliminary estimation for powerplant weight assumes two engines with a power output
of 175 HP (each), similar to those used by the Condor .13
W eng=268Lbs each(dry )
25

in addition, two three-bladed composite propellers with an assumed individual weight of100 Lbs.,
W pwr = W eng + W ¿ = 536 Lbs. + 200 Lbs. = 736 Lbs.
According to Torenbeek ,14 (Appendix A), data for short-haul piston airplanes shows
typical weight fractions of 16% MTOW for fixed equipment and 30% for airframes.
Based on the assumed W struct = 1,080 Lbs. calculated above, it is reasonable to
assume W feq = 576 Lbs.
W E=W struct+W pwr+W feq
W E = 1,032 + 736 + 576 = 2,345 Lbs.
Analysis of the empty and take-off weights indicates ratios W ¿
W E of 2 and 2.5 for the
Strato and Condor, respectively. These airplanes, however, were designed for longendurance missions (the Condor carried large amounts of fuel for long endurance missions of
up to 80 hours)
assuming W ¿
W E = 1.5,
W ¿guess = 1.5 x W E = 3,518 Lbs
Calculation of maximum take-off weight based on fuel fractions:
Propeller efficiency:
The efficiency of a propeller is affected by both the propeller’s diameter as well asnumber of blades. For instance, increasing diameter increases the propeller’s efficiency,
while adding more blades decreases it. However, adding more blades also increasesthrust, which is one of the critical factors to keep in mind for the design of the Mars
airplane. Based on these characteristics and on the analysis provided in section 3.1.3, a
26
2.8 m (110 in) diameter, three-bladed propeller with efficiency of 0.83 seems reasonable
.10
Specific fuel consumption:
Due to its adaptivity to the atmospheric characteristics of Mars, it was previouslydecided to use a piston expander engine propelled by the UDMH, N2O4 combination.
Because data for the specific fuel consumption of this systems is not available,
c p = 0.8 lbs
HP−hr will be assumed for calculation purposes. This agrees with
statistical data for piston twin engine airplanes.
Lift to drag ratio: (at cruise)
The aerodynamic forces L and D are directly proportional to the density of the fluidflowing around the airfoil. Due to Mars low atmospheric density (100 times lower than
Earth’s at the reference altitude), obtaining a convenient lift-to-drag ratio, even at the lowcruising altitude described in the mission profile becomes critical. High-performance,
high-aspect ratio aircraft like the Lockheed Martin U-2, can generate a L/D = 25.616,
while slower, high-altitude flying wings like the Pathfinder-Plus have a reported glide
ratio of 21:1 (power off) .17 Based on the expectation that a high aspect ratio wing will
be required to fulfill the mission at hand, a lift-to-drag ration L/D = 40 will therefore beassumed in the preliminary calculations. This value agrees with a reported L/D = 40 for
the Boeing Condor during cruise conditions.
Payload weight:
Taking as reference the standard weight for military crews of 200 Lbs. per person(including extra gear carried), a weight of 400 Lbs. corresponding to two crewmen willbe assumed. In addition, a 120 Lb. payload consisting of a high-resolution camera and
survival equipment is considered.Therefore, a payload weight of 520 Lbs. will be used in the calculations.
W payload = 520 Lbs. (*weight as measured on Earth)
M f ¿ = 0.005
ηp (cr) = 0.83
c p (cr) = 0.8 lbs
HP−hr .
27

L/D (cr) = 40
R = 1,500 s.m.
Estimation of the take-off gross weight W ¿
W ¿=WOE+W F+W PL
WOE , the operating weight empty, is calculated as:
WOE=WE+W tfo+W crew
where the weight of trapped fuel and oil W tfo can be approximated as 0.5% the take-
off weight,
W tfo=0.005W ¿
Estimation of the mission fuel weight W F
W F=W F used+W F res
Where,
W Fused = (1 - M ff ) W ¿ and M ff = W 1
W ¿ π
W i+1
Wi i=1
i=7
W Fres = 0.25 W Fused
M ff calculation based on typical fuel weight fractions for twin-engine aircraft .11
I) Engine start and warm-up
( W 1 / W ¿ ) = 0.992
II) Taxi
28

( W 2 / W 1 ) = 0.996
III) Takeoff
( W 3 / W 2 ) = 0.996
IV) Climb
( W 4 / W 3 ) = 0.990
V) Cruise
( W 5 / W 4 ) Rcr = 375(ηp
c p)cr(
LD )crLn(
W 4W 5 ) (*for propeller-driven
aircraft)
1,500 = 375(0.830.8 )(40)Ln(
W 4W 5 )
W 5W 4 = 0.908
VI) Descend
( W 6 / W 5 ) = 0.992
VII) Landing, taxi
( W 7 / W 6 ) = 0.992
29

Mff=¿ W 1
W ¿ x
W 2
W 1 x
W 3
W 2 x
W 4
W 3 x
W 5
W 4 x
W 6
W 5 x
W 7
W 6
= 0.992 x 0.996 x 0.996 x 0.990 x 0.908 x 0.992 x 0.992 = 0.8706
Estimation of the empty weight W E
W E=inv . log10[log10W ¿−A
B]
Where the values for the regression coefficients A and B correspond to those of twin
engine, propeller-driven composite aircraft .10
A=1130, B=1.0403
The tentative empty weight W Etent is calculated as:
W Etent=W OEtent
−W tfo−W crew
where WOEtent=W ¿guess
−W F−W PL
WTO
(Lbs)WFused
(Lbs) WF (Lbs)WOEtent
(Lbs)WEtent
(Lbs)WE
(Lbs)%WE-WEtent
3300 426.95 533.69 2246.31 1829.811877.5
42.57
3325 430.18 537.73 2267.27 1850.641891.2
12.17
3350 433.42 541.77 2288.23 1871.481904.8
71.77
3375 436.65 545.82 2309.18 1892.311918.5
41.38
3400 439.89 549.86 2330.14 1913.141932.2
00.99
3425 443.12 553.90 2351.10 1933.971945.8
50.61
3450 446.36 557.95 2372.05 1954.801959.5
00.24
3475 449.59 561.99 2393.01 1975.641973.1
5-0.13
3500 452.83 566.03 2413.97 1996.471986.7
9-0.49
3525 456.06 570.08 2434.92 2017.302000.4
3-0.84
30

3550 459.30 574.12 2455.88 2038.132014.0
7-1.19
3575 462.53 578.16 2476.84 2058.962027.7
0-1.53
3600 465.76 582.21 2497.79 2079.792041.3
3-1.87
Table 10. Determination of weights
The take-off weight of the airplane can be obtained once the empty weight of the aircraftand its tentative value are within 0.5%,
W ¿=3,450 Lbs .(weight asmeasured on Earth)
this weight is within 2% of the gross take-off weight previously estimated,W ¿guess
=3,518 Lbs .
5. Performance Constraint Analysis
The sizing of the aircraft will depend on the following stall, take-off distance, landingdistance, cruise velocity and climb requirements.
5.1 Stall Speed
ρ(0 ft) = 0.02 Kg
m3 = 3.88064x 10⁻⁵
slugs
ft3
CLmax=1.4
CLmaxL = 1.8
V s0 ≤ 95 Kts ≈ 160 fts (engine idle, flaps extended)
V s1 ≤ 110 Kts ≈ 186 fts (engine idle, flaps retracted)
Stall requirements must be met at take-off gross weight W ¿
Wing loading:
31

WS
< ρ∞V s2 CLmax
2
Clean configuration
WS
<3.88064 x 10⁻⁵ slugs
ft3∗1862
fts∗1.4
2
WS
<0.94 Lb
ft2
Landing configuration:
WS
<3.88064 x 10⁻⁵ slugs
ft3∗1602
fts∗1.8
2
WS
<0.9Lb
ft2
Therefore, to fulfill both requirements,
WS¿¿¿
< 0.9 Lb
ft2
5.2 Take-off Distance
Requirements
STOG = 1,700 ft.
¿S¿=1.66STOG=1.66∗1,700=2,822 ft .
where S¿ and STOG are defined in table 6, appendix A
The following equation relates the take-off ground run (STOG) to the maximum take-
off lift coefficient ( CLmax ¿ ) and the take-off power loading of the airplane (W /P¿¿¿
.
32

TOP23=
WS ¿
WP ¿
σ CLmax ¿
the density ratio σ is calculated as:
σ = ρ(95,144 ft)
ρ(msl) = 0.01724
TOP23 , the take-off parameter for FAR23 propeller-driven airplanes, can be calculated
from the following relation using the quadratic formula as:
STOG=4.9TOP23+0.009TOP232
TOP23=−4.9±√4.92
−4∗0.009∗(−1700)
2∗0.009=240.76∧−785
TOP23=¿ 240.76
This leads to the following sizing of the airplane based on take-off distancerequirements:
33

0.000.100.200.300.400.500.600.700.800.901.000
20
40
60
80
100
120
140
160
Takeoff distance
(CLmax)TO=1.2 (CLmax)TO=1.4 (CLmax)TO=1.6
(CLmax)TO=1.8 (CLmax)TO=2.0
(W/S)TO PSF
(W/P)TO Lbs/HP
5.3 Landing Distance
The total landing distance SL is related to the landing ground run SLG in the
following equation:
SL=1.938 SLG where SL and SLG are defined in table 7, appendix A.
Similarly, statistical data obtained from propeller-driven, FAR23 airplanes suggest
the following relation between SLG and the stall velocity of the airplane in the
landing configuration, V SL :
SLG=0.265V SL2
By combining these two equations, a relation between V SL and SL can be
obtained:
SL=0.5136V SL2
34

where V SL2=√ 2
WS
ρCLmax
from this equation relating velocity, lift and wing loading of the airplane, the followingrelations using three possible lift coefficients for the landing configuration are given:
CLmaxL
(W/S)TO
1.40.6848
5
1.60.7826
86
1.80.8805
22
It must be clarified that these results are based on a hypothetical runway 4,000 ftlong.
5.4 Speed Constraints
Cruise speed sizing
Requirements:
V cr=300mph (this corresponds to M=0.55 in the low Reynolds number
atmosphere of Mars)
hcr=95,144 ft
σ=0.01724
The power index I p can be calculated as:
I p=3√
WS
σWP
where I p∝V cr
35

WS¿¿¿¿¿
(WP
)¿
=¿
5.5 Drag Polar Estimation
For low speed, subsonic airplanes, the drag coefficient can be estimated as:
CD=CDo+C L
2
πAe
Where the zero-lift drag coefficient CDo can be obtained using the method by
Lofting27 using speed and power data:
V=77.33√
ηpWS
σC DWP
36

Which can be rewritten using the equation for Ip as:
I pV
¿3
CD=77.3³ηp¿
Where I p=1.8( for V cr=300mph, cantilever wing , retractable landing gear )
Assuming ηp=0.85 ( cruise flight ) and CDo=0.9CD , obtain:
1.8300
¿3
I pV
¿3=1.114∗105
¿
CDo=1.114∗105
¿
CDo=¿ 0.024
Calculation of the drag coefficient for the clean, take-off and landing configurations:
CD=CDo+C L
2
πAe
CDo=0.024
A=37
The following statistical values for ΔCD0 and e can be used to calculate the drag
polars of the airplane for the clean, take-off and landing configurations with landinggear extended/retracted:
clean ΔCDo 0
e 0.85
TO flaps ΔCDo 0.015
e 0.8
LND flaps ΔCDo 0.065
e 0.75
37

Land. Gear ΔCDo 0.02Table 11. Statistical values for ΔCDo and e for diferent flap settings
clean configuration: CD=0.024+0.01012CL2
take-off (gear up): CD=0.039+0.01075CL2
take-off (gear down): CD=0.059+0.01075CL2
landing (gear up): CD=0.089+0.01147CL2
landing (gear down): CD=0.109+0.01147CL2
-3 -2 -1 0 1 2 30
0.02
0.04
0.06
0.08
0.1
0.12
0.14
0.16
0.18
0.2
Drag Polars
clean take-of, gear up
take-of, gear down landing, gear up
landing, gear down
CL
CD
Graph 6. Drag polars
5.6 Climb Constraints
Sizing of the airplane to rate-of climb requirements follows the methodology by Loftin.In this analysis, a desired climb rate of 200 fpm will be considered
Requirements
all engines operative (AEO)gear up, take-off flaps
maximum continuous power on all enginesRC≥200 fpm
38
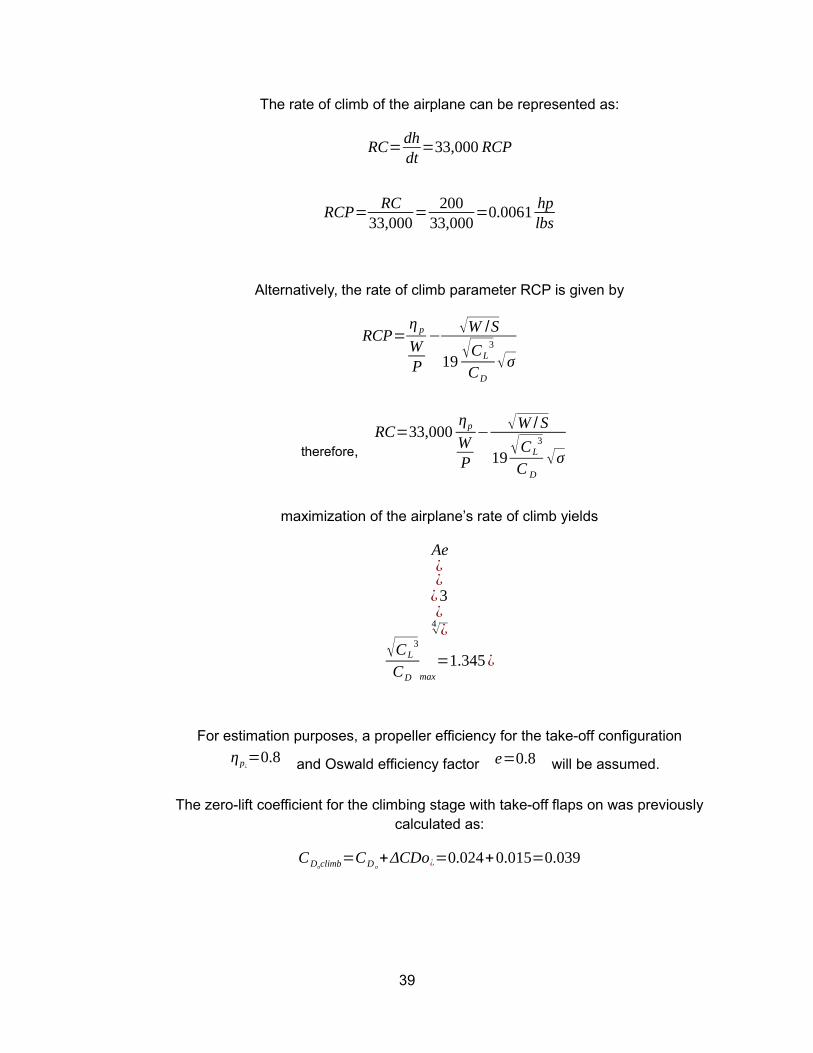
The rate of climb of the airplane can be represented as:
RC=dhdt
=33,000 RCP
RCP=RC
33,000=
20033,000
=0.0061hplbs
Alternatively, the rate of climb parameter RCP is given by
RCP=η p
WP
−√W /S
19√CL
3
CD
√σ
therefore, RC=33,000
ηp
WP
−√W / S
19√CL
3
C D
√σ
maximization of the airplane’s rate of climb yields
Ae¿¿¿3¿
4√¿
√CL3
CD max
=1.345 ¿
For estimation purposes, a propeller efficiency for the take-off configuration
ηp¿=0.8 and Oswald efficiency factor e=0.8 will be assumed.
The zero-lift coefficient for the climbing stage with take-off flaps on was previouslycalculated as:
CDoclimb=CD o
+ΔCDo¿=0.024+0.015=0.039
39

Ae¿¿¿3¿
37∗0.8¿¿¿3¿¿
4√¿
√CL3
CD max
=1.345¿
by replacing this value into RCP, it is possible to represent the rate-of-climb (in fpm) ofthe airplane as a function of wing loading, power loading, propeller efficiency, density,
as well as lift and drag coefficient.
Graph 7. Rate of climb requirements
5.7 Matching Plot
40

Graph 8. Matching plot.
Design point:
(WS
)¿
=0.90Lb
ft2(WP
)¿
=6.98LbHP
6. Configuration of the Propulsion System
The power output needed to satisfy the stall, take-off distance, landing distance, cruisevelocity and climb requirements is the result of the power loading.
6.1 Engine
The power required per engine can be approximated from the power loading
(WP
)¿
=6.98LbHp
where the gross take-off weight MTOW was previously calculated as:
41

W ¿=3,450 lbs (weight asmeasured on Earth)
Correcting MTOW for Mars gravity yields:
W ¿=3,450∗0.377=1,300 Lbs(weight asmeasured onMars)
therefore, the powerplant power output required at take-off is:
P¿=W ¿
7.3=
1,300 Lbs
6.98LbHP
=186hp
P¿=180hp=139 kW
Peng=93hp=70kW
6.2 Propellers
Propeller diameter
D p=√ 4 Pmax
nbl π Pbl
where Pbl is the propeller power loading per blade. Typical values are in the order
of 1 −4hp
ft2 (single and twin engines) at sea level.
High-altitude propeller design has shown that for a given rpm setting at an altitude of80,000 ft, the power absorbed by the propeller and transferred to the airstream is1/30th that at sea level. Assuming a proportional decrease in both the disk loading
and blade loading of the propeller, possible Pbl values at the projected low
Reynolds number are now used to estimate prospective propeller diameters:
number of blades :nbl=3
Pmax=93hp
42

Table 12. Propeller diameter vs. blade load.
In order to maximize the propeller’s thrust generation, it is desirable to maximize the
propeller diameter. Assuming Pbl=0.15 , a propeller of diameter 16 ft is optimal.
CAD drawing 1. Propeller sizing
7. Fuselage Design
The dimensions and layout of the fuselage obey volumetric and visibility requirements.In addition to the payload, which includes a low-altitude camera and a cargo of survivalequipment, the cabin must be capable of carrying two crewmembers comfortably in a
tandem seating arrangement.
43

Visibility requirements
Due to the operational nature of the airplane as described in the mission profile, goodvisibility is essential. Typical vertical inclination visibility as measured from the axis of
vision require 15° down and 20° up of visibility.The following fuselage is designed satisfy volumetric and visibility requirements:
Graph 9. Fuselage dimensions.
44

CAD drawing 2. Fuselage layout and payload arrangement.
A: low-altitude cameraB: 5.8 ft tall pilot
C: nose wheel wellD: cargo
CAD drawing 3. Cockpit visibility
45

CAD drawing 4. Complete fuselage design.
8. Wing Sizing
Because of the required clearance between the propeller and the ground, a high wingconfiguration is convenient. Due to the projected high aspect ratio, a strutted or braced
wing can be considered.
WS¿¿¿
W ¿=1,300 lbs
SW=1,445 ft ²
A=37 (assumed )
b=√Sw A ¿√1,445∗37=231 ft
This wing span clearly indicates that a structure that can support the weight of the wingis necessary. Two possibilities for this structural support will be considered in the final
design of the wing; a strut connecting the wing to the fuselage, or a vertical strutmounted near the wing tip.
46

Assuming a taper ratio λ=0.4, and a root cord length cr=8.4 ft which fits the
dimensions of the fuselage, obtain,
λ=c tcr ⟶ c t=λ cr=0.4∗8.4=3.36
knowing c t ;cr∧ λ , mean aerodynamic chord is determined as:
MAC=23cr
1+λ+λ ²1+ λ ¿
23∗8.4
1+0.4+0.42
1+0.4=6.25 ft
Λ¿/TE=tan−1
12(cr−ct)
b2
¿ tan−1
12(8.4−3.36)
2312
=±1.25
Λ c4
=tan−1
14(cr−c t)
b2
¿ tan−1
14
(8.4−3.36)
2312
=0.63 °
The required lift coefficient for cruise flight at the expected velocity, weight and airdensity conditions can be estimated as:
CLcr=W ¿−0.4W F
q SW
¿1,300−0.4 (5.73)
12∗0.0000388∗440∗1,445
=0.19
this corresponds to a cruise velocity of 260 knots = 440 ft/s (IAS and TAS) or M=0.55near the surface of Mars.
Selection of the airfoil
The lift and drag properties of several airfoils were analyzed. Due to the low density, lowReynolds number and high Mach number characteristics of Mars, it is critical to haveaccess to an airfoil capable of generating a sufficient high lift coefficient with minimal
drag.High-altitude airfoils like the Douglas Liebeck LNV109a and the Apex-16. specially
designed for low Reynolds were tested using Xfoil.
Airfoil analysis
47

Aerodynamic results for the LNV109a, Apex-16, and NACA 4415 airfoils aresummarized next. The initial conditions given for the numerical analyses include:
ρ=0.0000388slugs
ft 3
ν=0.011698ft2
s(kinematic viscosity)
l=6.25 ft (MAC)
V s1=186
fts(stall velocity∈the cleanconfiguration)
stall velocity∈thelandingconfiguration
V s0=160
fts
¿ )
flaphing location=0.8c
ℜ=ρvlμ
=vlν
ℜclean=186∗6.250.011698
=99,200
ℜLanding=160∗6.250.011698
=85,700
Douglas Liebeck109a (LNV109a)
LNV109a in the clean configuration. ( V s1,M=0.23,ℜ=99,200, poweroff ¿
α=0° α=5°
48

α=10° α=15°
Simulation for the clean configuration indicates a complete stall of the airfoil at the givenconditions, even at the low angle of attack (α = 0°) as seen by the airflow separation
near the leading edge.
LNV109a in landing configuration. ( V s0, M=0.2,ℜ=86,700, poweroff ¿
flap setting 5° flap setting 10°
Using a 5° flap setting, the simulation shows a similar flow separation with a minor gain
in lift coefficient CL than the clean configuration at the same angle of attack α=0°.
Further flap deployment indicates no flow reattachment and complete aerodynamic stall.
Apex-16
Apex-16 in the clean configuration. ( V s1,M=0.23,ℜ=99,200, power off ¿
49

α=0° α=5°
α=10° α=12°
Aerodynamic analysis of this airfoil with flaps retracted and an angle of attack α=0°show a progressive boundary layer separation until stall occurs at approximately α=12°.
The maximum lift coefficient generated by the Apex-16 under the given conditions is
CLmax≈1.19 .
50

Apex-18 in landing configuration. ( V s0, M=0.2,ℜ=86,700, poweroff ¿
flap setting =10° flap setting =20°
Flap setting = 25° Flap setting = 30°
Xfoil’s prediction for the Apex-16 airfoil at the given conditions shows a maximum lift
coefficient CLmax≈0.3 . This indicates that the airfoil has an adverse reaction to flap
inputs at the given Reynolds number.
NACA 4415
NACA 4415 in the clean configuration. ( V s1,M=0.23,ℜ=99,200, poweroff ¿
51

α=0° α=5°
α=10° α=15°
Predictions for the NACA 4415 in the clean configuration indicate better aerodynamiccharacteristics than both the LNV109a and the Apex-16 in response to the challengingconditions. Due to the characteristic shape of this airfoil, there is more a gradual airflow
52

separation at both the top and bottom surfaces of the airfoil. The maximum lift coefficientobtained is ≈1.44 at about α = 12°.
NACA 4415 in landing configuration. ( V s0, M=0.2,ℜ=86,700, poweroff ¿
flap setting = 5° flap setting = 10°
flap setting = 20° flap setting = 30°
Although the coefficient of lift generated by the NACA 4415 is enhanced by the input of
flaps, reaching substantial higher CLmax than both the LNV109a and Apex-16 airfoils,
it doesn’t reach the required value of CLmax=1.8 previously considered in the
calculation, which corresponds to an input in angle of attack α = 0°.
Optimization of the NACA 4415:
Increased values of CLmax can be generated by changing the flap hinge location. For
instance, using a flap setting of 40°, a CLmax=1.37 could be generated using the
reference angle of attack α = 0° at a hinge location of 60% chord (0.6c) as shown below:
53
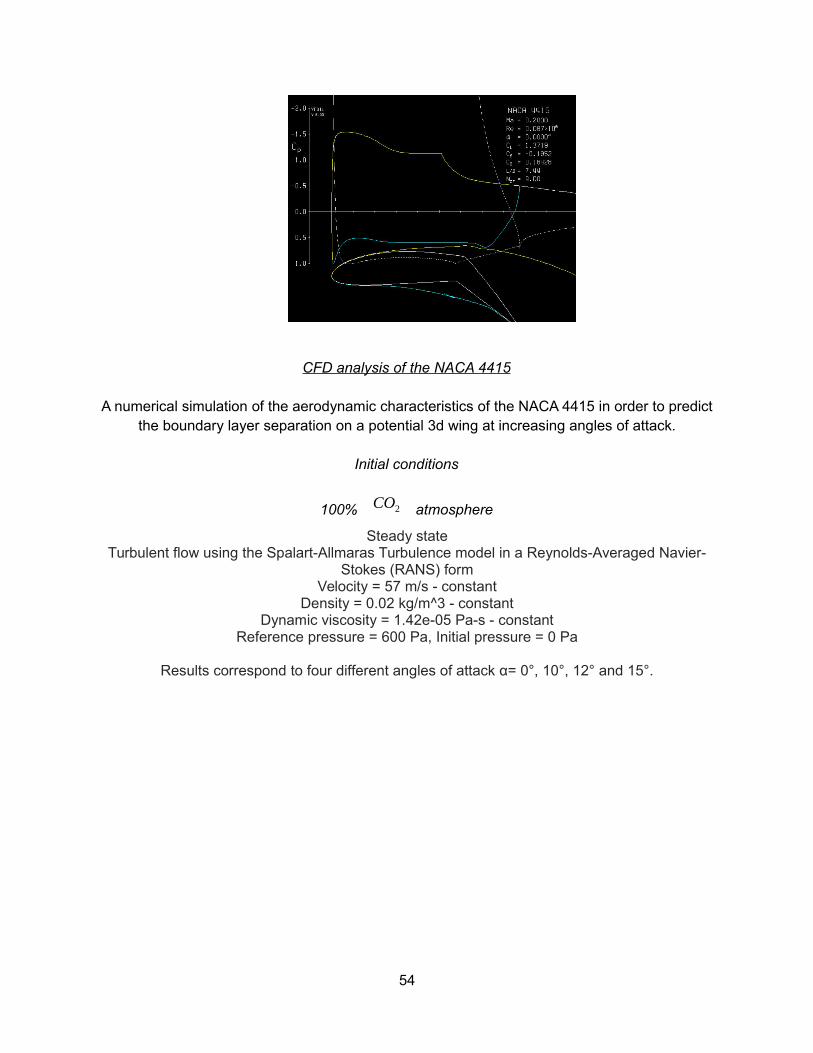
CFD analysis of the NACA 4415
A numerical simulation of the aerodynamic characteristics of the NACA 4415 in order to predictthe boundary layer separation on a potential 3d wing at increasing angles of attack.
Initial conditions
100% CO2 atmosphere
Steady stateTurbulent flow using the Spalart-Allmaras Turbulence model in a Reynolds-Averaged Navier-
Stokes (RANS) formVelocity = 57 m/s - constant
Density = 0.02 kg/m^3 - constantDynamic viscosity = 1.42e-05 Pa-s - constant
Reference pressure = 600 Pa, Initial pressure = 0 Pa
Results correspond to four different angles of attack α= 0°, 10°, 12° and 15°.
54

α = 0°
α = 5°
55

α = 12°
α = 15°
56

This trend in the separation of the boundary layer as α is increased agrees with the resultsobtained for the 2D airfoil. The CFD simulation shows how the NACA 4415 responds to angle of
attack input at the given flight conditions, with total separation occurring at about α=10°-12°,which agrees with the results obtained for the 2d airfoil using Xfoil.
Similar correspondence for the lift coefficients obtained for the 3D wing and 2D airfoil can be
seen, with a CLmax ≈ 1.6 for the 3D wing
Wing planform
Based on the required geometrical characteristics of the wing, in addition to the airfoil, thefollowing wing planform is designed:
57

CAD drawing 5. Wing dimensions
CAD drawing 6. 3D wing
9. Design of the High-Lift Devices
Based on the previous numerical estimation for the aerodynamic performance of theNACA 4415 for the clean and flapped configurations, the following lift coefficients can be
considered:
CLmax=1.45
CLmax ¿
=1.6
CLmaxL
=1.8
It is necessary to verify, however, that the wing planform just designed can generate a
three-dimensional lift coefficient that is consistent with the CLmax value generated by
the NACA 4415 airfoil.
CLmaxw
=1.05CLmax (for long−couple airplaneswithlhc>5.0)
CLmaxw
=1.05∗1.45=1.5225
Correcting for the effect of sweep angle (Λ) on the 3-D wing, obtain,
CLmaxw¿unswept=
CLmaxw¿swept
cos Λ c/ 4 ¿
1.52cos (0.625° )
=1.5226
To verify that the wing can generate this value,
58

CLmaxw
=k λ
CLmaxr+CLmaxt
2 where k λ=0.95 for λ=0.4
CLmaxr+C Lmaxt
=2∗1.50.95
=3.1
This is the required CLmaxw that must be generated by the root and tip airfoils combined.
Assuming the use of NACA 4415 airfoils at both the root and the tip,
ℜr=ρV cr
μ=
3.88∗10−5∗8.4
1.53∗10−4 =201,000
ℜt=ρV c t
μ=
3.88∗10−5∗3.36
1.53∗10−4 =80,200
Using Xfoil, maximum lift coefficients can be obtained for both airfoils at their respectiveReynolds numbers,
CLmaxr=1.47
CLmaxt=1.44
Therefore, CLmaxr+C Lmaxt
=1.47+1.44=2.91
This is about 6% of the required CLmaxr+C Lmaxt
=3.1 .
It is recommended that the difference between these values be within 5%, otherwiseredesign of the wing planform must be perform.
Determination of required incremental lift coefficient to be generated by the flaps can beobtained as:
ΔC Lmax ¿
=1.05(CLmax¿−CLmax
) ¿1.05∗(1.6−1.45 )=0.16
ΔC LmaxL
=1.05(CLmaxL
−C Lmax) ¿1.05∗(1.8−1.45 )=0.37
The required section lift coefficient with flaps down can be calculated as:
59

ΔcLmax=
ΔC Lmax
Sw
Swfk Λ
where Swf is the flapped wingarea
k Λ=
1−0.08 co s2 Λ c4
co s( 34 )
(Λ c4
)
=1−0.08 cos20.62
cos( 34 )
(0.62)
=0.92
Assuming arbitrary ratios of wing area to flapped wing area, the following relation isestablished:
Table 13. Δc Lmax requirements for different ratios Swf /Sw .
The required ΔC L that the flaps must generate for both take-off and landing
requirements can be computed as follows:
for estimation purposes, the following flap geometry can be assumed:
Z fh
c=0.1
c fc
=0.25
δ f ¿=15 °
δ f L=45°
c 'c
=1+2Z fh
ctan (
δ f
2)
For take-off:
c 'c
=1+2Z fh
ctan( δ f ¿
2 )=1+2∗0.1 tan( 15 °2 )=1.03
60

For landing:
c 'c
=1+2Z fh
ctan( δ f L
2 )=1+2∗0.1 tan( 45 °2 )=1.08
CLαf
=CLα
c 'c
For take-off:
CLαf
=CLα
c 'c
=1.03∗2π=6.45
For landing:
CLαf
=CLα
c 'c
=1.08∗2π=6.8
To calculate the variation in lift coefficient for plain, split and single-slotted flaps:
Plain flapsΔC L=C Lδ
f
δf k where k∧C Lδf
are obtained ¿statistical values
Split flapsΔC
(¿¿ L) cfc
=0.2
ΔC L=k f ¿
ΔC(¿¿L)cf
c=0.2
are obtained
where kf∧¿ statistical values
Single slotted flapsΔC L=C Lα
α δ fδf where α δ f
is obtained ¿ statistical values
The following values are now obtained:
Table 14. Required variation in lift coefficient for 3 types of flap
Direct comparison to the values obtained in table 14 shows that only the single-slottedflaps meets all the take-off and landing requirements. The requires variation if lift
61

coefficient for landing is, however, much more than what is required in table 13,therefore landing flaps are not critical.
Using the critical values for take-off ΔcLmax¿ , the ratio between the flapped wing area to
the wing area can be approximated:
ΔcLmax=
ΔC Lmax
Sw
Swf
k Λ
⟶Swf
Sw
=ΔcLmax ¿
ΔC Lmax ¿k Λ
=0.16
0.89∗0.92=0.192
Swf
Sw
=0.192⟶Swf=0.192∗1,445 f t2=278 f t2⟶Swf2
=139 f t 2
Summary of the flap geometry
Table 15. Flap geometry
Using the obtained value of Swf
Sw, the span stations η0 , ηi are now calculated:
Swf
Sw
=(η0−ηi)2−(1−λ)(η0+ηi)
1+λ
After assigning a discrete value for the inner span station ηi=0.15, the following
single-slotted flap is obtained:
62

CAD drawing 7. Flap geometry
CAD drawing 8. 3D wing and flap geometry
10. Design of the Empennage and the Longitudinal and Directional controls
Sizing of the horizontal and vertical stabilizers
xh=58 ft
xv=58.7 ft
V h=0.65
V v=0.03
Se
Sh
=0.3
63

Sr
Sv
=0.3
Calculation of the surface area of the horizontal and vertical stabilizers
SH=V h Sw c
xh ¿
0.65∗1,445∗6.2558
=101.2 ft2
SV=V V Sw c
xV ¿
0.03∗1,445∗6.2558.7
=170.8 ft2
Using aspect ratios of 5 and 3 for the horizontal and vertical stabilizers, respectively, thefollowing empennage dimensions are determined:
A H=5
AV=3
Λc /4 H=Λc /4 V
=0°
λH=λV=1.0
iH=iH=0 °
ΓH=0 °
ΓV=90 °
bH=√A H SH=√5∗101.2=22.5 ft
bV=√AV SV=√3∗170.8=22.6 ft
crH=SH
bH
=101.222.5
=4.5 ft=ct H
crV=SV
bV=
170.922.6
=7.54 ft=c tV
64
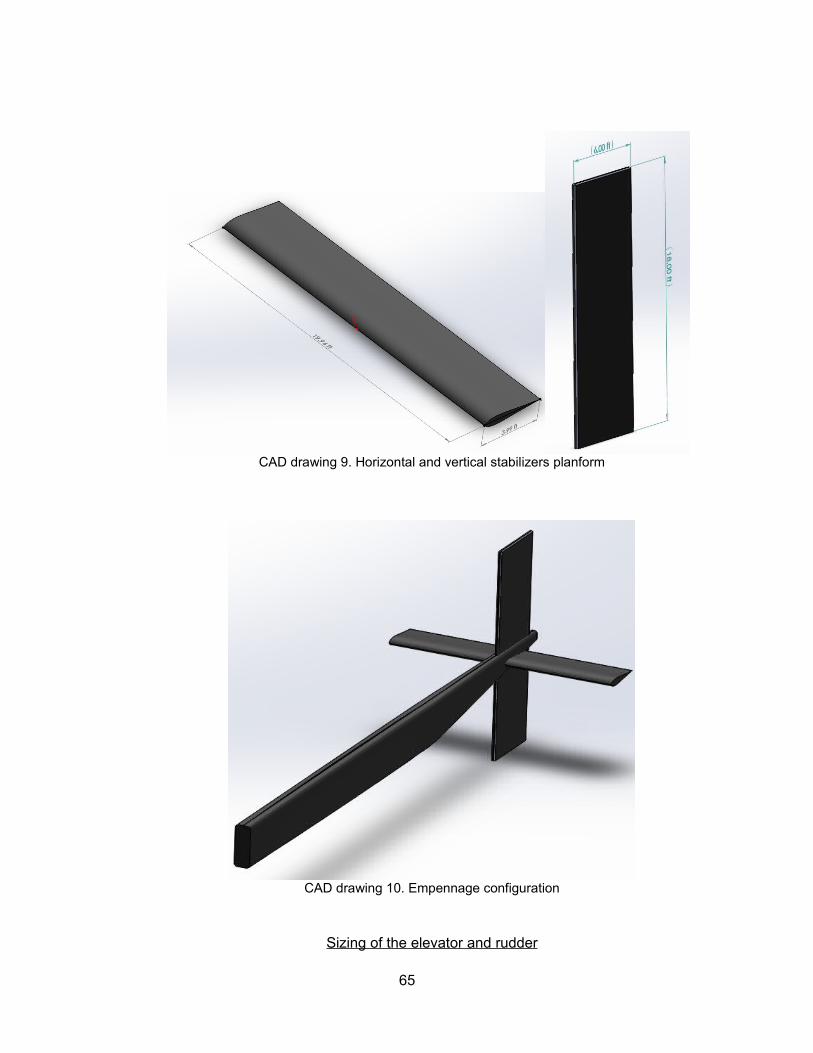
CAD drawing 9. Horizontal and vertical stabilizers planform
CAD drawing 10. Empennage configuration
Sizing of the elevator and rudder
65

Selev=SH
SeSh
=101.2∗0.3=30.36 ft ²
Srud=SVSrSV
=170.8∗0.3=51.24 ft ²
celev=Selev
belev
=30.36 ft ²18.5 ft ²
=1.64 ft
crud=Srud
brud
=51.24 ft ²20.6 ft ²
=2.5 ft
CAD drawing 11. Elevator
11. Design of the Landing Gear and Weight and Balance
11.1 Landing Gear Design
Due to the challenges associated with the design of an airplane capable of operatingunder unusual and difficult conditions, it may be convenient to adopt design measures
that are not conventional. One of those challenges, for instance, involves the design andoperation of the landing gear. Lift generation, especially during the take-off and land
stages, is only possible if drag and weight are minimized.Choosing a conventional retractable landing gear can help decrease drag, but the
weight associated with gear extension and retraction mechanisms such as hydraulicsystems add significant amount of weight.
The landing gear proposed here would need to be retractable yet lightweight. One suchunconventional gear arrangement that could fit the operational characteristics of the
Mars airplane is that incorporated by the Solar Impulse.
66

This landing gear employs a bicycle configuration with additional lateral supports thathelp increase lateral ground stability and sustain the structural integrity of the long
wings.
Calculation of the static load per strut of the airplane will be approximated using themethodology for taildraggers:
CAD drawing 12. Calculation of tire size
Pt=W ¿lmlm+lt ¿
W ¿∗4.13 ft58.63 ft
=91.6Lbs ⟶ Pt
W ¿
=0.07
Pm=W ¿ lt
n s(lm+lt) ¿
W ¿∗54.5 ft58.63ns
=0.93W ¿
ns
⟶2Pm
W ¿
=0.93 with
ns=number of struts ;
It follows that for these values the following data is obtained:
tail tire: d t xb t=9∈x 3.5∈, tire pressure=55 psi
main gear tire: d t xb t=22∈x 8∈,tire pressure=35 psi
Tip-over criterion
Analyses for the longitudinal and lateral tip-over criterion of the airplane are omittedsince they are not necessary for this landing gear configuration.
Propeller ground clearance
Because the airplane doesn’t rotate in either the take-off or landing stages due to thespecial configuration, propeller clearance is not critical. Nevertheless, the vertical
67

distance between the propeller tips and the ground, as seen below, provides an optimalclearance against debris.
3-D views of the landing gear arrangement
CAD drawing 13. Detail of the landing gear arrangement
CAD drawing 14. Landing gear arrangement
68

CAD drawing 15. Detail of landing gear
CAD drawing 16. Landing gear arrangement
CAD drawing 17. Front view of the landing gear arrangement
69

CAD drawing 18. Side view of the landing gear arrangement
11.2 Weight and Balance
CAD drawing 19. Location of different components
70

Table 16. Weight and balance analysis
Location of the Center of Gravity for Possible Loading Scenarios
Graph 11. Excursion diagram.
71

The excursion diagram shows a cg travel of about 14 inches or 0.15 Fr . cw . This
agrees with normal values for twin engine, propeller-driven airplanes, which commonly
display cg ranges of 0.12−0.22 Fr . cw , or 9 – 15 inches.
A summary of the cg range for this airplane is included below:
Table 17. Forward and aft cg locations
12. Stability and Control
12.1 Static Longitudinal Stability
Calculation of X ac
X ac=X acwf+CLαh
[1−dεhdα ][ Sh
S ] X ach
CLαwf
1+CLαh
[1−dεhdα ][ Sh
S ]CLαwf
CLαwf=FCLα
w
where the wing-body interference factor F is obtained from appendix
CLα w
=2 π ARw
2+√ AR eff2β
k2 [1+tan2
( Λ c /2w)β ]+4
=8.4/rad
β=√1−M 2= √1−0.552
= 0.83
72

ARw=3
Λc /2w=0⁰
k=CLαat M
2πβ
CLαat M=CLα at M=0
√1−M 2(for subnonic speeds)
CLα atM =0
=2π ARw
2+√ARw2β2[1+
tan2 ( Λ t /c )
β2 ]+4 /rad
CLα h
=2π AR h
2+√ AReff2β
k2 [1+ tan2( Λ c /2h )β ]+4
For the horizontal stabilizer:
AR h=5
β=√1−M 2=√1−0.552
=0.83
Λc /2h=0
k=CLα at M
2πβ
=0.013
73

CLαat M=CLα at M=0
√1−M 2=5.66 /rad (for subsonic speeds)
CLα atM =0
=2π ARw
2+√ARw2β2[1+
tan2 ( Λ t /c )
β2 ]+4
=4.73 /rad
CLαh=5.55/rad
The downwash gradient at the horizontal tail can be approximated as:
dεhdα
=4.44 [√k A k λkh cos Λ c4 ]
1.19 CLα at M
CLαat M=0
k A=1AR
−1
1+AR1.7=0.024874
k λ=10−3 λ
7=1.2571
1−¿hhb
∨ ¿2 lhb
=1.3294,where thehh∧lh parameters are obtained statistically
k h=3√¿
dεhdα
=0.106
74

Xacwf=Xacw
+ Xac f where Xacw=0.25 ,
Xacwf=0.2336
X ac=X acwf+CLαh
[1−dεhdα ][ Sh
S ] X ach
CLαwf
1+CLαh
[1−dεhdα ][ Sh
S ]CLαwf
=0.2336+0.097
[1−0.106 ] [ Sh1,445 ]8.5
0.15
1+0.097[1−0.106 ] [ Sh
1,445 ]0.15
X ac=0.2336+0.00334 Sh
1+3.93∗10−4Sh
To obtain the X ac leg of the analysis, the weight per pound of the horizontal
stabilizer is estimated as:
SH=101.2 ft ²
Using the previously estimated weight of the horizontal stabilizer (15.91 Lbs), the weightper pound is calculated as 0.157 Lbs.
Using the excursion diagram to visualize the aft cg shift as the weight of the stabilizer isincreased from a value of 0 Lbs, the following relations could be obtained:
75

Table 18. Calculation of horizontal tail are based on 10% SM
0 20 40 60 80 100 120 140 1600
0.2
0.4
0.6
0.8
0.606
Static Longitudinal Stability
SH (ft²)
Xcg and Xac (Fr Cw)
Graph 12. Static longitudinal stability
These calculations show that for a 10% margin of static stability, the horizontal tail must
have a surface area of SH=100 f t2 . This indicates that the previous sizing of
SH=101.2 f t2 was optimal.
12.2 Directional Stability
Yawing-moment-due-to-sideslip derivative Cn β (weathercock stability parameter)
76

Cn β=Cnβ
w
+Cn βfus
+CnβV
Cn βw ≈ 0, since wing contribution important only at high angles of attack .11
Cn βfus = - 0.96 KB
Ss
S L fus
b √ h1
h2
3√ w2
w1 , fuselage contribution
¿rad18
where KB can be determined from the following equation:
KB = ( K 'B – 0.0285) + 0.2857dL fus
Table 19. estimates for K 'B based on fuselage dimensions
l fh=
76.676.6
=11.6⟶ K 'B≈0.005
KB = ( K 'B – 0.0285) + 0.2857dL fus
=0.038
77

CAD drawing 20. Parameters for the calculation of directional stability
Cn βfus = -0.00151 /rad
Cn βv = CLα v
ηv
Sv xvSb (1-
∂σ∂β )
CLαv
=2πARv
2+√ AReff2(1−M 2
)
k2 [1+tan2 ( Λc /2 )
(1−M2 ) ]+4
=0.0951/rad
AR eff = 1.55bv
2
Sv
=4.65
ηv (1−∂σ∂β )=¿ 0.724+3.06
SvS
1+cos ( Λ c4
)+0.4
zwh
+0.009 ARW = 1.435
Cn β = 0 -0,00151 (0.0695 x 1.435)170.8 Sv
1,445 x231=0.00188
78

0
0
0
0
0
0
0
0
0.01
0.01
0.01
Directional Stability
Vertical Tail Area (ft²)
Cnβ (1/rad)
Graph 13. Directional stability and vertical tail area
These findings show that for optimal directional stability, the area of the verticalstabilizer must be reduced by 17%. (from 170 ft² to 140 ft²).
14. Conclusions
The data collected in this report confirms the difficulty associated with the designof an airplane capable of flying in the Martian atmosphere. Different variables
and methods, part of the design followed in this report, often required drastic andunconventional measures. As expected, the weight of the airplane is a major
constrain as evidenced by the very wing loading obtained, (WS
¿¿=0.9Lb
f t2 .
These leads to a design with a required high wing surface area ( Sw=1,445 ft ² ¿ .
In addition, a very high wing aspect ratio A=37 was used in order to maximizeL/D.
79

The selected airfoil, the NACA 4415, performed better than the other two optionsconsidered. As evidenced by the numerical simulation provided, the NACA 4415
generated substantial higher CLmax than the Apex-16 and LNV-109a at all tested
conditions. Especial emphasis was made for the prediction of this airfoil at α=0°due to projected take-off and landing configurations of the airplane.
Several possibilities for the selection and integration of the propulsion system ofthe airplane were considered. Based on the pros and cons of each of thesecandidates, it was determined that an especially designed 4-cycle internal
combustion engine performed better at the tested conditions. A bipropellant
combination of UDMH and N 2O4 was chosen due to their application at the
given low temperature, where they remained in the liquid phase.The theoretical high-altitude propeller selected adapts better to the expected lowReynolds number. This 16-ft diameter, three bladed propellers determined from
data extrapolation could theoretically provide an efficiency factor of 0.83 at cruiseflight conditions.
The landing gear configuration selection was dependent on the overall structurallimitations of the airplane. Because large surface areas for the horizontal and
vertical stabilizers were required, and due to low empennage weight constrains, itwas convenient to adopt this unconventional bicycle configuration.
The sizing of the horizontal and vertical stabilizers was backed by requirementsof good directional and longitudinal static stability.
80

References
[1] Kieffer, H. H. (1995). Mars. Tucson, AZ: Univ. of Arizona Press.
[2] Mini-Sniffer Remotely Piloted Research Vehicle [Digital Image]. (2017, August 3).Retrieved January 27, 2018, from
https://www.nasa.gov/centers/armstrong/multimedia/imagegallery/Mini-Sniffer/index.html
[3] Leavin' on a Martian Jet Plane [Digital image]. (n.d.). Retrieved January 27, 2018,from https://hips.hearstapps.com/pop.h-cdn.co/assets/cm/15/05/54cb64f38ba3b_-
_interplanetary-flight-sim-01-0313-de.jpg
[4] Gonzalez, A. (2007, August 27). Computer-aided-design (CAD) image of the MatadorMars airplane concept [Digital image]. Retrieved January 27, 2018, from
https://www.nasa.gov/centers/ames/images/content/183951main_med_Pizarro%20-%20Matador%2003.jpg
[5] Calaba, D. (2017, August 6). [Digital image]. Retrieved January 27, 2018, fromhttps://www.nasa.gov/sites/default/files/thumbnails/image/mars_prandtl-m.jpg
[6] Pathfinder in flight over Hawaii [Digital image]. (2014, February 28). RetrievedJanuary 27, 2018, from
https://www.nasa.gov/sites/default/files/images/326814main_EC97-44287-1_full.jpg
[7] Pathfinder Plus in flight over Hawaii [Digital image]. (2014, February 28). RetrievedJanuary 27, 2018, from
https://www.nasa.gov/sites/default/files/images/330281main_ED02-0161-2_full.jpg
[8] Colozza, A. J. (2003). Comparison of Mars aircraft propulsion systems. Cleveland,OH: National Aeronautics and Space Administration, Glenn Research Center.
[9] Kuhl, C. A. (2009). Design of a Mars airplane propulsion system for the AerialRegional-Scale Environmental Survey (ARES) mission concept. Hampton, VA: National
Aeronautics and Space Administration, Langley Research Center.
81

[10] Colozza, A. (1998, March). High Altitude Propeller Design and AnalysisOverview[PDF]. Cleveland, Ohio: Federal Data Systems.
[11] Roskam, J., Dr. (2005). Aircraft Design Part I: Preliminary Sizing of Airplanes.Lawrence, KS: DARcorporation.
[12] Rutan Voyager. (2017, September 06). Retrieved January 27, 2018, fromhttps://airandspace.si.edu/collection-objects/rutan-voyager
[13] Grob Grabs Altitude Record. (1995, November). Flying, 122(11), 30.
[14] Torenbeek, E. (2010). Synthesis of subsonic airplane design: an introduction to thepreliminary design of subsonic general aviation and transport aircraft, with emphasis on
layout, aerodynamic design, propulsion and performance. Dordrecht: Kluwer.
[15] Kocivar, B. (1978, July). Superdrone: Pilotless Mite will Sniff Out Pollution. PopularMechanics, 66-69.
[16] Angels in Paradise: The Development of the U-2 at Area 51. (2012, December 13).Retrieved March 01, 2018, from https://www.youtube.com/watch?v=nQnBJrj_-l8&t=462s
[17] Pathfinder: Leading the Way in Solar Flight [PDF]. (2002, October). Edwards, CA:NASA Dryden Flight Research Center.
[18] Perkins, C. D., & Hage, R. E. (2006). Airplane performance stability and control.Hoboken, NJ: Wiley.
[19] Nicolai, L. M. (1975). Fundamentals of aircraft design. Xenia. Ohio: Mets.
[20] Boeing Condor [Digital image]. (n.d.). Retrieved April 22, 2018, fromhttp://notreally.info/transport/drones/condor/img//condor_boeing_condor_02
[21] History-making UAV Propellers: The Boeing Condor. (2016, January 20). RetrievedApril 21, 2018, from http://hartzellprop.com/making-uav-propeller-boeing-condor/
[22] Perseus B Remotely Piloted Aircraft [Digital image]. (2014, February 14). RetrievedApril 21, 2018, from https://www.nasa.gov/centers/armstrong/news/FactSheets/FS-059-
DFRC.html
[23] Perseus B Parked on Ramp - Close-up of Controllable-Pitch Pusher Propeller[Digital image]. (1999, September). Retrieved April 21, 2018, from
https://www.dfrc.nasa.gov/Gallery/Photo/Perseus/HTML/EC99-45152-6.html
[24] Huge Five-Bladed MT Propellers Help Grob 2C Reach Record Altitude Of 66,000 ft.[Digital image]. (n.d.). Retrieved April 22, 2018, from http://sustainableskies.org/april-
festival-electric-flight/
82

[25] EMRAX 268. (n.d.). Retrieved May 24, 2018, fromhttp://emrax.com/products/emrax-268/
[26] Bents, D. J., & Maldonado, J. (1998, April). Propulsion System for Very HighAltitude Subsonic Unmanned Aircraft[PDF]. Williamsburg: NASA.
[27] Bents, D. J., & Maldonado, J. (1998, April). Propulsion System for Very HighAltitude Subsonic Unmanned Aircraft[PDF]. Williamsburg: NASA.
Appendix A
AIRPLANE CATEGORY
air
fram
e
pro
puls
ion
gro
up
fixe
d e
qu
ipm
en
t
em
pty
weig
ht
PASSENGER TRANSPORTSshort-haul jets 32 8 14 53
turboprops 32 13 14 58pistons 30 21 16 66
long-haul jets 258.5 9 42
turboprops 27 12 12 51pistons 26 18 11 54
FREIGHTERSshort-haul turboprops 35 13 8 56long-haul turboprops 27 10 7 44
EXECUTIVE JETS 28 8 16 51Table 1. percentage MTOW weight fractions
83

Table 2.
84

Table 3.
85

Table 4.
Table 5
86

Table 6
Table 7
87