Concepts of health and disease
173
CONCEPTS OF HEALTH AND DISEASE www.drjayeshpatidar.blogspot.com
-
Upload
dr-jayesh-patidar -
Category
Health & Medicine
-
view
4.665 -
download
0
Transcript of Concepts of health and disease
CONCEPTS OF HEALTH AND
DISEASE
www.drjayeshpatidar.blogspot.com
INTRODUCTION
a) Importance
b) Taken for granted and value
not understood
c) Fundamental human right and
social goal
d) Integrated to Socio-economic
growth
e) “Health for all concept”
ww
w.d
rjayesh
pa
tida
r.blo
gsp
ot.in

DEFINITIONS
• HEALTH
• DISEASE
• PREVENTIVE MEDICINE
• POSITIVE HEALTH
ww
w.d
rjayesh
pa
tida
r.blo
gsp
ot.in

PHILOSOPHY OF HEALTH
a) Fundamental right
b) Essence of productive life
c) Intersectoral
d) Integral part of development
e) Central to PQLI
f) Combined responsibility
g) Major social investment
h) Social goal
ww
w.d
rjayesh
pa
tida
r.blo
gsp
ot.in
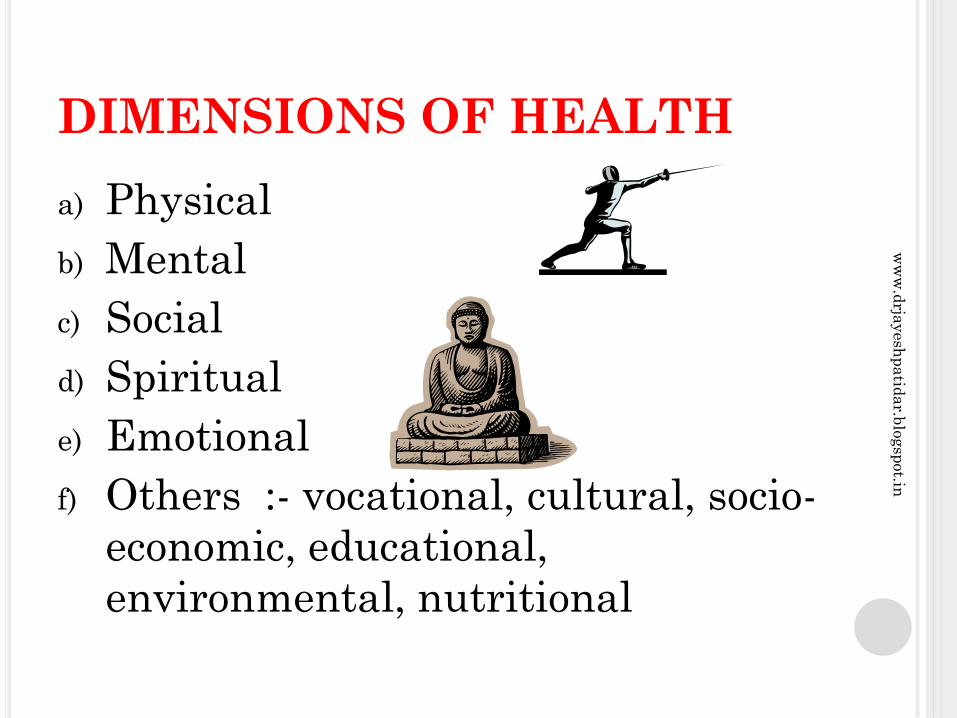
DIMENSIONS OF HEALTH
a) Physical
b) Mental
c) Social
d) Spiritual
e) Emotional
f) Others :- vocational, cultural, socio-
economic, educational,
environmental, nutritional
ww
w.d
rjayesh
pa
tida
r.blo
gsp
ot.in
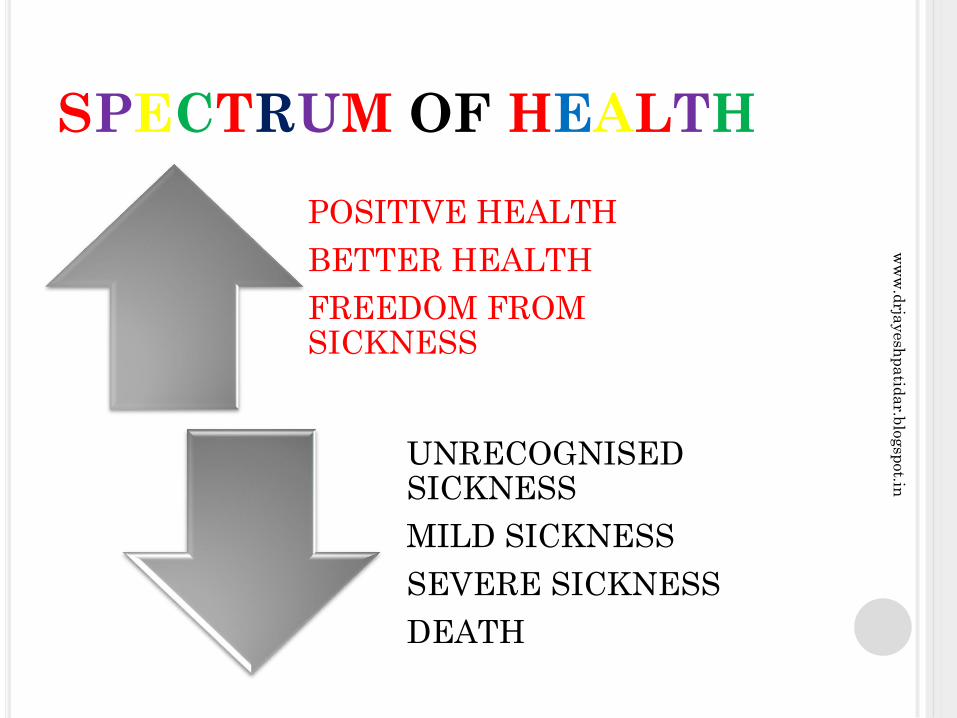
SPECTRUM OF HEALTH
POSITIVE HEALTH
BETTER HEALTH
FREEDOM FROM SICKNESS
UNRECOGNISED SICKNESS
MILD SICKNESS
SEVERE SICKNESS
DEATH
ww
w.d
rjayesh
pa
tida
r.blo
gsp
ot.in

DETERMINANTS OF HEALTH
a) Biological
b) Behavioral and Socio-cultural conditions
c) Environment
d) Socio-economic conditions
e) Health services
f) Ageing
g) Gender
h) Other factors
ww
w.d
rjayesh
pa
tida
r.blo
gsp
ot.in

PRINCIPLES OF EPIDEMIOLOGY
1) DEFINITION :- BASIC SCIENCE OF
COMMUNITY MEDICINE
“Study of distribution and determinants of
disease frequency in man”
2) SCOPE AND HISTORY
Began with study of epidemics
Now studies communicable and non
communicable diseases as well
Emphasis on prevention of diseases and also
promotion of positive health
ww
w.d
rjayesh
pa
tida
r.blo
gsp
ot.in
PRINCIPLES OF EPIDEMIOLOGY
(CONTD)
3) In clinical medicine focus is on one case.
Here it is on group of persons
4) Study cases, search causes, modes of
transmission, prevent and control, help
administration to reform health care
facilities and strategy
ww
w.d
rjayesh
pa
tida
r.blo
gsp
ot.in

WEB OF CAUSATION FOR
MYOCARDIAL INFARCTION
ww
w.d
rjayesh
pa
tida
r.blo
gsp
ot.in
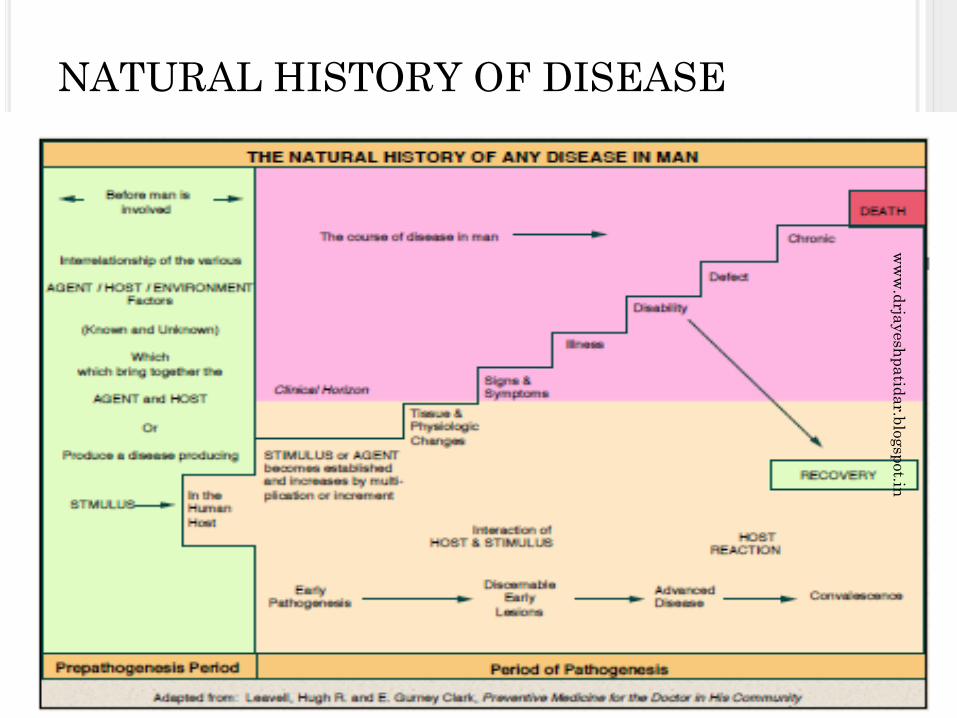
NATURAL HISTORY OF DISEASEw
ww
.drja
yesh
pa
tida
r.blo
gsp
ot.in

ww
w.d
rjayesh
pa
tida
r.blo
gsp
ot.in
EPIDEMIOLOGY
1. INTRODUCTION
2. CONCEPTS OF DISEASE
a) DEFINITION
b) SPECTRUM OF DISEASE
3. CAUSES OF DISEASE
a) ANCIENT BELIEFS
b) GERM THEORY :-AGENT MAN DISEASE
ww
w.d
rjayesh
pa
tida
r.blo
gsp
ot.in
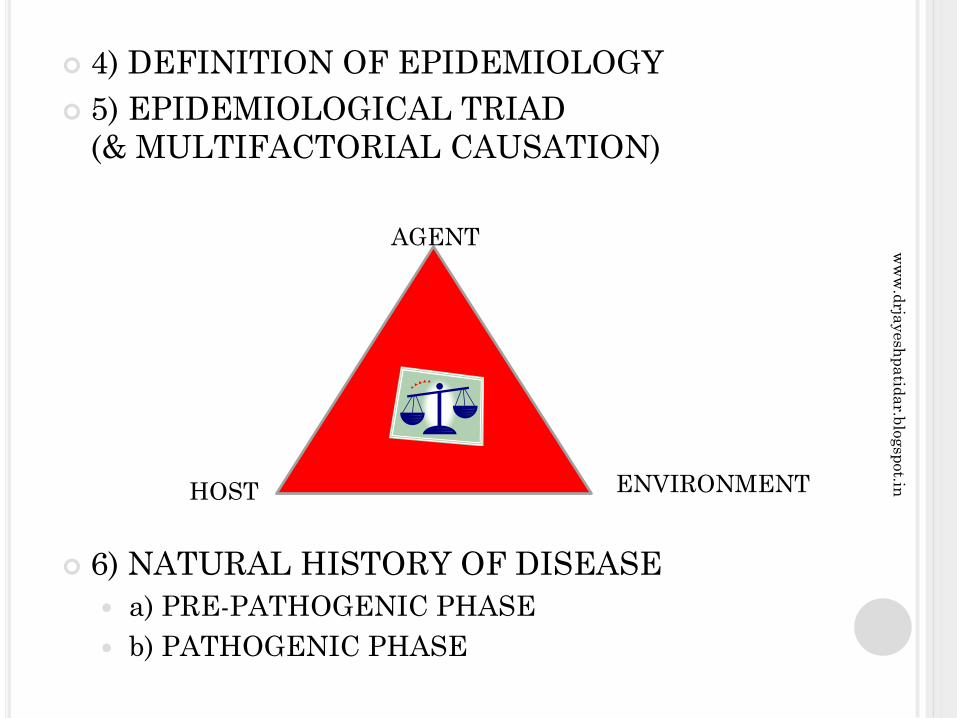
4) DEFINITION OF EPIDEMIOLOGY
5) EPIDEMIOLOGICAL TRIAD
(& MULTIFACTORIAL CAUSATION)
6) NATURAL HISTORY OF DISEASE
a) PRE-PATHOGENIC PHASE
b) PATHOGENIC PHASE
AGENT
HOST ENVIRONMENT
ww
w.d
rjayesh
pa
tida
r.blo
gsp
ot.in
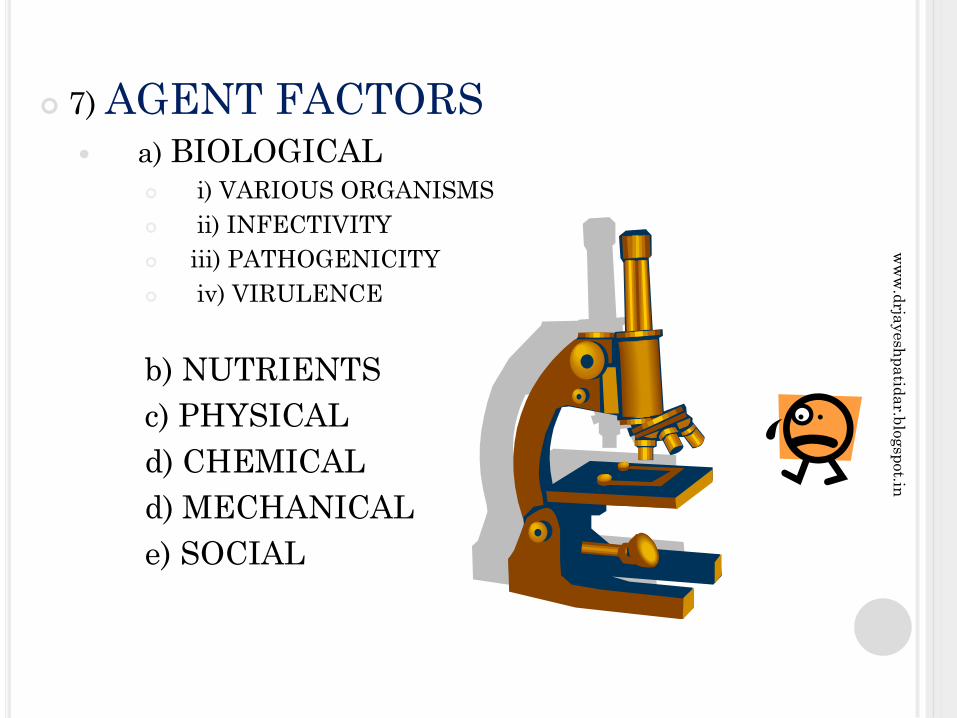
7) AGENT FACTORS a) BIOLOGICAL
i) VARIOUS ORGANISMS
ii) INFECTIVITY
iii) PATHOGENICITY
iv) VIRULENCE
b) NUTRIENTS
c) PHYSICAL
d) CHEMICAL
d) MECHANICAL
e) SOCIAL
ww
w.d
rjayesh
pa
tida
r.blo
gsp
ot.in

8) HOST FACTORS
a) AGE, SEX, ETHNICITY
b) GENETIC
c) SOCIO-ECONOMIC :- Socio-economic status,
occupation, education, stress, marital status,
housing
d) LIFE STYLE :- HABITS
ww
w.d
rjayesh
pa
tida
r.blo
gsp
ot.in

9) ENVIRONMENT FACTORS
a) PHYSICAL
b) BIOLOGICAL
c) PSYCHOSOCIAL
ww
w.d
rjayesh
pa
tida
r.blo
gsp
ot.in

10) ICEBERG PHENOMENON
ww
w.d
rjayesh
pa
tida
r.blo
gsp
ot.in

11) LEVELS OF PREVENTION
a) PRIMORDIAL
b) PRIMARY
c) SECONDARY
d) TERTIARY
ww
w.d
rjayesh
pa
tida
r.blo
gsp
ot.in
GENERAL USES OF EPIDEMIOLOGY
1) Study history of health of
population and rise and fall of
diseases and their character.
2) Diagnose health of the community.
3) Plan and evaluate health services
4) Estimate individual risks and
chances
ww
w.d
rjayesh
pa
tida
r.blo
gsp
ot.in

GENERAL USES ….CONTD
5) Identify syndromes
6) Complete the natural history of the disease
7) Search for causes
8) Help prevention, control and further research.
ww
w.d
rjayesh
pa
tida
r.blo
gsp
ot.in

12) MODES OF INTERVENTION
a) HEALTH PROMOTION
i) HEALTH EDUCATION
ii) ENVIRONMENTAL MODIFICATION
iii) NUTRITIONAL INTERVENTION
iv) LIFESTYLE / BEHAVIOUR CHANGE
b) SPECIFIC PROTECTION
c) EARLY DIAGNOSIS AND TREATMENT
d) DISABILITY LIMITATION
e) REHABILITATION
13) CONCLUSION
ww
w.d
rjayesh
pa
tida
r.blo
gsp
ot.in

THANXw
ww
.drja
yesh
pa
tida
r.blo
gsp
ot.in
EPIDEMIOLOGICAL APPROACH
ww
w.d
rjayesh
pa
tida
r.blo
gsp
ot.in

1) DEFINITION
2) TYPES OF EPIDEMIOLOGY
a) DESCRIPTIVE
b) ANALYTICAL
3) BASIC QUESTIONS STUDIED
a) When does the disease occur?
b) Where does the disease occur?
c) Who are the people affected?
d) Why has the disease occurred?
e) What should be done to prevent or control
the disease?
ww
w.d
rjayesh
pa
tida
r.blo
gsp
ot.in
4) DESCRIPTIVE EPIDEMIOLOGY
a) TIME DISTRIBUTION
i) SEASON
ii)CYCLIC TREND
iii) SECULAR TREND
b) PLACE DISTRIBUTION
i) AREA
ii) FACTORY
iii) DEPARTMENT
iv) SHOP FLOOR
ww
w.d
rjayesh
pa
tida
r.blo
gsp
ot.in

c) PERSON DISTRIBUTION
i) AGE
ii) SEX
iii) MARITAL STATUS
iv) ETHNIC GROUP
v) OCCUPATION
vi) SOCIO-ECONOMIC STATUS
vii) EDUCATION
viii) DIET
ix) HABITS
5) ANALYSE RATES AND FORMULATE
HYPOTHESIS
ww
w.d
rjayesh
pa
tida
r.blo
gsp
ot.in
6) USES OF DESCRIPTIVE
EPIDEMIOLOGY
a) Provides occurrence data in an occupational
setting.
b) Provides clues to etiology.
c) Help formulate hypothesis
d) Provides data for planning, organization and
evaluate medical and health services.
e) Helps further research.
ww
w.d
rjayesh
pa
tida
r.blo
gsp
ot.in
8) SOURCES OF DATA
a) MORTALITY DATA
b) MEDICAL COMPENSATION
RECORDS
c) FACTORY MORBIDITY DATA
d) E S I COMPENSATION RECORDS
e) HOSPITAL DATA
f) SICKNESS ABSENTEEISM
g) PERIODIC MEDICAL EXAM
RECORDS
h) FIELD SURVEYS
ww
w.d
rjayesh
pa
tida
r.blo
gsp
ot.in
8) ANALYTICAL EPIDEMIOLOGY
a) CASE CONTROL STUDY
b) COHORT STUDY
i) RETROSPECTIVE
ii) PROSPECTIVE
9) CONCLUSION
ww
w.d
rjayesh
pa
tida
r.blo
gsp
ot.in

EPIDEMIOLOGICAL METHODS
ww
w.d
rjayesh
pa
tida
r.blo
gsp
ot.in
1) INTRODUCTION
a) Primary role is to study disease
occurrence in people
b) Study factors which may have
disease etiology by studying
exposures
c) Community based.
ww
w.d
rjayesh
pa
tida
r.blo
gsp
ot.in
2) CLASSIFICATION
A) OBSERVATIONAL STUDIES :-
1) DESCRIPTIVE
2) ANALYTICAL :-
a) ECOLOGICAL
b) CROSS-SECTIONAL
c) CASE CONTROL
d) COHORT
ww
w.d
rjayesh
pa
tida
r.blo
gsp
ot.in

B) EXPERIMENTAL / INTERVENTIONAL
STUDIES
1) RANDOMIZED CONTROLLED TRIALS
2) FIELD TRIALS – COMMUNITY
INTERVENTION TRIALS
- Above are not watertight compartments
- They are flexible and complementary
ww
w.d
rjayesh
pa
tida
r.blo
gsp
ot.in

DESCRIPTIVE EPIDEMIOLOGY
1. KEY TO SUCCESS - METICULOUS
OBSERVATIONS
2. EXAMPLES – Burkitts lymphoma- epstein
barr virus, Scurvy – J Lind, Small pox – Edward
Jenner.
3. BASIC QUESTIONS – When, Where and Who
ww
w.d
rjayesh
pa
tida
r.blo
gsp
ot.in

4) EPIDEMIOLOGICAL TRIAD
BALANCING ACT
AGENT
ENVIRONMENTHOST
ww
w.d
rjayesh
pa
tida
r.blo
gsp
ot.in
5) PROCEDURES
a) Defining population
b) Defining disease
c) Describing disease :- Time, Place,
Person
d) Measurement of disease
e) Comparing known indices
f) Formulation of hypothesis
ww
w.d
rjayesh
pa
tida
r.blo
gsp
ot.in
6.a) DEFINING THE POPULATION
i) TOTAL NUMBER
ii) AGE
iii) SEX
iv) OCCUPATION
v) CULTURAL / SOCIAL
CHARECTERISTICS
vi) EITHER WHOLE OR SAMPLE/ SPECIAL
SELECTED GROUPS
vii) NO MIGRANTS / OUTSIDERS /
OVERTLY DIFFERENT GROUPS
viii) GIVES DENOMINATOR ( IMPORTANT)
ww
w.d
rjayesh
pa
tida
r.blo
gsp
ot.in
6.b) DEFINING THE DISEASE
i) PRECISE AND VALID DEFINITION REQUIRED
ii) IDENTIFY THOSE HAVING / NOT HAVING
DISEASE
iii) DIAGNOSTIC METHODS ACCEPTABLE BY
POPULATION AND APPLICABLE TO LARGE
COMMUNITIES ( e.g Tonsillitis )
ww
w.d
rjayesh
pa
tida
r.blo
gsp
ot.in
6.c) DESCRIBING THE DISEASE
i) PRIMARY OBJECTIVE – Describe
occurrence and distribution. Systematic
collection of data (epidemiological triad) and
analysis of data
ii) TIME DISTRIBUTION
a) Short – term fluctuations
i) whether there is epidemic?
ii) Type of epidemic * Common source –
single source/ multiple source
* Propogated
epidemic – person- person, arthropod borne,
animal reservoir
* Slow / modern epidemics
ww
w.d
rjayesh
pa
tida
r.blo
gsp
ot.in

II) TIME DISTRIBUTION…..CONTD
b) PERIODIC FLUCTUATIONS
i) SEASONAL
ii) CYCLIC
c) LONG TERM ( SECULAR TREND)
e.g IHD, DIABETES, CANCER, ADDICTION
TYPHOID, TB, POLIO
d) INTERPRETATION OF TIME TRENDS
ww
w.d
rjayesh
pa
tida
r.blo
gsp
ot.in
iii) PLACE DISTRIBUTION a) INTERNATIONAL VARIATIOINS
b) NATIONAL VARIATIONS
c) URBAN – RURAL VARIATIONS
d) LOCAL DISTRIBUTION
e) MIGRATION STUDIES
iv) PERSON DISTRIBUTION a) AGE
b) SEX
c) ETHNICITY
d) MARITAL STATUS
e) SOCIAL CLASS
f) OCCUPATION
g) BEHAVIOUR / HABITS
h) STRESS
j) MIGRATIONS
ww
w.d
rjayesh
pa
tida
r.blo
gsp
ot.in

v) MEASUREMENT OF DISEASE
a) CROSS-SECTIONAL STUDIES
b) LONGITUDINAL STUDIES
vi) COMPARING WITH KNOWN INDICES
ww
w.d
rjayesh
pa
tida
r.blo
gsp
ot.in

vii) FORMULATION OF HYPOTHESIS.
SPECIFY-
a) POPULATION
b) SPECIFIC CAUSE CONSIDERED
c) EXPECTED OUTCOME i.e DISEASE
d) DOSE – RESPONSE RELATIONSHIP
e) TIME – RESPONSE RELATIONSHIP
e.g 1) “Cigarette smoking causes cancer”
2) “ 30 – 40 cigarettes per day for
20yrs causes cancer in 10% smokers”
ww
w.d
rjayesh
pa
tida
r.blo
gsp
ot.in
ADVANTAGES
a) Decides magnitude, load, type of disease.
b) Gives clues to etiology
c) Helps planning, organizing and evaluating
control measures
d) Contribute to research.
ww
w.d
rjayesh
pa
tida
r.blo
gsp
ot.in
ANALYTICAL STUDIES
1) INTRODUCTION
a) Second major type of study
b) Focus on individual but results applied to
population
c) Object is not to formulate but to test
hypothesis
2) TYPES
a) CASE CONTROL STUDY
b) COHORT STUDY
In them we determine :-
a) Statistical association exists or not
b) If yes, then strength of association
ww
w.d
rjayesh
pa
tida
r.blo
gsp
ot.in

3) CASE CONTROL STUDIES
(Often retrospective)
a) Both exposure and outcome have occurred
before starting the study.
b) Study backward. Effect Cause
c) Uses control to support / refute inference.
4) DESIGN
a) Comparison studies.
b) Cases and Controls must be comparable.
c) Neutralise effect of confounding factors.
ww
w.d
rjayesh
pa
tida
r.blo
gsp
ot.in
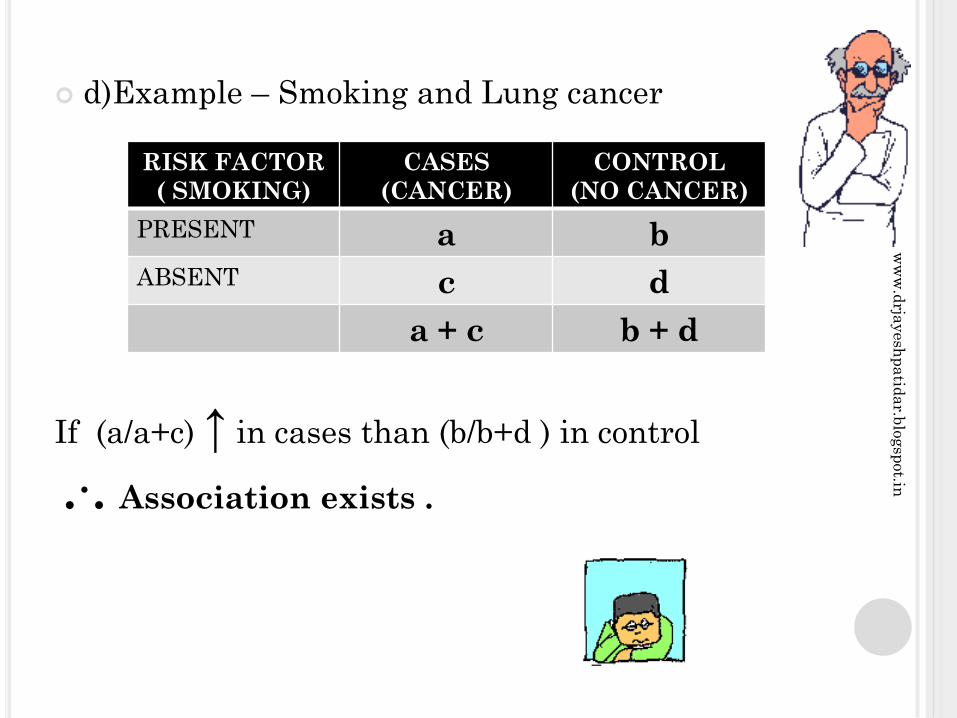
d)Example – Smoking and Lung cancer
If (a/a+c) ↑ in cases than (b/b+d ) in control
.·. Association exists .
RISK FACTOR
( SMOKING)
CASES
(CANCER)
CONTROL
(NO CANCER)
PRESENT a b
ABSENT c d
a + c b + d
ww
w.d
rjayesh
pa
tida
r.blo
gsp
ot.in
5) BASIC STEPS
a) Selection of Cases and Controls
b) Matching
c) Measurement of exposure
d) Analysis and interpretation
a) SELECTION OF CASES
i) Diagnostic criteria
ii) Eligibility criteria
iii) Sources - Hospital
- Population
ww
w.d
rjayesh
pa
tida
r.blo
gsp
ot.in

b) SELECTION OF CONTROLS
i) Free from disease
ii) Identified before study
iii) Not exposed to disease under study
iv) Source - Hospital
- Relatives
- Neighbours
- Population
c) MATCHING
d) MEASUREMENT OF EXPOSURE
i) Precise information
ii) Interviews, questionnaires, records
iii) No “BIAS”
ww
w.d
rjayesh
pa
tida
r.blo
gsp
ot.in

e) ANALYSIS
i) Exposure rates
Cases = (a/a+c) = 33/35 = 94.2%
Controls = (b/b+d) = 55/82 = 67%
CASES CONTROLS
SMOKERS 33
(a)
55
(b)
NON -
SMOKERS2
(c)
27
(d)
TOTAL 35
(a + c)
82
(b + d)
p < 0.00
ww
w.d
rjayesh
pa
tida
r.blo
gsp
ot.in
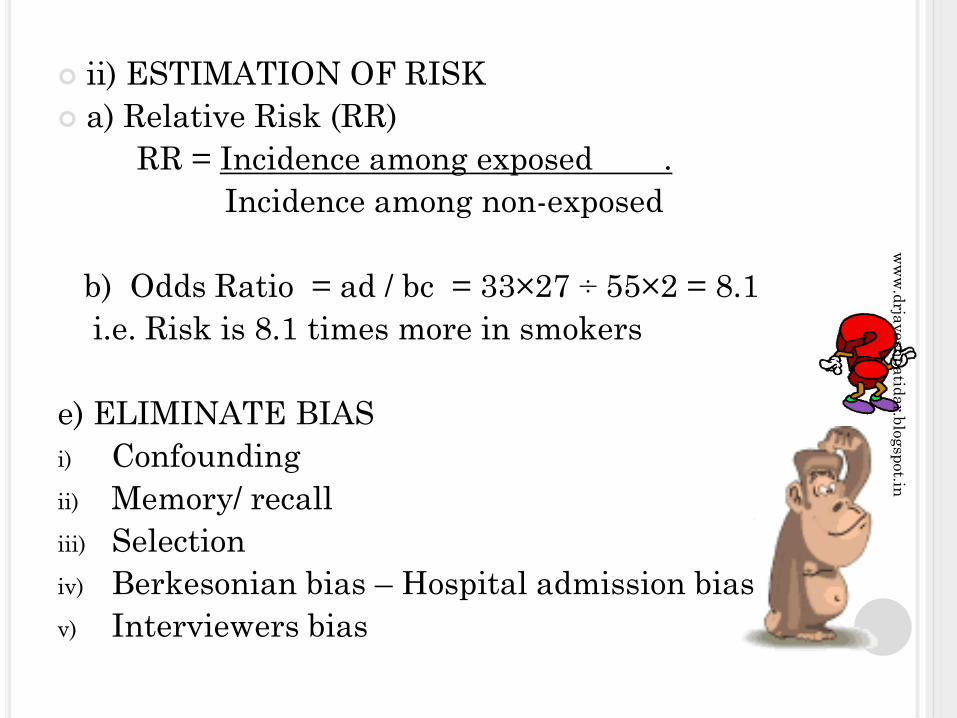
ii) ESTIMATION OF RISK
a) Relative Risk (RR)
RR = Incidence among exposed .
Incidence among non-exposed
b) Odds Ratio = ad / bc = 33×27 ÷ 55×2 = 8.1
i.e. Risk is 8.1 times more in smokers
e) ELIMINATE BIAS
i) Confounding
ii) Memory/ recall
iii) Selection
iv) Berkesonian bias – Hospital admission bias
v) Interviewers bias
ww
w.d
rjayesh
pa
tida
r.blo
gsp
ot.in
ADVANTAGES
1. Relatively easy to carry out
2. Rapid and inexpensive ( compared to Cohort
studies)
3. Require comparatively few subjects
4. Particularly suitable to investigate rare
diseases or diseases about which little is known.
But a disease which is rare in the general
population ( e.g. leukemia in adolescents) may
not be rare in special exposure group (e.g.
prenatal X-Rays)
5. No risk to subjects
ww
w.d
rjayesh
pa
tida
r.blo
gsp
ot.in

ADVANTAGES ……CONTD
6. Allows the study of several different etiological
factors (e.g. smoking, physical activity and
personality characteristics in myocardial
infarction)
7. Risk factors can be identified. Rational
prevention and control programmes can be
established
8. No attrition problems, because case control
studies do not require follow-up of individuals
into the future
9. Ethical problems minimal.
ww
w.d
rjayesh
pa
tida
r.blo
gsp
ot.in

DISADVANTAGES
1. Problems of bias relies on memory or past records, the accuracy of which may be uncertain; validation of information obtained is difficult or sometimes impossible
2. Selection of an appropriate control group may be difficult
3. We cannot measure incidence, and can only estimate relative risk
4. Do not distinguish between causes and associated factors
5. Not suited for the evaluation of therapy or prophylaxis of disease
6. Another major concern is the representativeness of cases and controls
CONCLUSION
ww
w.d
rjayesh
pa
tida
r.blo
gsp
ot.in
COHORT STUDY
1. INTRODUCTION
a) Descriptive epidemiology produces
suspected cause and effect (disease)
relationship
b) Cohort study is (obs.) analytical study
undertaken to obtain additional evidence to
support/ refute association
( also called Prospective, Longitudinal, Forward
Looking Studies)
ww
w.d
rjayesh
pa
tida
r.blo
gsp
ot.in

2. FEATURES
a) Cohorts identified prior to study
b) Groups observed over a period of time
c) Proceeds forward from CAUSE to EFFECT
3. CONCEPT OF COHORT – Group who share
common characteristics and experience/exposure
within a defined period (e.g. Age, Sex, etc.) :-
Birth Cohort, Exposure Cohort, Marriage Cohort,
Disease Cohort and so on (Test/ Control Cohort)
ww
w.d
rjayesh
pa
tida
r.blo
gsp
ot.in
4. INDICATION
a) Good evidence present from clinical
observation/ Descriptive/ Case – Control Studies
b) Exposure rare but incidence high
e.g. X-Rays/Radiation
c) Follow up easy, Cohort is stable, co-operative
and easily accessible
d) Funds available
ww
w.d
rjayesh
pa
tida
r.blo
gsp
ot.in

5.FRAME WORK
a) Cause to effect
b) Basic design :-
COHORT DISEASE TOTAL
YES NO
EXPOSED
(STUDY
COHORT)
a b (a + b)
NOT
EXPOSED
(
CONTROL
COHORT)
c d (c + d)
TOTAL (a + c) (b + d)
ww
w.d
rjayesh
pa
tida
r.blo
gsp
ot.in
C) CONSIDERATIONS FOR MAKING A COHORT
i) Examine and exclude persons with disease
under study
ii) Both groups should be equally susceptible to
disease under study
iii) Both groups should be comparable
iv) Diagnostic and eligibility criteria defined
beforehand
v) Groups followed under similar conditions/time
vi) Well designed cohort study is most reliable
vii) If a/a + b is higher than c/c + d association is
suspected
ww
w.d
rjayesh
pa
tida
r.blo
gsp
ot.in

6) TYPES
a) Prospective
b) Retrospective
c) Combined
a) PROSPECTIVE COHORT STUDY :-
(also called “CURRENT”) – Cause to effect e.g.
Smoking and Ca Lung
b) RETROSPECTIVE COHORT STUDY :- (also
called “HISTORICAL”) – Effect to cause, records
are studied e.g. Lung Cancer uranium
miners, Life span of radiologists and exposure.
ww
w.d
rjayesh
pa
tida
r.blo
gsp
ot.in
Radiotherapy
records
c) COMBINED
Leukemia :- Rx for Ankylosing
spondylitis
followed in future also for occurrence
subsequently
ww
w.d
rjayesh
pa
tida
r.blo
gsp
ot.in

7) ELEMENTS OF COHORT STUDY
a) Selection of study subjects
b) Data collection of exposure
c) Selection of comparison groups
d) Follow up
e) Analysis
ww
w.d
rjayesh
pa
tida
r.blo
gsp
ot.in
a) SELECTION OF STUDY SUBJECTS
i) General population – when exposure is
frequent; should be residing in defined
geographical/ administrative areas.
Appropriate / Representative sample taken.
ii) Select groups – If exposure is rare i.e.
Doctors/Govt employees / obstetric cases
iii) Exposure groups – Only exposed ( X-Ray
exposures)
ww
w.d
rjayesh
pa
tida
r.blo
gsp
ot.in
b) OBTAINING DATA
i) Interview
ii) Records
iii) Questionnaire
iv) Medical exams
v) Environmental surveys
DATA
ww
w.d
rjayesh
pa
tida
r.blo
gsp
ot.in
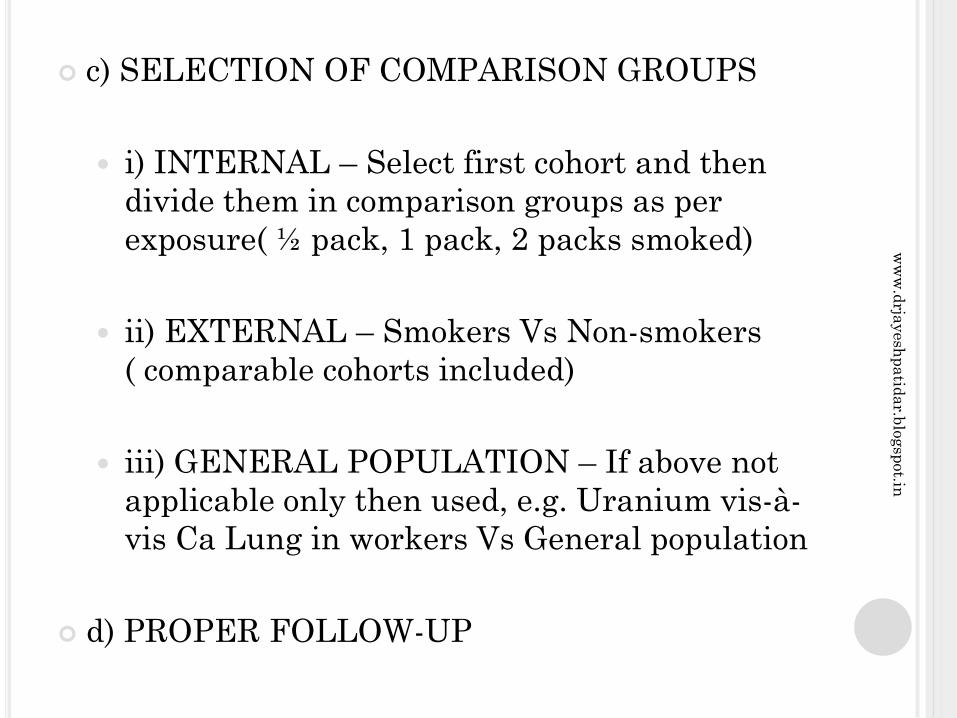
c) SELECTION OF COMPARISON GROUPS
i) INTERNAL – Select first cohort and then
divide them in comparison groups as per
exposure( ½ pack, 1 pack, 2 packs smoked)
ii) EXTERNAL – Smokers Vs Non-smokers
( comparable cohorts included)
iii) GENERAL POPULATION – If above not
applicable only then used, e.g. Uranium vis-à-
vis Ca Lung in workers Vs General population
d) PROPER FOLLOW-UP
ww
w.d
rjayesh
pa
tida
r.blo
gsp
ot.in
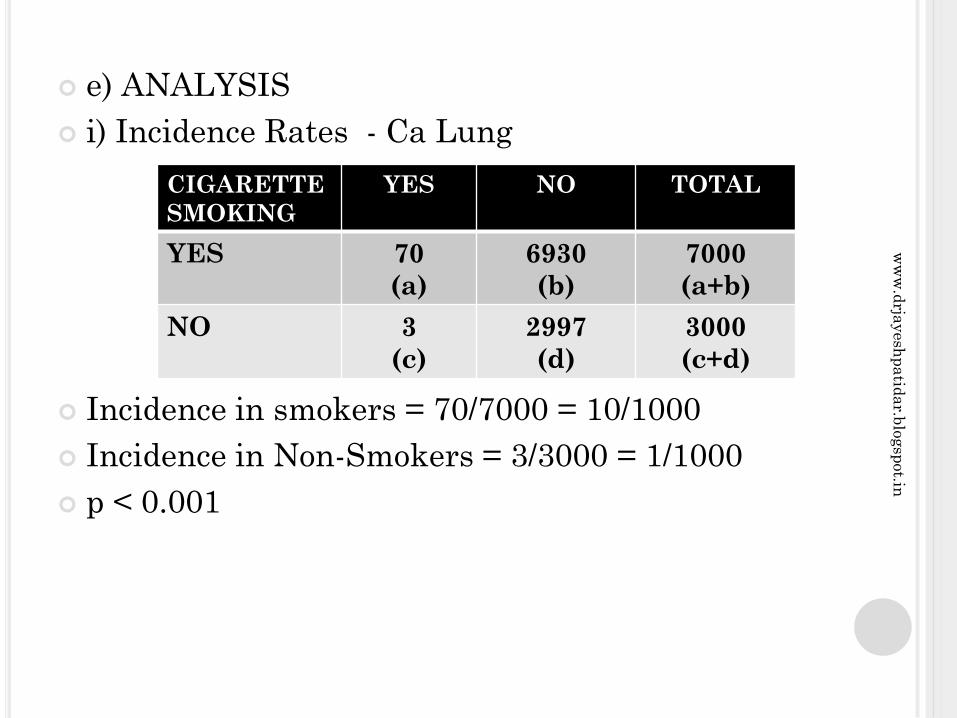
e) ANALYSIS
i) Incidence Rates - Ca Lung
Incidence in smokers = 70/7000 = 10/1000
Incidence in Non-Smokers = 3/3000 = 1/1000
p < 0.001
CIGARETTE
SMOKING
YES NO TOTAL
YES 70
(a)
6930
(b)
7000
(a+b)
NO 3
(c)
2997
(d)
3000
(c+d)
ww
w.d
rjayesh
pa
tida
r.blo
gsp
ot.in
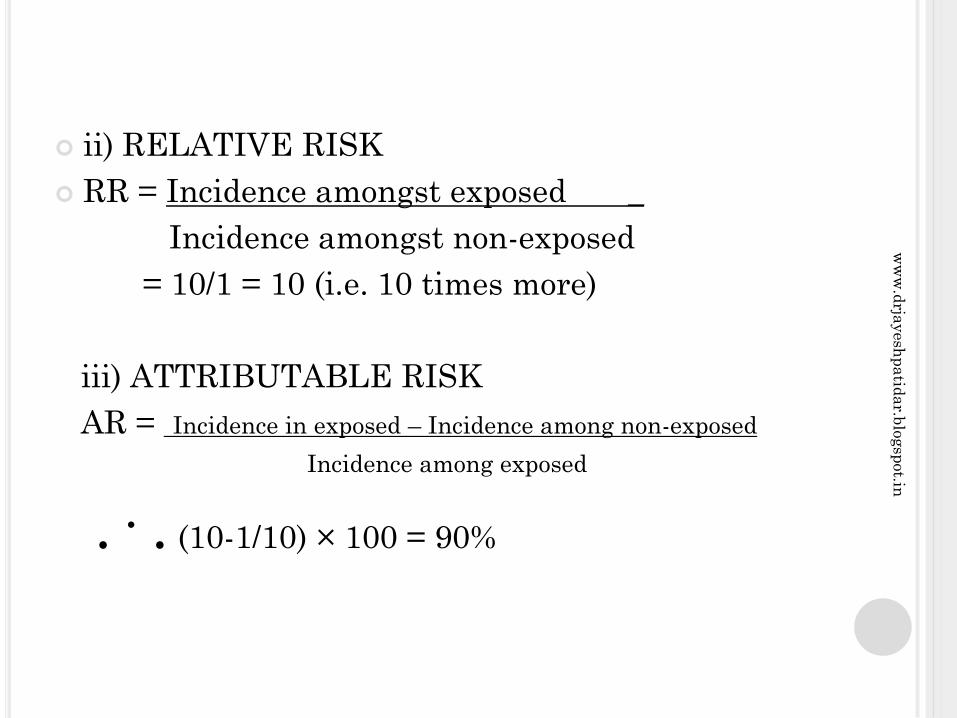
ii) RELATIVE RISK
RR = Incidence amongst exposed _
Incidence amongst non-exposed
= 10/1 = 10 (i.e. 10 times more)
iii) ATTRIBUTABLE RISK
AR = Incidence in exposed – Incidence among non-exposed
Incidence among exposed
.· . (10-1/10) × 100 = 90%
ww
w.d
rjayesh
pa
tida
r.blo
gsp
ot.in
8) ADVANTAGES
a) Incidence can be calculated
b) Several exposures can be studied simultaneously
c) Provide direct estimate of Relative Risk
d) Dose and response ratios can be calculated
e) Decreased bias
9) DISADVANTAGES
a) Large number of people are involved
b) More time, men, money, material
c) Difficult in chronic diseases
d) Extensive record keeping needed
e) Matching difficult
f) Study knowledge of risk may itself modify the cohort
behaviour.
ww
w.d
rjayesh
pa
tida
r.blo
gsp
ot.in

10) DIFFERENCES
S No CASE CONTROL STUDY COHORT STUDY
1 Proceed from “effect to cause” Proceeds from “cause to effect”
2 Starts with disease Starts with people exposed to
risk factor or suspected cause
3 Tests whether the suspected
cause occurs more frequently
in those with disease than
among those without the
disease
Tests whether disease occurs
more frequently in those
exposed, than in those not
similarly exposed
4 Usually the first approach to
the testing of a hypothesis,
but also useful for
exploratory studies
Reserved for testing precisely
formulated hypothesis
5 Involves fewer number of
subjects
Involves large number of
subjects
6 Yields relatively quick results Long follow-up period often
needed, involving delayed
results
ww
w.d
rjayesh
pa
tida
r.blo
gsp
ot.in

DIFFERENCES…….CONTD
S No CASE CONTROL STUDY COHORT STUDY
7 Suitable for study of rare
diseases
Inappropriate when the disease
exposure under investigation is
rare
8 Generally yields only
estimate of RR(Odds Ratio)
Yields Incidence rates, RR as
well as AR
9 Cannot yield information
about diseases other than
that selected for study.
Can yield information about
more than one disease outcome
10 Relatively inexpensive Expensive
CONCLUSION
THANX
ww
w.d
rjayesh
pa
tida
r.blo
gsp
ot.in

EXPERIMENTAL EPIDEMIOLOGY
1) INTRODUCTION – Historically (1920) meant
experiments in animals(rats, mice etc)
Now – Clinical trials. Conditions are under
control (Action / Intervention / manipulation)
with trial and control groups
2) AIMS –
a) Scientific proof
b) Measure efficacy and effectiveness of Rx,
prevention and control
3) ADDITIONAL PROBLEMS – Cost, Feasibility
and ethics.
ww
w.d
rjayesh
pa
tida
r.blo
gsp
ot.in
4) ANIMAL STUDIES :- Helped us in the past by
lab experiments of epidemics / herd immunity in
animals. Also gave knowledge about basic
medical sciences / drug trials / Rx etc.
a) APPLICATIONS
i) Experimental reproduction of human diseases
ii) Study of etiology
iii) Study pathogenesis
iv) Test efficacy of Rx and Prevention ( vaccines /
drugs)
v) Complete natural history of Disease
ww
w.d
rjayesh
pa
tida
r.blo
gsp
ot.in
b) ADVANTAGES
i) Easy breeding of Animals
ii) Easy manipulation
iii) Fast results
iv) Genetic studies possible
v) Cheaper
C) LIMITATIONS
i) All human diseases cannot be tested
ii) Conclusion not juxtaposable, extrapolatable
iii) Ethical issues ( SPCA)
ww
w.d
rjayesh
pa
tida
r.blo
gsp
ot.in

5) HUMAN EXPERIMENTS
a) Always needed
b) Essential when animal studies not possible
c) Studies by James Lind and Edward Jenner
d) Ethical and logistics issues
e) USA found 23% of 16000 drugs really effective
f) Thalidomide disaster
g) Leubek epidemic
6) TYPES :-
a) Randomized controlled clinical trials
b) Non-Randomized (i.e. not strictly randomized)
ww
w.d
rjayesh
pa
tida
r.blo
gsp
ot.in
STUDY DESIGNS OF CONTROLLED TRIALS
1) CONCURRENT PARALLEL DESIGN –Compare two random samples of patients exposed and non-exposed to specific treatment for duration of time.
2) CROSS-OVER DESIGN – Patient as his own control. Groups given test and control drug or placebo. Observed for a duration. Stopped both for a “wash-out” period and then switched and repeat crossover Rx.
ADVANTAGES
i) Patient as own control
ii) Less number of patients needed
iii) Less time needed.
ww
w.d
rjayesh
pa
tida
r.blo
gsp
ot.in
TYPES OF RANDOMIZED CONTROL TRIALS
1) CLINICAL TRIALS – Mainly drug trials. All
are not possible to be blinded( Tonsils – op and
non op Rx) Many ethical, administrative and
technical problems, but still are powerful tools
Therefore Necessary.
2) PREVENTIVE TRIALS Done for primary
prevention. Trials to eliminate / prevent diseases
e.g. Vaccine trials ( viz pertussis vaccine trial in
UK 1946) Attack rates decide efficacy
ww
w.d
rjayesh
pa
tida
r.blo
gsp
ot.in
a) Benefit by community must be clearly known
beforehand
b) Risks must be explained
c) Cost of 3M’s to health services must be
estimated.
3) RISK FACTOR TRIALS – e.g. IHD – modify
risk factors and conduct trials ( single / multiple)
4) CESSATION EXPERIMENTS – Evaluate
stopping of a habit i.e. Smoking Vs Ca Lung/ IHD
ww
w.d
rjayesh
pa
tida
r.blo
gsp
ot.in
5) TRIAL OF ETIOLOGICAL AGENT
Retrolental Fibroplasia causing blindness in
premature babies who received O2 therapy.
Trial group = 50% O2 therapy × 28 days ;
Control = 02. RLF ↑ in trial group. ( Difficult to
plan these trials, only in emergency)
6) EVALUATION OF HEALTH SERVICES –
They are planned to assess efficiency and
effectiveness of health services e.g. Domiciliary
Rx of TB Vs Hospital/ Sanatorium Rx. They are
also called “ Health Services Research” studies
ww
w.d
rjayesh
pa
tida
r.blo
gsp
ot.in
NON-RANDOMIZED TRIALS
1) INTRODUCTION – Randomized trials are
always better, more scientific and to be preferred.
But sometimes due to ethical, administrative,
logistic and feasibility problems on human
subjects make these difficult. Moreover long
follow-up on large number have limitations.
Therefore we do non-randomized trials. Here
approach is crude, comparability less and
chances of spurious results more (may be extra-
statistical judgment). However they are
acceptable when planned reasonably correct.
ww
w.d
rjayesh
pa
tida
r.blo
gsp
ot.in

2) EXAMPLES
a) UNCONTROLLED TRIALS – No control
group. However “historical controls” are used
from records e.g. Pap test for screening of Ca
Cervix cases
b) NATURAL EXPERIMENTS – Natural
circumstances mimic an experiment e.g. Smokers
/ Non-smokers are naturally separated into test
and control group. Observe incidence of Ca Lung
in them and draw hypothesis
ww
w.d
rjayesh
pa
tida
r.blo
gsp
ot.in
Other examples
a) Migrants
b) Religions
c) Social groups
d) Atomic bombing in Japan
e) Famines
f) Earthquakes
g) John Snow’s cholera investigation
C) BEFORE AND AFTER COMPARISON
STUDIES
i) Without control
ii) With control
ww
w.d
rjayesh
pa
tida
r.blo
gsp
ot.in

i) WITHOUT CONTROL – Comparison before
and after introducing preventive measures e.g.
John Snow’s Cholera investigation in 1854.
Needs for such trial :-
a) Incidence before and after intervention
essential
b) Manipulate only one factor
c) Diagnostic criteria clear and same
d) Adopt preventive measures over wide area
e) Several trials needed.
e.g. compulsory seat belts & ↓ of accidents
ww
w.d
rjayesh
pa
tida
r.blo
gsp
ot.in
ii) WITH CONTROL – e.g. Seat belt Vs accidents
in states where it is compulsory Vs not.
Considerations
a) How much benefit ? Effectiveness, acceptance
compared.
b) What are the risks to recipients ? Immediate
and long term risks estimated.
c) Cost in money and manpower. Check
economics, practicability and feasibility.
CONCLUSION
THANX
ww
w.d
rjayesh
pa
tida
r.blo
gsp
ot.in

ASSOCIATION AND CAUSATION
1) INTRODUCTION – Descriptive studies help
indicate a hypothesis by studying time, place
person, agent, host and environment. Suggest
possible etiological hypothesis. Analytical and
experimental studies test it i.e. confirm/ refute
association
2) DEFINITION
a) ASSOCIATION – When events occur together
frequently not by chance.
b) CO-RELATION -1.0 to +1.0 , however co-
relation does not imply causation
ww
w.d
rjayesh
pa
tida
r.blo
gsp
ot.in

3) TYPES OF ASSOCIATION
a) SPURIOUS
b) INDIRECT
c) DIRECT
i) One to one causal
ii) Multifactorial
ww
w.d
rjayesh
pa
tida
r.blo
gsp
ot.in

a) SPURIOUS – Sometimes association between
disease and suspected factor is not real.
E.g. In perinatal mortality study, hospital delivery
rates were 27.8/1000 and home delivery rates
were 5.4/1000 . But this association may be
spurious because of high risk pregnancy in
hospital and other confounding variables. i.e.
“like” not compared with “like” – Selection bias
ww
w.d
rjayesh
pa
tida
r.blo
gsp
ot.in
b) INDIRECT ASSOCIATION – May appear causal but further study may show indirect association. There may be presence of 3rd factor common to disease and charecteristic and may show statistical association ( confounding)
E.g. a) Iodine deficiency → Altitude
→ Endemic goitre
( Statistical association does not necessarily mean causation)
b) Consumption of Sucrose and CHD
↑ Sugar – more MI, but later studies showed cigarette smoking → high frequency tea
Therefore ↑ Sugar – more MI ( later studies showed no association between ↑ Sugar and MI)
However indirect association is also useful e.g John Snow’s study of polluted water and Cholera
ww
w.d
rjayesh
pa
tida
r.blo
gsp
ot.in
c) DIRECT ASSOCIATION ( CAUSAL)
i) One to One causal relationship – Change in
A is followed by change in B i.e. when cause
present – disease results and vice versa
Eg. Koch’s postulates
However other problems –
a) Cause may not be manipulable ( as direct
experiment may not be possible)
b) One cause may lead to many diseases
E.g. Haemolytic streptococcus – tonsillitis
- Scarlet fever
- Erysipelas
ww
w.d
rjayesh
pa
tida
r.blo
gsp
ot.in

ii) MULTIFACTORAL CAUSATION
Factor 1 (Smoking)
Factor 2 ( Air pollution) Disease (Ca Lung)
Factor 3 ( Asbestos)
Synergistic
Factor 1 (Obesity)
Factor 2 (Stress) Cumulative Disease
Factor 3 (LDL↑ ) effect ( IHD)
ww
w.d
rjayesh
pa
tida
r.blo
gsp
ot.in
ADDITIONAL CRITERIA FOR CAUSALITY
1) Temporal association
2) Strength of Association
3) Specificity
4) Consistency
5) Biological plausibility
6) Coherence of association
CONCLUSION –
i) Many factors to be studied
ii) Cause “necessary” and “sufficient” but not always reached
iii) Additional criteria important
THANX
ww
w.d
rjayesh
pa
tida
r.blo
gsp
ot.in

ADDITIONAL CRITERIA FOR CAUSALITY
1) INTRODUCTION – When controlled experimental evidence absent, additional criteria have been devised to ascertain causal association.
2)CLASSICAL EXAMPLE – “Smoking and Health”Report of PH Service of US ( 1964) Bradford Hill & many others have shown causal association by presence of following factors :-
1) Temporal association
2) Strength of Association
3) Specificity
4) Consistency
5) Biological plausibility
6) Coherence of association
ww
w.d
rjayesh
pa
tida
r.blo
gsp
ot.in

3) PHILOSOPHY – Causal significance of
any association is matter of judgment
beyond statistical probability. All above
criteria must be utilized. No one by itself is
self-sufficient. All add up to quantum of
evidence and put together contribute to the
probability of causal association.
ww
w.d
rjayesh
pa
tida
r.blo
gsp
ot.in

ASSOCIATION BETWEEN CIGARETTE
SMOKING AND LUNG CANCER
1) Provides excellent example for above criteria.
a) Temporal Association – Does the suspected
cause precede observed effect?
This is essential for causal association. In
acute diseases to establish this is not difficult as
latency is less, but in chronic disease it has to be
present for long time e.g. Smoking – temporal
association. Observations are compatible to long
latent period required for carcinogenesis.
ww
w.d
rjayesh
pa
tida
r.blo
gsp
ot.in
b) Strength of Association – Depends on :-
i) Relative Risk (RR) – Is it large ?
ii) Dose – response and duration response relation ?
a) Larger the RR, ↑ causal relationship.
b) ↑ dose – response, ↑ causal relation.
c) ↑ duration – response, ↑ causal relation
If absent, argument against causal effect
Decrease on stopping exposure, ↑ relation
All above are noticed in smoking and Ca Lung
ww
w.d
rjayesh
pa
tida
r.blo
gsp
ot.in
c) SPECIFICITY OF ASSOCIATION – Decides one – to – one cause and effect relationship.
Problems
i) Single cause can produce many diseases e.g. Smoking.
ii) Multifactorial etiology makes it difficult to show one – to – one relation.
iii) Specify one single cause responsible is difficult e.g. Tobacco has CO, Nicotine, Hydrocarbons. Even then causal association exists. Specificity supports causal relation but lack of it does not negate it ! Paradox :- Everyone who smokes does not get Ca Lung and vice versa, still causal association accepted on available evidence
ww
w.d
rjayesh
pa
tida
r.blo
gsp
ot.in
d) Consistency of Association– More than one
(many) studies should consistently show
association (done by different workers in
different settings e.g. Smoking – Ca Lung)
e) Biological Plausibility e.g. Smoke and Lung
tissue, Nutritional diet and GI Tract (supported
by animal studies). Carcinogens isolated from
smoke prove credibility of hypothesis.
f) Coherence of Association ↑ quantity of
tobacco & ↑ Ca Lung. ↑ smoking in women & ↑ Ca
Lung in women. ↑ death rates with ↑ smoking, ↓
when stopped.
ww
w.d
rjayesh
pa
tida
r.blo
gsp
ot.in
CONCLUSION
- Direct experimental proof in Humans difficult.
- Inferences drawn on collective and convincing
evidence in favour and against by long term
studies in epidemiology.
THANX
ww
w.d
rjayesh
pa
tida
r.blo
gsp
ot.in
CONFOUNDING AND BIAS
1) INTRODUCTION - These are to be avoided
and taken care of in any experiment and
epidemiological investigation and analysis,
failing which faulty deductions get drawn.
2) Confounding – They are variables which are
present, which may influence the outcome of
cause and effect relationship.
ww
w.d
rjayesh
pa
tida
r.blo
gsp
ot.in

Example – Article in “International Journal of
Quackery” – “ Metronidazole causes Jaundice”
Abstract – We gave this drug ( Metronidazole 400mg
with permitted colour, “ Amaranth” to 100 patients of
Giardiasis. 80 developed deep yellow urine.
Conclusion – Medicine causes Jaundice in 80% of
patients.
This research is outright unscientific.
Defects :- Incorrect investigations, No scientific
criteria used.
You protest
Reply :- Sorry . Revised conclusion – “ metronidazole
causes yellow urine” AGAIN WRONG.
After controlled trial we know it is dye and not drug.
ww
w.d
rjayesh
pa
tida
r.blo
gsp
ot.in

3) Properties of a Confounder –
a) Associated with exposure of interest.
b) Independent of exposure and confuse outcome
c) Association indirect.
4) Difference between Confounding and
Bias
Bias – To be identified and avoided in planning /
designing.
Confounding – Identify, control by
randomization, matching, testing dummy tables.
If found at later stage adjust during analysis.
E.g. Alcohol & IHD ( confounding are smoking,
obesity, sex, lack of exercise and nutrition.
ww
w.d
rjayesh
pa
tida
r.blo
gsp
ot.in
5) Controlling for Confounding
a) Randomization
b) Restriction – Do not include suspected Potential
Confounding Factors (PCF) in the study
c) Matching
Ex – Tobacco user in trial and control groups.
6) Adjustment during Analysis – By using
appropriate statistical measures like
standardization, stratified analysis, multiple
regression analysis, logistic regressions and so
on.
CONCLUSION
THANX
ww
w.d
rjayesh
pa
tida
r.blo
gsp
ot.in
USES OF EPIDEMIOLOGY
a) Study of history of health of populations and
study rise/ fall/ change in character of disease
b) Diagnose health of community
c) Study working of health services
d) Estimate individuals risk
e) Describe natural history of disease
f) Identify syndromes
g) Search for causes of health and disease
ww
w.d
rjayesh
pa
tida
r.blo
gsp
ot.in

MODES OF TRANSMISSION
1) DIRECT CONTACT – Skin to skin or mucosa to
mucosa – touching, kissing and sexual
intercourse
2) DROPLET – Coughing, sneezing etc. increased
by overcrowding/ ↓ ventillation
3) CONTACT WITH SOIL
4) INDIRECT – Flies, Fingers, Fomites, Food and
Fluids
5) VEHICLE BORNE – Water, food, blood, organ
transplant. ( Explosive, severe, over long
distance, isolation of agent possible, common
source infection)
ww
w.d
rjayesh
pa
tida
r.blo
gsp
ot.in
6) VECTOR BORNE
a) Mechanical
b) Biological
i. Propogative
ii. Cyclopropagative
iii. Cyclodevelopmental
iv. Transovarian
v. Trans-stadial
7)AIR BORNE
a) Droplet nuclei
b) Dust
8) TRANSPLACENTAL(VERTICAL)
ww
w.d
rjayesh
pa
tida
r.blo
gsp
ot.in
9) VACCINES
a) Live
b) Killed
c) Toxoids
d) Immunoglobulins
e) Antisera
10) DISEASE PREVENTION AND CONTROL
a) Control source/ reservoir
b) Control transmission
c) Protect host
ww
w.d
rjayesh
pa
tida
r.blo
gsp
ot.in

a) Reservoir
i. Early diagnosis and treatment
ii. Notification
iii. Epidemiological investigation
iv. Isolation
v. Treatment
vi. Quarantine
b) Control transmission
c) Protect susceptible host (UIP)
11) CONCLUSION
ww
w.d
rjayesh
pa
tida
r.blo
gsp
ot.in

7) INDICATORS OF HEALTH
a) Mortality1. CDR
2. Life expectancy
3. IMR
4. MMR
b) Morbidity
c) Disability
d) Nutritional
e) Health care delivery
f) Utilization
g) Social / mental health
h) Environmental
j) Socio-economic
k) Quality of life
8) CONCLUSION
ww
w.d
rjayesh
pa
tida
r.blo
gsp
ot.in

DISEASE DYNAMICS1)
2) SOURCE
a) Human cases – Clinical
- Sub – clinical
b) Animal
c) Inanimate
d) Human carriersi. Incubatory
ii. Convalescent
iii. Healthy
a) Temporary
b) Chronic
SOURCE
OR
RESERVOIR
SUSCEPTIBLE
HOSTMODE OF
TRANSMISSION
ww
w.d
rjayesh
pa
tida
r.blo
gsp
ot.in

3)
a) Primary case
b) Index case
c) Secondary cases
4) Secondary attack rate
No. developing disease during incubation period × 100
No. of susceptible exposed to index case
ww
w.d
rjayesh
pa
tida
r.blo
gsp
ot.in
Solving Community Health Problem
a) Definition of the problem
b) Appraisal of existing facts
c) Formulation of hypothesis
d) Testing the hypothesis
e) Conclusions / Recommendations
ww
w.d
rjayesh
pa
tida
r.blo
gsp
ot.in
DEFINITIONS
1) INFECTION
2) CONTAMINATION
3) INFESTATION
4) INFECTIOUS
DISEASE
5) CONTAGIOUS
DISEASE
6) COMMUNICABLE
DISEASE
7) NON-
COMMUNICABLE
DISEASE
8) EPIDEMIC
9) ENDEMIC
10)SPORADIC
11)PANDEMIC
12) EXOTIC DISEASE
13) ZOONOSES
14) EPIZOOTIC
15) ENZOOTIC
16) NOSOCOMIAL
INFECTION
17) OPPORTUNISTIC
INFECTION
18) IATROGENIC
19) SURVEILLANCE
20) ERADICATION
ww
w.d
rjayesh
pa
tida
r.blo
gsp
ot.in

MODES OF TRANSMISSION
1) CONTACT – DIRECT
- INDIRECT
2) VEHICLE BORNE
3) VECTOR BORNE
4) AIR BORNE
5) TRANSPLACENTAL
ww
w.d
rjayesh
pa
tida
r.blo
gsp
ot.in

IMMUNITY
IMMUNITY
INNATE (BASIC)
ACQUIRED
ACTIVE
NATURAL ARTIFICIAL
PASSIVE
NATURAL ARTIFICIAL
HERD IMMUNITY
ww
w.d
rjayesh
pa
tida
r.blo
gsp
ot.in
INVESTIGATION
OF AN
EPIDEMIC
INVESTIGATION OF AN EPIDEMIC
Outbreak of any disease is due to shift in balance
between agent, host & environment.
Usually causes a lot of concern & attention and
needs a well practiced, deliberate response by the
medical teams.
Epidemiological principles must be correctly
used.
ww
w.d
rjayesh
pa
tida
r.blo
gsp
ot.in

OBJECTIVES
Define magnitude in terms of person, place &
time distribution.
Determine conditions, factors responsible for the
outbreak.
Identify cause, source of infection, modes of
transmission & plan control measures.
Make recommendations to prevent recurrence.
ww
w.d
rjayesh
pa
tida
r.blo
gsp
ot.in

INVESTIGATION STEPS
Verify Diagnosis
Confirm existence of outbreak
Define population at risk
Rapid search for ALL cases
Data Analysis
ww
w.d
rjayesh
pa
tida
r.blo
gsp
ot.in
INVESTIGATION STEPS
Formulation of Hypothesis
Testing of Hypothesis
Evaluation of ecological factors
Further investigation of population at risk
Writing the report
ww
w.d
rjayesh
pa
tida
r.blo
gsp
ot.in

1.VERIFICATION OF DIAGNOSIS
Spurious reports are quite common.
Not necessary to examine all the cases.
Confirm by clinical evaluation of a
sample no. of patients.
Lab investigations if required.
ww
w.d
rjayesh
pa
tida
r.blo
gsp
ot.in

2. CONFIRM EXISTENCE OF EPIDEMIC
Compare disease frequencies ( incidence/
prevalence )
Epidemic if MORE than “ Normal Expectancy”.
Usually more than 2 standard errors from mean.
Often common source outbreaks – food
poisoning, Cholera etc. need no such comparison.
Modern epidemics – IHD, Cancer less easily
discernible.
ww
w.d
rjayesh
pa
tida
r.blo
gsp
ot.in

3.DEFINING POPULATION AT RISK
Obtain a map of area – with all
dwelling units, water sources, natural
landmarks, population numbers.
Population has to be counted for -
“population at risk”
It maybe entire population of an area –
census with age, sex distribution –
necessary to decide the “attack rate”
ww
w.d
rjayesh
pa
tida
r.blo
gsp
ot.in
4.RAPID SEARCH FOR ALL CASES
Medical Survey - of all undiagnosed cases in
the population who may not have reported/ self-
medicated/ got treated elsewhere.
Epidemiological case sheet – All relevant
data is collected by the trained health workers –
details of age, sex, occupation, social class, travel
history, past history, history of onset, details of
signs & symptoms, contacts at home, workplace,
school etc. History of intake of food items,
consumption of water, receipt of blood products.
Incase a large no. – Sample survey.
ww
w.d
rjayesh
pa
tida
r.blo
gsp
ot.in
4.RAPID SEARCH FOR ALL CASES
Searching for more cases - Search for
secondary cases to be carried out
everyday at all hospitals, nursing homes,
clinics as well as from informants in the
community.
Continue till no more cases are found
and area is free of epidemic – usually
TWICE the MAXIMUM incubation
period of the disease since the last case.
ww
w.d
rjayesh
pa
tida
r.blo
gsp
ot.in

5.DATA ANALYSIS
Time distribution – Chronological distribution of dates of onset; construct an “epidemic curve”
Time relation with exposure to suspected source
Common source/ Propagated source
Seasonal/cyclical pattern
Place distribution – Make a “spot map” denoting location of cases – geographical clustering of cases near common source of exposure – water, air, food etc.
ww
w.d
rjayesh
pa
tida
r.blo
gsp
ot.in

ww
w.d
rjayesh
pa
tida
r.blo
gsp
ot.in
5.DATA ANALYSIS
Person distribution - Age/ sex/ occupation etc. analysed for risk factor ; attack rate ; CFR for those exposed with respect to those not exposed to the risk factor.
In Food poisoning, attack rate is taken for specific food items.
Purpose of data analysis is to determine any common event /experience, and to delineate the groups at risk due to this common experience.
ww
w.d
rjayesh
pa
tida
r.blo
gsp
ot.in

6.FORMULATION OF HYPOTHESIS
Based on person-place-time distribution or
the Agent, Host, Environment model,
formulate a hypothesis explaining the
epidemic in terms of –
Possible source
Causative agent
Possible modes of spread
Environmental factors which enabled
spread
ww
w.d
rjayesh
pa
tida
r.blo
gsp
ot.in
7.TESTING OF HYPOTHESIS
All reasonable hypothesis are considered
and evaluated – comparisons of attack
rates for each group of exposed with
suspected exposure is analysed ; the
most reasonable hypothesis has to be
accepted by the epidemiologist.
ww
w.d
rjayesh
pa
tida
r.blo
gsp
ot.in

8.ECOLOGICAL FACTORS WHICH MAY HAVE
CONTRIBUTED
Sanitary condition – eating establishments
Water & milk supply
Breakdown in water supply system
Human movements – disasters, wars
Population dynamics of vectors – insects,
animals.
Correlation with source of infection, reservoir &
modes of transmission.
ww
w.d
rjayesh
pa
tida
r.blo
gsp
ot.in
9.FURTHER INVESTIGATION OF
POPULATION-AT-RISK
Further tests for more specific diagnosis
Tests of food / water samples
Serological studies for clinically
inapparent cases
Classification of exposure and those at
risk
ww
w.d
rjayesh
pa
tida
r.blo
gsp
ot.in
10.WRITING THE REPORT
Background –
Geographic location
Climatic condition
Demography
Organisation of health services
Existence of early warning systems
Normal diseases prevalence
ww
w.d
rjayesh
pa
tida
r.blo
gsp
ot.in
10.WRITING THE REPORT
Historical data –
Epidemics in same / nearby area
Same disease / related disease
First case discovered in present outbreak
Methodology of investigation –
Case definition
Questionnaire used – epidemiological inv.
Survey teams – household/ retrospective/
prospective/ lab specimens & procedures
ww
w.d
rjayesh
pa
tida
r.blo
gsp
ot.in
10.WRITING THE REPORT
Analysis of data –
1. Clinical data -
Frequency of signs & symptoms
Course of disease
Differential diagnosis
Death / sequelae rates
2. Epidemiological data –
Mode of occurrence – time/ place/ person
distribution
ww
w.d
rjayesh
pa
tida
r.blo
gsp
ot.in
10.WRITING THE REPORT
Modes of transmission –
Source of infection
Route of excretion/ portal of entry
Factors influencing transmission
3. Laboratory data –
Isolation of agent
Serological confirmation
Significance of result
ww
w.d
rjayesh
pa
tida
r.blo
gsp
ot.in

10.WRITING THE REPORT
4. Interpretation of data –
Comprehensive picture of outbreak
Hypothesis of cause
Formulation & testing of hypothesis –
statistical analysis
ww
w.d
rjayesh
pa
tida
r.blo
gsp
ot.in

10.WRITING THE REPORT
Control measures –
Define strategies / methodology of
implementation – constraints, results
Evaluation of these measures – efficacy of
results, cost effectiveness
Any other preventive measures suggested.
ww
w.d
rjayesh
pa
tida
r.blo
gsp
ot.in

SUSCEPTIBLE HOST
1) Successful Parasitism – four stages
a) Portal of entry – respiratory, ailmentary,
genito-urinary or skin ( can be more than one e.g.
viral hepatitis)
b) Site of choice / election for optimum conditions
c) Portal of exit ( otherwise dead end infection )
d) Survival externally till new host found.
Note :- Produce low grade immunity and no
death.
ww
w.d
rjayesh
pa
tida
r.blo
gsp
ot.in
2) Incubation period –
a) Define
b) Multiplies till sufficient density, equilibrium
lost, disease signs appear
c) “Median incubation period” – Time taken by
50% to occur after exposure
3) Factors determining incubation period
a) Generation time :- Receipt – Mass
infectivity
b) infective dose
c) Portal of entry
d) Individual susceptibility
Note – It is minimum / maximum / different
ww
w.d
rjayesh
pa
tida
r.blo
gsp
ot.in
4) Latent period – Non-infectious disease :-Initiation to detection ( not well understood)
5) Importance
a) Tracing source/contacts
b) Period of surveillance
c) Immunization
d) Point source or propagated epidemics
e) Prognosis
6) Serial Interval – Gap between primary and secondary case.
7) Communicable period.
8) Secondary Attack Rate –
No. developing disease × 100
Susceptible
ww
w.d
rjayesh
pa
tida
r.blo
gsp
ot.in
9) Host Defences –
a) Local
b) Systemic
c) Non-Specific
d) Specific
e) Humoral
f) Cell Mediated
g) They are overlapping
h) Vertical immunity ( IgG, IgM + Breast milk)
ww
w.d
rjayesh
pa
tida
r.blo
gsp
ot.in

10) Specific Defences – Recognize, destroy and
eliminate antigens
a) Active Immunity
i) Humoral
ii) Cellular
iii) Combined
b) Passive Immunity
i) Normal Human IgG
ii) Specific Human IgG
iii) Animal anti-toxins and anti-sera
ww
w.d
rjayesh
pa
tida
r.blo
gsp
ot.in
a) Active Immunity
i) Specific for a disease.
ii) Following sub-clinical / clinical infection
iii) Immunization – Live/Killed/Toxoids
iv) Primary response
v) Secondary/Booster response
vi) Factors determining extent of response -
a) Dose of Antigen
b) Nature
c) Route of Administration
d) Adjuvants
e) Nutrition / Health of the host
f)IgG response requires × 50 dose than IgM
g) Immunological memory developed
PRIMARY
ww
w.d
rjayesh
pa
tida
r.blo
gsp
ot.in
Booster –
a) Short latent period
b) Antibodies ↑ and rapid
c) Maintained for long
d) Capacity ↑
e) Basis for vaccination and re-vaccination
vii) Humoral Immunity – B-cells ( bone marrow lymphocytes)
- IgG, IgM, IgA, IgD & IgE – Circulate, neutraliseand are specific.
viii) Cellular Immunity – T-cells, ↑ resistance (mainly TB, Leprosy)
ix) Combined - Synergestic
SECONDARYww
w.d
rjayesh
pa
tida
r.blo
gsp
ot.in

x) Factors affecting maintenance of Immunity –
a) Threshold of resistance
b) Susceptibility
c) Physiological state
d) Fatigue
e) Age
f) Drugs
g) Diet
h) Emotional shock
b) Passive Immunity
i) Antisera
ii) Immune human globulins
iii) Maternal – Placenta, Milk
ww
w.d
rjayesh
pa
tida
r.blo
gsp
ot.in
Attributes –
1) Ready-made
2) Temporary
3) No immune memory
4) Less effective
C) Herd Immunity
ww
w.d
rjayesh
pa
tida
r.blo
gsp
ot.in
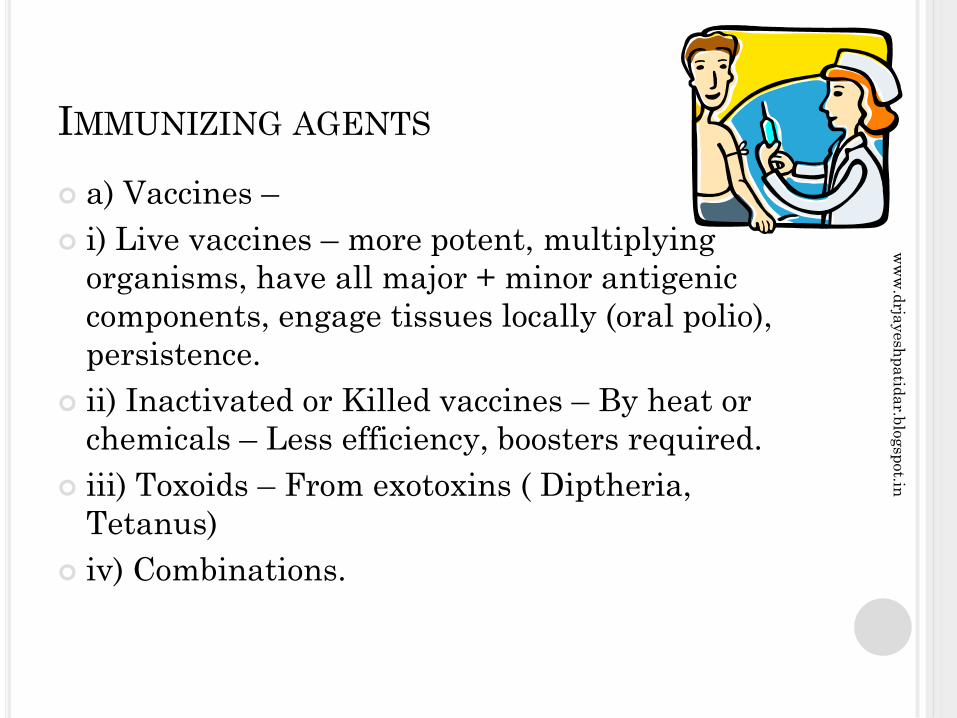
IMMUNIZING AGENTS
a) Vaccines –
i) Live vaccines – more potent, multiplying
organisms, have all major + minor antigenic
components, engage tissues locally (oral polio),
persistence.
ii) Inactivated or Killed vaccines – By heat or
chemicals – Less efficiency, boosters required.
iii) Toxoids – From exotoxins ( Diptheria,
Tetanus)
iv) Combinations.
ww
w.d
rjayesh
pa
tida
r.blo
gsp
ot.in

b) Immunoglobulins – IgG, IgM, IgA, IgD, IgE
c) Antisera
i) Animal origin
ii) ATS, ADS, AGS, Anti - snake venom
iii) Testing essential
12) COLD CHAIN
ATTENUATED
VACCINES
KILLED VACCINES
VACCINE DOSE LOW (REPLICATES) HIGH
ANTIBODY
PERSISTENCE
LONG SHORT
BOOSTER NEEDED INFREQUENTLY FREQUENTLY
REVACCINATION POSSIBLE NONE
LATENCY POSSIBLE NONE
ONCOGENICITY ? NONE
ww
w.d
rjayesh
pa
tida
r.blo
gsp
ot.in
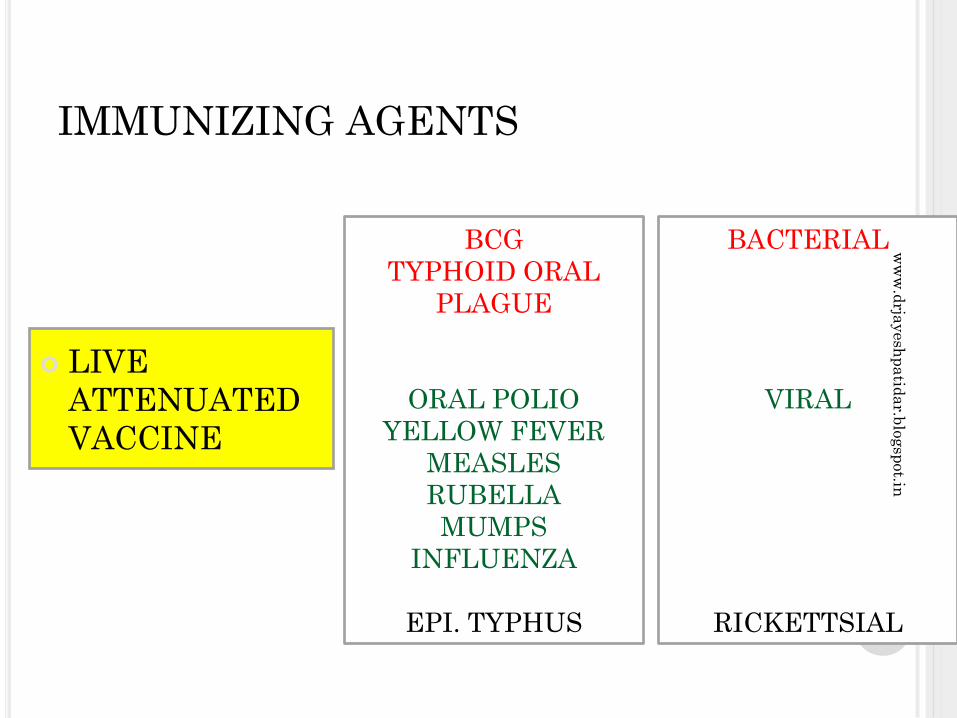
IMMUNIZING AGENTS
BCG
TYPHOID ORAL
PLAGUE
ORAL POLIO
YELLOW FEVER
MEASLES
RUBELLA
MUMPS
INFLUENZA
EPI. TYPHUS
LIVE
ATTENUATED
VACCINE
BACTERIAL
VIRAL
RICKETTSIAL
ww
w.d
rjayesh
pa
tida
r.blo
gsp
ot.in

TYPHOID
CHOLERA
PERTUSSIS
C.S.MENINGITIS
PLAGUE
SALK (POLIO)
RABIES
INFLUENZA
HEPATITIS B
JAPANESE –
ENCEPHALITIS
KFD
INACTIVATED
KILLED
VACCINE
BACTERIAL
VIRAL
TOXOIDS
DIPHTHERIA
TETANUS
BACTERIAL
ww
w.d
rjayesh
pa
tida
r.blo
gsp
ot.in
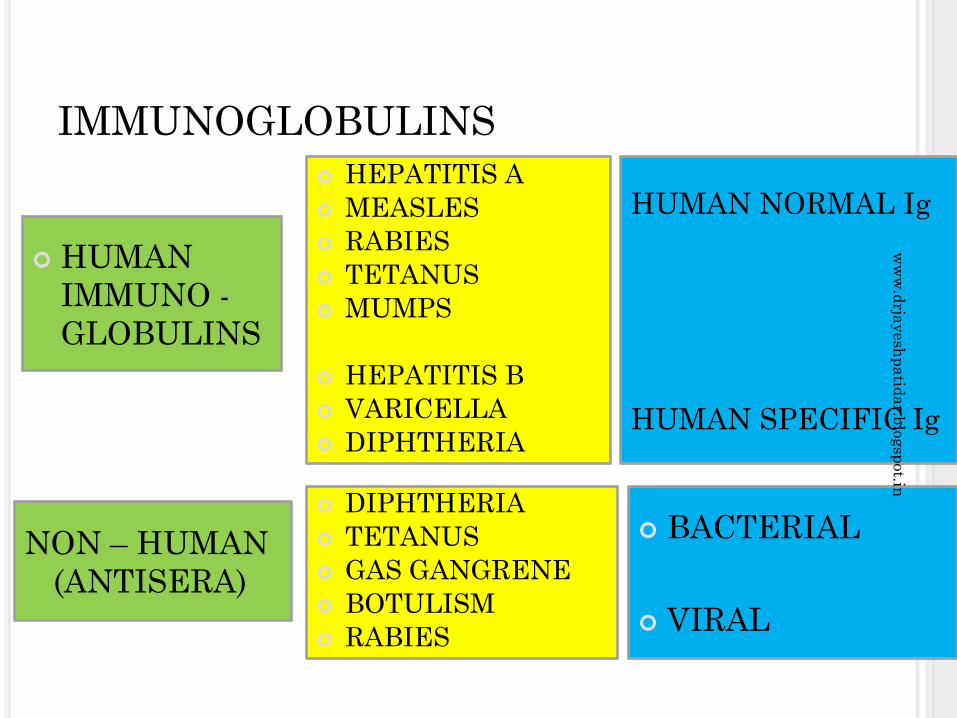
IMMUNOGLOBULINS
HUMAN
IMMUNO -
GLOBULINS
HUMAN NORMAL Ig
HUMAN SPECIFIC Ig
HEPATITIS A
MEASLES
RABIES
TETANUS
MUMPS
HEPATITIS B
VARICELLA
DIPHTHERIA
NON – HUMAN
(ANTISERA)
DIPHTHERIA
TETANUS
GAS GANGRENE
BOTULISM
RABIES
BACTERIAL
VIRAL
ww
w.d
rjayesh
pa
tida
r.blo
gsp
ot.in

NATIONAL IMMUNIZATION SCHEDULE
Vaccine Age
Birth 6 weeks 10 weeks14weeks
9-12months
Primary vaccination
BCG X
Oral polio X X X X
DPT X X X
Hepatitis B* X X X
Measles X
Booster Doses
DPT + Oral polio
16 to 24 months
DT 5 years
Tetanus toxoid (TT)
At 10 years and again at 16 years
Vitamin A 9, 18, 24, 30 and 36 months
Pregnant women
Tetanus toxoid (PW): 1st dose
2nd dose
Booster
As early as possible during pregnancy (first contact)
1 month after 1st dose
If previously vaccinated, within 3 years
ww
w.d
rjayesh
pa
tida
r.blo
gsp
ot.in

HAZARDS OF IMMUNIZATION
a) Local reactions + General symptoms
b) Reaction due to faulty technique
c) Hypersensitivity reactions
d) Neurological
e) Provocative reaction.
ww
w.d
rjayesh
pa
tida
r.blo
gsp
ot.in

DISINFECTION
1) INTRODUCTION – SEMMELWEIS (1818 1865) demonstrated hand washing with antiseptics reduced puerperal fevers. LISTER (1897 – 1912) used prophylactic antiseptics for wounds.
2) ADVANTAGES –
i) Controls sepsis
ii) ↓ disease transmission / spread
iii) Rx of local infections
iv) Cost ↓ - effective
v) Cleanliness
vi) Easy
ww
w.d
rjayesh
pa
tida
r.blo
gsp
ot.in

3) DEFINITIONS
a) Disinfectant – Substance which destroys
pathogenic microbes but not necessarily spores
b) Antiseptic – Destroys or inhibits growth of
microbes
c) Deodorant
d) Sterilization
e) Disinfection
4) TYPES –
a) Concurrent
b) Terminal
c) Prophylactic
ww
w.d
rjayesh
pa
tida
r.blo
gsp
ot.in

5) AGENTS
i. Natural
ii. Sunlight
iii. Air
b) Physical
i) Burning
ii) Hot air
iii) Boiling
iv) Autoclaving
v) Radiation
c) Chemical – Done for articles which cannot be
boiled or autoclaved. Used for faeces & urine/
contaminated water.
ww
w.d
rjayesh
pa
tida
r.blo
gsp
ot.in

Chemical agents – Wide range available with advantages / disadvantages
Phenol and related compounds
a) Phenol ( Carbolic acid) – Best known. Also reference standard i.e. R W co-efficient. Used as 10%, 5% for mopping floors
b) Cresol – Excellent, 3 to 10 times more powerful yet not toxic. 5 – 10% for faeces / urine. For 5% - add 50ml to one litre of water. It is all purpose disinfectant.
c) Saponified cresol emulsions – Lysol, Cyllin – used as 2% solution for faeces (powerful disinfectant)
d) Chlorhexidine (Hibitane) - Very good skin antiseptic. 0.5% alcohol solution as hand lotion. 1% cream for burns
e) Dettol – 5% for instruments, plastics and wounds. Minimum 15 min contact
ww
w.d
rjayesh
pa
tida
r.blo
gsp
ot.in

2) Quarternary Ammonia compounds
a) Cetrimide (cetavlon) – 1 – 2% strength
b) Savlon (cetavlon + hibitane) 1:6 spirit
3) Halogens
a) Bleaching powder – Disinfect water, urine, faeces and as deodorant.
b) Sod. Hypochlorite – Stronger (feeding bottles)
c) Halazone tablets – 4mg tablet/litre for ½ to 1hr
d) Iodine – 1 – 2% in alcohol
4) Alcohol – 70% spirit
5) Formaldehyde – rooms, blankets, beds, books
6) Miscellaneous – Lime (quick) 10-20% (2hrs period)
ww
w.d
rjayesh
pa
tida
r.blo
gsp
ot.in

DISINFECTION PROCEDURES
1)Faeces & Urine
a) Collect in impervious vessel + equal quantity of bleaching powder (5%), crude phenol(10%), Cresol 5%, Formalin 10% (contact 2 hrs)
b) Boiling water
c) Bedpans – Steam, 2.5% cresol
2) Sputum – Burning, boiling or 5% cresol
3) Room – Clean; air, sunlight, bleaching powder, 2.5% Cresol, 1% Formaldehyde (4hrs)
Formaldehyde – 1:2 ratio with water.
CONCLUSION
THANX
DISINFECTION TESTS
ww
w.d
rjayesh
pa
tida
r.blo
gsp
ot.in

NUTITIONAL SURVEILANCE
1) INTRODUCTION - It is same as disease
surveillance. “Keeping watch over nutrition in
order to make decisions to improve population
nutrition”
2) OBJECTIVES
a) Aid long term planning in health and
development
b) Provide programme management and
evaluation
c) Timely warning and intervention to prevent
short-term food consumption crisis.
ww
w.d
rjayesh
pa
tida
r.blo
gsp
ot.in
3) Difference in Surveillance Vs Growth monitoring
a) Growth Monitoring – Oriented to individual
child
b) Nutritional surveillance – Sample children from
community and compare overall nutrition
condition
ww
w.d
rjayesh
pa
tida
r.blo
gsp
ot.in

FACTOR GROWTH
MONITORING
NUTRITIONAL
ASSESSMENT
STRATEGY Preservation of
normal growth
Detection of
undernutritioin
APPROACH Educational –
motivational
Diagnostic –
interventional
ENROLMENT All infants Representative
sample
AGE Start before 6 months
and continue monthly
Representative ages
at longer levels
NUMBER Small groups,
preferably between 10
& 20
Any size group, 50 to
100 most efficient
WEIGHER
/RECORDER
Mothers guided by
worker
Trained worker
WEIGHT CARD Simple, emphasis
growth
Precise, nutritional
status
COMPARISON OF GROWTH MONITORING AND
NUTRITIONAL SURVEILLANCE
ww
w.d
rjayesh
pa
tida
r.blo
gsp
ot.in
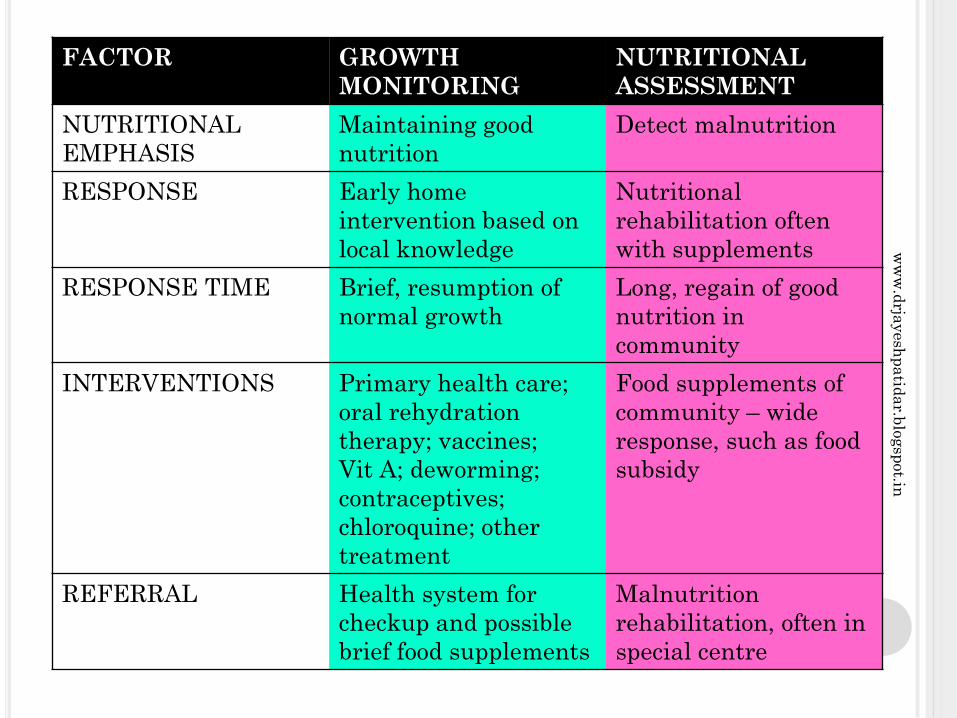
FACTOR GROWTH
MONITORING
NUTRITIONAL
ASSESSMENT
NUTRITIONAL
EMPHASIS
Maintaining good
nutrition
Detect malnutrition
RESPONSE Early home
intervention based on
local knowledge
Nutritional
rehabilitation often
with supplements
RESPONSE TIME Brief, resumption of
normal growth
Long, regain of good
nutrition in
community
INTERVENTIONS Primary health care;
oral rehydration
therapy; vaccines;
Vit A; deworming;
contraceptives;
chloroquine; other
treatment
Food supplements of
community – wide
response, such as food
subsidy
REFERRAL Health system for
checkup and possible
brief food supplements
Malnutrition
rehabilitation, often in
special centre
ww
w.d
rjayesh
pa
tida
r.blo
gsp
ot.in

NUTRITIONAL INDICATORS
MATERNAL
NUTRITION
INFANT &
PRESCHOOL
CHILDREN
SCHOOL
CHILD
NUTRITION
Birth weight
Height for age and
weight for height at
7yrs or school admission
clinical signs
Proportion being breastfed and
proportion on weaning foods, by age
in months, mortality rates in children
aged 1,2,3&4yrs with emphasis on
2yr olds
If age known – height for age, weight
for age
If age unknown – weight for height,
arm circumference, clinical signs and
syndromes
ww
w.d
rjayesh
pa
tida
r.blo
gsp
ot.in

SOCIAL ASPECTS OF NUTRITION
1) INTRODUCTION – Malnutrition a global and
serious social problem of international concern
2) PROBLEM OF MALNUTRITION –
Pathological state due to relative or absolute
deficiency or excess of one or more essential
nutrients
a) Under nutrition
b) Over nutrition
c) Imbalance
d) Specific deficiency
ww
w.d
rjayesh
pa
tida
r.blo
gsp
ot.in
FAO :- 15% are malnourished, majority in SE Asia
(300 million), mainly children < 5 and pregnant
women.
Malnutrition has direct and indirect effects on
community (Diseases & retarded mental /
physical growth)
Therefore ↑ morbidity & mortality, ↓ vitality &
productivity
Health hazards of over nutrition are equally bad
and harmful e.g. IHD, Diabetes, High BP etc.
ww
w.d
rjayesh
pa
tida
r.blo
gsp
ot.in
ECOLOGY OF MALNUTRITION
1) INTRODUCTION – Man-made disease. “Begins
in womb and ends in grave” BD Jelliffe(1966)
WHO monograph No. 29 is a masterpiece on
this subject. Various ecological factors
responsible are :-
a) Conditioning influences
b) Cultural influences
c) Socio-economic factors
d) Food production
e) Health and other services
ww
w.d
rjayesh
pa
tida
r.blo
gsp
ot.in
a) CONDITIONING INFLUENCES – Infectious
diseases (children) – Diarrhoea, Intestinal
parasites, Measles, Whooping cough, Malaria &
TB (vicious cycle ). Further complicated by bad
environmental sanitation/ health
b) CULTURAL INFLUENCES –
i. Choose poor diets
ii. Food habits, customs, beliefs, traditions and
attitudes – Family plays important role, effects
passed on for generations. Staple diet fads,
hot/cold-light/heavy foods, forbidden foods
iii. Religion
iv. Cooking practices
v. Child rearing – breast feeding, top feed, products
vi. Miscellaneous – Men first, alcoholism etc
ww
w.d
rjayesh
pa
tida
r.blo
gsp
ot.in

c) SOCIO-ECONOMIC FACTORS – Poverty
ignorance, illiteracy, lack of knowledge,
overpopulation “very nature and culture and
structure of society”
d) FOOD PRODUCTION – Uneven, ↓ technologies,
↓ facilities for 4M’s, weather, ?distribution.
e) HEALTH & OTHER SERVICES
i. Surveillance
ii. Nutritional rehabilitation
iii. Nutrition supplementation
iv. Health education
ww
w.d
rjayesh
pa
tida
r.blo
gsp
ot.in

PREVENTIVE AND SOCIAL MEASURES
1) INTRODUCTIOIN – Outcome of many factors, therefore action at different levels i.e. family, community, national & international. Coordinated action by many :- nutrition food, health, education, transport, agriculture, marketing, planning, deliver etc
2) FAMILY LEVEL -
a) Nutrition education
b) Housewife as manager
c) × taboos and fads
d) Breast feed
e) Baby foods
f) Vulnerable groups care
g) Kitchen garden / poultry
h) Locally available/ acceptable food
i) FP, ANC, child health and immunization services
j) Role of HWS
ww
w.d
rjayesh
pa
tida
r.blo
gsp
ot.in

3) COMMUNITY LEVEL
a) Survey
b) Risk approach
c) Feeding and nutritional programmes
d) ↑ production
e) ICDS
f) RH Mission
g) ↑ sanitation
h) ↓ infectious disease
i) ↑ SE Conditions
4) NATIONAL LEVEL
a) Rural development
b) ↑ agricultural production
c) Stabilize population
d) Nutrition intervention programmes
e) Health programmes
f) Seek help FAO/WHO/ UNICEF
ww
w.d
rjayesh
pa
tida
r.blo
gsp
ot.in
5) INTERNATIONAL LEVEL
a) World Food Programme
b) International agencies :- WHO/ FAO/ ILO/
World Bank/ UNICEF/ UNDP/ CARE
6) FOOD SURVEILLANCE :- Food, Milk, Meat,
Fish, Eggs hygiene, PFA Act 1954
CONCLUSION
?CORRUPTION ? MALPRACTICES ?↓ CHARACTER
Can we forget them ? Cure?
THANX
ww
w.d
rjayesh
pa
tida
r.blo
gsp
ot.in